


Dynamic Evolution of NLR Genes in Dalbergioids

 , , , , and
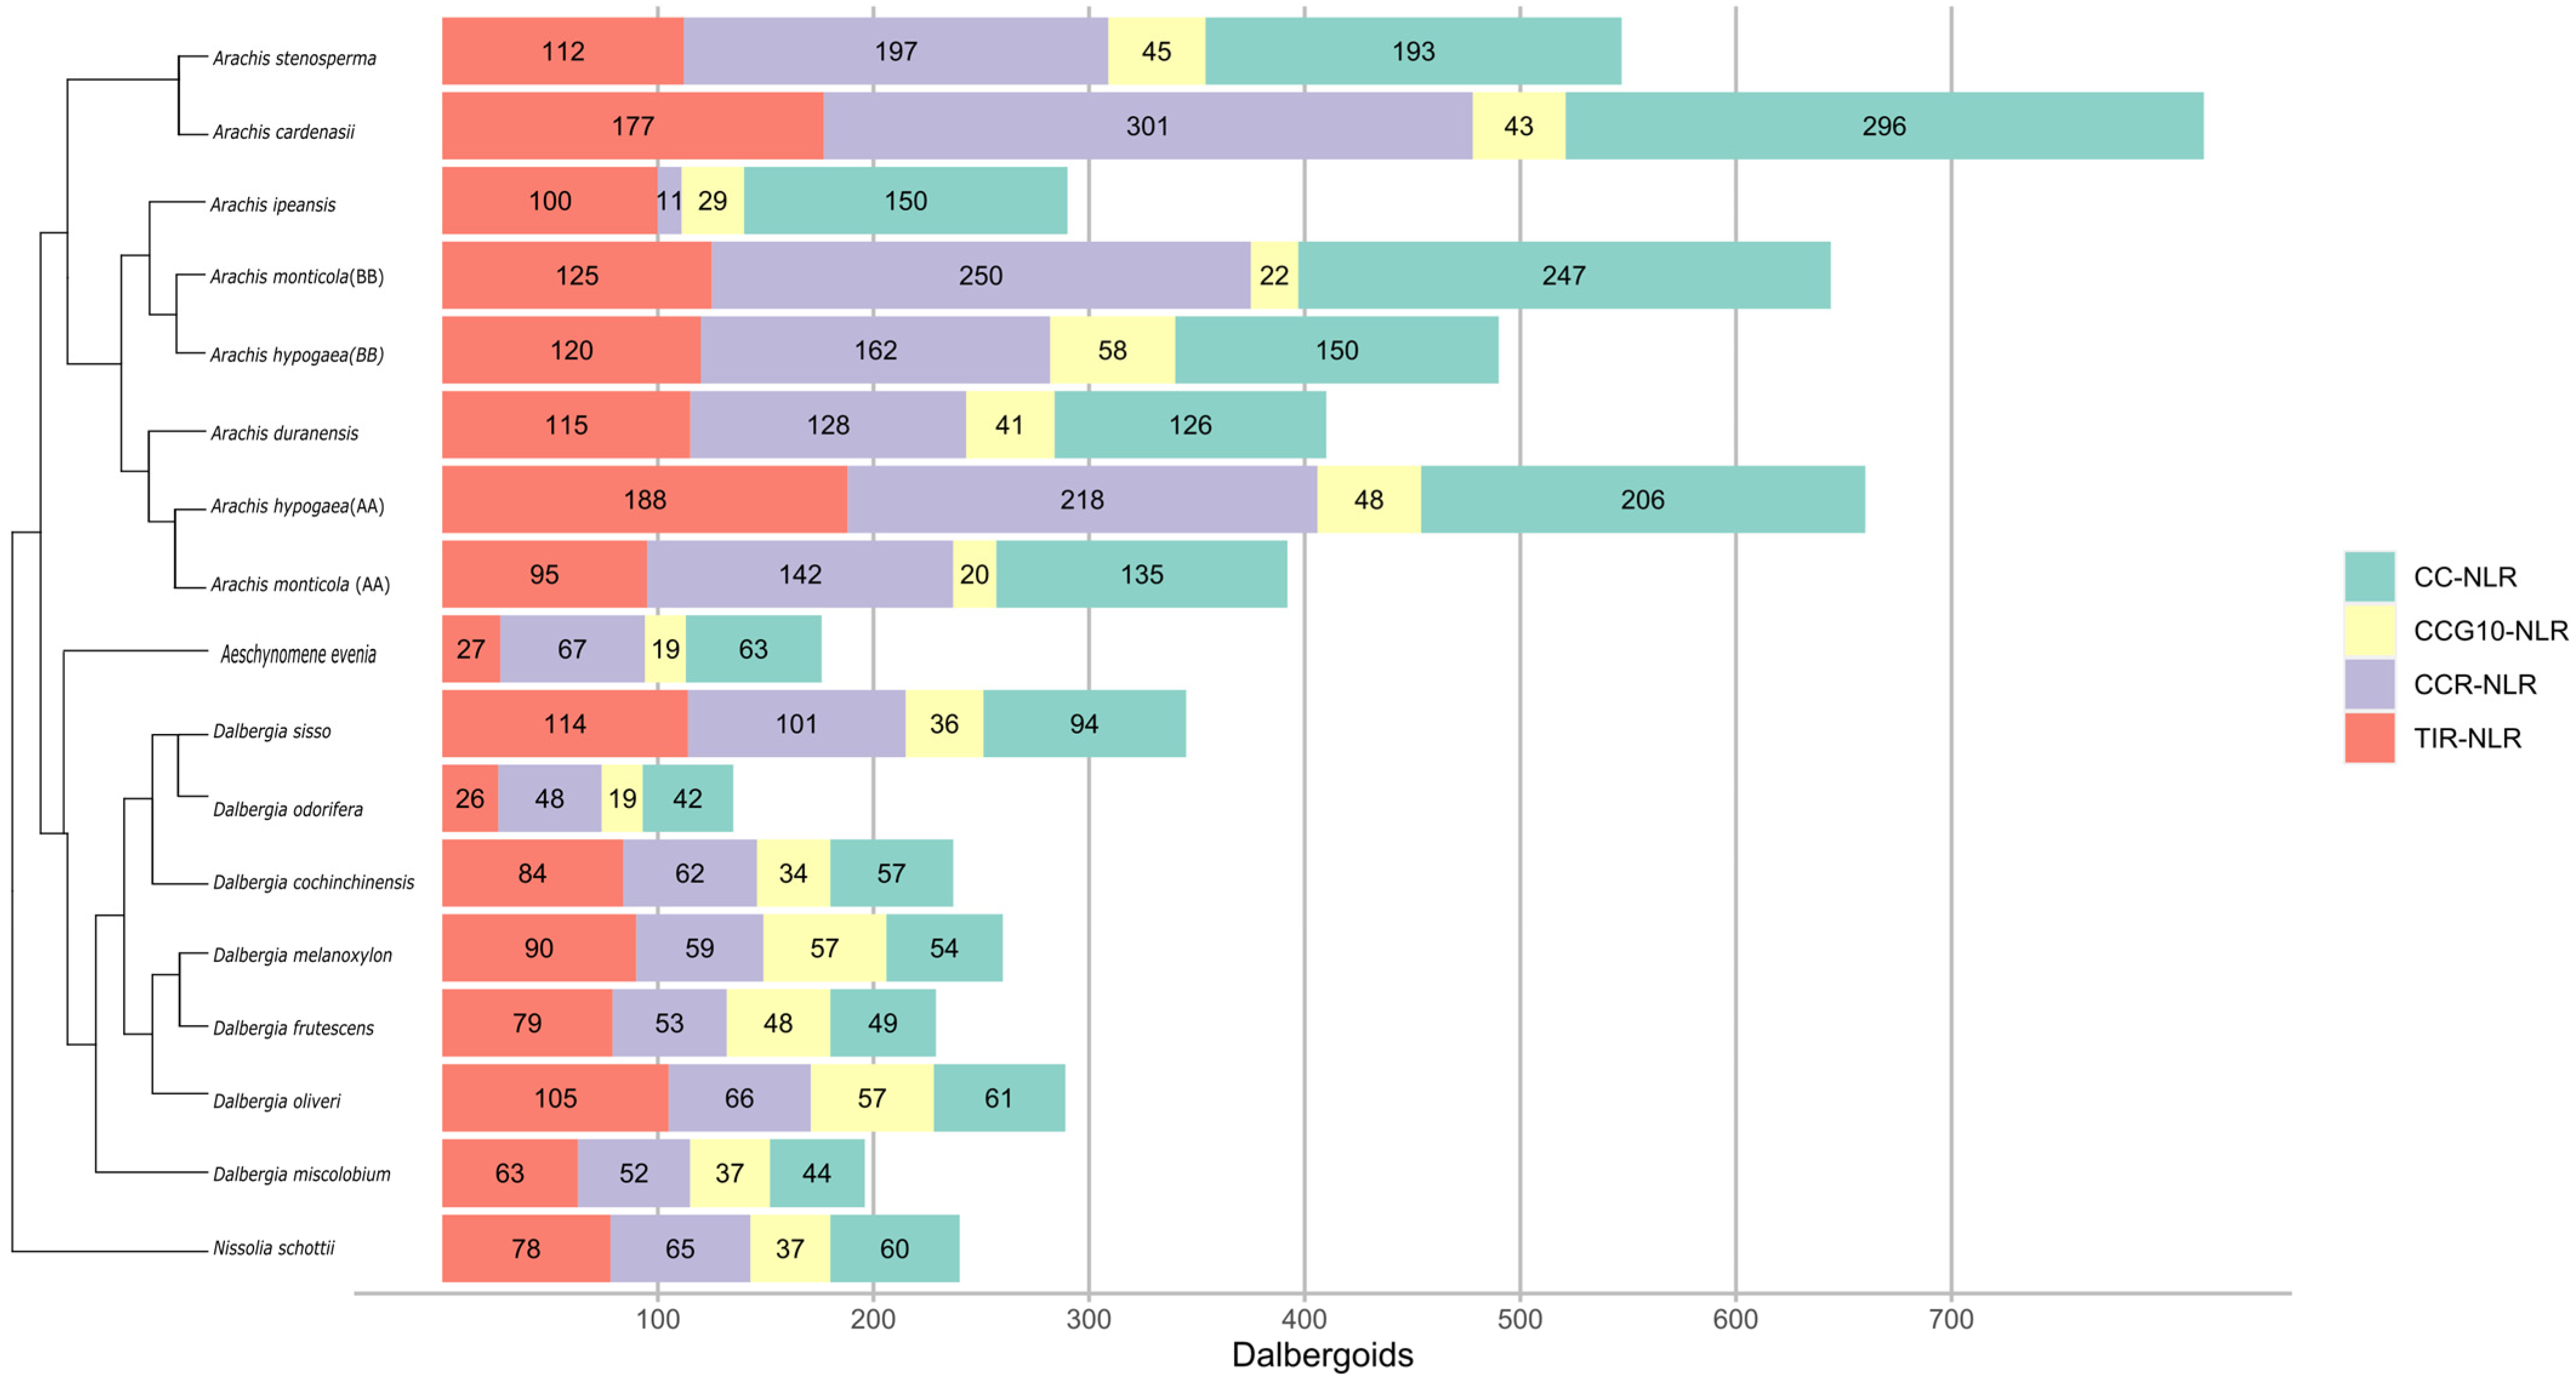
Abstract
1. Introduction
2. Materials and Methods
2.1. Mining of NLR Genes in Arachis Species
2.2. Clusterization and Phylogenetic Analysis
2.3. Chromosomal Localization and Construction of a Syntenic R-Gene Maps
2.4. Evolutionary Analysis of NLRs
2.5. RNA-Seq Based Expression Analysis
3. Results
3.1. Gene Mining of NLR Genes in Dalbergioids Species
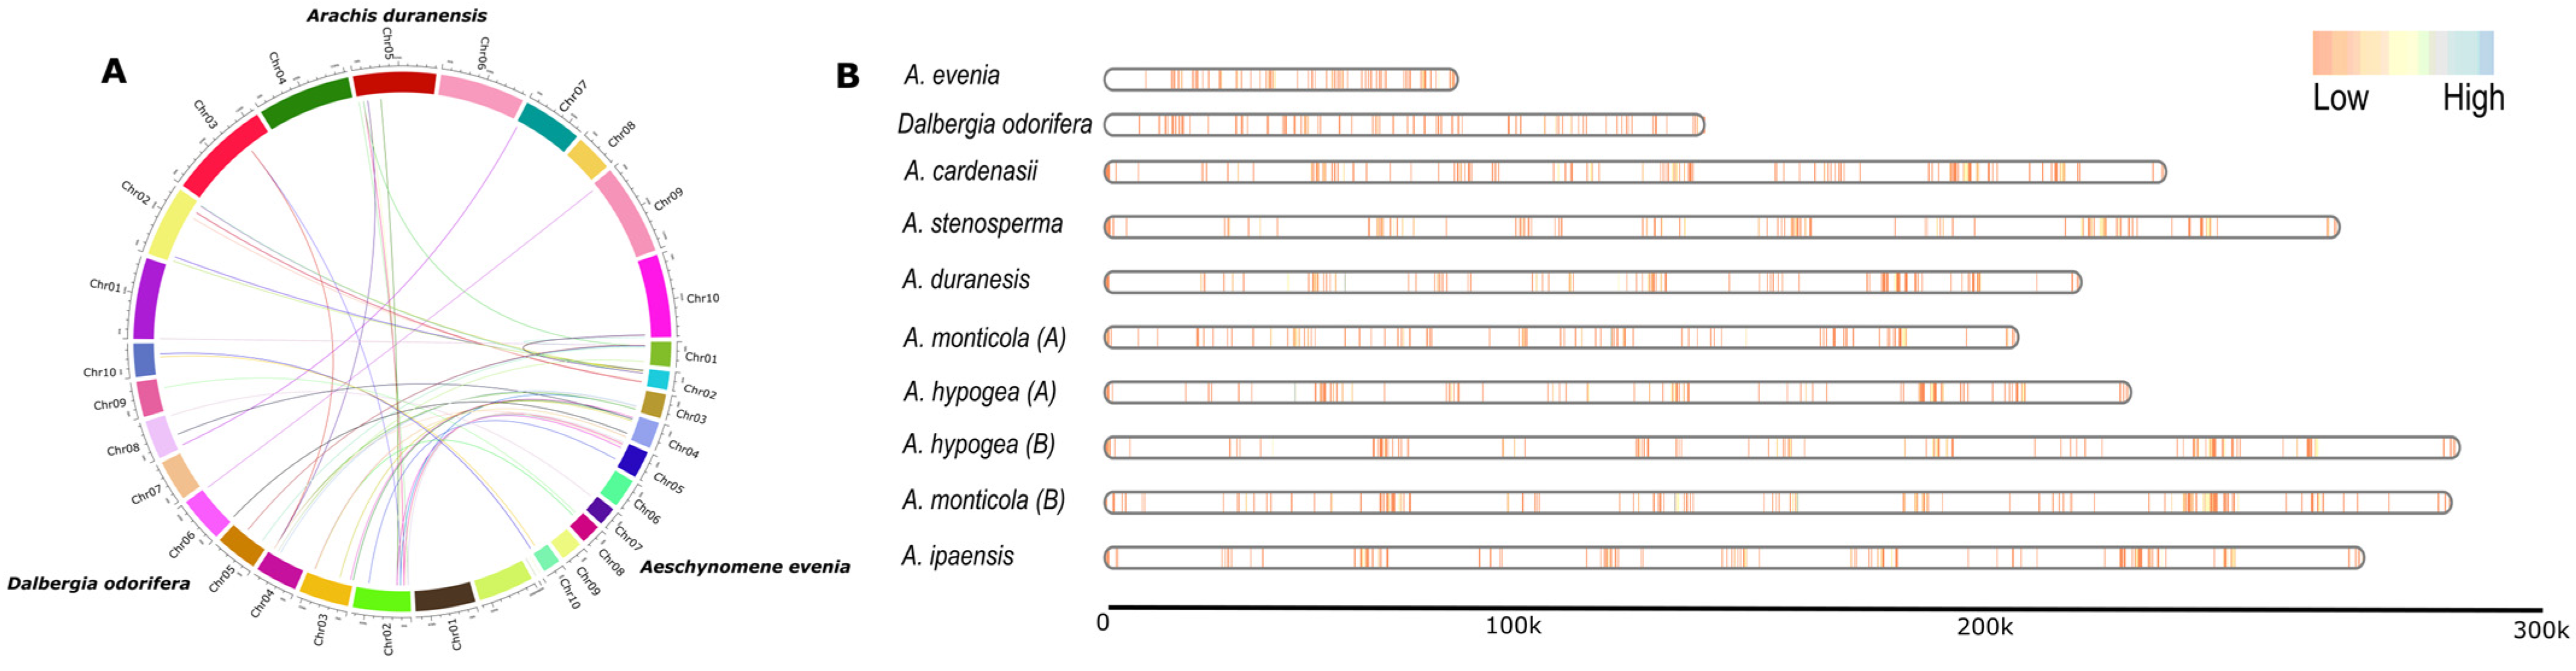
3.2. Genomic Localization of NLRs among Dalbergioids
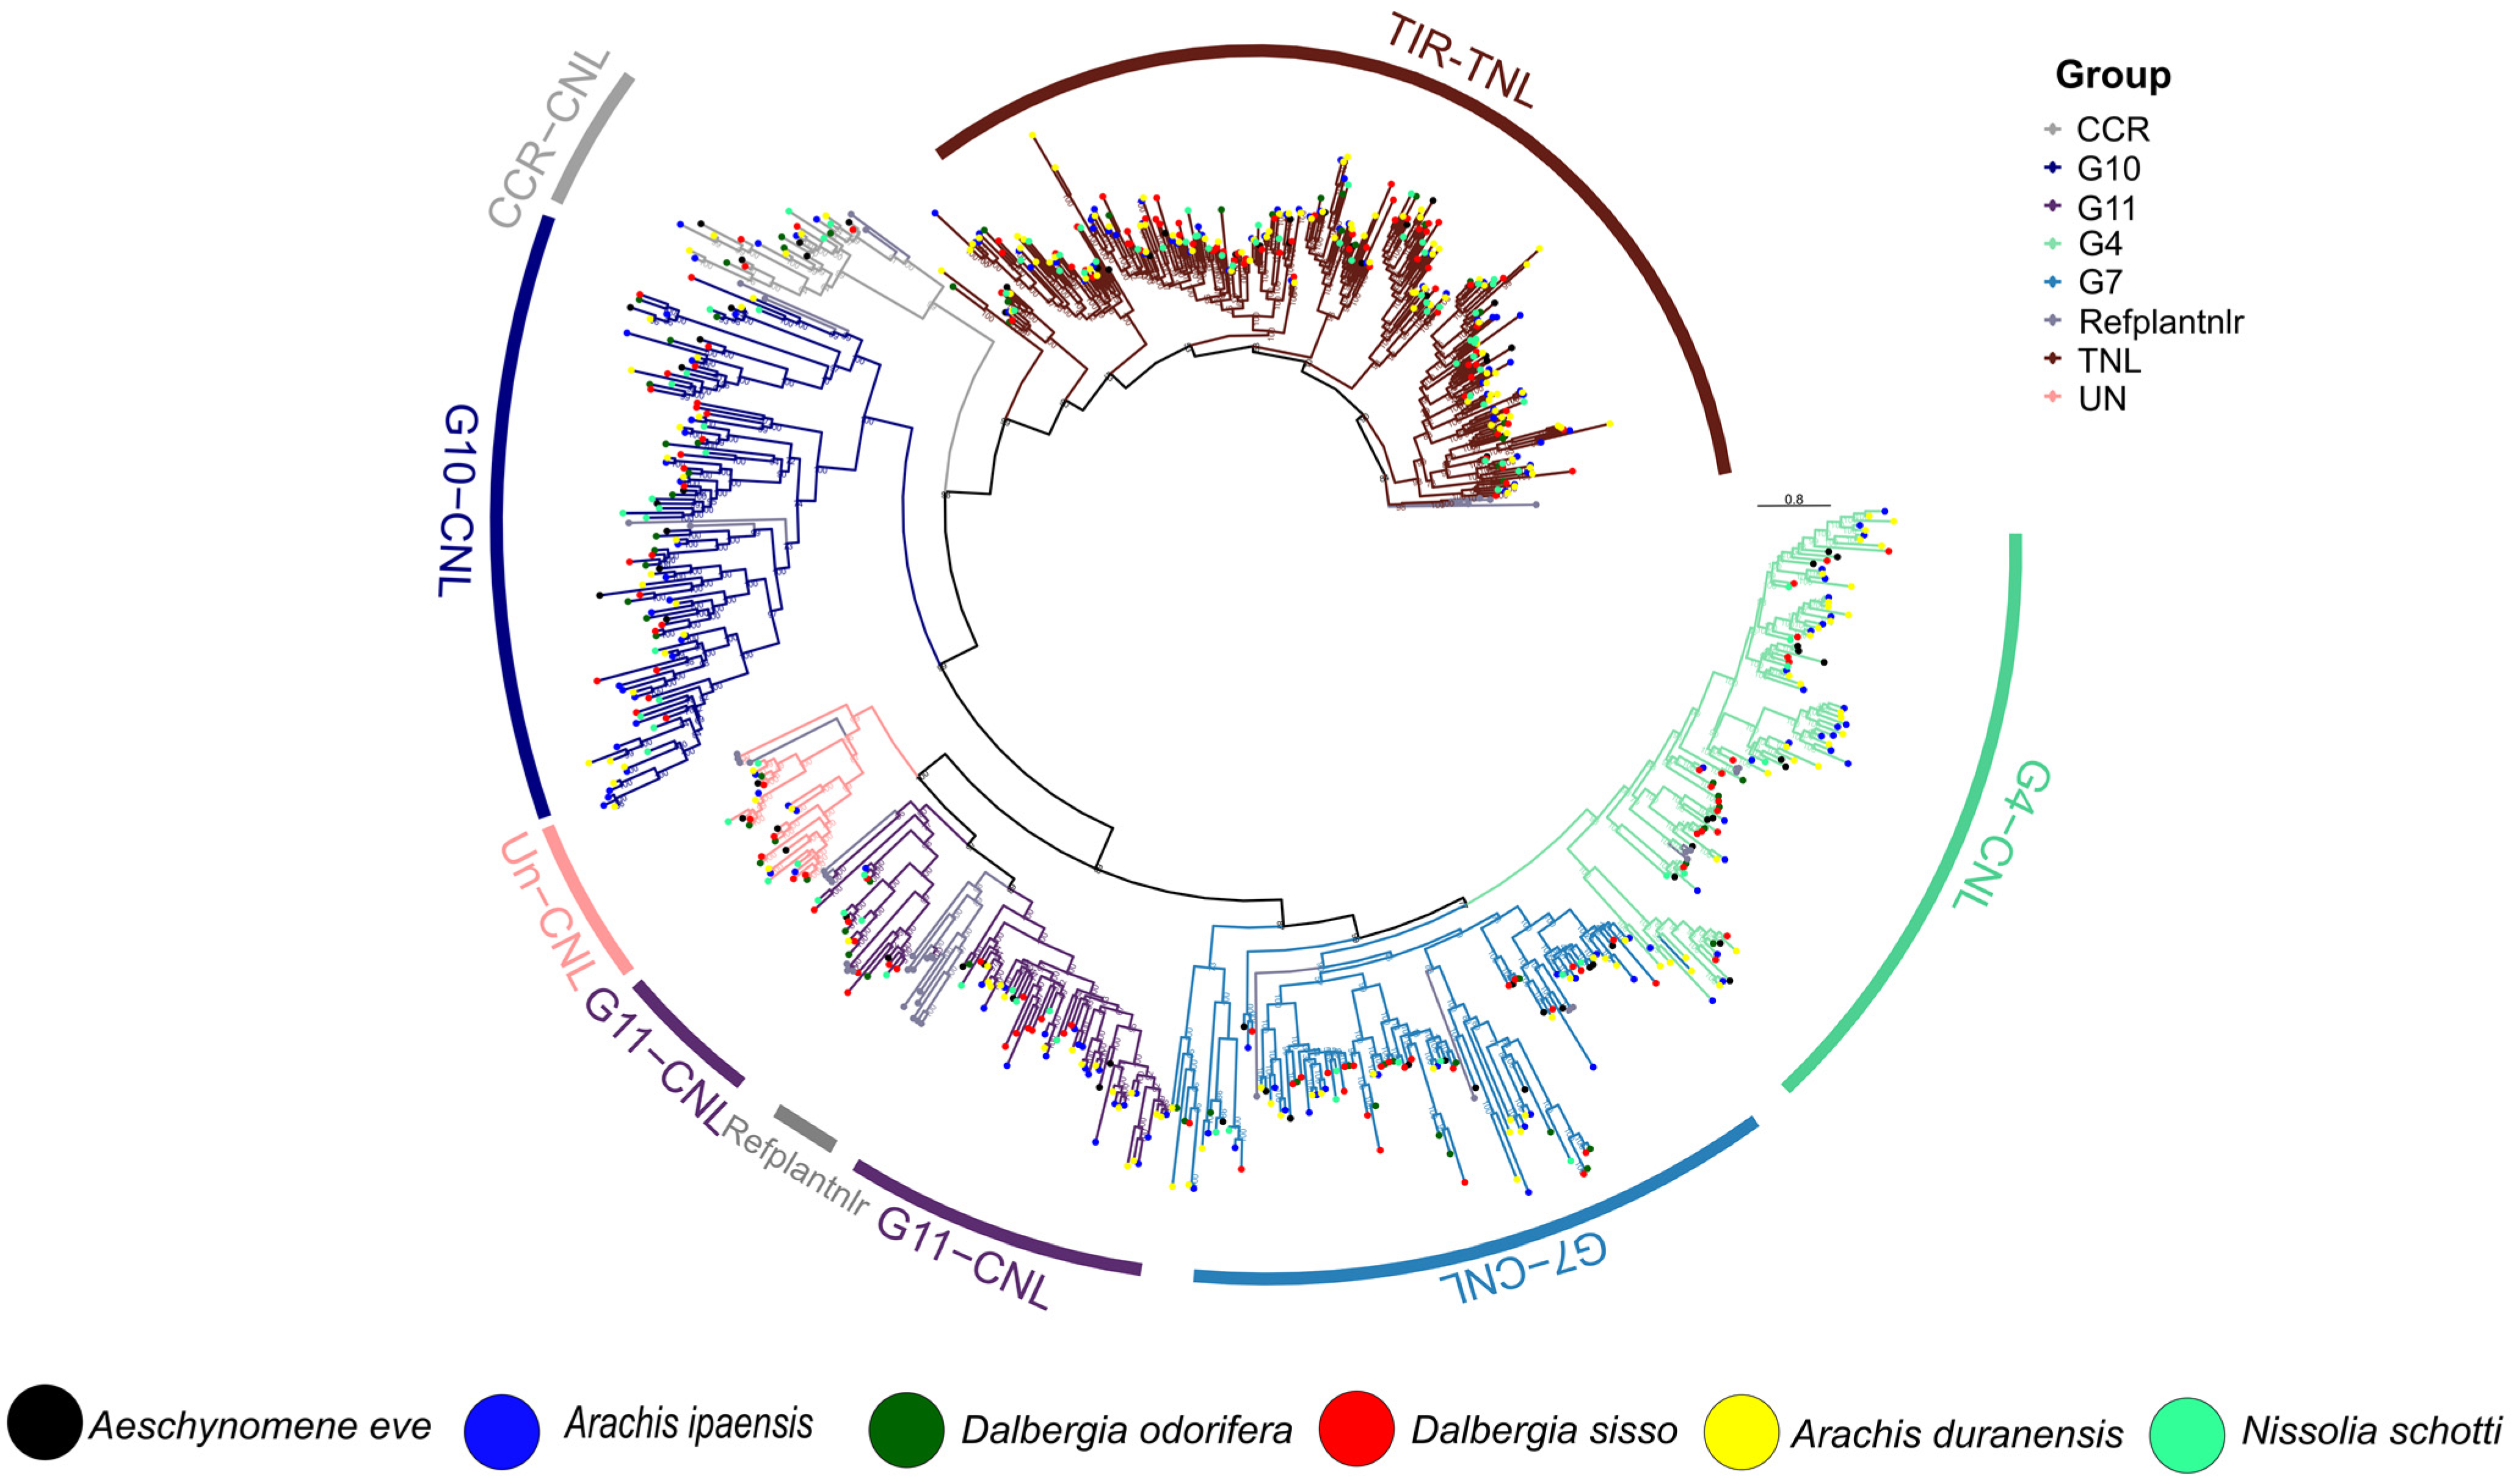
3.3. Phylogenetic Distribution
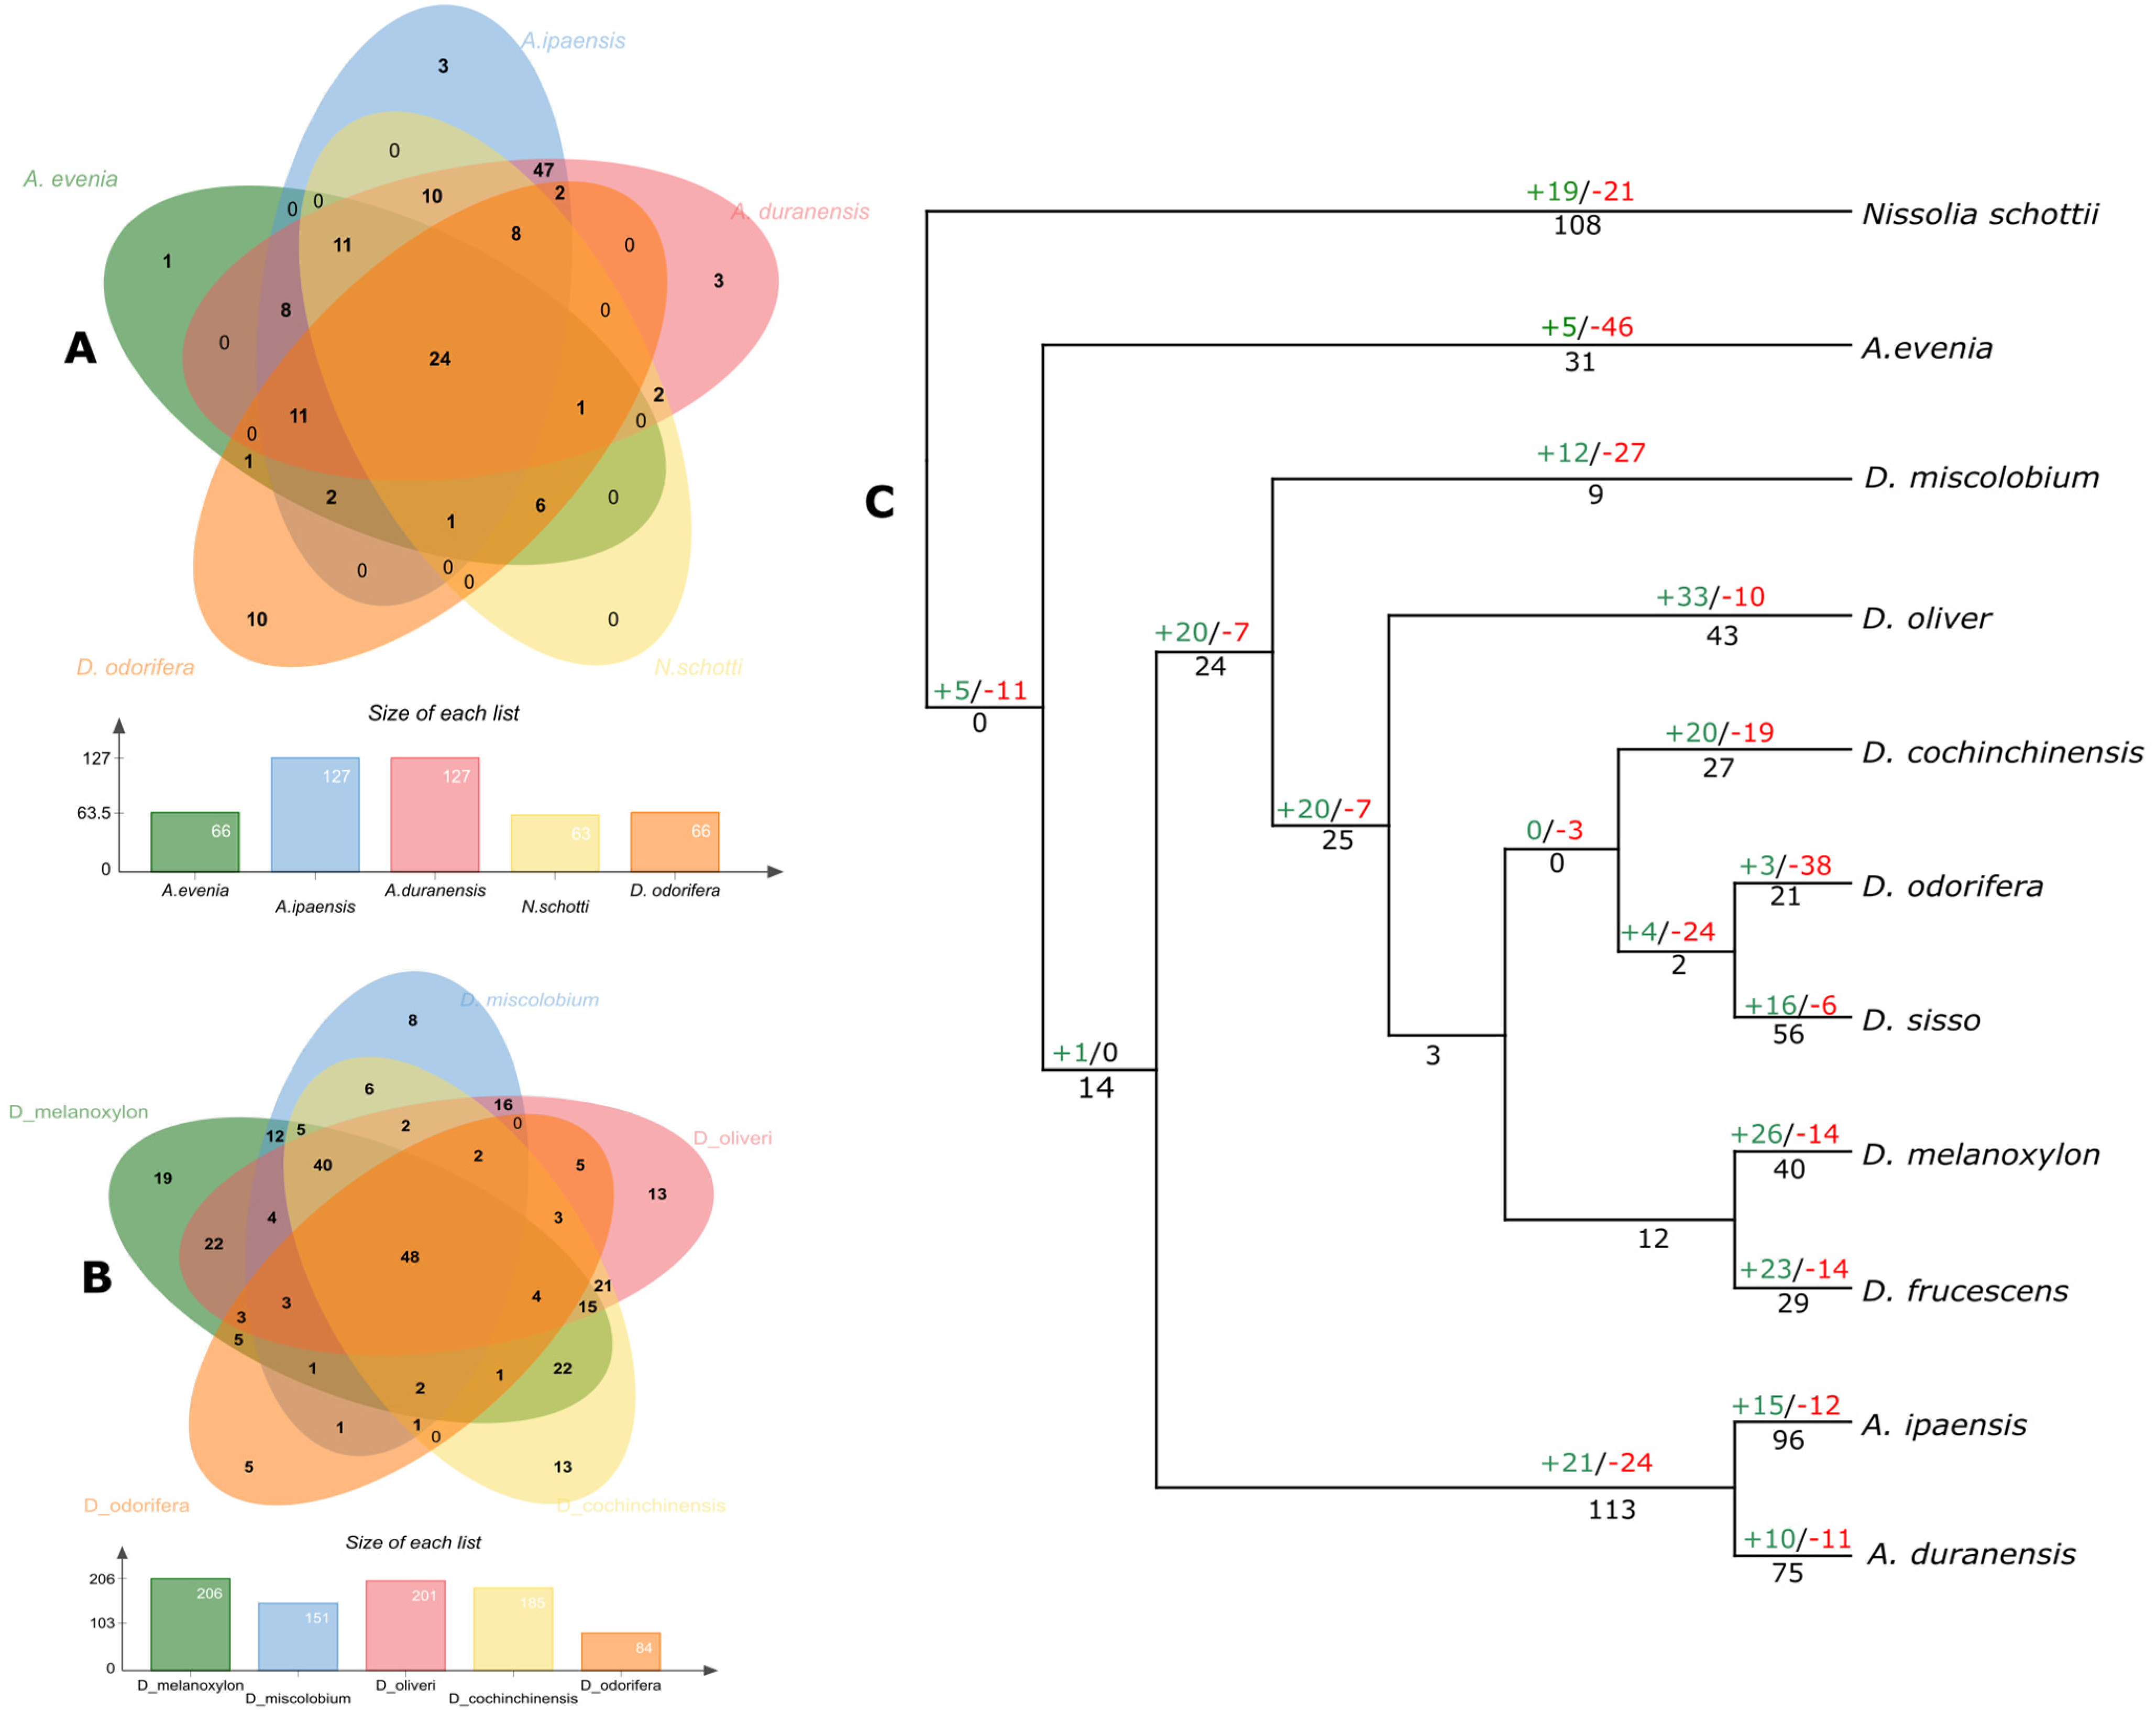
3.4. The Birth and Death of NLR Genes in Dalbergioids
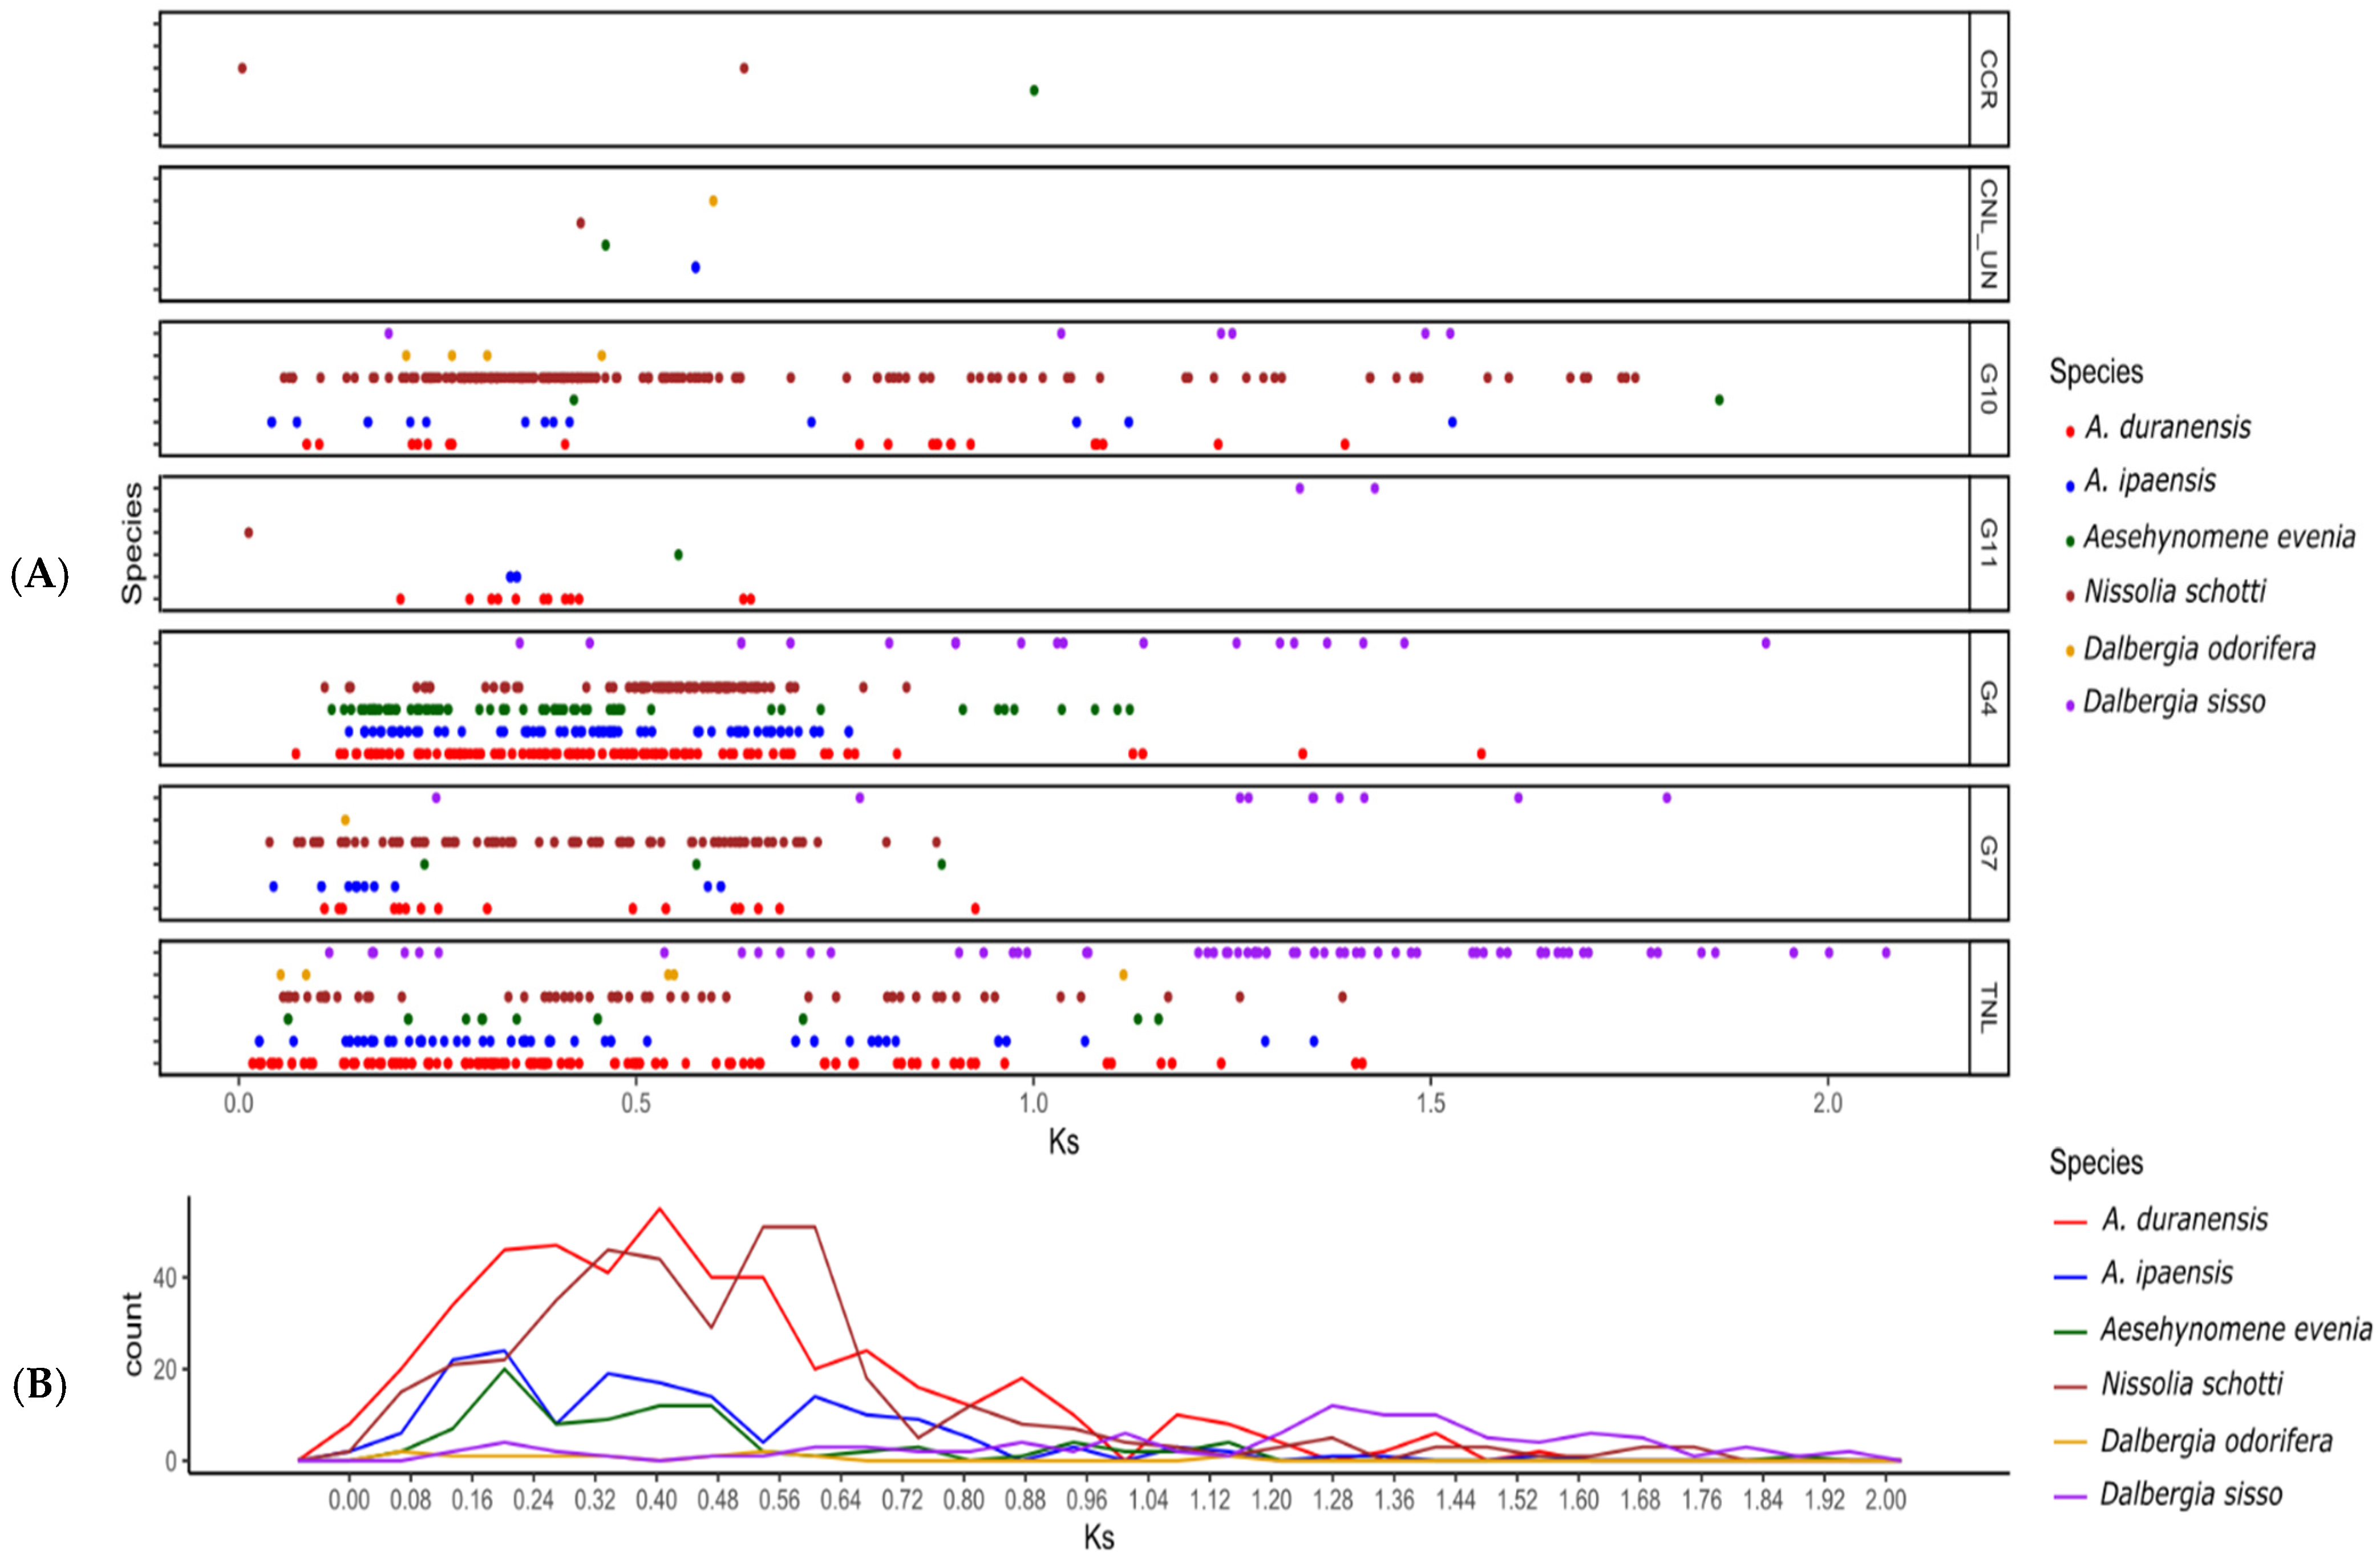
3.5. Duplication History among Dalbergioids NLRs
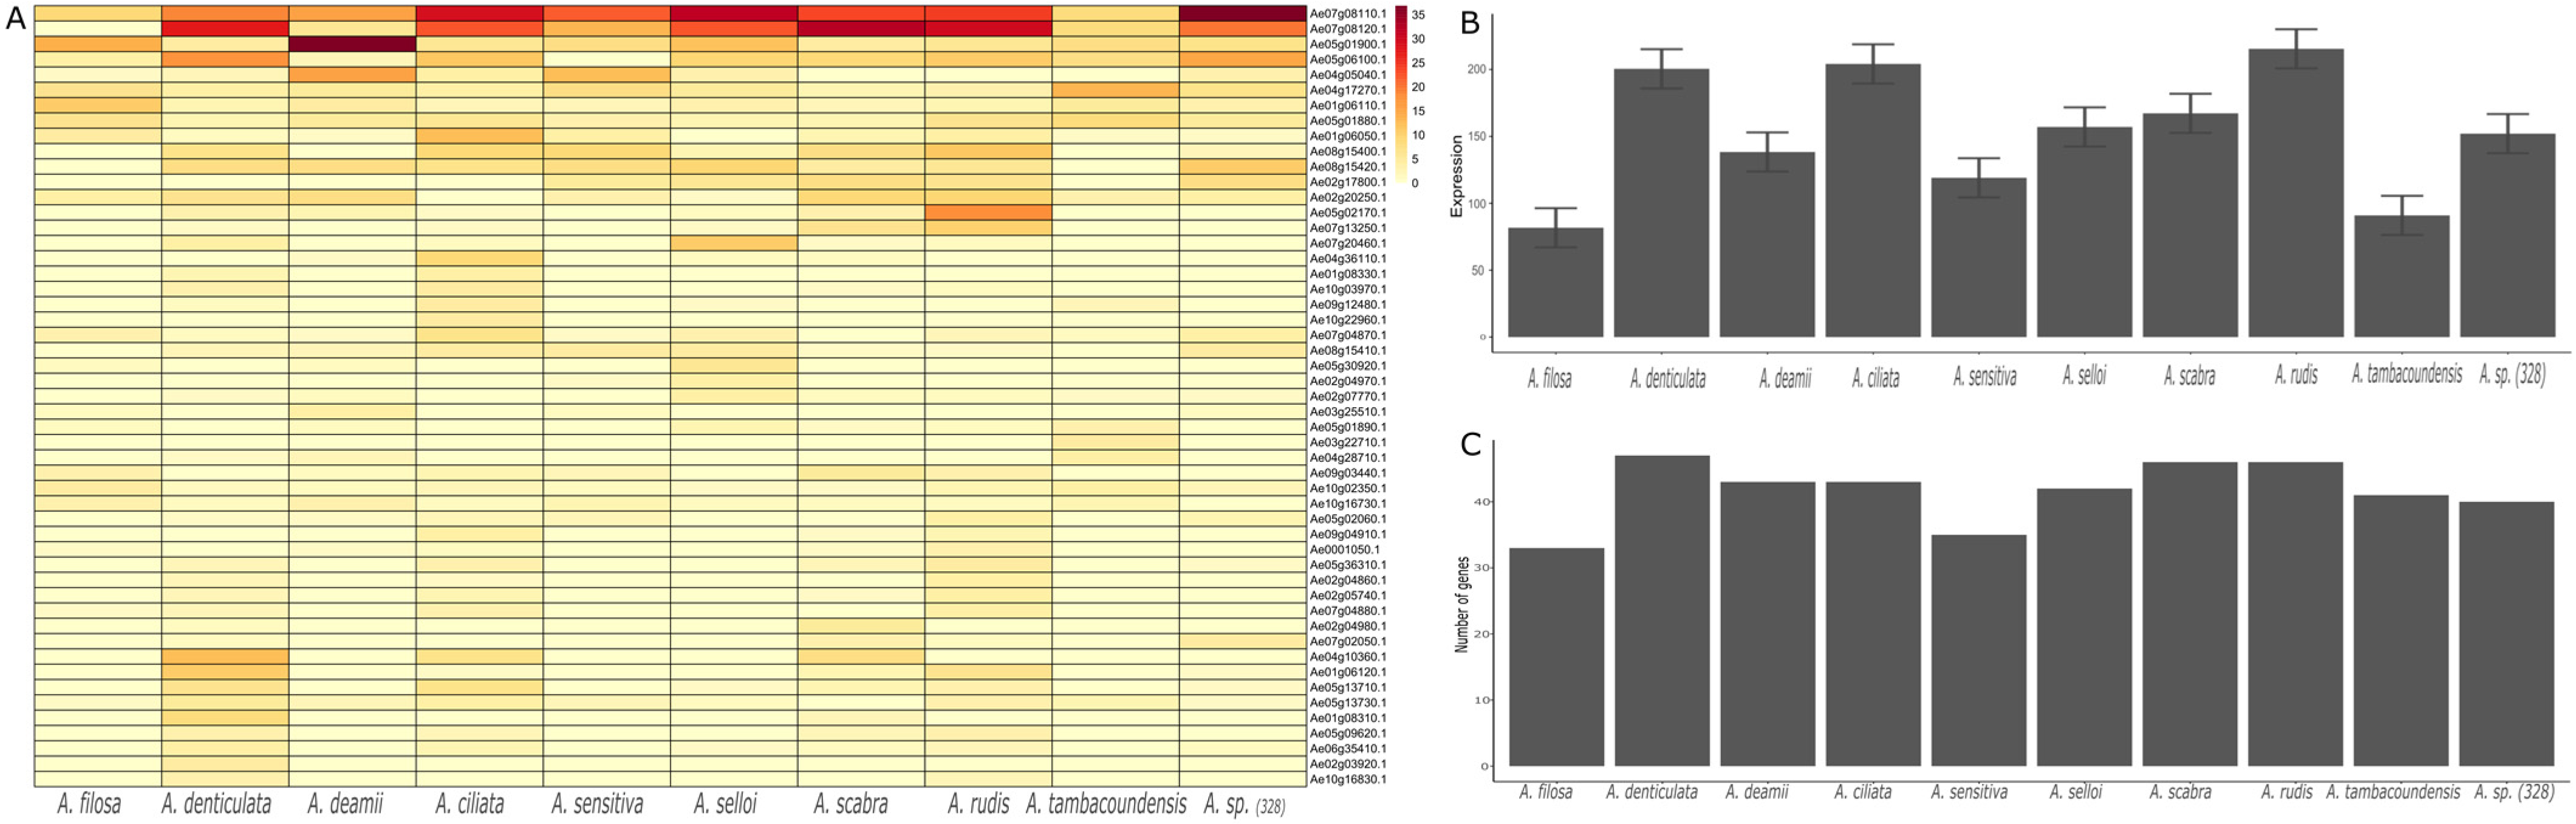
3.6. Expression in NLR Genes in Dalbergioids
4. Discussion
Supplementary Materials
Author Contributions
Funding
Informed Consent Statement
Data Availability Statement
Conflicts of Interest
References
- Lavin, M.; Pennington, R.T.; Klitgaard, B.B.; Sprent, J.I.; De Lima, H.C.; Gasson, P.E. The Dalbergioid Legumes (Fabaceae): Delimitation of a Pantropical Monophyletic Clade. Am. J. Bot. 2001, 88, 503–533. [Google Scholar] [CrossRef]
- Moraes, A.P.; Vatanparast, M.; Polido, C.; Marques, A.; Souza, G.; Fortuna-Perez, A.P.; Forni-Martins, E.R. Chromosome Number Evolution in Dalbergioid Legumes (Papilionoideae, Leguminosae). Rev. Bras. Bot. 2020, 43, 575–587. [Google Scholar] [CrossRef]
- Yin, D.; Ji, C.; Ma, X.; Li, H.; Zhang, W.; Li, S.; Liu, F.; Zhao, K.; Li, F.; Li, K.; et al. Genome of an Allotetraploid Wild Peanut Arachis monticola: A de Novo Assembly. Gigascience 2018, 7, giy066. [Google Scholar] [CrossRef] [PubMed]
- Yin, D.; Ji, C.; Song, Q.; Zhang, W.; Zhang, X.; Zhao, K.; Chen, C.Y.; Wang, C.; He, G.; Liang, Z.; et al. Comparison of Arachis monticola with Diploid and Cultivated Tetraploid Genomes Reveals Asymmetric Subgenome Evolution and Improvement of Peanut. Adv. Sci. 2020, 7, 1901672. [Google Scholar] [CrossRef]
- Bertioli, D.J.; Cannon, S.B.; Froenicke, L.; Huang, G.; Farmer, A.D.; Cannon, E.K.S.; Liu, X.; Gao, D.; Clevenger, J.; Dash, S.; et al. The Genome Sequences of Arachis duranensis and Arachis ipaensis, the Diploid Ancestors of Cultivated Peanut. Nat. Genet. 2016, 48, 438–446. [Google Scholar] [CrossRef] [PubMed]
- Saha, S.; Shilpi, J.A.; Mondal, H.; Hossain, F.; Anisuzzman, M.; Hasan, M.M.; Cordell, G.A. Ethnomedicinal, Phytochemical, and Pharmacological Profile of the Genus Dalbergia L. (Fabaceae). Phytopharmacology 2013, 2013, 291–346. [Google Scholar]
- Bajwa, R.; Javaid, A. Integrated Disease Management to Control Shisham (Dalbergia sissoo Roxb.) Decline in Pakistan. Pakistan J. Bot. 2007, 39, 2651–2656. [Google Scholar]
- Shah, K.K.; Tiwari, I.; Modi, B.; Pandey, H.P.; Subedi, S.; Shrestha, J. Shisham (Dalbergia sissoo) Decline by Dieback Disease, Root Pathogens and Their Management: A Review. J. Agric. Nat. Resour. 2021, 4, 255–272. [Google Scholar] [CrossRef]
- Kahraman, A.; Pandey, A.; Khan, M.K.; Lindsay, D.; Moenga, S.; Vance, L.; Bergmann, E.; Carrasquilla-Garcia, N.; Shin, M.G.; Chang, P.L.; et al. Distinct Subgroups of Cicer Echinospermum Are Associated with Hybrid Sterility and Breakdown in Interspecific Crosses with Cultivated Chickpea. Crop Sci. 2017, 57, 3101–3111. [Google Scholar] [CrossRef]
- Calle García, J.; Guadagno, A.; Paytuvi-Gallart, A.; Saera-Vila, A.; Amoroso, C.G.; D’esposito, D.; Andolfo, G.; Aiese Cigliano, R.; Sanseverino, W.; Ercolano, M.R.; et al. PRGdb 4.0: An Updated Database Dedicated to Genes Involved in Plant Disease Resistance Process. Nucleic Acids Res. 2022, 50, D1483–D1490. [Google Scholar] [CrossRef]
- Kourelis, J.; Sakai, T.; Adachi, H.; Kamoun, S. RefPlantNLR Is a Comprehensive Collection of Experimentally Validated Plant Disease Resistance Proteins from the NLR Family. PLoS Biol. 2021, 19, e3001124. [Google Scholar] [CrossRef] [PubMed]
- Hung, T.H.; So, T.; Sreng, S.; Thammavong, B.; Boounithiphonh, C.; Boshier, D.H.; MacKay, J.J. Reference Transcriptomes and Comparative Analyses of Six Species in the Threatened Rosewood Genus Dalbergia. Sci. Rep. 2020, 10, 17749. [Google Scholar] [CrossRef] [PubMed]
- Stanke, M.; Diekhans, M.; Baertsch, R.; Haussler, D. Using Native and Syntenically Mapped CDNA Alignments to Improve de Novo Gene Finding. Bioinformatics 2008, 24, 637–644. [Google Scholar] [CrossRef]
- Jones, P.; Binns, D.; Chang, H.Y.; Fraser, M.; Li, W.; McAnulla, C.; McWilliam, H.; Maslen, J.; Mitchell, A.; Nuka, G.; et al. InterProScan 5: Genome-Scale Protein Function Classification. Bioinformatics 2014, 30, 1236–1240. [Google Scholar] [CrossRef] [PubMed]
- Jupe, F.; Pritchard, L.; Etherington, G.J.; MacKenzie, K.; Cock, P.J.A.; Wright, F.; Sharma, S.K.; Bolser, D.; Bryan, G.J.; Jones, J.D.G.; et al. Identification and Localisation of the NB-LRR Gene Family within the Potato Genome. BMC Genom. 2012, 13, 75. [Google Scholar] [CrossRef] [PubMed]
- Edgar, R.C. Search and Clustering Orders of Magnitude Faster than BLAST. Bioinformatics 2010, 26, 2460–2461. [Google Scholar] [CrossRef] [PubMed]
- Seo, E.; Kim, S.; Yeom, S.I.; Choi, D. Genome-Wide Comparative Analyses Reveal the Dynamic Evolution of Nucleotide-Binding Leucine-Rich Repeat Gene Family among Solanaceae Plants. Front. Plant Sci. 2016, 7, 1205. [Google Scholar] [CrossRef]
- Nguyen, L.T.; Schmidt, H.A.; Von Haeseler, A.; Minh, B.Q. IQ-TREE: A Fast and Effective Stochastic Algorithm for Estimating Maximum-Likelihood Phylogenies. Mol. Biol. Evol. 2015, 32, 268–274. [Google Scholar] [CrossRef]
- Quinlan, A.R.; Hall, I.M. BEDTools: A Flexible Suite of Utilities for Comparing Genomic Features. Bioinformatics 2010, 26, 841–842. [Google Scholar] [CrossRef]
- Hao, Z.; Lv, D.; Ge, Y.; Shi, J.; Weijers, D.; Yu, G.; Chen, J. RIdeogram: Drawing SVG Graphics to Visualize and Map Genome-Wide Data on the Idiograms. PeerJ Comput. Sci. 2020, 6, e251. [Google Scholar] [CrossRef]
- Gu, Z.; Gu, L.; Eils, R.; Schlesner, M.; Brors, B. Circlize Implements and Enhances Circular Visualization in R. Bioinformatics 2014, 30, 2811–2812. [Google Scholar] [CrossRef] [PubMed]
- Li, K.-B. ClustalW-MPI: ClustalW analysis using distributed and parallel computing. Bioinformatics 2003, 19, 1585–1586. [Google Scholar] [CrossRef] [PubMed]
- Suyama, M.; Torrents, D.; Bork, P. PAL2NAL: Robust Conversion of Protein Sequence Alignments into the Corresponding Codon Alignments. Nucleic Acids Res. 2006, 34, W609–W612. [Google Scholar] [CrossRef] [PubMed]
- Zhang, Z. KaKs_calculator 3.0: Calculating Selective Pressure on Coding and Non-Coding Sequences. Genom. Proteom. Bioinform. 2022, 20, 536–540. [Google Scholar] [CrossRef]
- Xu, L.; Dong, Z.; Fang, L.; Luo, Y.; Wei, Z.; Guo, H.; Zhang, G.; Gu, Y.Q.; Coleman-Derr, D.; Xia, Q.; et al. OrthoVenn2: A Web Server for Whole-Genome Comparison and Annotation of Orthologous Clusters across Multiple Species. Nucleic Acids Res. 2019, 47, W52–W58. [Google Scholar] [CrossRef]
- Emms, D.M.; Kelly, S. OrthoFinder: Phylogenetic Orthology Inference for Comparative Genomics. Genome Biol. 2019, 20, 238. [Google Scholar] [CrossRef]
- Bolker, B.M.; Claude, J.; Durand, B.; Dutheil, J.; Jobb, G.; Lemon, J.; Noel, Y.; Nylander, J.; Opgen-Rhein, R.; Paradis, E.; et al. Analyses of Phylogenetics and Evolution. Ph.D. Thesis, University of Winds, Windsor, ON, Canada, 2007; pp. 1–152. [Google Scholar]
- Mendes, F.K.; Vanderpool, D.; Fulton, B.; Hahn, M.W. CAFE 5 Models Variation in Evolutionary Rates among Gene Families. Bioinformatics 2020, 36, 5516–5518. [Google Scholar] [CrossRef]
- Pertea, M.; Kim, D.; Pertea, G.M.; Leek, J.T.; Salzberg, S.L. Transcript-Level Expression Analysis of RNA-Seq Experiments with HISAT, StringTie and Ballgown. Nat. Protoc. 2016, 11, 1650–1667. [Google Scholar] [CrossRef]
- Quilbé, J.; Lamy, L.; Brottier, L.; Leleux, P.; Fardoux, J.; Rivallan, R.; Benichou, T.; Guyonnet, R.; Becana, M.; Villar, I.; et al. Genetics of Nodulation in Aeschynomene evenia Uncovers Mechanisms of the Rhizobium–Legume Symbiosis. Nat. Commun. 2021, 12, 829. [Google Scholar] [CrossRef]
- Fu, L.; Niu, B.; Zhu, Z.; Wu, S.; Li, W. CD-HIT: Accelerated for Clustering the next-Generation Sequencing Data. Bioinformatics 2012, 28, 3150–3152. [Google Scholar] [CrossRef]
- Tariq, T.; Haider, Z.; Rani, S.; Serfraz, S. Evolution of NLR Genes in Cicer Species Revealed a Dynamic Expansion of the NLRome in C. echinospermum. 2022; unpublished article. [Google Scholar]
- Tariq, T.; Haider, Z.; Rani, S.; Serfraz, S. Evolution of NLR Genes in Genus Arachis Reveals Asymmetric Expansion of NLRome in Wild and Domesticated Tetraploid Species. 2022; unpublished article. [Google Scholar]
- Feng, S.; Xu, M.; Guo, H.; Liu, F.; Cui, C.; Zhao, T.; Zhou, B. Chromosome Duplication Causing Gene-Dosage-Based Effects on the Gene Expression Level in Gossypium Hirsutum-Gossypium Australe Addition Lines. Plant Direct 2020, 4, e00247. [Google Scholar] [CrossRef]
- Van de Peer, Y.; Ashman, T.L.; Soltis, P.S.; Soltis, D.E. Polyploidy: An Evolutionary and Ecological Force in Stressful Times. Plant Cell 2021, 33, 11–26. [Google Scholar] [CrossRef] [PubMed]
- Hong, Z.; Li, J.; Liu, X.; Lian, J.; Zhang, N.; Yang, Z.; Niu, Y.; Cui, Z.; Xu, D. The Chromosome-Level Draft Genome of Dalbergia odorifera. Gigascience 2020, 9, giaa084. [Google Scholar] [CrossRef] [PubMed]
- Liu, F.; Hong, Z.; Xu, D.; Jia, H.; Zhang, N.; Liu, X.; Yang, Z.; Lu, M. Genetic Diversity of the Endangered Dalbergia odorifera Revealed by SSR Markers. Forests 2019, 10, 225. [Google Scholar] [CrossRef]
- Leal-Bertioli, S.C.M.; Nascimento, E.F.M.B.; Chavarro, C.M.F.; Custódio, A.R.; Hopkins, M.S.; Moretzsohn, M.C.; Bertioli, D.J.; Araújo, A.C.G. Spontaneous Generation of Diversity in Arachis Neopolyploids (Arachis ipaënsis × Arachis duranensis)4× Replays the Early Stages of Peanut Evolution. G3 Genes Genomes Genet. 2021, 11, jkab289. [Google Scholar] [CrossRef]


Disclaimer/Publisher’s Note: The statements, opinions and data contained in all publications are solely those of the individual author(s) and contributor(s) and not of MDPI and/or the editor(s). MDPI and/or the editor(s) disclaim responsibility for any injury to people or property resulting from any ideas, methods, instructions or products referred to in the content. |
© 2023 by the authors. Licensee MDPI, Basel, Switzerland. This article is an open access article distributed under the terms and conditions of the Creative Commons Attribution (CC BY) license (https://creativecommons.org/licenses/by/4.0/).
Share and Cite
Rani, S.; Zahra, R.; Bakar, A.; Rizwan, M.; Sultan, A.-B.; Zain, M.; Mehmood, A.; Danial, M.; Shakoor, S.; Saleem, F.; et al. Dynamic Evolution of NLR Genes in Dalbergioids. Genes 2023, 14, 377. https://doi.org/10.3390/genes14020377
Rani S, Zahra R, Bakar A, Rizwan M, Sultan A-B, Zain M, Mehmood A, Danial M, Shakoor S, Saleem F, et al. Dynamic Evolution of NLR Genes in Dalbergioids. Genes. 2023; 14(2):377. https://doi.org/10.3390/genes14020377
Chicago/Turabian StyleRani, Shamiza, Ramlah Zahra, Abu Bakar, Muhammad Rizwan, Abu-Bakar Sultan, Muhammad Zain, Amna Mehmood, Muhammad Danial, Sidra Shakoor, Fozia Saleem, and et al. 2023. "Dynamic Evolution of NLR Genes in Dalbergioids" Genes 14, no. 2: 377. https://doi.org/10.3390/genes14020377
APA StyleRani, S., Zahra, R., Bakar, A., Rizwan, M., Sultan, A.-B., Zain, M., Mehmood, A., Danial, M., Shakoor, S., Saleem, F., Serfraz, A., Rehman, H. M., Khan, R. S. A., Serfraz, S., & AlKahtani, S. (2023). Dynamic Evolution of NLR Genes in Dalbergioids. Genes, 14(2), 377. https://doi.org/10.3390/genes14020377