

In Silico Mining and Characterization of High-Quality SNP/Indels in Some Agro-Economically Important Species Belonging to the Family Euphorbiaceae

 , , and
Abstract
1. Introduction
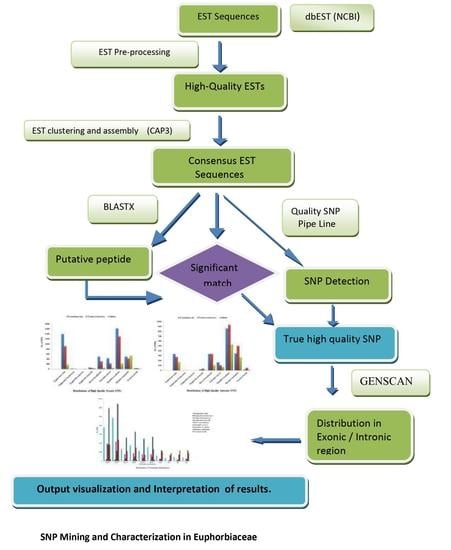
2. Materials and Methods
2.1. Data Retrieval
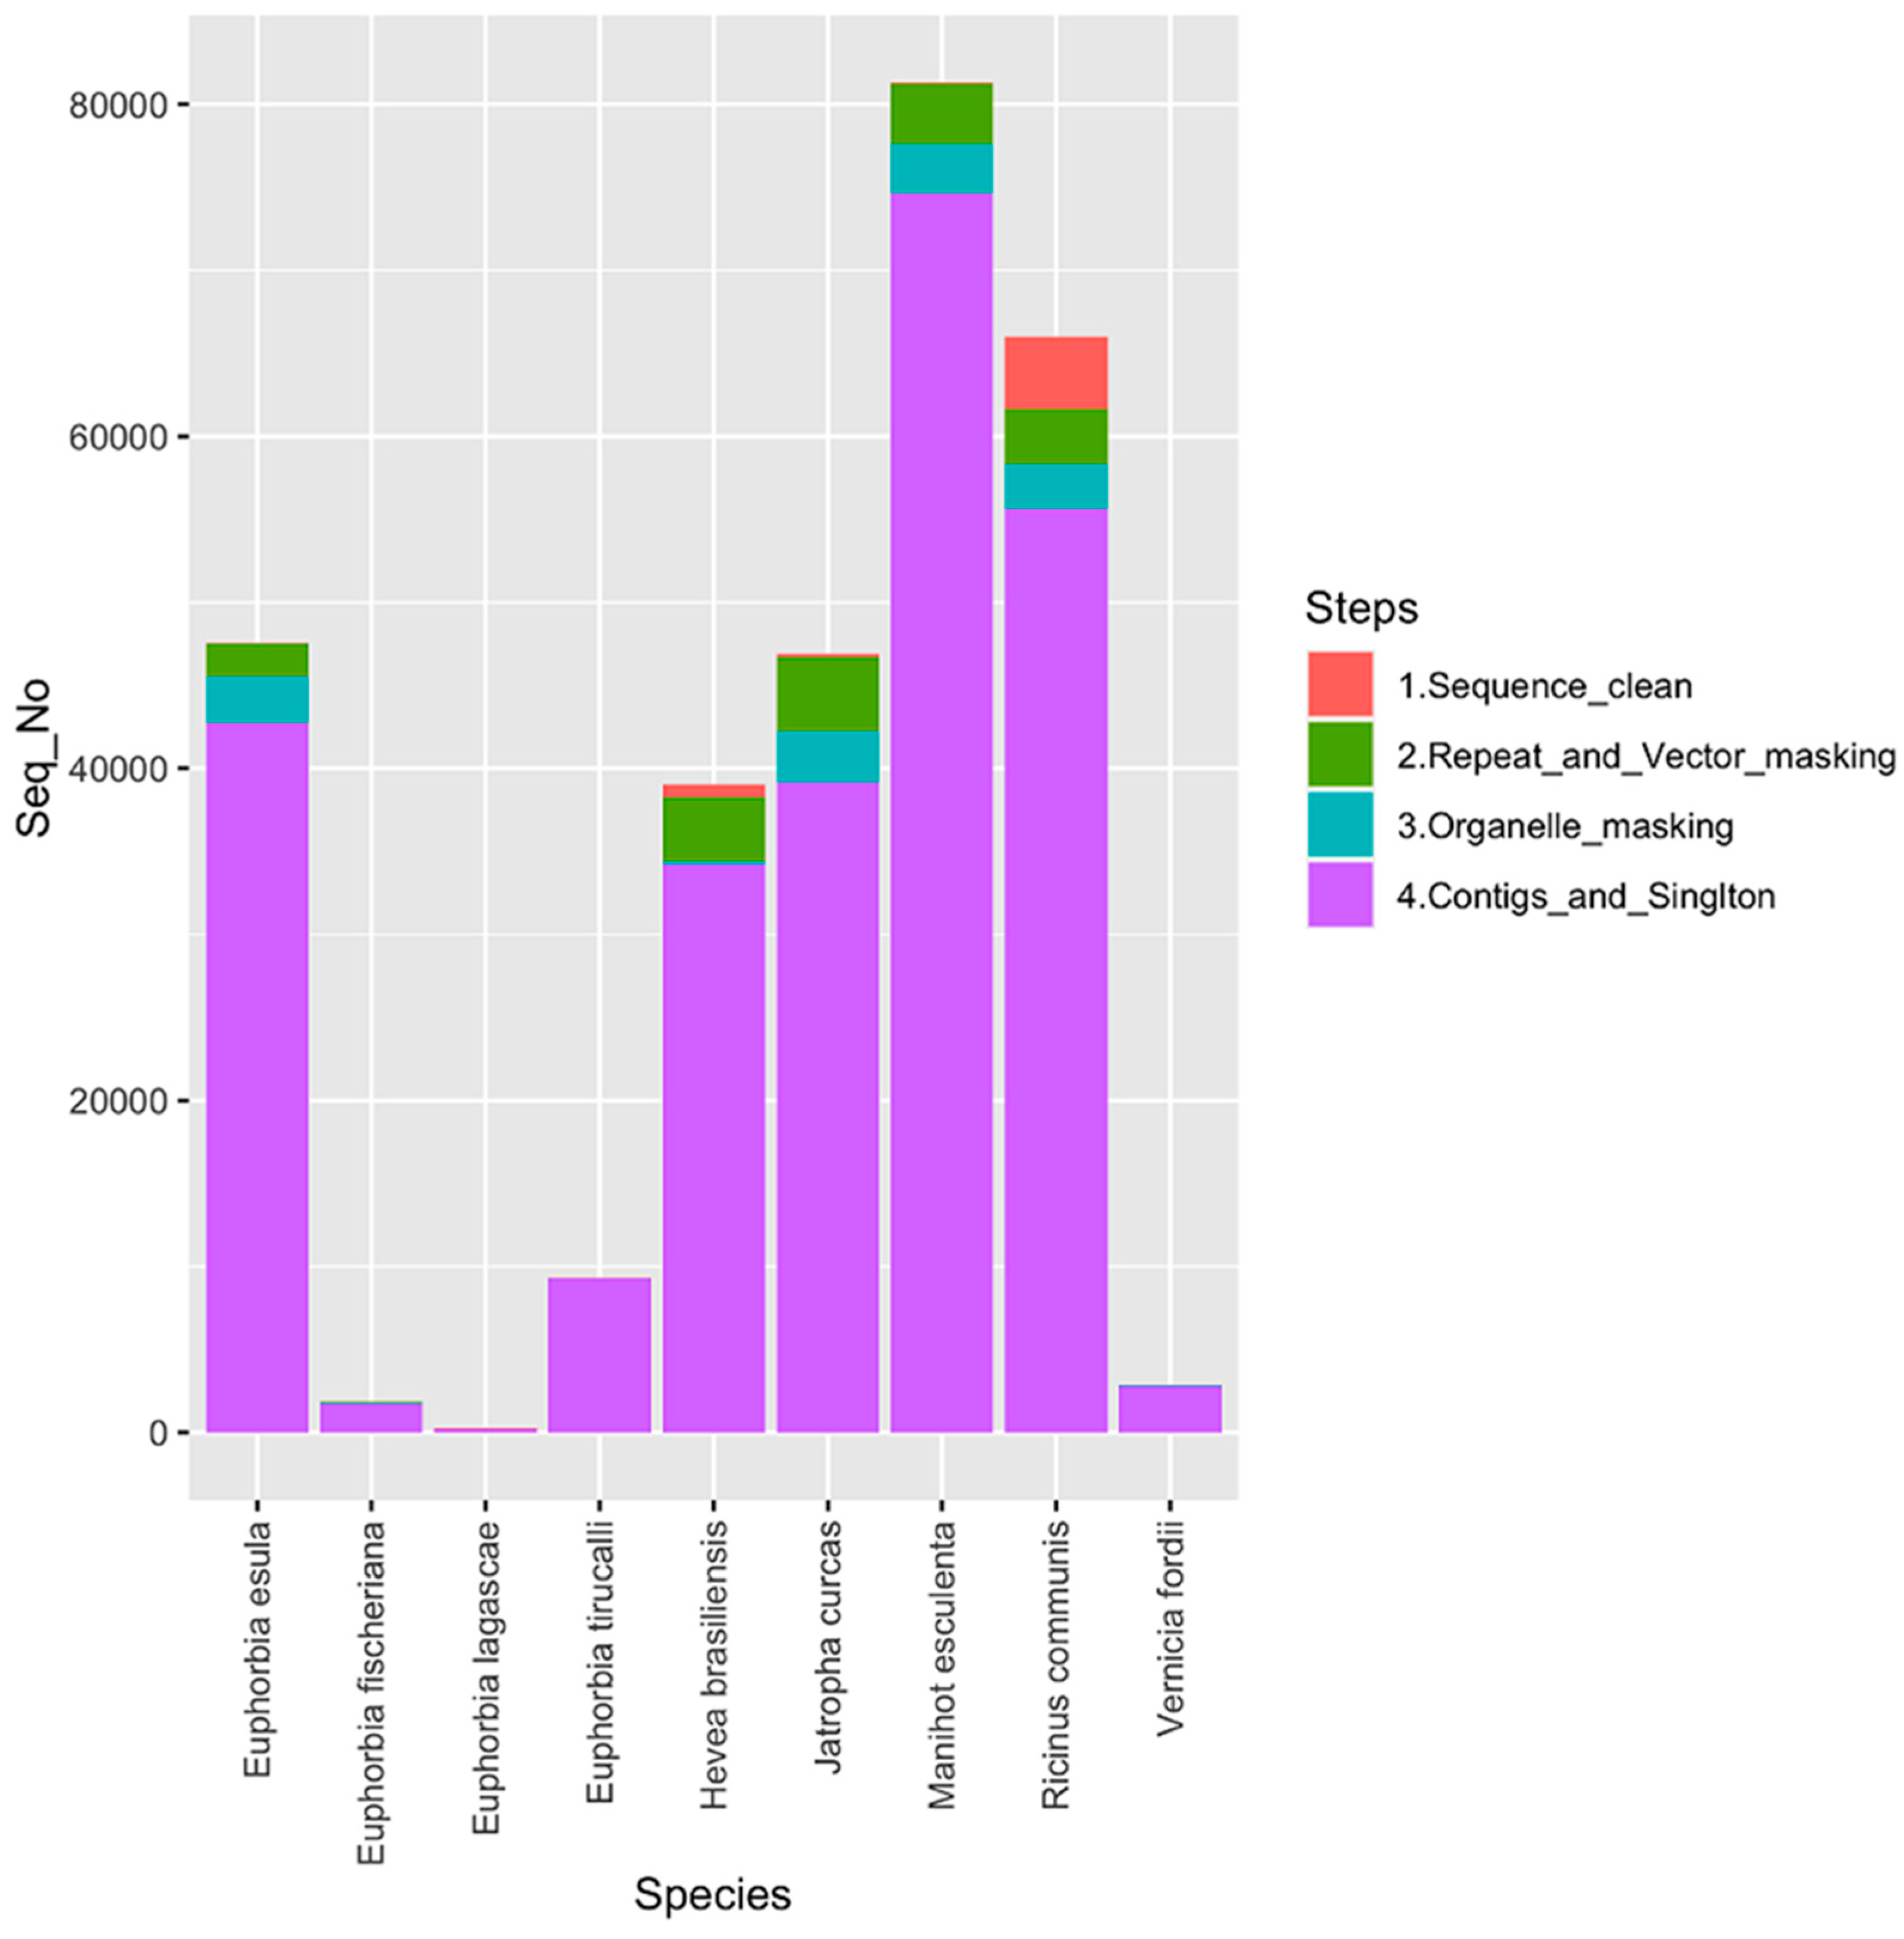
2.2. Sequence Pre-Processing and Assembly
2.3. High-Quality SNPs’ Discovery
2.4. Prioritizing High Quality SNPs
3. Results
4. Discussion
5. Conclusions
Supplementary Materials
Author Contributions
Funding
Institutional Review Board Statement
Informed Consent Statement
Data Availability Statement
Conflicts of Interest
References
- Cataluna, P.; Rates, S.M.K. The traditional use of the latex from Euphorbia tirucalli Linnaeus (Euphorbiaceae) in the treatment of cancer in South Brazil. In Proc. WOCMAP-2 Pharmacognosy, Pharmacology, Phytomedicines, Toxicology; Martino, V., Caffini, N., Lappa, A., Ferraro, G., Schilder, H., Eds.; Acta Horticulture ISHS: Leuven, Belgium, 1999; pp. 289–295. [Google Scholar]
- Van Damme, P.L.J. Euphorbia tirucalli for high biomass production. In Combating Desertification with Plants, 1st ed.; Schlissel, A., Pasternak, D., Eds.; Kluwer Academic Pub: New York, NY, USA, 2001; pp. 169–187. [Google Scholar]
- Duke, J.A.; Handbook of Energy Crops. Purdue University Centre for New Crops and Plant Products. 1983. Available online: https://www.hort.purdue.edu/newcrop/duke_energy/dukeindex.html (accessed on 9 February 2022).
- De Oliveira, J.S.; Leite, P.M.; de Souza, L.B.; Mello, V.M.; Silva, E.C.; Rubim, J.C.; Meneghetti, S.M.P.; Suarez, P.A.Z. Characteristics and composition of Jatropha gossypiifolia and Jatropha curcas L. oils and application for biodiesel production. Biomass Bioenergy 2009, 33, 449–453. [Google Scholar] [CrossRef]
- Meneghetti, S.A.P.; Meneghetti, M.R.; Serra, T.A.; Barbosa, D.C.; Wolf, C.R. Biodiesel production from vegetable oil mixtures: Cottonseed, soybean, and castor oils. Energy Fuels 2007, 21, 3746–3747. [Google Scholar] [CrossRef]
- Bhuyan, S.; Sundararajan, S.; Andjelkovic, D.; Larock, R. Effect of crosslinking on tribological behavior of tung oil-based polymers. Tribol. Int. 2010, 43, 831–837. [Google Scholar] [CrossRef]
- Aloys, N.; Ming, Z.H. Traditional cassava foods in Burundi–A review. Food Rev. Int. 2006, 22, 1–27. [Google Scholar] [CrossRef]
- Lee, C.H.; Jeon, J.H.; Lee, S.G.; Lee, H.S. Insecticidal Properties of Euphorbiaceae: Sebastiania corniculata-derived 8-Hydroxyquinoline and its Derivatives against Three Planthopper Species (Hemiptera: Delphacidae). J. Korean Soc. Appl. Biol. Chem. 2010, 53, 464–469. [Google Scholar] [CrossRef]
- Kapoor, L.D. Handbook of Ayurvedic Medicinal Plants: Herbal Reference Library; CRC Press: Boca Raton, FL, USA, 1989. [Google Scholar]
- Johnson, H.E.; Banack, S.A.; Cox, P.A. Variability in content of the anti-AIDS drug candidate prostratin in Samoan populations of Homalanthus nutans. J. Nat. Prod. 2008, 71, 2041–2044. [Google Scholar] [CrossRef]
- Cordeiro, G.M.; Casu, R.; Mclntyre, C.L.; Manners, J.M.; Henry, R.J. Microsatellite markers from sugarcane (Saccharum spp.) ESTs cross transferable to erianthus and sorghum. Plant Sci. 2001, 160, 1115–1123. [Google Scholar] [CrossRef]
- Kantety, R.V.; La Rota, M.; Matthews, D.E.; Sorrells, M.E. Data mining for simple sequence repeats in expressed sequence tags from barley, maize, rice, sorghum and wheat. Plant Mol. Biol. 2002, 48, 501–510. [Google Scholar] [CrossRef]
- Thiel, T.; Michalek, W.; Varshney, R.K.; Graner, A. Exploiting EST databases for the development and characterization of gene-derived SSR-markers in barley (Hordeum vulgare L.). Theor. Appl. Genet. 2003, 106, 411–422. [Google Scholar] [CrossRef]
- Feng, S.P.; Li, W.G.; Huang, H.S.; Wang, J.Y.; Wu, Y.T. Development, characterization and cross-species/genera transferability of EST-SSR markers for rubber tree (Hevea brasiliensis). Mol. Breed. 2009, 23, 85–97. [Google Scholar] [CrossRef]
- Brookes, A.J. The essence of SNPs. Gene 1999, 234, 177–186. [Google Scholar] [CrossRef]
- Rafalski, A. Applications of single nucleotide polymorphisms in crop genetics. Curr. Opin. Plant Biol. 2002, 5, 94–100. [Google Scholar] [CrossRef] [PubMed]
- Jalving, R.; van’t Slot, R.; van Oost, B.A. Chicken single nucleotide polymorphism identification and selection for genetic mapping. Poult. Sci. 2004, 83, 1925–1931. [Google Scholar] [CrossRef] [PubMed]
- Parkinson, J.; Blaxter, M. Expressed sequence tags: Analysis and annotation. In Methods in Molecular Biology Parasite Genomics Protocols; Melville, S.E., Ed.; Humana Press: Totowa, NJ, USA, 2004; pp. 93–126. [Google Scholar]
- Nickerson, D.A.; Tobe, V.O.; Taylor, S.L. PolyPhred: Automating the detection and genotyping of single nucleotide substitutions using fluorescence-based resequencing. Nucleic Acids Res. 1997, 25, 2745. [Google Scholar] [CrossRef]
- Marth, G.T.; Korf, I.; Yandell, M.D.; Yeh, R.T.; Gu, Z.; Zakeri, H.; Stitziel, N.O.; Hillier, L.; Kwok, P.Y.; Gish, W.R. A general approach to single-nucleotide polymorphism discovery. Nat. Genet. 1999, 23, 452–456. [Google Scholar] [CrossRef] [PubMed]
- Huntley, D.; Baldo, A.; Johri, S.; Sergot, M. SEAN: SNP prediction and display program utilizing EST sequence clusters. Bioinformatics 2006, 22, 495–496. [Google Scholar] [CrossRef][Green Version]
- Bonfield, J.K.; Rada, C.; Staden, R. Automated detection of point mutations using fluorescent sequence trace subtraction. Nucleic Acids Res. 1998, 26, 3404–3409. [Google Scholar] [CrossRef][Green Version]
- Close, T.J.; Wanamaker, S.; Roose, M.L.; Lyon, M. HarvEST. Methods Mol. Biol. 2007, 406, 161–177. [Google Scholar]
- Barker, G.; Batley, J.; O’Sullivan, H.; Edwards, K.J.; Edwards, D. Redundancy based detection of sequence polymorphisms in expressed sequence tag data using AutoSNP. Bioinformatics 2003, 19, 421–422. [Google Scholar] [CrossRef]
- Tang, J.; Vosman, B.; Voorrips, R.E.; van der Linden, C.G.; Leunissen, J.A. QualitySNP: A pipeline for detecting single nucleotide polymorphisms and insertions/deletions in EST data from diploid and polyploid species. BMC Bioinform. 2006, 7, 438. [Google Scholar] [CrossRef] [PubMed]
- Tang, J.; Leunissen, J.A.; Voorrips, R.E.; van der Linden, C.G.; Vosman, B. HaploSNPer: A web-based allele and SNP detection tool. BMC Genet. 2008, 9, 23. [Google Scholar] [CrossRef]
- Nijveen, H.; van Kaauwen, M.; Esselink, D.G.; Hoegen, B.; Vosman, B. QualitySNPng: A user-friendly SNP detection and visualization tool. Nucleic Acids Res. 2013, 41, W587–W590. [Google Scholar] [CrossRef]
- Anithakumari, A.M.; Tang, J.; van Eck, H.J.; Visser, R.G.; Leunissen, J.A.; Vosman, B.; van der Linden, C.G. A pipeline for high throughput detection and mapping of SNPs from EST databases. Mol. Breed. 2010, 26, 65–75. [Google Scholar] [CrossRef]
- Stapley, J.; Birkhead, T.R.; Burke, T.; Slate, J. A linkage map of the zebra finch Taeniopygia guttata provides new insights into avian genome evolution. Genetics 2008, 179, 651–667. [Google Scholar] [CrossRef] [PubMed]
- Orsini, L.; Jansen, M.; Souche, E.L.; Geldof, S.; De Meester, L. Single nucleotide polymorphism discovery from expressed sequence tags in the waterflea Daphnia magna. BMC Genom. 2011, 12, 309. [Google Scholar] [CrossRef] [PubMed]
- Cardoso, K.C.; Da Silva, M.J.; Costa, G.G.; Torres, T.T.; Del Bem, L.E.; Vidal, R.O.; Menossi, M.; Hyslop, S. A transcriptomic analysis of gene expression in the venom gland of the snake Bothrops alternatus (urutu). BMC Genom. 2010, 11, 605. [Google Scholar] [CrossRef]
- Hou, R.; Bao, Z.; Wang, S.; Su, H.; Li, Y.; Du, H.; Hu, J.; Wang, S.; Hu, X. Transcriptome sequencing and de novo analysis for Yesso scallop (Patinopecten yessoensis) using 454 GS FLX. PLoS ONE 2011, 6, e21560. [Google Scholar] [CrossRef]
- Available online: http://www.ncbi.nlm.nih.gov/dbEST/index.html (accessed on 20 December 2021).
- Masoudi-Nejad, A.; Tonomura, K.; Kawashima, S.; Moriya, Y.; Suzuki, M.; Itoh, M.; Kanehisa, M.; Endo, T.; Goto, S. EGassembler: Online bioinformatics service for large-scale processing, clustering and assembling ESTs and genomic DNA fragments. Nucleic Acids Res. 2006, 34, W459–W462. [Google Scholar] [CrossRef]
- Lee, Y.; Tsai, J.; Sunkara, S.; Karamycheva, S.; Pertea, G.; Sultana, R.; Antonescu, V.; Chan, A.; Cheung, F.; Quackenbush, J. The TIGR Gene Indices: Clustering and assembling EST and known genes and integration with eukaryotic genomes. Nucleic Acids Res. 2005, 33, D71–D74. [Google Scholar] [CrossRef] [PubMed]
- Huang, X.; Madan, A. CAP3: A DNA sequence assembly program. Genome Res. 1999, 9, 868–877. [Google Scholar] [CrossRef] [PubMed]
- Smit, A.F.A.; Hubley, R.; Green, P. RepeatMasker Open-3.0. Available online: http://www.repeatmasker.org/ (accessed on 15 December 2021).
- Ewing, B.; Hillier, L.; Wendl, M.C.; Green, P. Base-calling of automated sequencer traces using Phred I: Accuracy assessment. Genome Res. 1998, 8, 175–185. [Google Scholar] [CrossRef] [PubMed]
- Burge, C.; Karlin, S. Prediction of complete gene structures in human genomic DNA. J. Mol. Biol. 1997, 268, 78–94. [Google Scholar] [CrossRef] [PubMed]
- Allan, G.; Williams, A.; Rabinowicz, P.D.; Chan, A.P.; Ravel, J.; Keim, P. Worldwide genotyping of castor bean germplasm (Ricinus communis L.) using AFLPs and SSRs. Genet. Resour. Crop Evol. 2008, 55, 365–378. [Google Scholar] [CrossRef]
- Foster, J.T.; Allan, G.J.; Chan, A.P.; Rabinowicz, P.D.; Ravel, J.; Jackson, P.J.; Keim, P. Single nucleotide polymorphisms for assessing genetic diversity in castor bean (Ricinus communis). BMC Plant Biol. 2010, 10, 13. [Google Scholar] [CrossRef] [PubMed]
- Gupta, P.; Idris, A.; Mantri, S.; Asif, M.H.; Yadav, H.K.; Roy, J.K.; Tuli, R.; Mohanty, C.S.; Sawant, S.V. Discovery and use of single nucleotide polymorphic (SNP) markers in Jatropha curcas L. Mol. Breed. 2012, 30, 1325–1335. [Google Scholar] [CrossRef]
- Siju, S.; Ismanizan, I.; Wickneswari, R. Genetic homogeneity in Jatropha curcas L. individuals as revealed by microsatellite markers: Implication to breeding strategies. Braz. J. Bot. 2015, 39, 861–886. [Google Scholar] [CrossRef]
- Jander, G.; Norris, S.R.; Rounsley, S.D.; Bush, D.F.; Levin, I.M.; Last, R.L. Arabidopsis map-based cloning in the post-genome era. Plant Physiol. 2002, 129, 440–450. [Google Scholar] [CrossRef]
- Newcomb, R.D.; Crowhurst, R.N.; Gleave, A.P.; Rikkerink, E.H.; Allan, A.C.; Beuning, L.L.; Bowen, J.H.; Gera, E.; Jamieson, K.R.; Janssen, B.J.; et al. Analyses of expressed sequence tags from apple. Plant Physiol. 2006, 141, 147–166. [Google Scholar] [CrossRef]
- Gaur, M.; Das, A.; Subudhi, E. High quality SNPs/Indels mining and characterization in ginger from ESTs data base. Bioinformation 2015, 11, 85–89. [Google Scholar] [CrossRef]
- Available online: https://www.arabidopsis.org (accessed on 20 December 2021).
- Pootakham, W.; Chanprasert, J.; Jomchai, N.; Sangsrakru, D.; Yoocha, T.; Therawattanasuk, K.; Tangphatsornruang, S. Single nucleotide polymorphism marker development in the rubber tree, Hevea brasiliensis (Euphorbiaceae). Am. J. Bot. 2011, 98, e337–e338. [Google Scholar] [CrossRef]
- Bhattramakki, D.; Dolan, M.; Hanafey, M.; Wineland, R.; Vaske, D.; Register, J.C., 3rd; Tingey, S.V.; Rafalski, A. Insertion-deletion polymorphisms in 3’ regions of maize genes occur frequently and can be used as highly informative genetic markers. Plant Mol. Biol. 2002, 48, 539–547. [Google Scholar] [CrossRef] [PubMed]
- Duncan, B.K.; Miller, J.H. Mutagenic deamination of cytosine residues in DNA. Nature 1980, 287, 560–561. [Google Scholar] [CrossRef] [PubMed]
- Souche, E.L.; Hellemans, B.; Van Houdt, J.K.J.; Canario, A.; Klages, S.; Reinhardt, R.; Volckaert, F.A.M. Mining for Single Nucleotide Polymorphisms in Expressed Sequence Tags of European Sea Bass. J. Integr. Bioinform. 2007, 4, 73. [Google Scholar] [CrossRef][Green Version]


| E. esula | E. fischeriana | E. lagascae | E. tirucalli | H. brasiliensis | J. curcas | M. esculenta | R. communis | V. fordii | |
|---|---|---|---|---|---|---|---|---|---|
| Total ESTs | 42,751 | 1766 | 233 | 9284 | 34,212 | 39,175 | 74,596 | 55,636 | 2826 |
| Total Contigs | 8865 | 206 | 14 | 1144 | 3579 | 5060 | 10448 | 5209 | 211 |
| Singletons | 17,593 | 886 | 186 | 5474 | 7961 | 14,658 | 21,133 | 8442 | 1008 |
| Total Available Contings | 1719 | 38 | 2 | 260 | 1367 | 1489 | 4037 | 2413 | 99 |
| Total ESTs in Available Contigs | 8802 | 503 | 22 | 1825 | 16,751 | 15,656 | 38,618 | 35,977 | 1561 |
| No. of Contigs with Potential SNP | 935 | 15 | 2 | 117 | 434 | 462 | 1925 | 946 | 45 |
| No. of ESTs in Contigs Containing Potential SNP | 5274 | 377 | 22 | 1079 | 10,500 | 9368 | 26,819 | 26,616 | 1160 |
| Total Consensus Size (bp) | 906,024 | 14,897 | 865 | 94,059 | 452,159 | 456,724 | 1,706,808 | 1,146,581 | 47,218 |
| Average Contig Length | 969 | 993 | 432.5 | 804 | 1042 | 989 | 884 | 1029 | 1049 |
| Average ESTs per Contig | 5.2 | 24.1 | 9 | 7.6 | 20.14 | 17.25 | 12.09 | 24.41 | 22.76 |
| Maximum Contig Size (bp) | 2086 | 1728 | 434 | 1767 | 3107 | 2840 | 2751 | 3102 | 2052 |
| Minimum Contig Size (bp) | 301 | 500 | 431 | 385 | 183 | 192 | 167 | 185 | 484 |
| Contings with 2 ESTs | 5082 | 127 | 11 | 667 | 1548 | 2617 | 4388 | 1919 | 79 |
| Contings with > 2 ESTs | 3783 | 79 | 3 | 477 | 2031 | 2442 | 6060 | 3290 | 129 |
| Potential SNPs (pSNP) | 4377 | 53 | 18 | 421 | 2296 | 2620 | 8560 | 6449 | 638 |
| True High-Quality SNPs (qSNP) | 3270 | 31 | 7 | 176 | 1635 | 1043 | 5475 | 2574 | 140 |
| Haplotypes | 2309 | 36 | 11 | 364 | 1097 | 1459 | 5806 | 3427 | 215 |
| Removed single haplotypes | 386 | 5 | 4 | 111 | 102 | 373 | 1054 | 810 | 73 |
| Ratio of qSNP to pSNP | 0.75 | 0.58 | 0.39 | 0.42 | 0.71 | 0.4 | 0.64 | 0.4 | 0.22 |
| No. of SNPs per kbp | 3.61 | 2.08 | 8.09 | 1.87 | 3.62 | 2.28 | 3.21 | 2.24 | 2.96 |
| No. of SNPs per Contig | 3.5 | 2.1 | 3.5 | 1.5 | 3.8 | 2.3 | 2.8 | 2.7 | 3.1 |
| No. of bp per SNP | 277 | 481 | 124 | 534 | 277 | 438 | 312 | 445 | 337 |
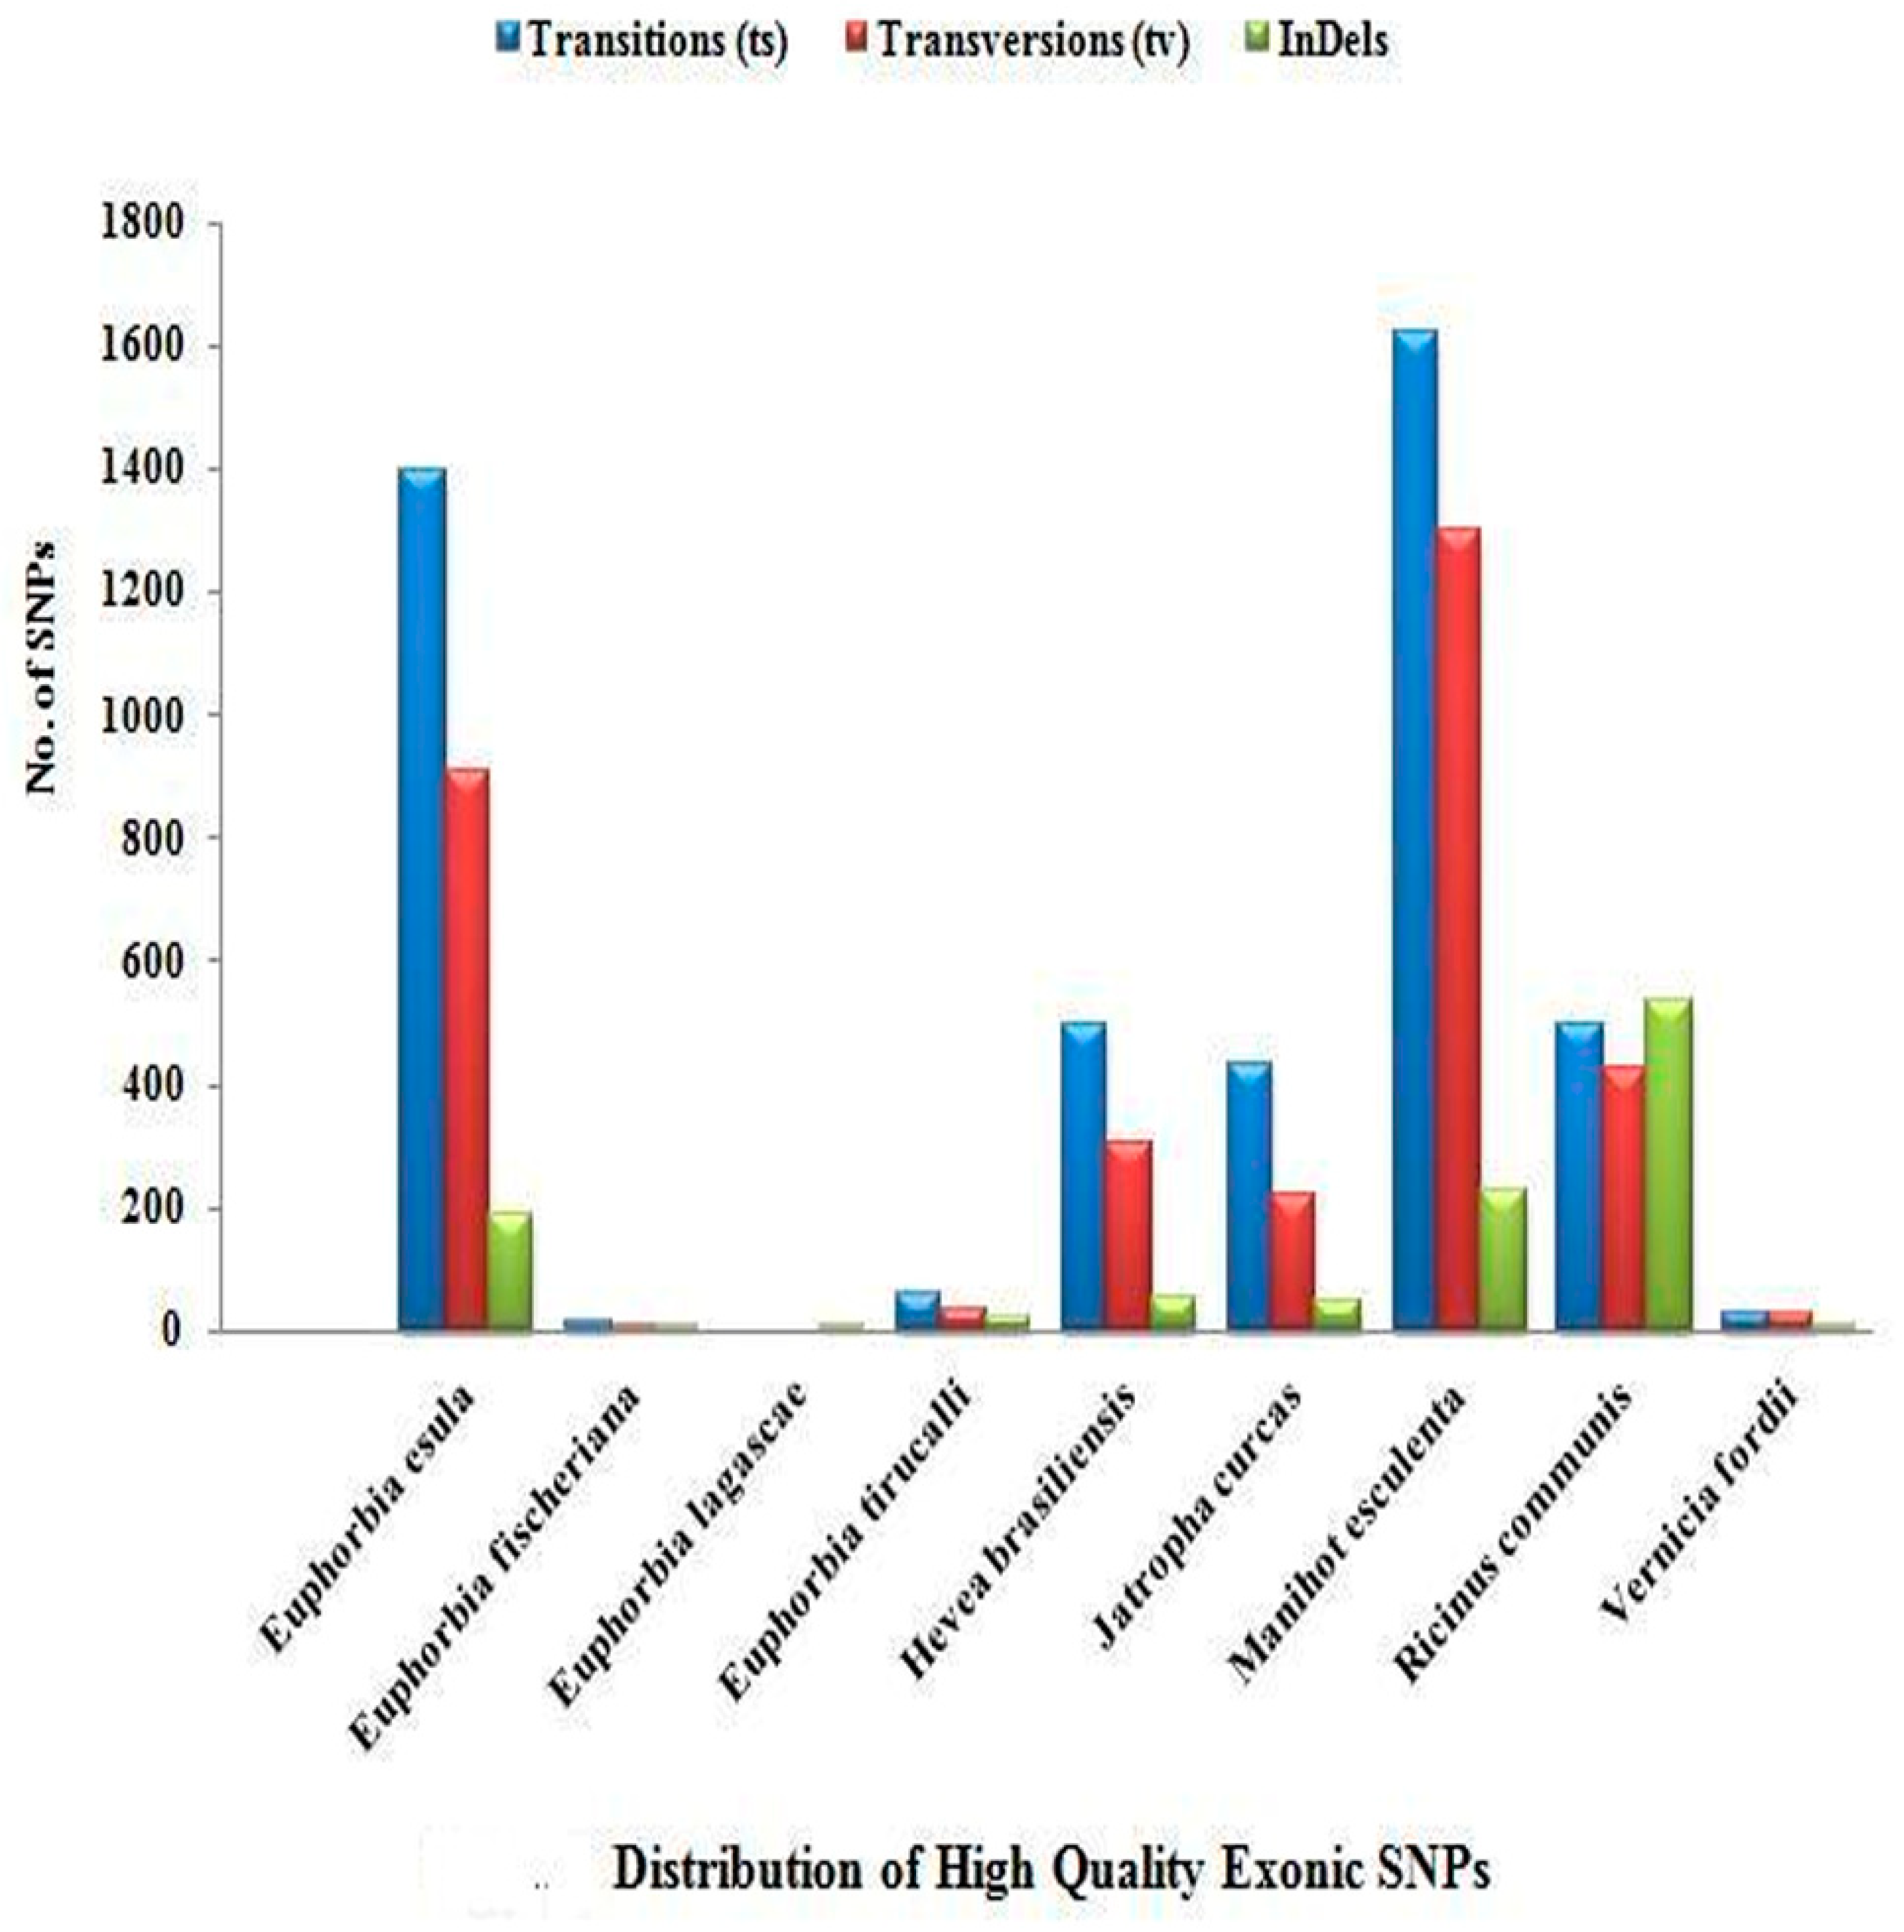
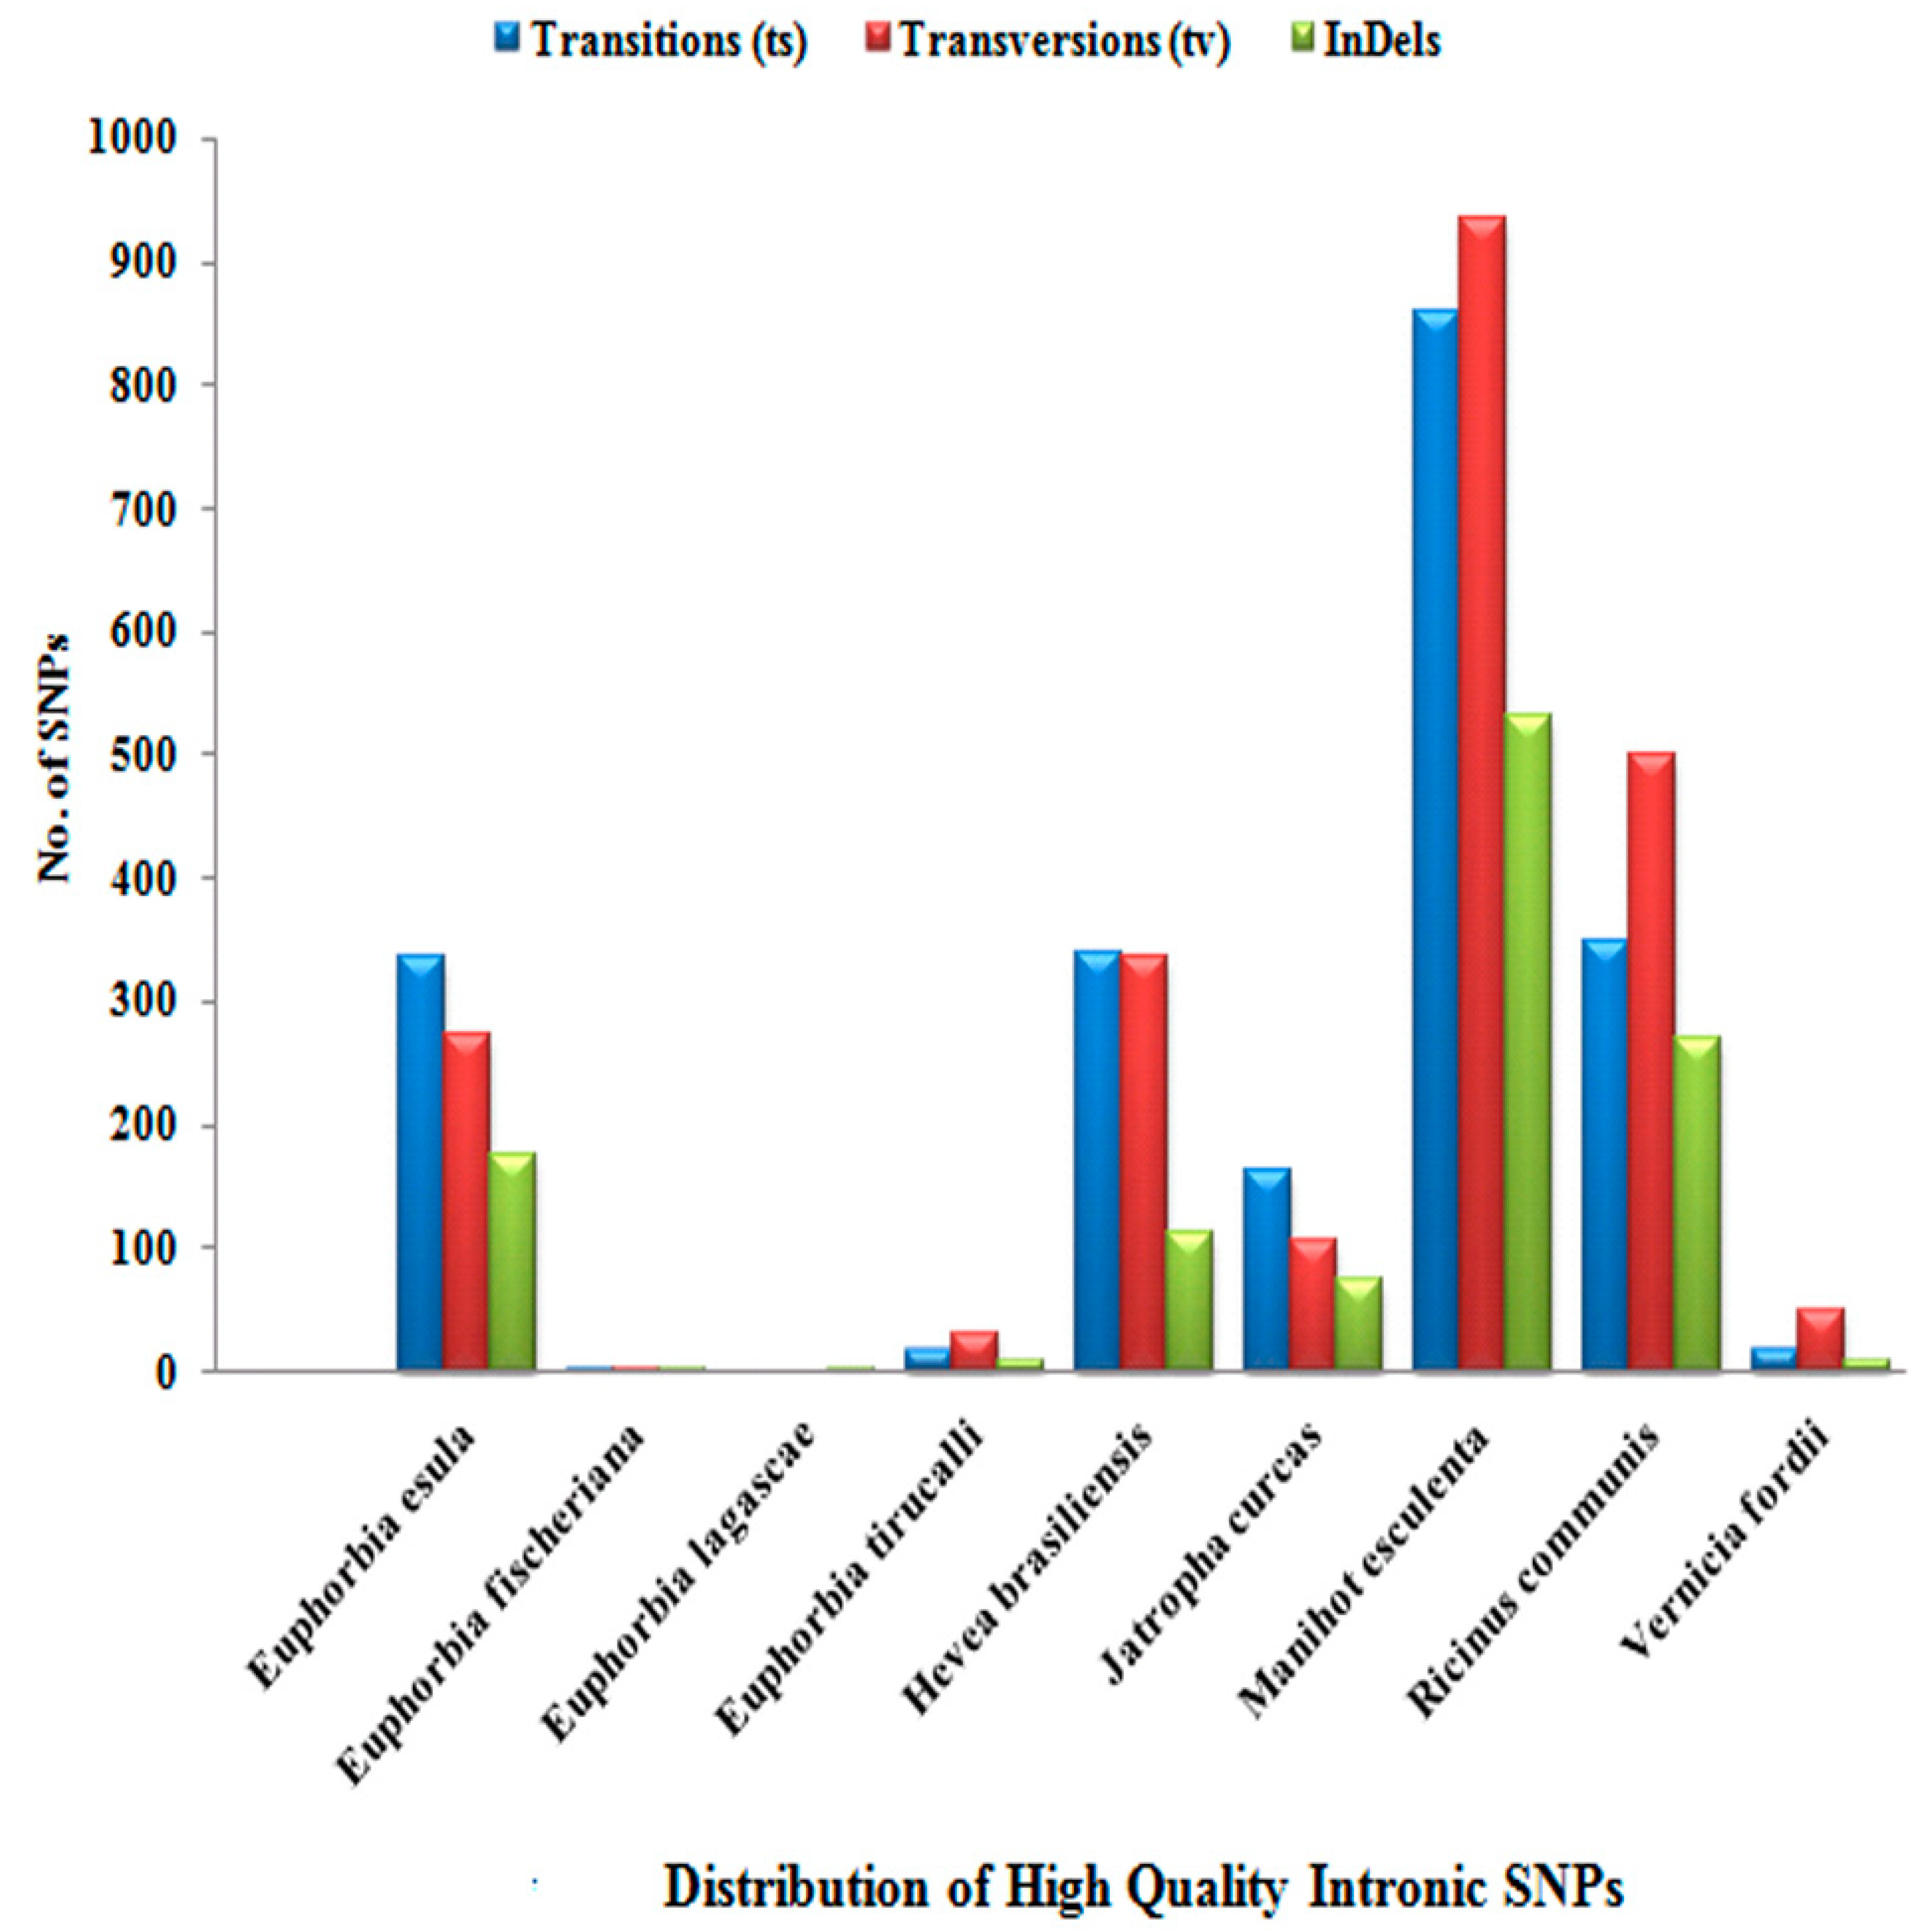
| Transitions (ts) | 1728 | 18 | 0 | 77 | 833 | 592 | 2479 | 843 | 46 |
| Transversions (tv) | 1179 | 7 | 0 | 68 | 638 | 326 | 2236 | 927 | 78 |
| Ratio of Transitions to Transversion | 1.47 | 2.57 | 0 | 1.13 | 1.3 | 1.82 | 1.11 | 0.91 | 0.59 |
| InDels | 363 | 6 | 7 | 31 | 164 | 125 | 760 | 804 | 16 |
| InDels per kbp | 0.04 | 0.4 | 8 | 0.33 | 0.36 | 0.27 | 0.44 | 0.7 | 0.33 |
| InDels per Contig | 0.21 | 0.16 | 3.5 | 0.12 | 0.12 | 0.08 | 0.19 | 0.33 | 0.16 |
| Base pairs per InDels | 2496 | 2128 | 124 | 3034 | 2757 | 3654 | 2246 | 1426 | 2951 |
Disclaimer/Publisher’s Note: The statements, opinions and data contained in all publications are solely those of the individual author(s) and contributor(s) and not of MDPI and/or the editor(s). MDPI and/or the editor(s) disclaim responsibility for any injury to people or property resulting from any ideas, methods, instructions or products referred to in the content. |
© 2023 by the authors. Licensee MDPI, Basel, Switzerland. This article is an open access article distributed under the terms and conditions of the Creative Commons Attribution (CC BY) license (https://creativecommons.org/licenses/by/4.0/).
Share and Cite
Sen, S.; Rathi, S.; Sahu, J.; Mandal, S.C.; Ray, S.; Slama, P.; Roychoudhury, S. In Silico Mining and Characterization of High-Quality SNP/Indels in Some Agro-Economically Important Species Belonging to the Family Euphorbiaceae. Genes 2023, 14, 332. https://doi.org/10.3390/genes14020332
Sen S, Rathi S, Sahu J, Mandal SC, Ray S, Slama P, Roychoudhury S. In Silico Mining and Characterization of High-Quality SNP/Indels in Some Agro-Economically Important Species Belonging to the Family Euphorbiaceae. Genes. 2023; 14(2):332. https://doi.org/10.3390/genes14020332
Chicago/Turabian StyleSen, Surojit, Sunayana Rathi, Jagajjit Sahu, Subhash C. Mandal, Supratim Ray, Petr Slama, and Shubhadeep Roychoudhury. 2023. "In Silico Mining and Characterization of High-Quality SNP/Indels in Some Agro-Economically Important Species Belonging to the Family Euphorbiaceae" Genes 14, no. 2: 332. https://doi.org/10.3390/genes14020332
APA StyleSen, S., Rathi, S., Sahu, J., Mandal, S. C., Ray, S., Slama, P., & Roychoudhury, S. (2023). In Silico Mining and Characterization of High-Quality SNP/Indels in Some Agro-Economically Important Species Belonging to the Family Euphorbiaceae. Genes, 14(2), 332. https://doi.org/10.3390/genes14020332