Article

Association Analysis of Tiller-Related Traits with EST-SSR Markers in Psathyrostachys juncea

1
College of Grassland, Resources and Environment, Inner Mongolia Agricultural University, Hohhot 010010, China
2
Key Laboratory of Grassland Resources Ministry of Education, Hohhot 010010, China
*
Author to whom correspondence should be addressed.
Genes 2023, 14(10), 1970; https://doi.org/10.3390/genes14101970
Submission received: 18 September 2023 / Revised: 12 October 2023 / Accepted: 16 October 2023 / Published: 21 October 2023
(This article belongs to the Special Issue Genetic Research and Plant Breeding 2.0)

Abstract

:
Psathyrostachys juncea is a long-lived perennial Gramineae grass with dense basal tillers and soft leaves. It is used widely in cold and dry areas of Eurasia and North America to establish grazing pasture and is even used as an ideal plant for revegetation and ecological restoration. Plant architecture, especially tillering traits, is critical for bunch grasses in breeding programs, and these traits in plants are mostly quantitative traits. In this study, the genetic diversity, population structure, and linkage disequilibrium of 480 individual lines were analyzed using 127 pairs of the EST-SSR marker, and a significant association between ten plant-architecture-related traits of P. juncea and molecular markers was found. The results of the genetic diversity analysis showed that the number of observed alleles was 1.957, the number of effective alleles was 1.682, Shannon’s information index was 0.554, observed heterozygosity was 0.353, expected heterozygosity was 0.379, and the polymorphism information content was 0.300. A total of 480 individual lines were clustered into five groups based on population genetic structure, principal coordinate analysis, and unweighted pair group method with arithmetic mean analysis (UPGMA). The linkage disequilibrium coefficient (r2) was between 0.00 and 0.68, with an average of 0.04, which indicated a relatively low level of linkage disequilibrium among loci. The results of the association analysis revealed 55 significant marker–trait associations (MTA). Moreover, nine SSR markers were associated with multiple traits. This study provides tools with promising applications in the molecular selection and breeding of P. juncea germplasm.

1. Introduction

Russian wildrye grass (Psathyrostachys juncea (Fish) Neviski) is a perennial cross-pollinated bunch grass species of Gramineae with a rare diploid chromosome level (2n = 2x = 14) [1]. It is native to central and northern Asia’s inland areas, and its distribution has spread to East Asia, Europe, and North America due to introduction and domestication [2]. In China, Russian wildrye is mainly distributed in the north of the Tianshan Mountains in Xinjiang, which is close to central Asia, and there is scattered distributed in the mid-west of Inner Mongolia and northern Tibet. Russian wildrye is a cool-season forage species that is well adapted to arid and semi-arid climates [3,4]. It is a long-lived perennial bunch grass characterized by dense basal leaves that retain their nutritive value during the late growing season better than other grasses in the North American steppe. Most forage of this species is produced in the basal leaves that grow rapidly in spring and remain palatable throughout the summer and fall as long as soil moisture is available [5]. Russian wildrye has extremely strong drought resistance and cold tolerance; it is adapted to heavy grazing and can restrain weeds once established as cultivated grassland [6]. P. juncea is considered an important gramineous forage species with agronomic, economic, forage, and breeding value. Since Russian wildrye is widely used for revegetation and the establishment of grazing pastures, tillering capacity and improvement of plant architecture are current focuses for breeding programs targeting this species.
Many important traits in plants are quantitative traits controlled by micro-effective polygenes, with complex genetic mechanisms and susceptibility to environmental factors [7]. Tillering capacity and plant-architecture-related traits are mostly quantitative traits [8]. Early quantitative trait mapping was mainly based on genetic linkage analysis, linkage mapping, and association mapping [9,10]. With the development of genotyping chips and whole-genome sequencing technology, genome-wide association studies (GWAS) have become increasingly applied to the genetic analysis of various complex traits in plants [11,12]. Association analysis, also known as linkage disequilibrium mapping or association mapping, is an analysis method based on linkage disequilibrium (LD) used to identify the correlation between target traits and genetic markers or candidate genes in a population [13,14,15]. Association analysis is an effective way to study the quantitative traits of plants and has been widely used in crops and other plants. With the continuous development of sequencing technology, a large number of molecular markers have been developed, and association analysis has been widely used in the discovery of genes related to various traits [16,17]. The association analysis method can be used to construct genetic maps and is a fast, low-cost method with a high mapping resolution. It is thus an effective method for discerning the genetic anatomy of complex traits [18]. In plant breeding, association analysis has been employed for detecting genomic regions for various agronomic traits, biochemical properties, root system architecture features, and physiological traits, as well as tolerance to environmental stresses [19,20,21,22]. Simple sequence repeat (SSR) markers are widely used in association analysis due to their large number and high frequency of distribution in plant genomes. SSR markers are economical and efficient when applied to population selection because they are easy to detect with PCR reactions [23,24,25]. Li et al. [26] found four continuous markers of EGA resistance and tolerance in different growth stages of wheat when using SSR markers for association analysis, which provided a basis for molecular assisted breeding of wheat. Pour et al. [27] analyzed the genetic diversity and association of 186 wheat and wild relative germplasms using 24 SSR markers and found that there were eight significant markers associated with APX, CAT, and DM under control conditions and nine significant markers associated with APX, GPX, POX, DM, and STI under drought stress. Breseghello et al. [28] performed association mapping of 95 winter wheat varieties using 88 SSR markers, detected significant markers associated with grain size on three chromosomes, and identified alleles that might be useful for genome selection. Yu et al. [29,30] conducted correlation analysis on the drought and flood tolerance traits of perennial ryegrass using 109 SSR markers, which provided important genetic information for the improvement of ryegrass populations. Nie et al. [31] researched the physiological and photosynthetic characteristics of Miscanthus under drought stress and conducted association analysis with SSR molecular markers. Through the GLM model, a total of five markers were found to be associated with photosynthetic traits and two markers were associated with leaf RWC of Miscanthus. These associations would serve as an efficient tool for the study of drought response mechanisms in Miscanthus and facilitate drought-resistance genetic improvements in this species. Yan et al. [32] used EST-SSR to conduct association analysis on the rust-resistance traits of 75 orchardgrass materials and detected 20 markers associated with rust traits in multiple environments. The 20 markers obtained from association analysis could be used in breeding programs for lineage selection to prevent losses caused by rust and provided valuable information for further association mapping using this collection of orchardgrass. Sun et al. [33] used EST-SSR molecular markers to conduct association analysis on important agronomic traits of Bromus catharticus Vahl. A total of 101 loci were detected to be associated with nine traits, of which 14 markers were significantly associated with tiller number and 20 markers were significantly correlated with plant height. That study provided a basis for molecular breeding of Bromus L. plants. Previous studies have been reported on the genetic structure and biodiversity of P. juncea [34]. It was found that a high level of genetic biodiversity exists between individuals within populations, and this was mainly attributed to its strictly heterogamous pollination characteristics. Individual lines are commonly used as genotyping materials in cross-pollinating plants [35]. However, to date, there have been no relevant reports on plant architecture-related traits of P. juncea using association analysis.
Therefore, in this study, association analysis was conducted using a total of 127 pairs of EST-SSR primer pairs, of which 103 primer pairs were developed and screened from transcriptome sequences of P. juncea, and 24 primer pairs were selected from NCBI. Four hundred and eighty P. juncea individual lines from different countries and regions were used as genotyping and phenotyping materials. The association between EST-SSR molecular markers and ten plant architecture-related traits of P. juncea were analyzed. SSR markers significantly associated with critical agronomic traits were detected, which provided potential novel molecular markers for marker-assisted selection and genetic improvement of quantitative agronomic traits of P. juncea.

2. Materials and Methods

2.1. Plant Materials and Tiller Related Traits Phenotyping

A total of 480 P. juncea individual lines from 21 accessions with 14 to 30 individuals per accession were selected as test materials. All accessions were provided by the U.S. National Plant Germplasm Resources Conservation System (NPGS) and the China National Medium-term Gene Bank for Forage Germplasm. Information on the accessions and cultivation of experimental plots were described by Li et al. [34].
The 480 individual lines were cloned and transplanted in two plots located in different areas through the isolation of plantlets from the tiller nodes in June 2019. The two test plots were located in Hohhot city (111°50′46.6116′′ N, 40°44′58.3188′′ E) and Baotou city (110°34′42.7512′′ N, 40°35′54.8124′′ E) in Inner Mongolia, China. A randomized block design was used in the experiment. The row spacing was 60 cm, and the plant spacing was 50 cm. Normal weed control and irrigation were undertaken.
Observations and records of tiller-related traits of P. juncea were made at the two experimental sites during the annual heading stage from 2020 to 2022. Shoot height (SH), clump basal diameter (BD), canopy diameter (CD), nutritional tiller number (NTN), nutritional tiller angle (NTA), leaf length (LL), leaf width (LW), plant height (PH), reproductive tiller length (RTL) and reproductive tiller number (RTN) were measured once a year in the blooming period. The specific measurement methods have been described in the research conducted by Gao et al. [36].

2.2. EST-SSR Markers Development for P. juncea

Two groups of thirty plants with dense and sparse tillers, respectively, were selected from the 480 individual lines. Total RNA was extracted from tiller node tissues using a rapid plant RNA extraction kit. The cDNA library was constructed and sequenced by the Biomarker Biotechnology Corporation (Beijing, China). Briefly, the poly (A) mRNA was enriched via magnetic oligo (dT) beads and then broken into short fragments using an RNA Fragmentation Kit (Beckman Coulter, Brea, CA, USA). These cleaved mRNA fragments were used as templates for cDNA synthesis using random hexamer primers. Next, the purified cDNA fragments were enriched via PCR. Finally, the cDNA library was sequenced using an Illumina HiSeq 2000 (San Diego, CA, USA), and the high-quality sequencing data were assembled to obtain unigenes. Four hundred EST-SSR loci were screened based on significantly differently expressed genes between the dense and sparse tillering groups, and primers of SSRs were designed using Primer 5 software (http://primer5.sourceforge.net/releases.php, accessed on 1 August 2023). After polymorphism testing, a total of 103 pairs of EST-SSR primers with polymorphism were selected. In addition, twenty-four EST-SSR markers related to tillering were selected from NCBI for this experiment. (Supplementary Table S1).

2.3. Population Genotyping with EST-SSR Markers

The total DNA of 480 individual lines was extracted using a plant DNA extraction kit (Tiangen Biochemical Co., Ltd., Beijing, China), and DNA quality and concentration were tested using 1% agarose gel and a NanoDropTM2000 Spectrophotometer (Thermo Fisher, Waltham, MA, USA). The DNA solutions were diluted to 50 ng/µL. A total of 127 selected EST-SSR primer pairs were used from the 480 individual lines in DNA PCR reactions. The 15 µL PCR reaction system were used for DNA amplification. The PCR reaction and conditions have been described by Nie [31]. The amplified fragments were detected using a QIAxcel Advanced capillary electrophoresis instrument (QIAGEN, Hilden, Germany). The 100 bp to 2.5 kb DNA Size Marker and 15 bp to 3 kb Alignment Marker were used as standard size markers. Amplified products of each individual line and each primer pair were analyzed using BioCalculator software to calculate the peak features. Clear bands with high statistical resolution were counted and arranged in order from small to large, with “1” indicating the presence of a fragment and “0” indicating the absence of a fragment.

2.4. Linkage Disequilibrium, Population Structure and Association Analysis

The phenotypic data of ten quantitative traits were processed, and preliminary statistics were conducted using Excel. Correlation analysis and principal component analysis of phenotypic trait data were conducted using R 4.2. For multi-year and multi-location data, the best linear unbiased estimate (BLUE) value was calculated using the R 4.2 lme4 package [37]. The calculation model of the BLUE value was as follows:
Y i k m = μ + g i + τ k + g τ i k + δ ( k ) m + ε i k m
where μ is the population average, g I is the genotype effect, τ k is the environmental effect, g τ i k is the genotype and environment interaction effect, δ ( k ) m is the m-th repeating effect in the k-th environment, and ε i k m is the random error effect. The genotype effect is a fixed effect in the equation, and other factors are random effects.
The genotypic data of EST-SSR markers from 480 individual lines were analyzed, and the number of alleles (Na), the number of effective alleles (Ne), Shannon information index (I), observed heterozygosity (H0), expected heterozygosity (He) and polymorphism information content (PIC) were calculated. The analysis model of molecular variance (AMOVA) was used to estimate the genetic variation within and among individual lines using GenAlex 6.3 software. Principal coordinate analysis (PCoA) was also undertaken using GenAlex 6.3 software. Genetic similarity coefficients were calculated, and the un-weighted pair group method with arithmetic mean (UPGMA) dendrogram was constructed using NTSYS-pc 2.10 software. Powermarker V3.25 software was used for cluster analysis. The population genetic structure was analyzed using STRUCTURE 2.3.4 software. To confirm the optimum number of subpopulations (K), ten independent runs for each value of K ranging from 2 to 10 were conducted. Each run consisted of a burn-in period of 10,000 steps followed by 100,000 MCMC iterations. The ΔK parameter, based on the rate of change in the log probability of data between successive K values, was estimated to determine the best K based on the model developed by Evanno (Lausanne, Switzerland) [38].
Linkage disequilibrium between EST-SSR loci was estimated using TASSEL v2.1. software. Association analysis between the ten tiller-related phenotypic traits and EST-SSR molecular markers was performed based on a generalized linear model (GLM) using TASSEL v2.1. Marker-trait association was considered significant using a threshold of p < 0.05. The Manhattan diagram was drawn using the CMplot package of R 4.2.

3. Results

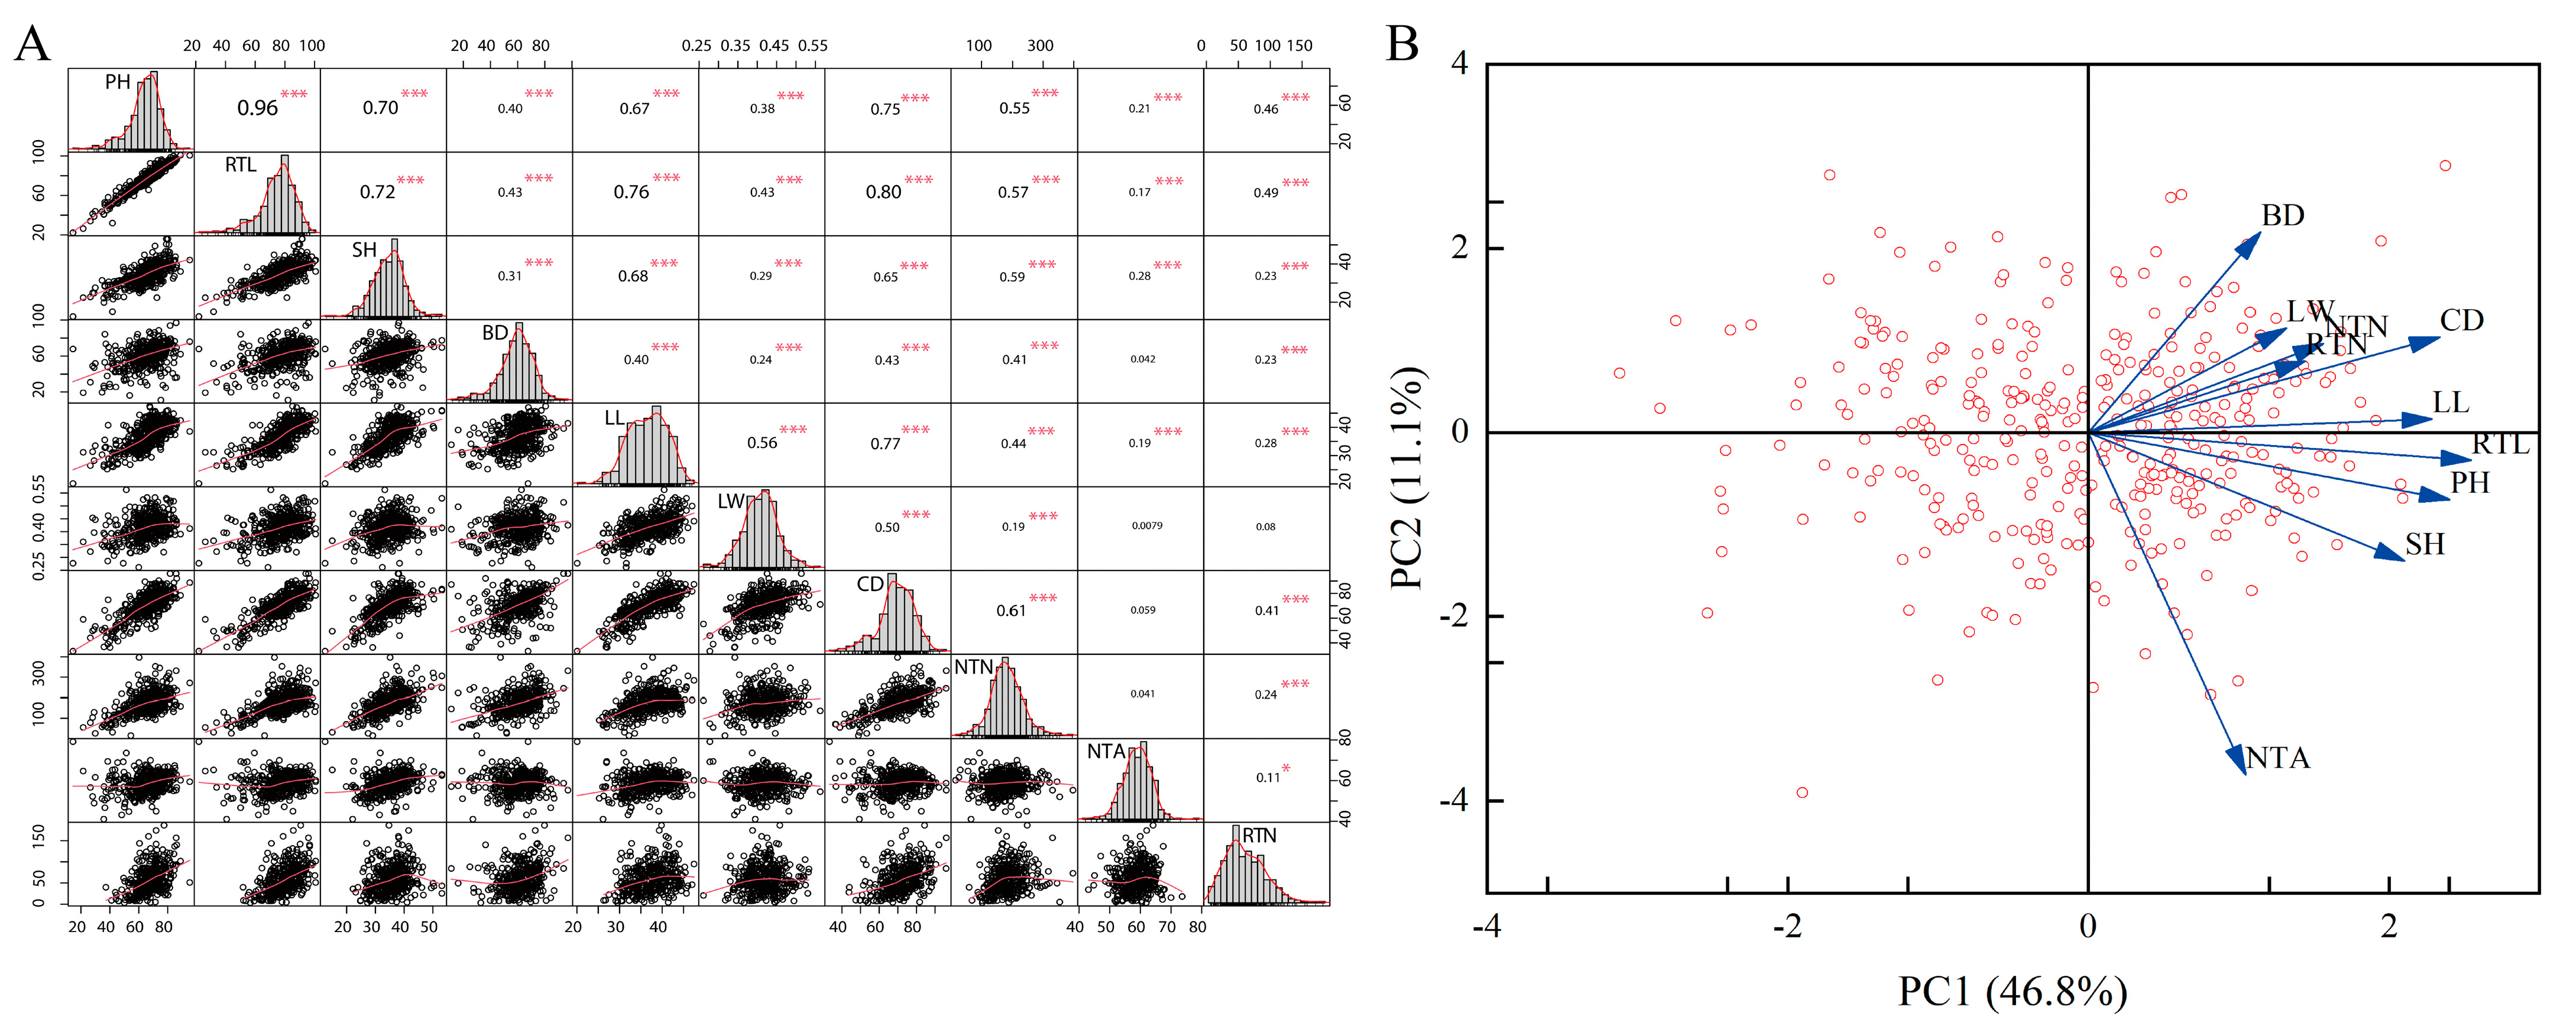
3.1. Phenotypic Analysis of Tiller-Related Traits

Variation analysis using BLUE values and phenotypic values for ten traits of P. juncea in two locations over three years showed that the coefficient of variation ranged from 8.09% to 68.64% among different traits (Table 1). The nutritional tiller angle trait had the lowest coefficient of variation value, which was 8.09%, indicating that the nutritional tiller angle was the most stable trait with minimal variation among all traits evaluated in this experiment. The highest coefficient of variation value was for the reproductive tiller number, which was 68.64% in Hohhot, followed by the nutritional tiller number, which was 40.36% in Hohhot. Analyzing all phenotypic data across both sites and BLUE values, all the coefficients of variation for reproductive tiller number and nutritional tiller number traits exceeded 30%, showing that there was rich variation in both reproductive and nutritional tiller number traits in the P. juncea population. Comparing the phenotypic data of the two sites, nine of the ten traits had higher coefficients of variation in Hohhot than in Baotou, suggesting that the environments of the two sites affected these traits in different ways.
Correlation analysis of ten traits of P. juncea was carried out with BLUE values. The results showed that plant height, reproductive tiller length and shoot height were significantly positively correlated with all traits (p < 0.001). Clump basal diameter was significantly positively correlated with leaf length, leaf width, canopy diameter, nutritional tiller number and reproductive tiller number (p < 0.001). Leaf length was significantly positively correlated with all traits (p < 0.001). Leaf width was significantly positively correlated with canopy diameter and nutritional tiller number (p < 0.001). Canopy diameter was significantly positively correlated with nutritional tiller number and reproductive tiller number (p < 0.001). Nutritional tiller angle was significantly positively correlated with reproductive tiller number (p < 0.05). The correlation between plant height and reproductive tiller length was the strongest, with a correlation coefficient of 0.96, followed by reproductive tiller length and canopy diameter, with a correlation coefficient of 0.80 (Figure 1A).
Principal component analysis (PCA) was used to evaluate variation among the investigated germplasms. The first four principal components (PCs) accounted for 74.81% (PC1: 46.8%, PC2: 11.1%, PC3: 9.87% and PC4: 7.02) of the total variation, indicating that these four independent comprehensive indicators could basically represent variation among the original ten agronomic traits. The PCA-based biplot showed that all germplasms were widely separated from each other, suggesting a high level of variability among the investigated materials (Figure 1B). In the first principal components corresponding to the eigenvectors, the traits with higher correlation coefficients were plant height, reproductive tiller length, shoot height and clump basal diameter, with correlation coefficients of 0.36, 0.40, 0.37 and 0.31, respectively. These traits mainly reflected the growth status of P. juncea. The traits with larger correlation coefficients in the corresponding eigenvectors of the second principal component were leaf length, leaf width and canopy diameter, which mainly reflected the leaves growth of P. juncea. The third and fourth principal components corresponded to the eigenvectors of nutritional tiller angle, reproductive tiller number and nutritional tiller number, which mainly reflected important indicators of nutritional and reproductive growth of P. juncea (Table 2). Because the first four principal components reflected 74.81% of the information of the original ten single indicators, and considering traits with a greater influence on the growth and tillering ability of P. juncea, the four indicators plant height, leaf width, nutritional tiller angle and nutritional tiller number were used for comprehensive evaluation of the growth of P. juncea.

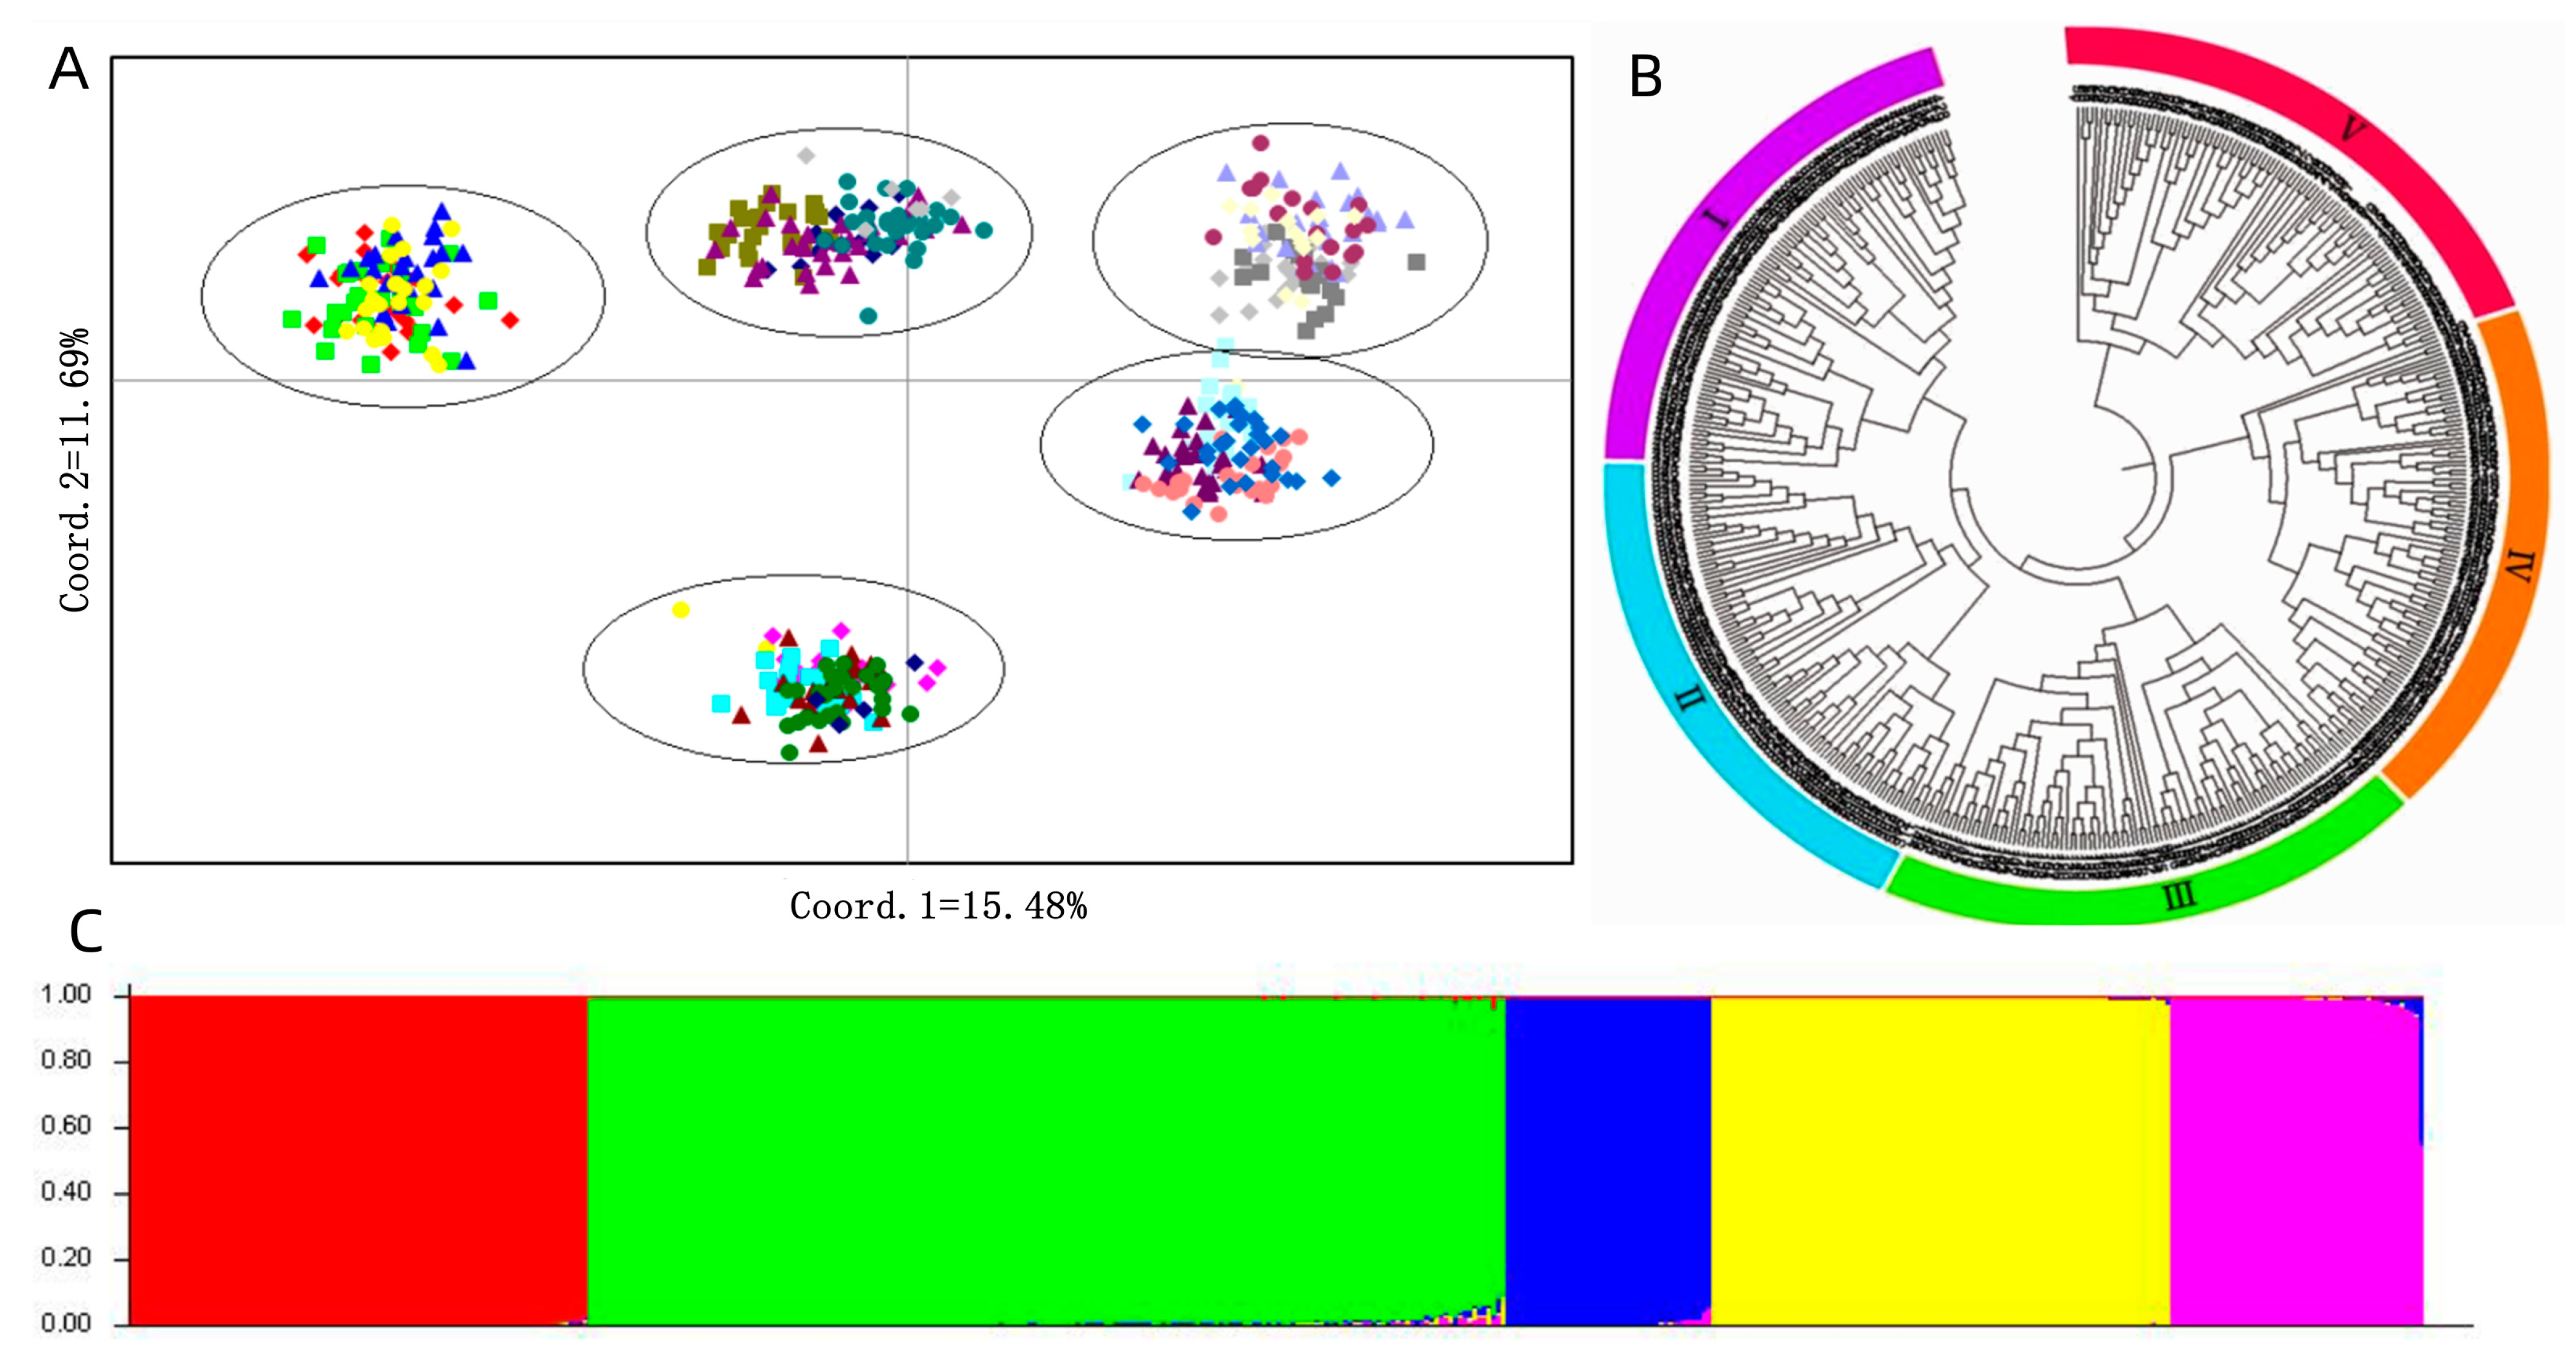
3.2. The Polymorphism of SSR Markers, Genetic Diversity and Population Structure Analysis

In this study, the genetic diversity of the P. juncea population was analyzed using 127 EST-SSR primer pairs, and the results are shown in Supplementary Table S2. The number of observed alleles ranged from 1.333 to 2.000, with an average of 1.957. The number of effective alleles ranged from 1.030 to 2.000, with an average of 1.682. The Shannon’s information index ranged from 0.059 to 0.693, with an average of 0.554. The observed heterozygosity ranged from 0.014 to 0.876, with an average of 0.353, and the expected heterozygosity ranged from 0.027 to 0.500, with an average of 0.379. The polymorphism information content ranged from 0.026 to 0.375, with an average of 0.300. In particular, 101 markers had polymorphism information content greater than 0.25, accounting for 79.5% of all markers.
The results of AMOVA revealed that the genetic differentiation coefficient Fst was 0.341. Of the 480 individual lines, only 18% of the total genetic variance was due to differences within populations, while 34% was due to differences among populations and 48% was ascribed to differences among individuals within the populations (Table 3).
Principal coordinate analysis (PCoA) provided a better understanding of the relationships among the P. juncea population. Results showed that the total variation could be well explained by the first two principal axes, with explanation rates of 15.48% (PC1) and 11.69% (PC2), respectively. The P. juncea population of 480 individual lines were clustered into five groups accordingly (Figure 2A).
The Un-weighted Pair Group Method with Arithmetic Mean (UPGMA) dendrogram showed that all 480 P. juncea individual lines were clustered into five groups (Figure 2B). Each group contained 96 individuals, accounting for 20% of the total. The results of principal component analysis and cluster analysis were basically consistent. There were significant differences in the sources of P. juncea germplasm in each group, and there was no obvious geographic or regional relationship between materials in any group.
The EST-SSR data matrix of 480 individual lines was used for estimating genetic structure. Structure analysis showed that the optimum ∆K was 5 (Figure 2C). The 480 individual line populations were clustered into five groups. In group 1, 96 individual plants clustered into one category. In group 2, 192 individual plants clustered into one category. In group 3, 43 individual plants clustered into one category. In group 4, 96 individual plants clustered into one category, and in group 5, 53 individual plants clustered into one category (Figure 2C; Supplementary Table S3).

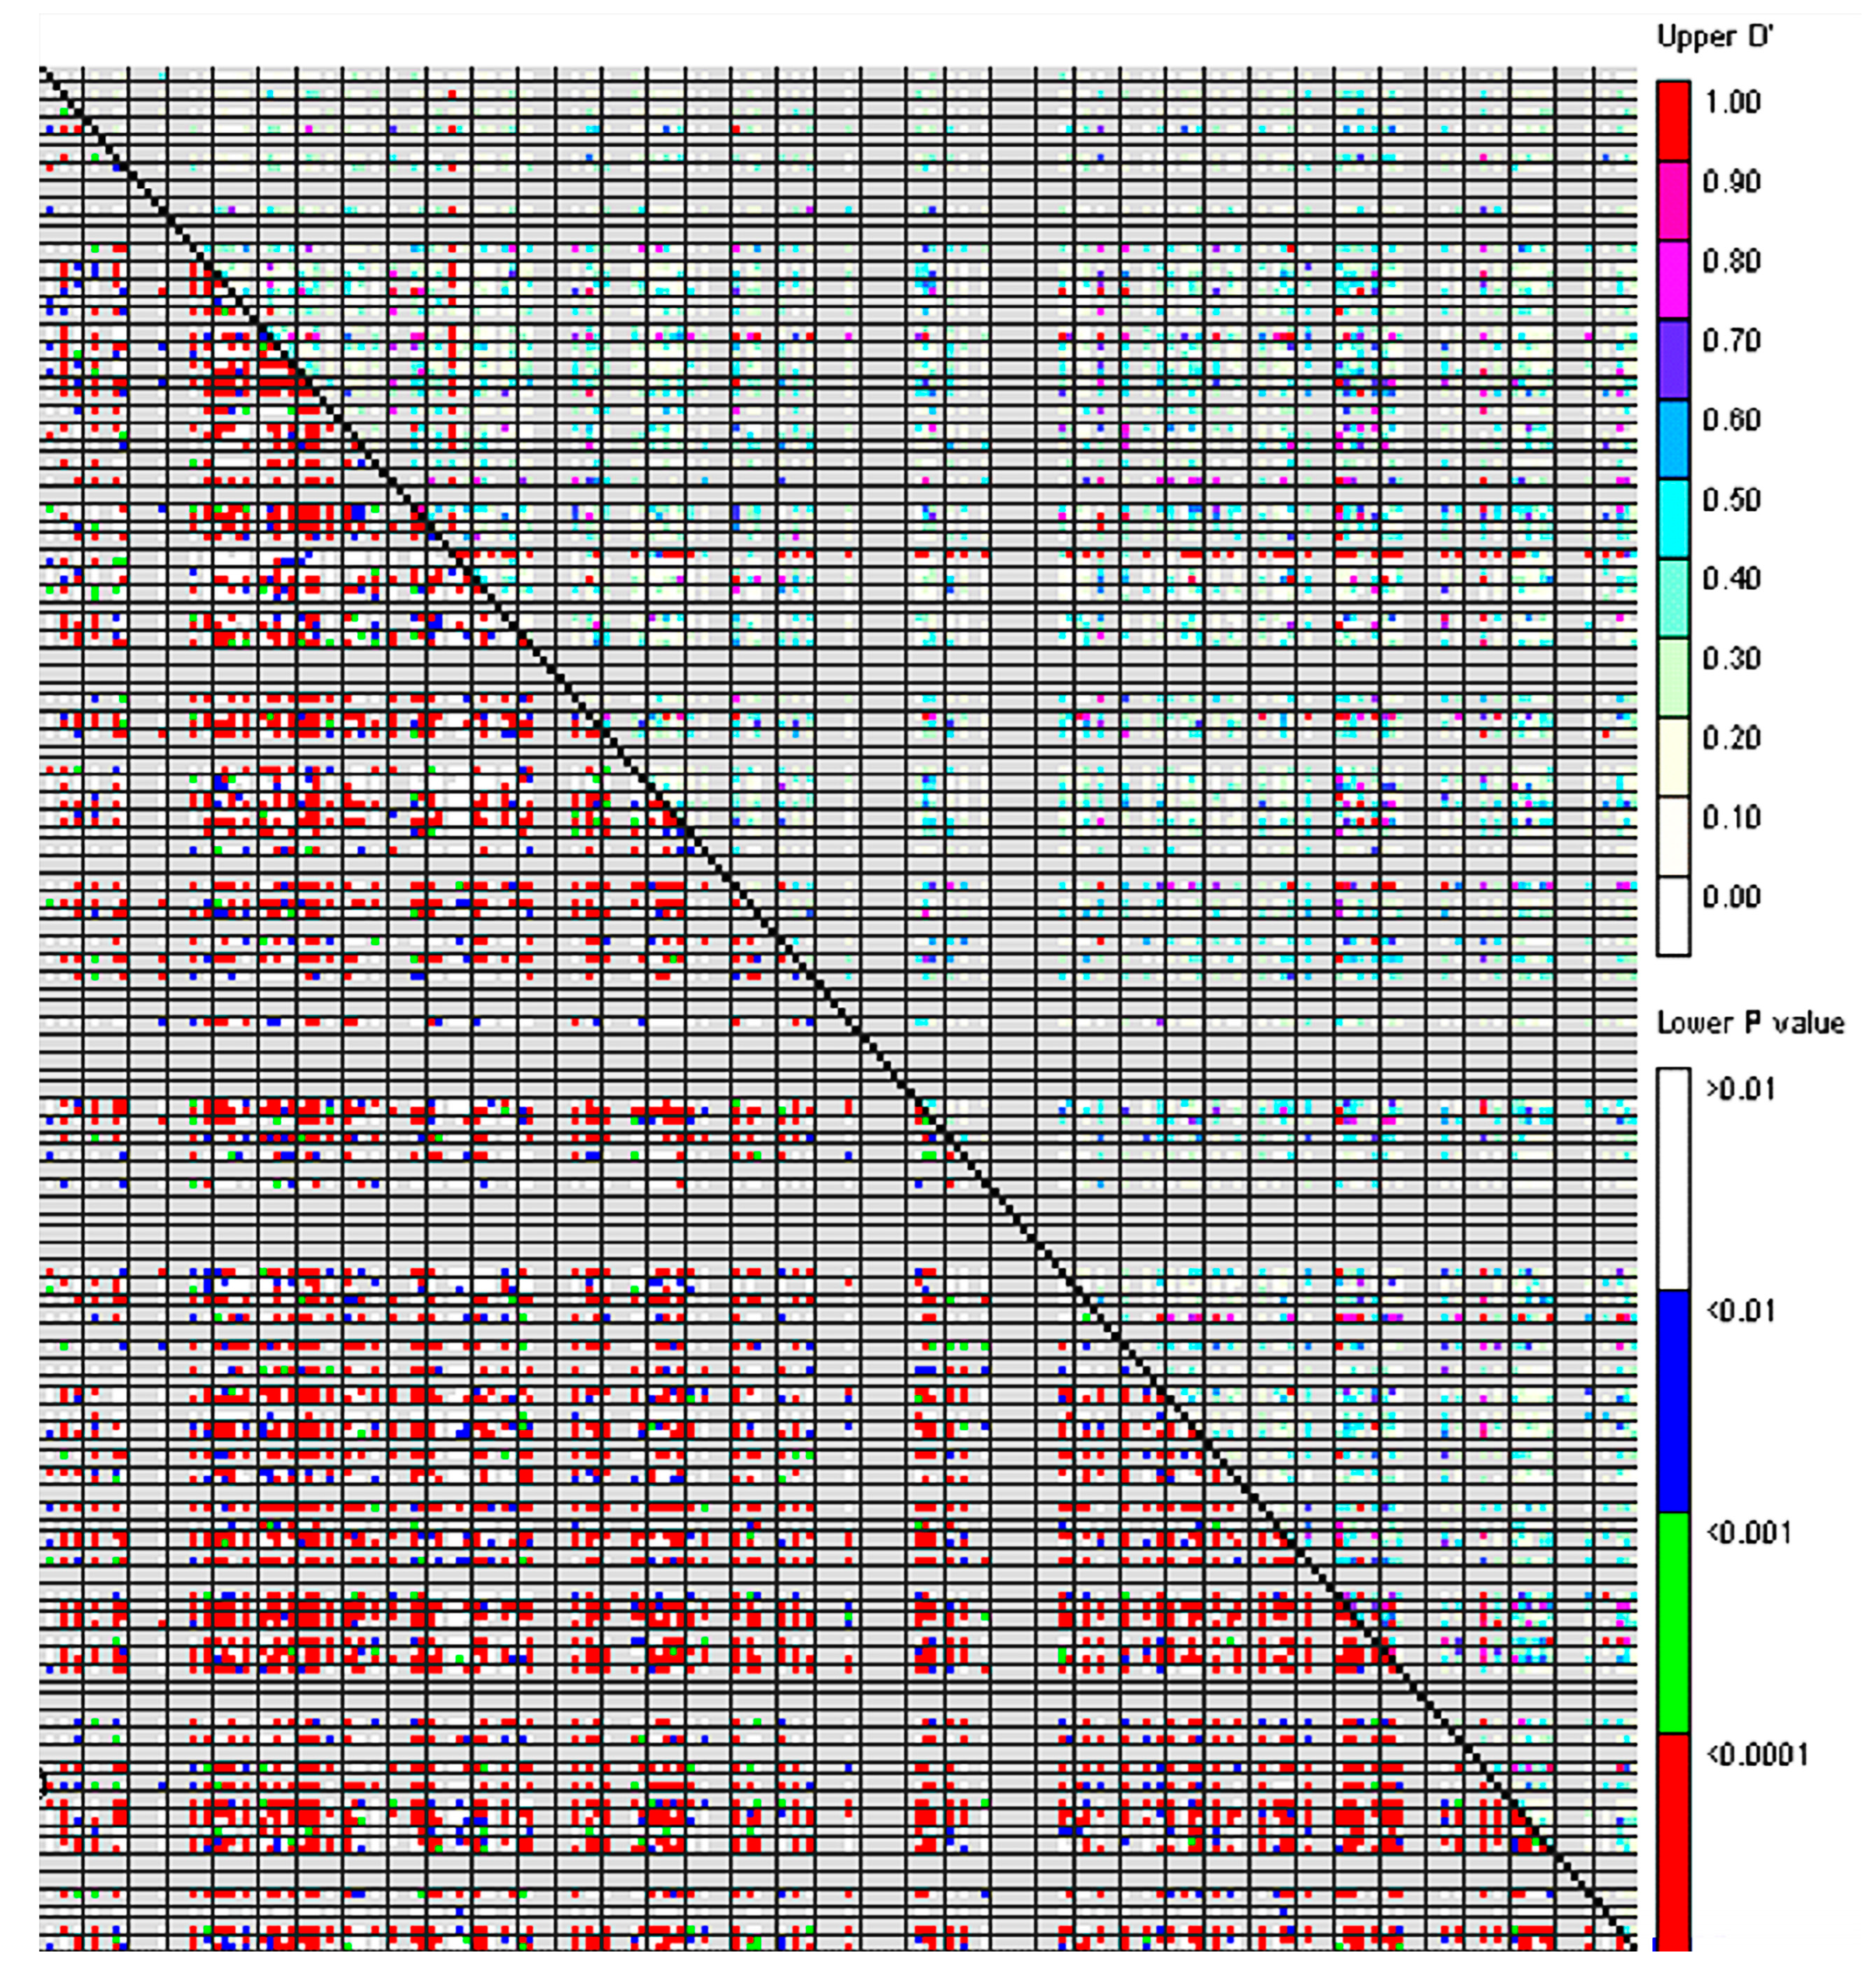
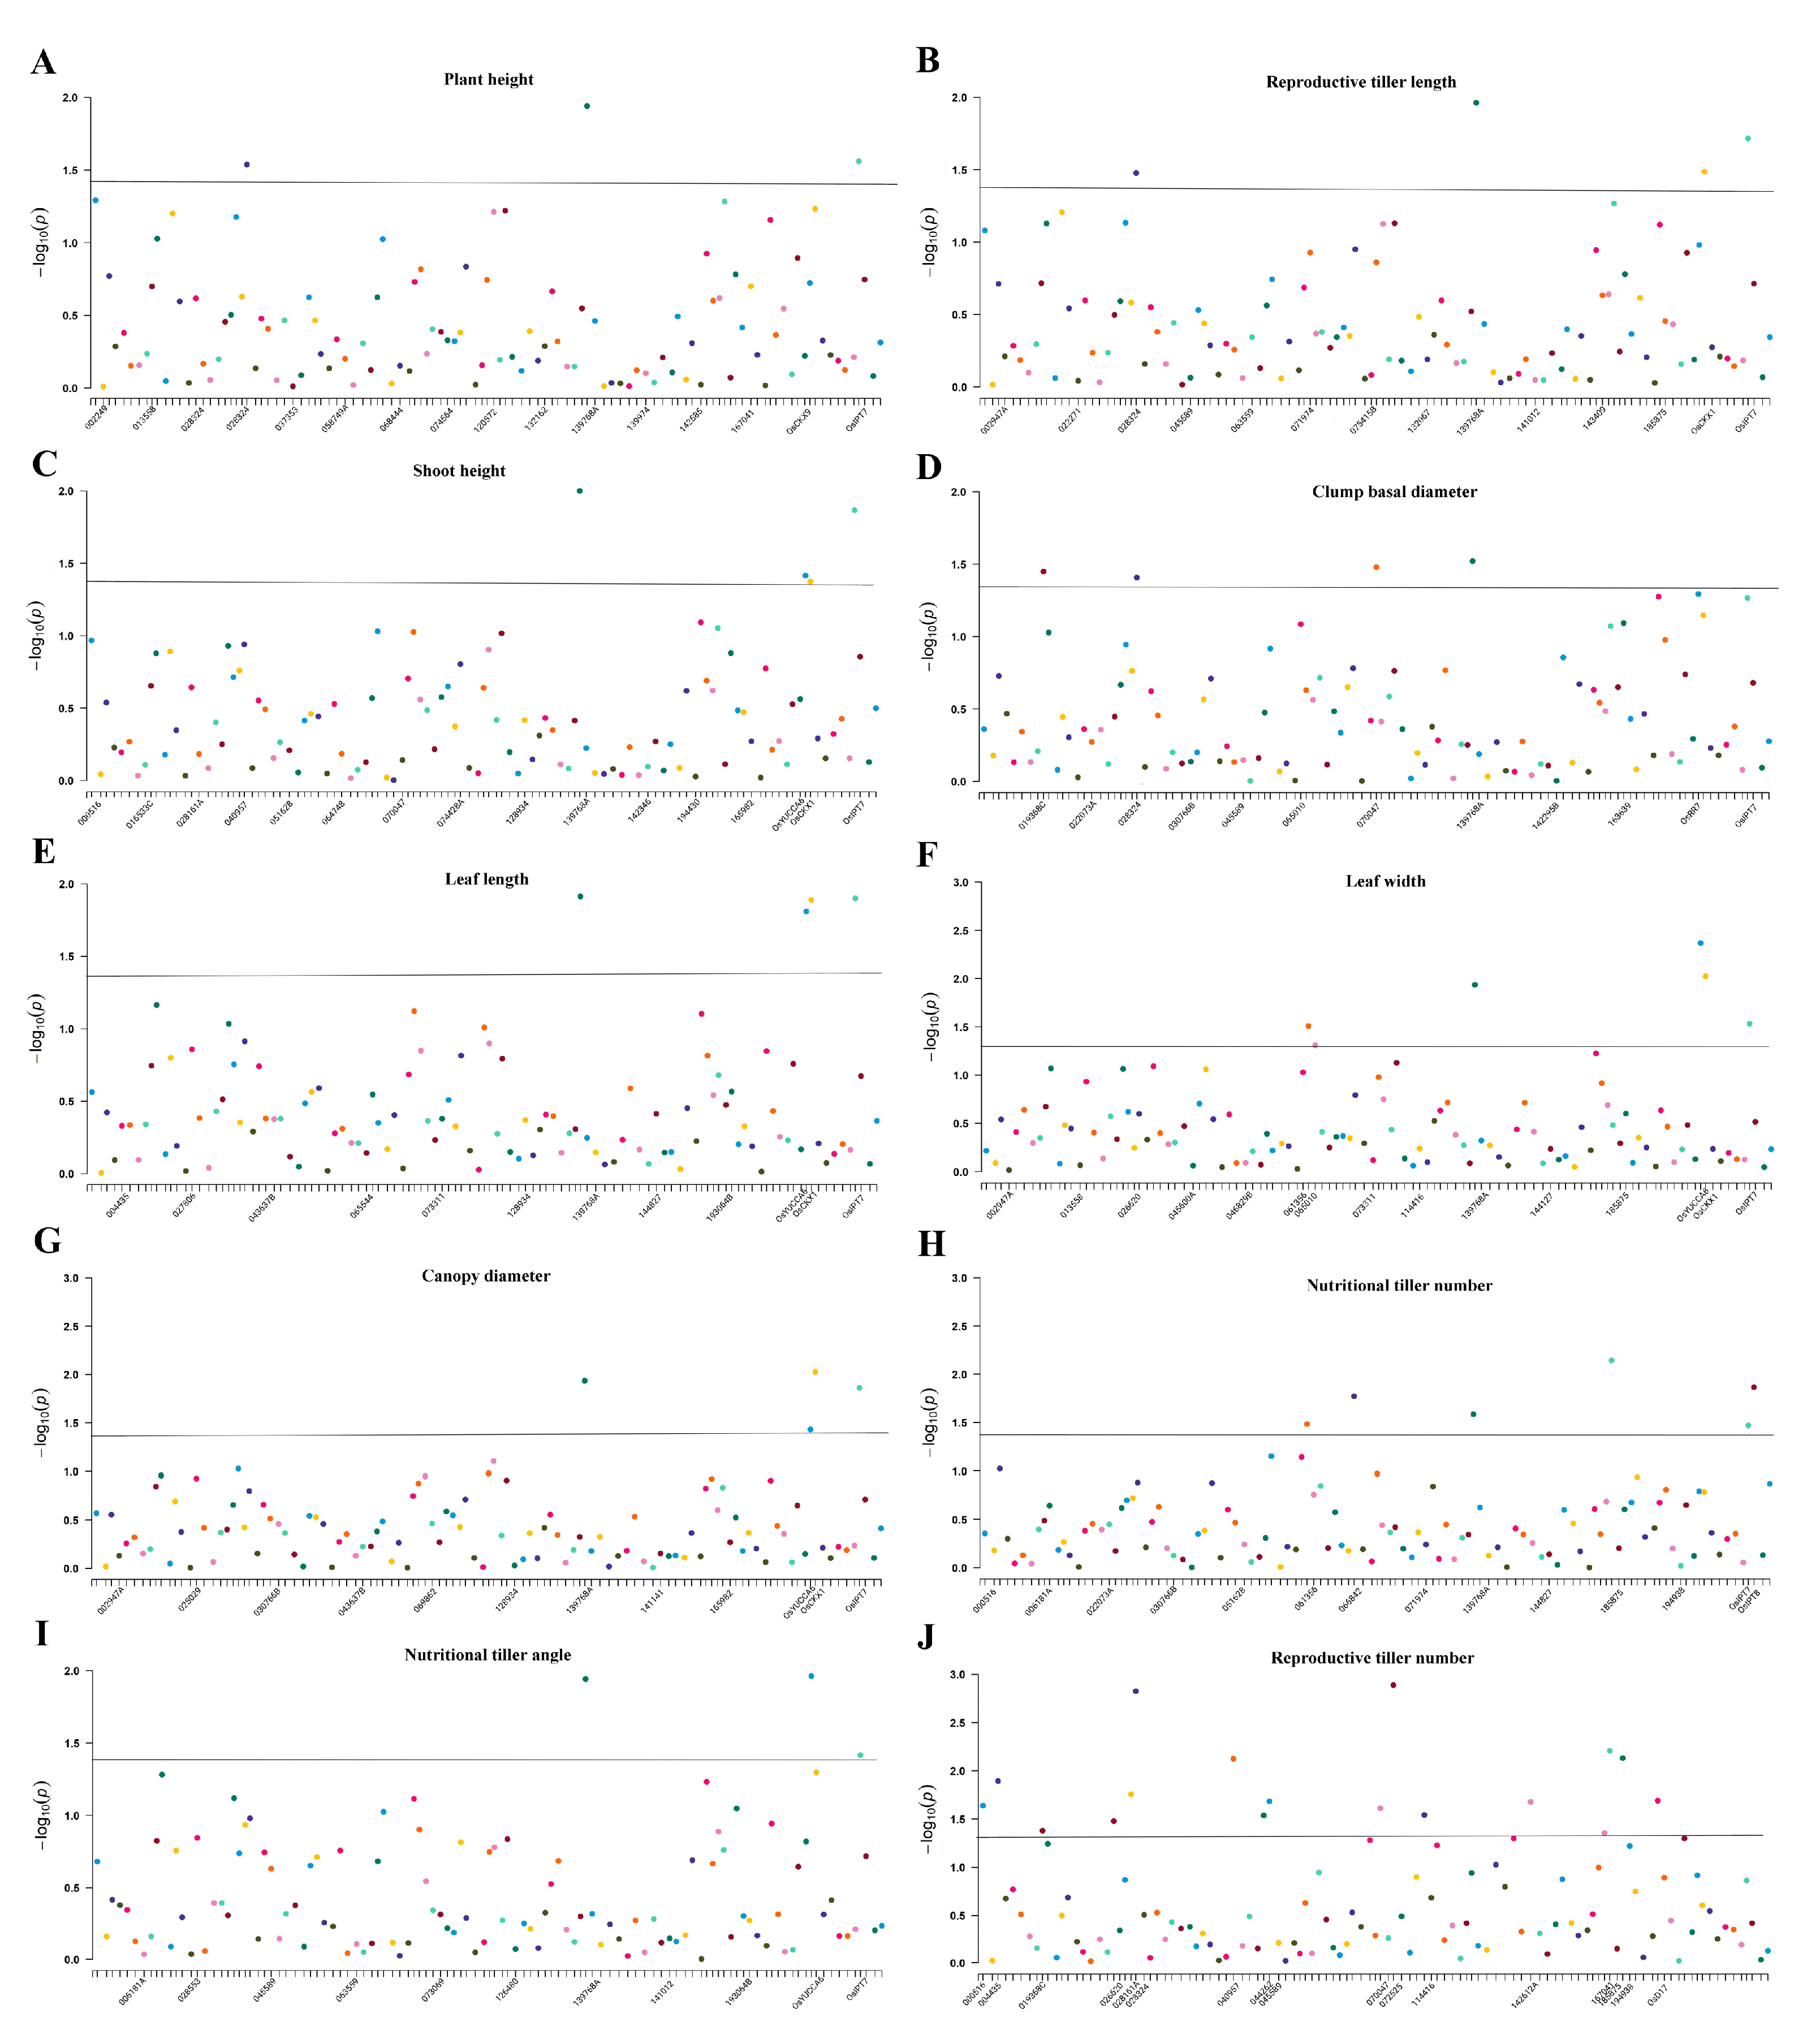
3.3. Linkage Disequilibrium and Association Analysis of the P. juncea Population

Across all loci, 5874 locus pairs were detected in P. juncea individual lines. Among them, 3914 locus pairs (66.63%) were revealed at the p < 0.05 level. The range of D′ was between 0 and 1 (Table 4), and the average value of D′ was 0.3047. The r2 ranged from 0.00 to 0.68, with an average of 0.04. There were 650 combinations with r2 ≥ 0.1, accounting for 11.07% of the total, indicating that the LD level of P. juncea germplasms was relatively low (Figure 3).
The association analysis between ten tiller-related traits and EST-SSR marker data was computed based on the GLM method. At the p < 0.05 level, a total of 55 SSR loci were detected as being associated with ten traits, such as plant height (3), reproductive tiller length (4), shoot height (4), clump basal diameter (4), leaf length (4), leaf width (6), canopy diameter (4), nutritional tiller number (6), nutritional tiller angle (3) and reproductive tiller number (17). The proportion of variation in associated markers explained ranged from 1.060% to 9.210%, with the lowest for marker 000516 associated with reproductive tiller number and the largest for marker OsIPT7 associated with leaf length. Reproductive tiller number was significantly associated with the most numerous loci (i.e., 17 loci), but they all explained a low proportion of variation. This may suggest that the formation of reproductive tillers is regulated by multiple minor genes and is influenced by the environment; hence, the proportion of variation in reproductive tiller number explained by each locus was relatively low. In addition, 9 out of 55 loci were detected as being associated with multiple traits (Table 5; Figure 4). Marker 139768A is associated with nine of ten traits, excluding reproductive tiller number. Marker OsIPT7 is associated with eight of ten traits, excluding clump basal diameter and reproductive tiller number. Marker OsCKX1 is associated with five traits, including reproductive tiller length, shoot height, leaf length, leaf width and canopy diameter. Marker OsYUCCA6 is associated with five traits, including shoot height, leaf length, leaf width, nutritional tiller angle and canopy diameter. Marker 028324 is associated with four traits, including plant height, reproductive tiller length, clump basal diameter and reproductive tiller number. Markers 019368C and 070047 are both associated with two traits: clump basal diameter and reproductive tiller number. Marker 061356 is associated with two traits: leaf width and nutritional tiller number. Marker 185875 is associated with two traits: nutritional tiller number and reproductive tiller number.

4. Discussion

4.1. Phenotyping Analysis of the P. juncea Population

Tillering capacity and plant architecture-related traits are critical for bunch grass improvement, whether as a forage or for vegetation restoration. P. juncea is a cross-pollinated perennial plant. The ten phenotypic traits investigated in this study showed great variation, especially reproductive tiller number and nutritional tiller number, and revealed a complex genetic background for the quantitative traits of this cross-pollinated species.
Simple statistical analysis of ten phenotypic traits related to tillering of P. juncea showed that the coefficient of variation of the reproductive tiller number was the most obvious, followed by the nutritional tiller number (Table 1), which suggested a relatively complex regulating mechanism of tillering ability in this bunch grass. The germplasm materials selected in this study were from eight countries and regions, including China, Mongolia, Russia and the United States. There was a large genetic distance between germplasms, and the related genes varied greatly in the population.
Correlation analysis showed that plant height and reproductive tiller length were significantly positively correlated with all traits (p < 0.01). Plant height is an important agronomic trait of forage plants that can represent growth and development ability and can also reflect the biomass yield potential of forage plants [39]. Plant height is also significantly related to seed yield in crop plants, and appropriate plant height can increase the seed yield of wheat [40].
Several reports have indicated that PCA is an efficient multivariate method to display the level of phenotypic variation and identify associations between measured traits. PCA is a multivariate statistical method that transforms multiple indicators into several comprehensive indicators with little loss of information [41]. In this study, PCA showed that four components captured 74.81% of the total variation among the ten traits (Figure 1B). Further analysis of the relationship between trait vectors showed that the tillering angle had no correlation with clump basal diameter, leaf width or canopy diameter, which was consistent with the correlation analysis results. Further analysis of the first four principal components revealed that the four independent comprehensive indicators could represent the original ten agronomic traits. The first principal component mainly reflected the growth height of each part of the plant, the second principal component represented the growth of plant leaves, and the third and fourth principal components mainly reflected the plant’s tillering ability. Among the ten traits, plant height, leaf width, nutritional tiller angle and nutritional tiller number could be used to comprehensively evaluate the overall growth of P. juncea.

4.2. Genetic Diversity Analysis of P. juncea Material

Genetic diversity analysis is widely used in the evaluation of biodiversity, mainly to reveal biological genetic information and the genetic variation between different germplasms [42]. Plants will mutate in the process of adapting to environmental changes. The better the adaptability of plants to the environment, the greater the degree of variation and the higher the genetic diversity [43]. With the development of molecular marker technology, genetic diversity analysis has been widely used in Triticum aestivum [44,45], Lolium perenne [46,47], Medicago sativa [48] and other plants. Pour-Aboughadareh et al. [49] used the ISSR technique to reveal high genetic diversity among Triticum boeoticum populations collected from different regions of Iran. Nie et al. [50] used SSR markers to analyze the genetic diversity of ryegrass, and the results showed that the ryegrass germplasm had high genetic diversity. In this study, the polymorphism content of 79.5% of primers was greater than 0.25, indicating a high level of primer polymorphism. The Shannon’s information index can also be used as a parameter to evaluate genetic diversity. In this study, the average value of I was 0.554, which was derived from the analysis of 127 SSR primer pairs, and was slightly higher than that of 0.420 quantified in a P. juncea population using 103 EST-SSR primer pairs by Li et al. [34]. In summary, the primers selected in this study reasonably reflected the genetic diversity of P. juncea, and indicated a relatively high level of genetic diversity in the P. juncea population. Genetic variation within the individuals (48%) was higher than that among populations (34%) in the present study. P. juncea is a cross-pollinated plant species, and a high level of gene exchange between plant individuals contributes to the high level of genetic variation.

4.3. Population Structure of P. juncea Germplasm Resources

Population structure analysis is an effective way to reveal the genetic characteristics of germplasm and is a necessary prerequisite for association analysis that can effectively eliminate false associations caused by false positives in the association process [13]. The P. juncea germplasm in the present study was clustered into five groups based on PCoA, UPGMA, and STRUCTURE analyses. The classification groups of the 480 P. juncea individual materials indicated via PCoA and UPGMA were basically consistent with the analysis of population genetic structure, but some individual materials were clustered into different groups when classified using different methods. The results of the three methods showed that the classification of P. juncea with simpler genetic structures was basically consistent, while those with more complex genetic structures were classified into different groups. This difference indicates P. juncea high breeding and hybridization potential. The division of groups did not show obvious geographical relationships among P. juncea germplasm. This may be due to the cross-pollination and self-incompatibility of P. juncea, resulting in continuous gene exchange between materials from different regions during the breeding process, suggesting that P. juncea gradually shows a more consistent genetic differentiation, which is similar to the results of Yu et al. [29].

4.4. Linkage Disequilibrium Analysis of P. juncea Population

Linkage disequilibrium analysis is the basis of association analysis. The size of the LD value has an influence on the accuracy of the correlation analysis. Therefore, LD analysis is a fundamental step in association analysis. The degree of LD between loci can be reflected in the D′ value and r2 [51,52]. Qi et al. [20] used SSR markers to analyze the linkage disequilibrium of barley populations and found that the range of D′ values was mainly concentrated between 0 and 0.6, accounting for 82.06% of the paired 992 SSR marker sites. Wang et al. [53] used 262 SSR markers to analyze rice populations and found that 5305 pairs showed significant LD (based on D′, p < 0.05), accounting for 15.52% of all pairs of loci, with a D′ value of 0.76. In this study, it was found that D′ was mainly concentrated in the range 0–0.4, accounting for 74.29% of all pairs of loci. The linkage disequilibrium coefficient (r2) was between 0.00 and 0.68, with an average of 0.04. The level of linkage disequilibrium between loci was lower than those of barley and rice, which may be because the germplasm affected the LD value by constantly changing the outcrossing rate in the process of breeding and selection. It may also be due to the wide geographic range of the source of P. juncea germplasm and the population’s high genetic diversity level, so the germplasm population contained a variety of different genes, resulting in a low LD level [54].

4.5. Association Analysis of P. juncea

Association analysis can link plant genotypes with phenotypes, and the results of population structure can be used as covariates for association analysis, which can improve the credibility of association analysis. Therefore, the Q value was used as a covariate to control false positive pseudo-association in the association analysis, and the contribution rate can be used to express the degree of influence of the associated loci on the traits [55]. Tillering capacity and plant architecture-related traits are quantitative traits. In the process of plant breeding, certain breeding purposes can be achieved by altering quantitative traits [56,57]. However, quantitative traits are complex and controlled by multiple genes, added to which there are different degrees of variation among genes, which makes the research more difficult [58,59]. Therefore, it is essential to use association analysis to clarify the correlation between genotype and phenotype.
After detecting a high level of genetic and molecular variability in the studied germplasm, we used a GLM model-based marker–trait association analysis (MTA) to incorporate phenotypic and genotypic data [60]. The results of the association analysis indicated that the GLM model was effective in detecting significant MTAs in the perennial grass P. juncea. This finding is in agreement with previous reports showing a high efficiency of the GLM method to identify significant associations in crop plants [61,62]. To date, association analysis has been widely used in plant breeding for barley [63], soybean [64] and cotton [65], but there have been no reports of association analysis for P. juncea.
In this study, a total of 55 markers were detected as being associated with ten agronomic traits, with a contribution rate of 1.060%~9.210%. The marker with the highest contribution was OsIPT7, with a contribution rate of 7.07–9.21%. Further analysis revealed that one locus was associated with multiple traits and one trait was associated with multiple loci. Referring to the existing literature, we noticed that Lai [66] conducted association analysis on 55 barley varieties and found that five traits, including plant height, spike length, stem length, thousand-grain weight, and whole growth period, were associated with 4, 6, 4, 6 and 2 SSR loci, respectively. In our study, each trait was associated with 3–17 markers, among which reproductive tiller number was associated with the largest number of loci (i.e., 17). However, the overall contribution rates of each locus were relatively low, and the differences among them were small. We speculate that this may be due to the fact that the reproductive tiller number trait is controlled by multiple minor genes, so the contribution rates of each locus to the variation in the number of reproductive tillers are relatively low [67]. In this experiment, a total of nine loci associated with multiple traits were found, which were markers 028324 (4), 139768A (9), OsCKX1 (5), OsIPT7 (8), 185875 (2), OsYUCCA6 (5), 019368C (2), 070047 (2) and 061356 (2). Correlation analysis of ten different traits found that the correlation between many traits reached a statistically high or extremely high significance level. At the same time, the principal component analysis converted the ten traits into four comprehensive indicators for a detailed evaluation of P. juncea germplasm. Therefore, we speculate that this phenomenon may be due to the genetic correlation of these traits in inheritance. Further analysis of nine multiple traits-associated loci, found that SSR markers amplified from primers designed from the Oryza sativa genome, OsCKX1, OsIPT7, and OsYUCCA6 were associated with more traits in P. juncea. These loci have been reported to be related to tillering and growth ability in rice. These results suggested the high efficiency of using genetically close model species genes to develop primers for non-model plant species plant growth, development, and tillering traits [68,69,70]. In our previous research, we also screened a large number of genes related to the growth and development of P. juncea, including CKX, IPT, and YUCCA genes. That research found that YUCCA is a key gene in the IAA biosynthesis pathway controlling the growth of tillering buds in P. juncea. We also found that IPT and CKX can affect cytokinin content in P. juncea. CTK is mainly synthesized in the root and transported upward in the xylem through transpiration, which can relieve the apical dominance caused by IAA and affect the growth and development of tillers and the number of tillers by promoting the germination and elongation of tiller buds [71,72]. Therefore, the overexpression of IPT and the low expression of CKX are clear ways to increase CTK levels and yields by increasing the tiller number in P. juncea [73]. In addition, we cloned the three genes and analyzed the expression of the genes and protein function. The results showed that YUCCA is a down-regulated gene for tillering in P. juncea, and its subcellular localization was in the cytoplasm [74]. IPT is an up-regulated gene that regulates tillering in P. juncea, and its subcellular localization was in the chloroplasts [75]. CKX gene plays a down-regulated role in regulating the tillering of P. juncea, located subcellular within the cell [76]. Transient transfection and Western blot of the three genes showed that the proteins could be expressed normally. The phylogenetic tree showed that P. juncea had the closest relationship with Triticum aestivum L. and other wheat crops. These results can provide a theoretical basis for the verification of gene function and precise improvement of traits in P. juncea. In this study, OsCKX1, OsIPT7, and OsYUCCA6 also showed strong associations, which provides a theoretical reference for genetic improvement and molecular marker-assisted breeding of P. juncea germplasm resources in the future. At the same time, we also found that the marker 028324 and the marker 139768A were associated with multiple traits. Although their contribution rates were low, statistical significance was relatively high, indicating a significant correlation between the locus and the traits. This result has great significance for the subsequent development of P. juncea-specific trait markers. Surprisingly, in our study, it was found that plant height and reproductive tiller length were highly significantly correlated with all traits (p < 0.01). In association analysis, the loci associated with plant height and reproductive tiller length were also associated with multiple other traits. Therefore, selecting traits with strong correlations may also be a consideration when assessing associations between a given locus and multiple traits, as was also pointed out by Jia [77] in his research on Elymus sibiricus L.

5. Conclusions

In this study, phenotypic analysis was undertaken of ten tiller-related traits of 480 P. juncea germplasms. We found that there was significant genetic variability, resulting in rich phenotypic variation in ten traits of P. juncea. Further association analysis was conducted on the ten phenotypic traits, and EST-SSR molecular markers of P. juncea and 55 SSR loci related to tillering and architecture-related traits were screened. These results provided basic data and a theoretical reference for genetic improvement and molecular marker-assisted breeding of P. juncea and other perennial grass species.

Supplementary Materials

The following supporting information can be downloaded at: https://www.mdpi.com/article/10.3390/genes14101970/s1, Table S1: SSR primer information; Table S2: Genetic diversity analysis using SSR markers of P. juncea; Table S3: Q value of 480 P. juncea individuals in five groups.

Author Contributions

Conceptualization, L.Y.; Methodology, L.Y.; Software, Z.L. and T.W.; Validation, L.Y., Y.W. and F.S.; Formal Analysis, Z.L.; Investigation, Z.L. and X.R.; Resources, L.Y.; Writing—Original Draft Preparation, Z.L.; Writing—Review and Editing, L.Y. and Z.L. All authors have read and agreed to the published version of the manuscript.

Funding

This research was funded by a Key Project of the Natural Science Foundation of Inner Mongolia of China, grant number 2023ZD07 and the National Natural Science Foundation of China, grant number 32371762.

Institutional Review Board Statement

Not applicable.

Informed Consent Statement

Not applicable.

Data Availability Statement

The raw sequencing reads in this study are available in the Sequence Read Archive (SRA) database (accession number PRJNA789128).

Conflicts of Interest

The authors declare no conflict of interest.

References

  1. Wei, J.Z.; Campbell, W.F.; Wang, R.R.C. Genetic Variability in Russian Wildrye (Psathyrostachys juncea) Assessed by RAPD. Genet. Resour. Crop Evol. 1997, 44, 117–125. [Google Scholar] [CrossRef]
  2. Wang, Q.Z.; Zhang, T.J.; Cui, J.; Wang, X.G.; Zhou, H.; Han, J.G.; Ren, E.; Gislum, R. Path and Ridge Regression Analysis of Seed Yield and Seed Yield Components of Russian Wildrye (Psathyrostachys juncea Nevski) under Field Conditions. PLoS ONE 2011, 6, e18245. [Google Scholar] [CrossRef]
  3. John, D.B.; Ronald, E.R. Development and Vigor of Diploid and Tetraploid Russian Wildrye Seedlings. J. Range Manag. 1997, 50, 80–84. [Google Scholar]
  4. Wang, Z.Y.; Bell, J.; Lehmann, D. Transgenic Russian Wildrye (Psathyrostachys juncea) Plants Obtained by Biolistic Transformation of Embryogenic Suspension Cells. Plant Cell Rep. 2004, 22, 903–909. [Google Scholar] [CrossRef] [PubMed]
  5. Lawrence, T.; Ratzlaff, C.D. Performance of Some Native and Introduced Grasses in a Semiarid Region of Western Canada. Can. J. Plant Sci. 1989, 69, 251–254. [Google Scholar] [CrossRef]
  6. Jefferson, P.; Muri, R. Competition, Light Quality and Seedling Growth of Russian Wildrye Grass (Psathyrostachys juncea). Acta Agron. Hung. 2007, 55, 49–60. [Google Scholar] [CrossRef]
  7. Tan, Q.Y.; Zhu, H.T.; Liu, H.; Ni, Y.R.; Wu, S.Z.; Luan, X.; Liu, J.W.; Yang, W.F.; Yang, Z.F.; Zeng, R.Z.; et al. Fine Mapping of QTLs for Stigma Exsertion Rate from Oryza glaberrima by Chromosome Segment Substitution. Rice Sci. 2022, 29, 55–66. [Google Scholar]
  8. Ding, Y.; Zhang, X.; Ma, Q.; Li, F.; Tao, R.; Zhu, M.; Li, C.; Zhu, X.; Guo, W.; Ding, J. Tiller Fertility Is Critical for Improving Grain Yield, Photosynthesis, and Nitrogen Efficiency in Wheat. J. Integr. Agric. 2023, 22, 2054–2066. [Google Scholar] [CrossRef]
  9. Liu, Y.; Wang, R.; Hu, Y.; Chen, J. Genome-Wide Linkage Mapping of Quantitative Trait Loci for Late-Season Physiological and Agronomic Traits in Spring Wheat under Irrigated Conditions. Agronomy 2018, 8, 60. [Google Scholar] [CrossRef]
  10. Yin, Y.; An, W.; Zhao, J.; Li, Y.; Fan, Y.; Chen, J.; Cao, Y.; Zhan, X. Constructing the Wolfberry (Lycium spp.) Genetic Linkage Map Using AFLP and SSR Markers. J. Integr. Agric. 2022, 21, 131–138. [Google Scholar] [CrossRef]
  11. Alahmad, S.; El Hassouni, K.; Bassi, F.M.; Dinglasan, E.; Youssef, C.; Quarry, G.; Aksoy, A.; Mazzucotelli, E.; Juhász, A.; Able, J.A.; et al. A Major Root Architecture QTL Responding to Water Limitation in Durum Wheat. Front. Plant Sci. 2019, 10, 436. [Google Scholar] [CrossRef]
  12. Sukumaran, S.; Reynolds, M.P.; Sansaloni, C. Genome-Wide Association Analyses Identify QTL Hotspots for Yield and Component Traits in Durum Wheat Grown under Yield Potential, Drought, and Heat Stress Environments. Front. Plant Sci. 2018, 9, 81. [Google Scholar] [CrossRef] [PubMed]
  13. Flint-Garcia, S.A.; Thornsberry, J.M.; Buckler, E.S. Structure of Linkage Disequilibrium in Plants. Annu. Rev. Plant Biol. 2003, 54, 357–374. [Google Scholar] [CrossRef] [PubMed]
  14. Iqbal, I.; Desta, Z.A.; Tripathi, R.K.; Beattie, A.; Badea, A.; Singh, J. Interaction and association analysis of malting related traits in barley. PLoS ONE 2023, 17, e0283763. [Google Scholar] [CrossRef] [PubMed]
  15. Li, Q.; Lu, X.L.; Wang, C.J.; Shen, L.; Dai, L.P.; He, J.L.; Yang, L.; Li, P.Y.; Hong, Y.; Zhang, Q.; et al. Genome-wide association study and transcriptome analysis reveal new QTL and candidate genes for nitrogen-deficiency tolerance in rice. Crop J. 2022, 10, 942–951. [Google Scholar] [CrossRef]
  16. Hosseini, M.S.; Ebrahimi, M.; Samsampour, D.; Abadía, J.; Khanahmadi, M.; Amirian, R.; Ghafoori, I.N.; Ghaderi-Zefrehei, M.; Gogorcena, Y. Association Analysis and Molecular Tagging of Phytochemicals in the Endangered Medicinal Plant Licorice (Glycyrrhiza glabra L.). Phytochemistry 2021, 183, 112629. [Google Scholar] [CrossRef]
  17. Mehrabi, A.A.; Pour-Aboughadareh, A.; Mansouri, S.; Hosseini, A. Genome-Wide Association Analysis of Root System Architecture Features and Agronomic Traits in Durum Wheat. Mol. Breed. 2020, 40, 55. [Google Scholar] [CrossRef]
  18. Holland, J. Genetic Architecture of Complex Traits in Plants. Curr. Opin. Plant Biol. 2007, 10, 156–161. [Google Scholar] [CrossRef]
  19. He, F.; Wei, C.; Zhang, Y.; Long, R.; Li, M.; Wang, Z.; Yang, Q.; Kang, J.; Chen, L. Genome-Wide Association Analysis Coupled With Transcriptome Analysis Reveals Candidate Genes Related to Salt Stress in Alfalfa (Medicago sativa L.). Front. Plant Sci. 2022, 12, 826584. [Google Scholar] [CrossRef]
  20. Qi, T.T.; Liu, H.Y.; Si, E.J.; Meng, Y.X.; Wang, C.J.; Wang, H.J. SSR Markers and Linkage Unbalance Analysis of Different Barley Materials. Mol. Plant Breed. 2021, 9, 1–18. [Google Scholar]
  21. Li, C.; Wang, Y.; Ai, N.; Li, Y.; Song, J. A Genome-wide Association Study of Early-maturation Traits in Upland Cotton Based on the CottonSNP80K Array. J. Integr. Plant Biol. 2018, 60, 970–985. [Google Scholar] [CrossRef]
  22. Ogrodowicz, P.; Mikołajczak, K.; Kempa, M.; Mokrzycka, M.; Krajewski, P.; Kuczyńska, A. Genome-Wide Association Study of Agronomical and Root-Related Traits in Spring Barley Collection Grown under Field Conditions. Front. Plant Sci. 2023, 14, 1077631. [Google Scholar] [CrossRef] [PubMed]
  23. Daudi, H.; Shimelis, H.; Mathew, I.; Oteng-Frimpong, R.; Ojiewo, C.; Varshney, R.K. Genetic Diversity and Population Structure of Groundnut (Arachis hypogaea L.) Accessions Using Phenotypic Traits and SSR Markers: Implications for Rust Resistance Breeding. Genet. Resour. Crop Evol. 2021, 68, 581–604. [Google Scholar] [CrossRef] [PubMed]
  24. Mishal, K.; Rehana, K.; Armghan, S.; Ghulam, M.A.; Sania, B. Screening and validation of salt-stress responsive cg-SSR markers in wheat (Triticum aestivum L.) germplasm of Pakistan. Mol. Biol. Rep. 2023, 50, 5931–5940. [Google Scholar]
  25. Sainan, M.; Han, C.Y.; Jie Zhou, J.; Hu, R.C.; Jiang, X.; Wu, F.F.; Tian, K.; Nie, G.; Zhang, X.Q. Fingerprint identification of white clover cultivars based on SSR molecular markers. Mol. Biol. Rep. 2020, 47, 8513–8521. [Google Scholar]
  26. Li, F.; Peng, J. Genetic and Association Mapping Study of English Grain Aphid Resistance and Tolerance in Bread Wheat Germplasm. J. Integr. Agric. 2014, 13, 40–53. [Google Scholar] [CrossRef]
  27. Pour-Aboughadareh, A.; Jadidi, O.; Shooshtari, L.; Poczai, P.; Mehrabi, A.A. Association Analysis for Some Biochemical Traits in Wild Relatives of Wheat under Drought Stress Conditions. Genes 2022, 13, 1491. [Google Scholar] [CrossRef]
  28. Breseghello, F.; Sorrells, M.E. Association Mapping of Kernel Size and Milling Quality in Wheat (Triticum aestivum L.) Cultivars. Genetics 2006, 172, 1165–1177. [Google Scholar] [CrossRef]
  29. Yu, X.; Bai, G.; Liu, S.; Luo, N.; Wang, Y.; Richmond, D.S.; Pijut, P.M.; Jackson, S.A.; Yu, J.; Jiang, Y. Association of Candidate Genes with Drought Tolerance Traits in Diverse Perennial Ryegrass Accessions. J. Exp. Bot. 2013, 64, 1537–1551. [Google Scholar] [CrossRef]
  30. Yu, X.; Bai, G.; Luo, N.; Chen, Z.; Liu, S.; Liu, J.; Warnke, S.E.; Jiang, Y. Association of Simple Sequence Repeat (SSR) Markers with Submergence Tolerance in Diverse Populations of Perennial Ryegrass. Plant Sci. 2011, 180, 391–398. [Google Scholar] [CrossRef]
  31. Nie, G.; Tang, L.; Zhang, Y.J.; Huang, L.K.; Ma, X.; Cao, X.; Pan, L.; Zhang, X.; Zhang, X.Q. Development of SSR Markers Based on Transcriptome Sequencing and Association Analysis with Drought Tolerance in Perennial Grass Miscanthus from China. Front. Plant Sci. 2017, 8, 801. [Google Scholar] [CrossRef]
  32. Yan, H.D.; Zhang, Y.; Zeng, B.; Yin, G.H.; Zhang, X.Q.; Ji, Y.; Huang, L.K.; Jiang, X.M.; Liu, X.C.; Peng, Y. Genetic Diversity and Association of EST-SSR and SCoT Markers with Rust Traits in Orchardgrass (Dactylis glomerata L.). Molecules 2016, 21, 66. [Google Scholar] [CrossRef] [PubMed]
  33. Ming, S.; Zhang, C.L.; Zhang, X.Q.; Fan, Y.; Fu, K.X.; Wu, W.D.; Bai, S.Q.; Zhang, J.B.; Peng, Y.; Huang, L.K. AFLP assessment of genetic variability and relationships in an Asian wild germplasm collection of Dactylis glomerata L. Comptes Rendus Biol. 2017, 340, 145–155. [Google Scholar]
  34. Li, Z.; Yun, L.; Gao, Z.; Wang, T.; Ren, X.; Zhao, Y. EST-SSR Primer Development and Genetic Structure Analysis of Psathyrostachys juncea Nevski. Front. Plant Sci. 2022, 13, 837787. [Google Scholar] [CrossRef]
  35. Khan, M.A.; Von Witzke-Ehbrecht, S.; Maass, B.L.; Becker, H.C. Relationships among Different Geographical Groups, Agro-Morphology, Fatty Acid Composition and RAPD Marker Diversity in Safflower (Carthamus tinctorius). Genet. Resour. Crop Evol. 2009, 56, 19–30. [Google Scholar] [CrossRef]
  36. Gao, Z.; Yun, L.; Li, Z.; Liu, Q.; Zhang, C.; Ma, Y.; Shi, F. Hybrid Purity Identification Using EST-SSR Markers and Heterosis Analysis of Quantitative Traits of Russian Wildrye. Peer J. 2022, 10, e14442. [Google Scholar] [CrossRef]
  37. Bates, D.; Mächler, M.; Bolker, B.; Walker, S. Fitting Linear Mixed-Effects Models Using Lme4. J. Stat. Soft. 2015, 67, 1–48. [Google Scholar] [CrossRef]
  38. Evanno, G.; Regnaut, S.; Goudet, J. Detecting the Number of Clusters of Individuals Using the Software Structure: A Simulation Study. Mol. Ecol. 2005, 14, 2611–2620. [Google Scholar] [CrossRef] [PubMed]
  39. Annicchiarico, P. Alfalfa Forage Yield and Leaf/Stem Ratio: Narrow-Sense Heritability, Genetic Correlation, and Parent Selection Procedures. Euphytica 2015, 205, 409–420. [Google Scholar] [CrossRef]
  40. Gao, Z.; Wang, Y.; Tian, G.; Zhao, Y.; Li, C.; Cao, Q.; Han, R.; Shi, Z.; He, M. Plant Height and Its Relationship with Yield in Wheat under Different Irrigation Regime. Irrig. Sci. 2020, 38, 365–371. [Google Scholar] [CrossRef]
  41. Ma, L.; Qing, C.; Zhang, M.; Zou, C.; Pan, G.; Shen, Y. GWAS with a PCA Uncovers Candidate Genes for Accumulations of Microelements in Maize Seedlings. Physiol. Plant. 2021, 172, 2170–2180. [Google Scholar] [CrossRef]
  42. Li, X.H.; Wang, K.J. Research Progress of Genetic Diversity in Wild Soybean (Glycine soja Siebold & Zucc.). J. Plant Genet. Resour. 2020, 21, 1344–1356. [Google Scholar]
  43. Ellegren, H.; Galtier, N. Determinants of Genetic Diversity. Nat. Rev. Genet. 2016, 17, 422–433. [Google Scholar] [CrossRef]
  44. Yang, F.; Wan, H.; Li, J.; Wang, Q.; Yang, N.; Zhu, X.; Liu, Z.; Yang, Y.; Ma, W.; Fan, X.; et al. Pentaploidization Enriches the Genetic Diversity of Wheat by Enhancing the Recombination of AB Genomes. Front. Plant Sci. 2022, 13, 883868. [Google Scholar] [CrossRef] [PubMed]
  45. Ali, M.; Danting, S.; Wang, J.; Sadiq, H.; Rasheed, A.; He, Z.; Li, H. Genetic Diversity and Selection Signatures in Synthetic-Derived Wheats and Modern Spring Wheat. Front. Plant Sci. 2022, 13, 877496. [Google Scholar] [CrossRef] [PubMed]
  46. Liu, S.; Feuerstein, U.; Luesink, W.; Schulze, S.; Asp, T.; Studer, B.; Becker, H.C.; Dehmer, K.J. DArT, SNP, and SSR Analyses of Genetic Diversity in Lolium Perenne L. Using Bulk Sampling. BMC Genet. 2018, 19, 10. [Google Scholar] [CrossRef]
  47. Verwimp, C.; Ruttink, T.; Muylle, H.; Van Glabeke, S.; Cnops, G.; Quataert, P.; Honnay, O.; Roldán-Ruiz, I. Temporal Changes in Genetic Diversity and Forage Yield of Perennial Ryegrass in Monoculture and in Combination with Red Clover in Swards. PLoS ONE 2018, 13, e0206571. [Google Scholar] [CrossRef]
  48. Sayed, M.R.I.; Alshallash, K.S.; Safhi, F.A.; Alatawi, A.; ALshamrani, S.M.; Dessoky, E.S.; Althobaiti, A.T.; Althaqafi, M.M.; Gharib, H.S.; Shafie, W.W.M.; et al. Genetic Diversity, Analysis of Some Agro-Morphological and Quality Traits and Utilization of Plant Resources of Alfalfa. Genes 2022, 13, 1521. [Google Scholar] [CrossRef] [PubMed]
  49. Pour-Aboughadareh, A.; Mahmoudi, M.; Moghaddam, M.; Ahmadi, J.; Mehrabi, A.A.; Alavikia, S.S. Agro-Morphological and Molecular Variability in Triticum Boeoticum Accessions from Zagros Mountains, Iran. Genet. Resour. Crop Evol. 2017, 64, 545–556. [Google Scholar] [CrossRef]
  50. Nie, G.; Huang, T.; Ma, X.; Huang, L.; Peng, Y.; Yan, Y.; Li, Z.; Wang, X.; Zhang, X. Genetic Variability Evaluation and Cultivar Identification of Tetraploid Annual Ryegrass Using SSR Markers. Peer J. 2019, 7, e7742. [Google Scholar] [CrossRef]
  51. Zhang, R.; Wu, H.X.; Li, Y.S.; Huang, Z.H.; Yin, Z.J.; Yang, C.X.; Du, Z.Q. GWLD: An R package for genome-wide linkage disequilibrium analysis. G3 Genes Genomes Genet. 2023, 13, jkad154. [Google Scholar] [CrossRef]
  52. Pablo, F.R.; Adelina, O.L.; Ana, L.A.; Carolina, S.P.; Cristian, A.G.; Susanne, D.; Viviana, E. Linkage disequilibrium patterns, population structure and diversity analysis in a worldwide durum wheat collection including Argentinian genotypes. BMC Genom. 2021, 22, 233. [Google Scholar]
  53. Wang, H.; Zhu, S.; Dang, X.; Liu, E.; Hu, X.; Eltahawy, M.S.; Zaid, I.U.; Hong, D. Favorable Alleles Mining for Gelatinization Temperature, Gel Consistency and Amylose Content in Oryza sativa by Association Mapping. BMC Genet. 2019, 20, 34. [Google Scholar] [CrossRef] [PubMed]
  54. Zhu, X.; Gou, Y.; Heng, Y.; Ding, W.; Li, Y.; Zhou, D.; Li, X.; Liang, C.; Wu, C.; Wang, H.; et al. Targeted Manipulation of Grain Shape Genes Effectively Improves Outcrossing Rate and Hybrid Seed Production in Rice. Plant Biotechnol. J. 2023, 21, 381–390. [Google Scholar] [CrossRef]
  55. Bradbury, P.J.; Zhang, Z.; Kroon, D.E.; Casstevens, T.M.; Ramdoss, Y.; Buckler, E.S. TASSEL: Software for Association Mapping of Complex Traits in Diverse Samples. Bioinformatics 2007, 23, 2633–2635. [Google Scholar] [CrossRef] [PubMed]
  56. Guo, Y.; McCarty, J.C.; Jenkins, J.N.; Saha, S. QTLs for Node of First Fruiting Branch in a Cross of an Upland Cotton, Gossypium Hirsutum L., Cultivar with Primitive Accession Texas 701. Euphytica 2008, 163, 113–122. [Google Scholar] [CrossRef]
  57. He, G.; Luo, X.; Tian, F.; Li, K.; Zhu, Z.; Su, W.; Qian, X.; Fu, Y.; Wang, X.; Sun, C.; et al. Haplotype Variation in Structure and Expression of a Gene Cluster Associated with a Quantitative Trait Locus for Improved Yield in Rice. Genome Res. 2006, 16, 618–626. [Google Scholar] [CrossRef]
  58. Liu, J.; Wang, J.; Wang, H.; Wang, W.; Zhou, R.; Mei, D.; Cheng, H.; Yang, J.; Raman, H.; Hu, Q. Multigenic Control of Pod Shattering Resistance in Chinese Rapeseed Germplasm Revealed by Genome-Wide Association and Linkage Analyses. Front. Plant Sci. 2016, 7, 1058. [Google Scholar] [CrossRef]
  59. Si, F.F.; Fan, F.F.; Wei, X.; He, S.H.; Li, X.L.; Peng, X.J.; Li, S.Q. Quantitative Trait Locus Mapping of High Photosynthetic Efficiency and Biomass in Oryza longistaminata. Rice Sci. 2022, 29, 569–578. [Google Scholar]
  60. Wei, W.; Mesquita, A.C.O.; Figueiró, A.D.A.; Wu, X.; Manjunatha, S.; Wickland, D.P.; Hudson, M.E.; Juliatti, F.C.; Clough, S.J. Genome-Wide Association Mapping of Resistance to a Brazilian Isolate of Sclerotinia sclerotiorum in Soybean Genotypes Mostly from Brazil. BMC Genom. 2017, 18, 849. [Google Scholar] [CrossRef] [PubMed]
  61. Elakhdar, A.; EL-Sattar, M.A.; Amer, K.; Rady, A.; Kumamaru, T. Population Structure and Marker–Trait Association of Salt Tolerance in Barley (Hordeum vulgare L.). Comptes Rendus Biol. 2016, 339, 454–461. [Google Scholar] [CrossRef]
  62. Ghorbanipour, A.; Rabiei, B.; Rahmanpour, S.; Khodaparast, S.A. Association Analysis of Charcoal Rot Disease Resistance in Soybean. Plant Pathol. J. 2019, 35, 189–199. [Google Scholar] [CrossRef]
  63. Arabi, M.I.E.; Daoude, A.A.; Mokrani, L.; Shoaib, A.; Jawhar, M. Identification of AFLP Markers Associated with Spot Blotch Resistance through Single Marker Analysis in Barley (Hordeum vulgare L.). Cereal Res. Commun. 2021, 49, 285–290. [Google Scholar] [CrossRef]
  64. Rani, R.; Raza, G.; Ashfaq, H.; Rizwan, M.; Shimelis, H.; Tung, M.H.; Arif, M. Analysis of Genotype × Environment Interactions for Agronomic Traits of Soybean (Glycine max [L.] Merr.) Using Association Mapping. Front. Genet. 2023, 13, 1090994. [Google Scholar] [CrossRef]
  65. Song, J.; Pei, W.; Wang, N.; Ma, J.; Xin, Y.; Yang, S.; Wang, W.; Chen, Q.; Zhang, J.; Yu, J.; et al. Transcriptome Analysis and Identification of Genes Associated with Oil Accumulation in Upland Cotton. Physiol. Plant. 2022, 174, e13701. [Google Scholar] [CrossRef] [PubMed]
  66. Lai, Y.; Jia, J.L.; Wang, J.M.; Ren, L.; Lv, Z.Y.; Zhu, H.Q.; Ma, H.; Yang, L.N.; Li, Z.R. Analysis of Genetic Diversity and Association with Agronomic Traits in Barley(Hordeum vulgare L.)Introduced from Abroad Using SSR Markers. J. Triticeae Crops 2017, 37, 197–204. [Google Scholar]
  67. Ober, E.S.; Howell, P.; Thomelin, P.; Kouidri, A. The Importance of Accurate Developmental Staging. J. Exp. Bot. 2020, 71, 3375–3379. [Google Scholar] [CrossRef] [PubMed]
  68. Zheng, X.; Zhang, S.; Liang, Y.; Zhang, R.; Liu, L.; Qin, P.; Zhang, Z.; Wang, Y.; Zhou, J.; Tang, X.; et al. Loss-function Mutants of OsCKX Gene Family Based on CRISPR-Cas Systems Revealed Their Diversified Roles in Rice. Plant Genome 2023, 16, e20283. [Google Scholar] [CrossRef]
  69. Ghosh, A.; Shah, M.N.A.; Jui, Z.S.; Saha, S.; Fariha, K.A.; Islam, T. Evolutionary Variation and Expression Profiling of Isopentenyl Transferase Gene Family in Arabidopsis thaliana L. and Oryza sativa L. Plant Gene 2018, 15, 15–27. [Google Scholar] [CrossRef]
  70. Prakash, S.; Rai, R.; Zamzam, M.; Ahmad, O.; Peesapati, R.; Vijayraghavan, U. OsbZIP47 Is an Integrator for Meristem Regulators During Rice Plant Growth and Development. Front. Plant Sci. 2022, 13, 865928. [Google Scholar] [CrossRef]
  71. Liu, Y.; Xu, J.; Ding, Y.; Wang, Q.; Li, G.; Wang, S. Auxin Inhibits the Outgrowth of Tiller Buds in Rice (Oryza sativa L.) by Downregulating OsIPT Expression and Cytokinin Biosynthesis in Nodes. Aust. J. Crop Sci. 2011, 5, 169–174. [Google Scholar]
  72. Liu, Y.; Ding, Y.; Wang, Q.; Meng, D.; Wang, S. Effects of Nitrogen and 6-Benzylaminopurine on Rice Tiller Bud Growth and Changes in Endogenous Hormones and Nitrogen. Crop Sci. 2011, 51, 786–792. [Google Scholar] [CrossRef]
  73. Li, Z.; Yun, L.; Ren, X.; Shi, F.; Mi, F. Analysis of Controlling Genes for Tiller Growth of Psathyrostachys Juncea Based on Transcriptome Sequencing Technology. BMC Plant Biol. 2022, 22, 456. [Google Scholar] [CrossRef] [PubMed]
  74. Ren, X.M.; Yun, L.; Ai, Q.; Li, Z.; Zhao, Q.; Shi, F.L. Cloning and expression analysis of YUCCA gene in Psathyrostachys juncea. J. Northwest A F Univ. Nat. Sci. Ed. 2023, accepted. [Google Scholar]
  75. Ren, X.M.; Yun, L.; Ai, Q.; Li, Z.; Zhao, Q.; Shi, F.L. Subcellular Localization, Overexpression Vector Construction and Identification of IPT Gene in Psathyrostachys juncea. Acta Bot. Boreali-Occident. Sin. 2023. accepted. [Google Scholar]
  76. Ren, X.M.; Yun, L.; Li, Z.; Ai, Q.; Zhao, Q.; Shi, F.L. Cloning and Expression Analysis of Cytokinin Regulatory Gene CKX4 in Psathyrostachys juncea. Acta Agrestia Sin. 2023, 9, 1–16. [Google Scholar]
  77. Jia, Z.Y. Creation of New Germplasm and Association Analysis of Main Agronomic Traits in Elymus sibiricus L.; Inner Mongolia Agricultural University: Hohhot, China, 2021. [Google Scholar]
Figure 1. Pearson correlation coefficients and PCA for the ten traits evaluated in the two locations. Statistical significance of coefficients labeled as *** for p < 0.0001 and * for p <0.05, respectively. Note: (A) Pearson correlation coefficients. (B) PCA of 480 accessions.
Genes 14 01970 g001
Figure 2. PCA, UPGMA tree and Population Structure of P. juncea. (A) Principal component analysis (PCA) of 480 accessions. (B) UPGMA tree. (C) Population Structure. Note: (A) Different colors represent different germplasm of P. juncea. (B,C) different colors represent different groups.
Genes 14 01970 g002
Figure 3. Linkage disequilibrium (LD) between SSR markers.
Genes 14 01970 g003
Figure 4. Manhattan plot of SSR markers associated with traits of P. juncea. Note: (A) PH, (B) RTL, (C) SH, (D) BD, (E) LL, (F) LW, (G) CD, (H) NTN, (I) NTA, (J) RTN.
Genes 14 01970 g004
Table 1. Descriptive analysis of ten agronomic traits of P. juncea population in two environments and their BLUE value.
TraitEnvironmentRangeMeanSDCoefficient of Variation (%)
Plant heightHohhot19.00~91.7360.9114.8224.33
Baotou16.00~99.6770.5112.3317.49
BLUE14.44~95.1365.2111.7418.01
Reproductive tiller lengthHohhot23.17~107.4372.1914.7720.46
Baotou25.00~111.0882.9013.5616.36
BLUE22.16~100.7776.9212.6116.39
Shoot heightHohhot12.60~60.9030.888.0726.15
Baotou12.75~61.1739.326.6917.03
BLUE12.52~53.1034.845.5015.79
Clump basal diameterHohhot15.53~88.1355.1611.5620.96
Baotou15.50~108.6766.3817.6526.59
BLUE11.09~97.0660.2312.8021.25
Leaf lengthHohhot15.56~50.0533.565.5016.39
Baotou20.33~52.7340.465.5513.72
BLUE20.08~47.4736.864.5912.45
Leaf widthHohhot0.24~0.600.420.0613.98
Baotou0.23~0.600.410.0512.93
BLUE0.26~0.560.420.0511.04
Canopy diameterHohhot25.53~102.7566.7912.5518.78
Baotou31.50~105.8374.2912.3616.64
BLUE33.34~96.0270.1210.4414.89
Nutritional tiller numberHohhot17.17~453.67152.3661.4940.36
Baotou18.00~426.00202.1969.9234.58
BLUE15.36~397.67174.9053.5130.60
Nutritional tiller angleHohhot27.50~83.1756.449.1616.23
Baotou39.17~80.0061.035.649.25
BLUE41.07~79.1658.734.758.09
Reproductive tiller numberHohhot4.00~182.0045.4631.2068.64
Baotou8.00~325.0089.2545.2350.68
BLUE3.10~186.1859.9032.3153.95
Table 2. Principal component analysis of agronomic traits of P. juncea.
TraitsIndicator Eigenvector
IIIIIIIV
Plant height0.40 *−0.16−0.10−0.29
Reproductive tiller length0.36 *−0.06−0.07−0.16
Shoot height0.37 *−0.270.280.34
Clump basal diameter0.31 *0.07−0.21−0.01
Leaf length0.280.30 *0.160.01
Leaf width0.130.72 *−0.07−0.06
Canopy diameter0.300.23 *0.02−0.05
Nutritional tiller number0.25−0.090.340.79 *
Nutritional tiller angle0.12−0.410.75 *−0.24
Reproductive tiller number0.27−0.220.40 *−0.29
Contribution (%)46.8211.109.877.02
Cumulative Contribution (%)46.8257.9267.7974.81
Note: The PC coefficient significantly correlated with each trait have been indicated by “*”.
Table 3. Analysis of molecular variance (AMOVA) of P. juncea population.
Sources of VariationDegrees of
Freedom
Sum of SquaresMean SquareVariance of
Components
Percentage
Variation (%)
p ValueFst
Among Pops2018,235.035911.75218.95734<0.0010.341
Among Individuals45921,331.48446.4749.82618<0.001
Within Individuals48012,874.50026.82226.82248<0.001
Total95952,441.020 55.605100<0.001
Table 4. Number of LD pairs in different D′ value range.
Range of D′ ValueNo. of Loci Pairs with Significant LDPercentage of Loci Pairs with Significant LD (%)
0~0.2229239.02
0.2~0.4207235.27
0.4~0.688615.08
0.6~0.83425.82
0.8~12824.80
Table 5. EST-SSR markers associated with tiller related traits of P. juncea.
TraitsMarkersp ValueR2/%TraitsMarkersp ValueR2/%
Plant height0283240.0292.290Nutritional tiller number0613560.0332.230
139768A0.0121.9100668420.0172.530
OsIPT70.0287.840139768A0.0261.520
Reproductive tiller length0283240.0332.1901858750.0072.500
139768A0.0111.930OsIPT70.0347.400
OsCKX10.0331.490OsIPT80.0141.960
OsIPT70.0198.500Reproductive tiller number0005160.0231.060
Shoot height139768A0.0101.9400044350.0131.880
OsYUCCA60.0391.430019368C0.0421.580
OsCKX10.0421.3600266200.0331.950
OsIPT70.0149.150028161A0.0181.960
Clump basal diameter019368C0.0361.6800283240.0024.130
0283240.0392.0600409570.0084.190
0700470.0333.2000442620.0293.350
139768A0.0301.5000455890.0211.100
Leaf length139768A0.0121.8700700470.0251.630
OsYUCCA60.0161.8400725250.0012.100
OsCKX10.0131.8801144160.0291.550
OsIPT70.0139.210142612A0.0211.600
Leaf width0613560.0312.3901670410.0442.550
0650100.0492.5301858750.0062.670
139768A0.0121.9101949380.0072.620
OsYUCCA60.0042.420OsD170.0201.840
OsCKX10.0102.030Canopy diameter139768A0.0121.910
OsIPT70.0297.650OsYUCCA60.0371.470
Nutritional tiller angle139768A0.0111.890OsCKX10.0092.030
OsYUCCA60.0111.990OsIPT70.0149.100
OsIPT70.0387.070
Note: R2 represents the explanatory rate of phenotypic variation. IPT (Isopentenyl transferases); CKX (Cytokinin oxidase/dehydrogenase); YUCCA (Indole-3-pyruvate monooxygenase); D17 (Dwarf 17).
Disclaimer/Publisher’s Note: The statements, opinions and data contained in all publications are solely those of the individual author(s) and contributor(s) and not of MDPI and/or the editor(s). MDPI and/or the editor(s) disclaim responsibility for any injury to people or property resulting from any ideas, methods, instructions or products referred to in the content.

