Genome-Wide Analysis Identifies Candidate Genes Encoding Beak Color of Duck

 and
and 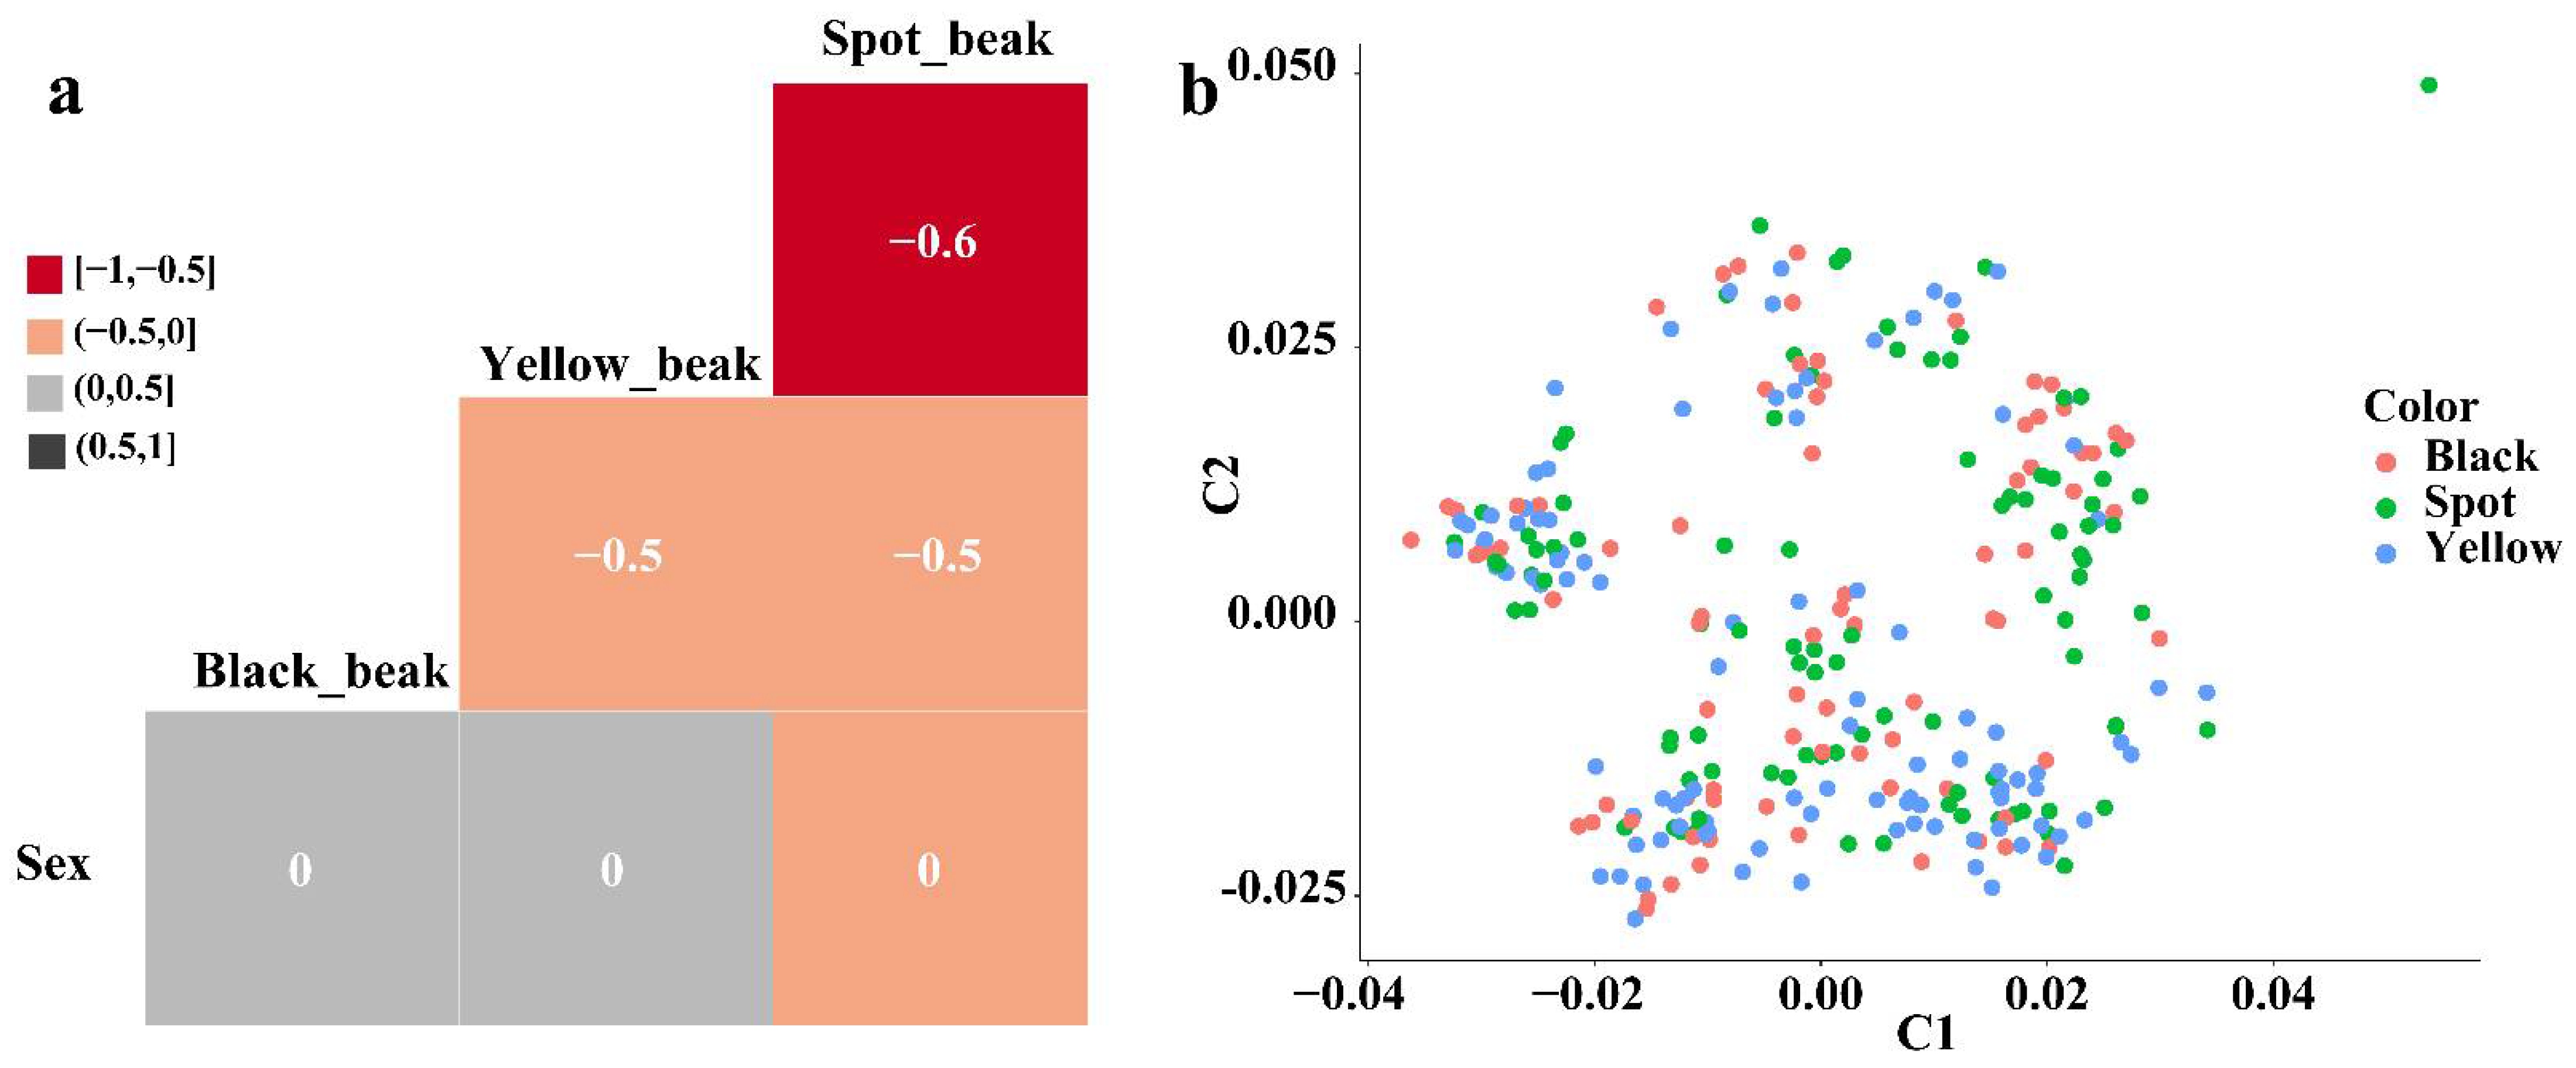
Abstract
1. Introduction
2. Materials and Methods
2.1. Ethical Approval
2.2. Samples and Sequencing
2.3. Genotyping
2.4. Population Structure
2.5. Whole-Genome Association Analysis and Linkage Disequilibrium Analysis
2.6. Gene Ontology (GO) and Kyoto Encyclopedia of Genes and Genomes (KEGG) Analyses
3. Results
3.1. Phenotypic Description and Population Structure Analysis
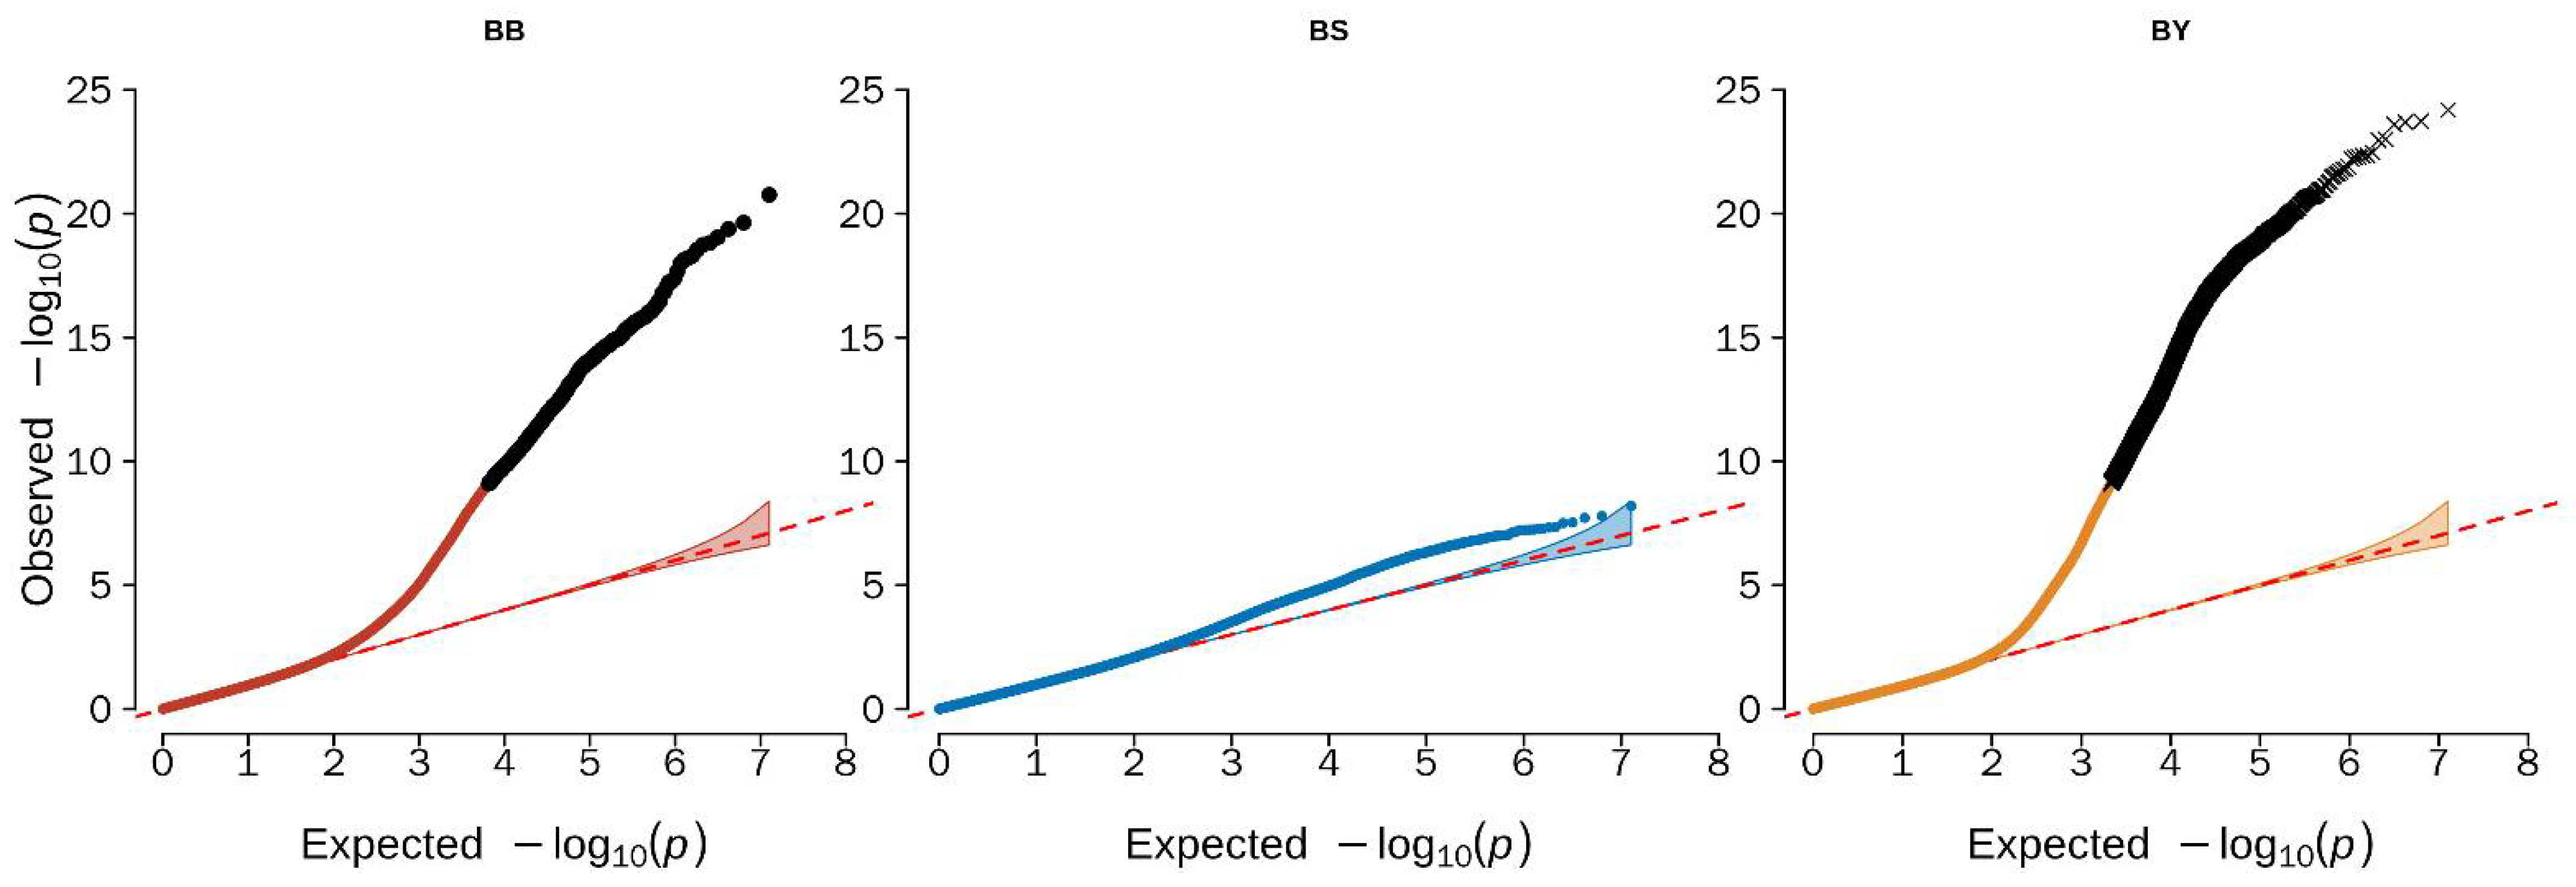
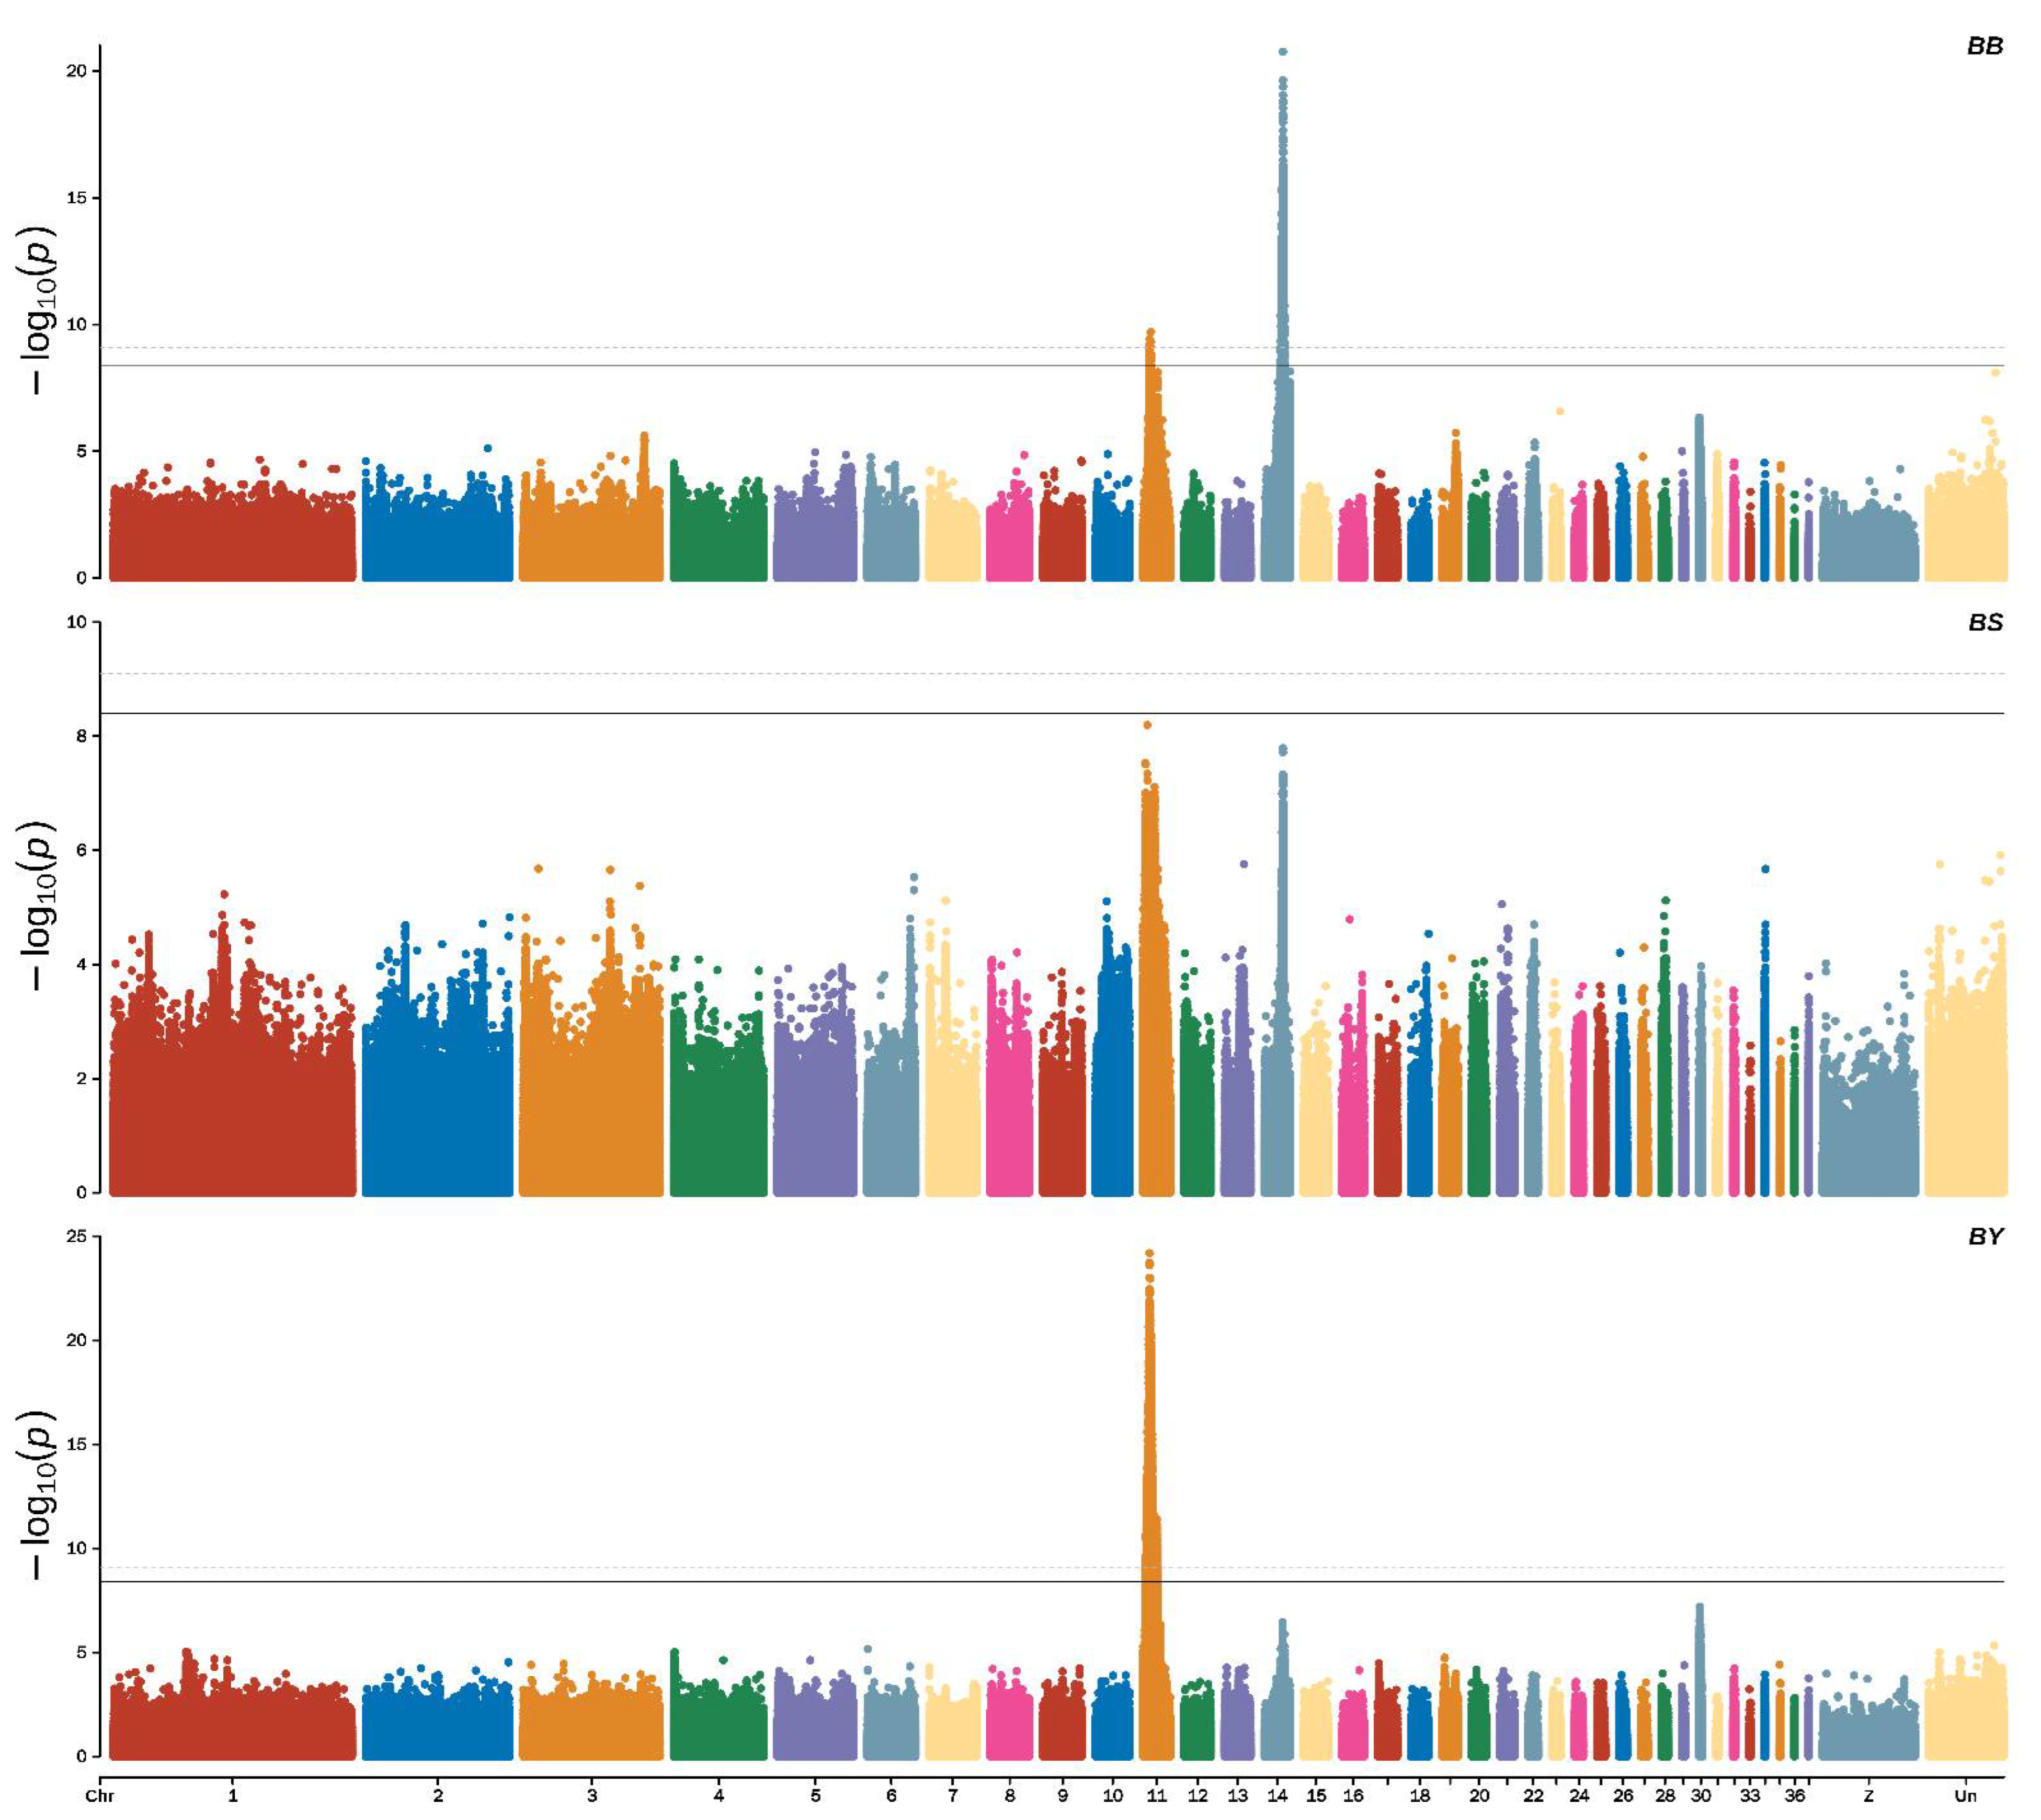
3.2. Genome-Wide Association Study Identified the Candidate Variants for Beak Color
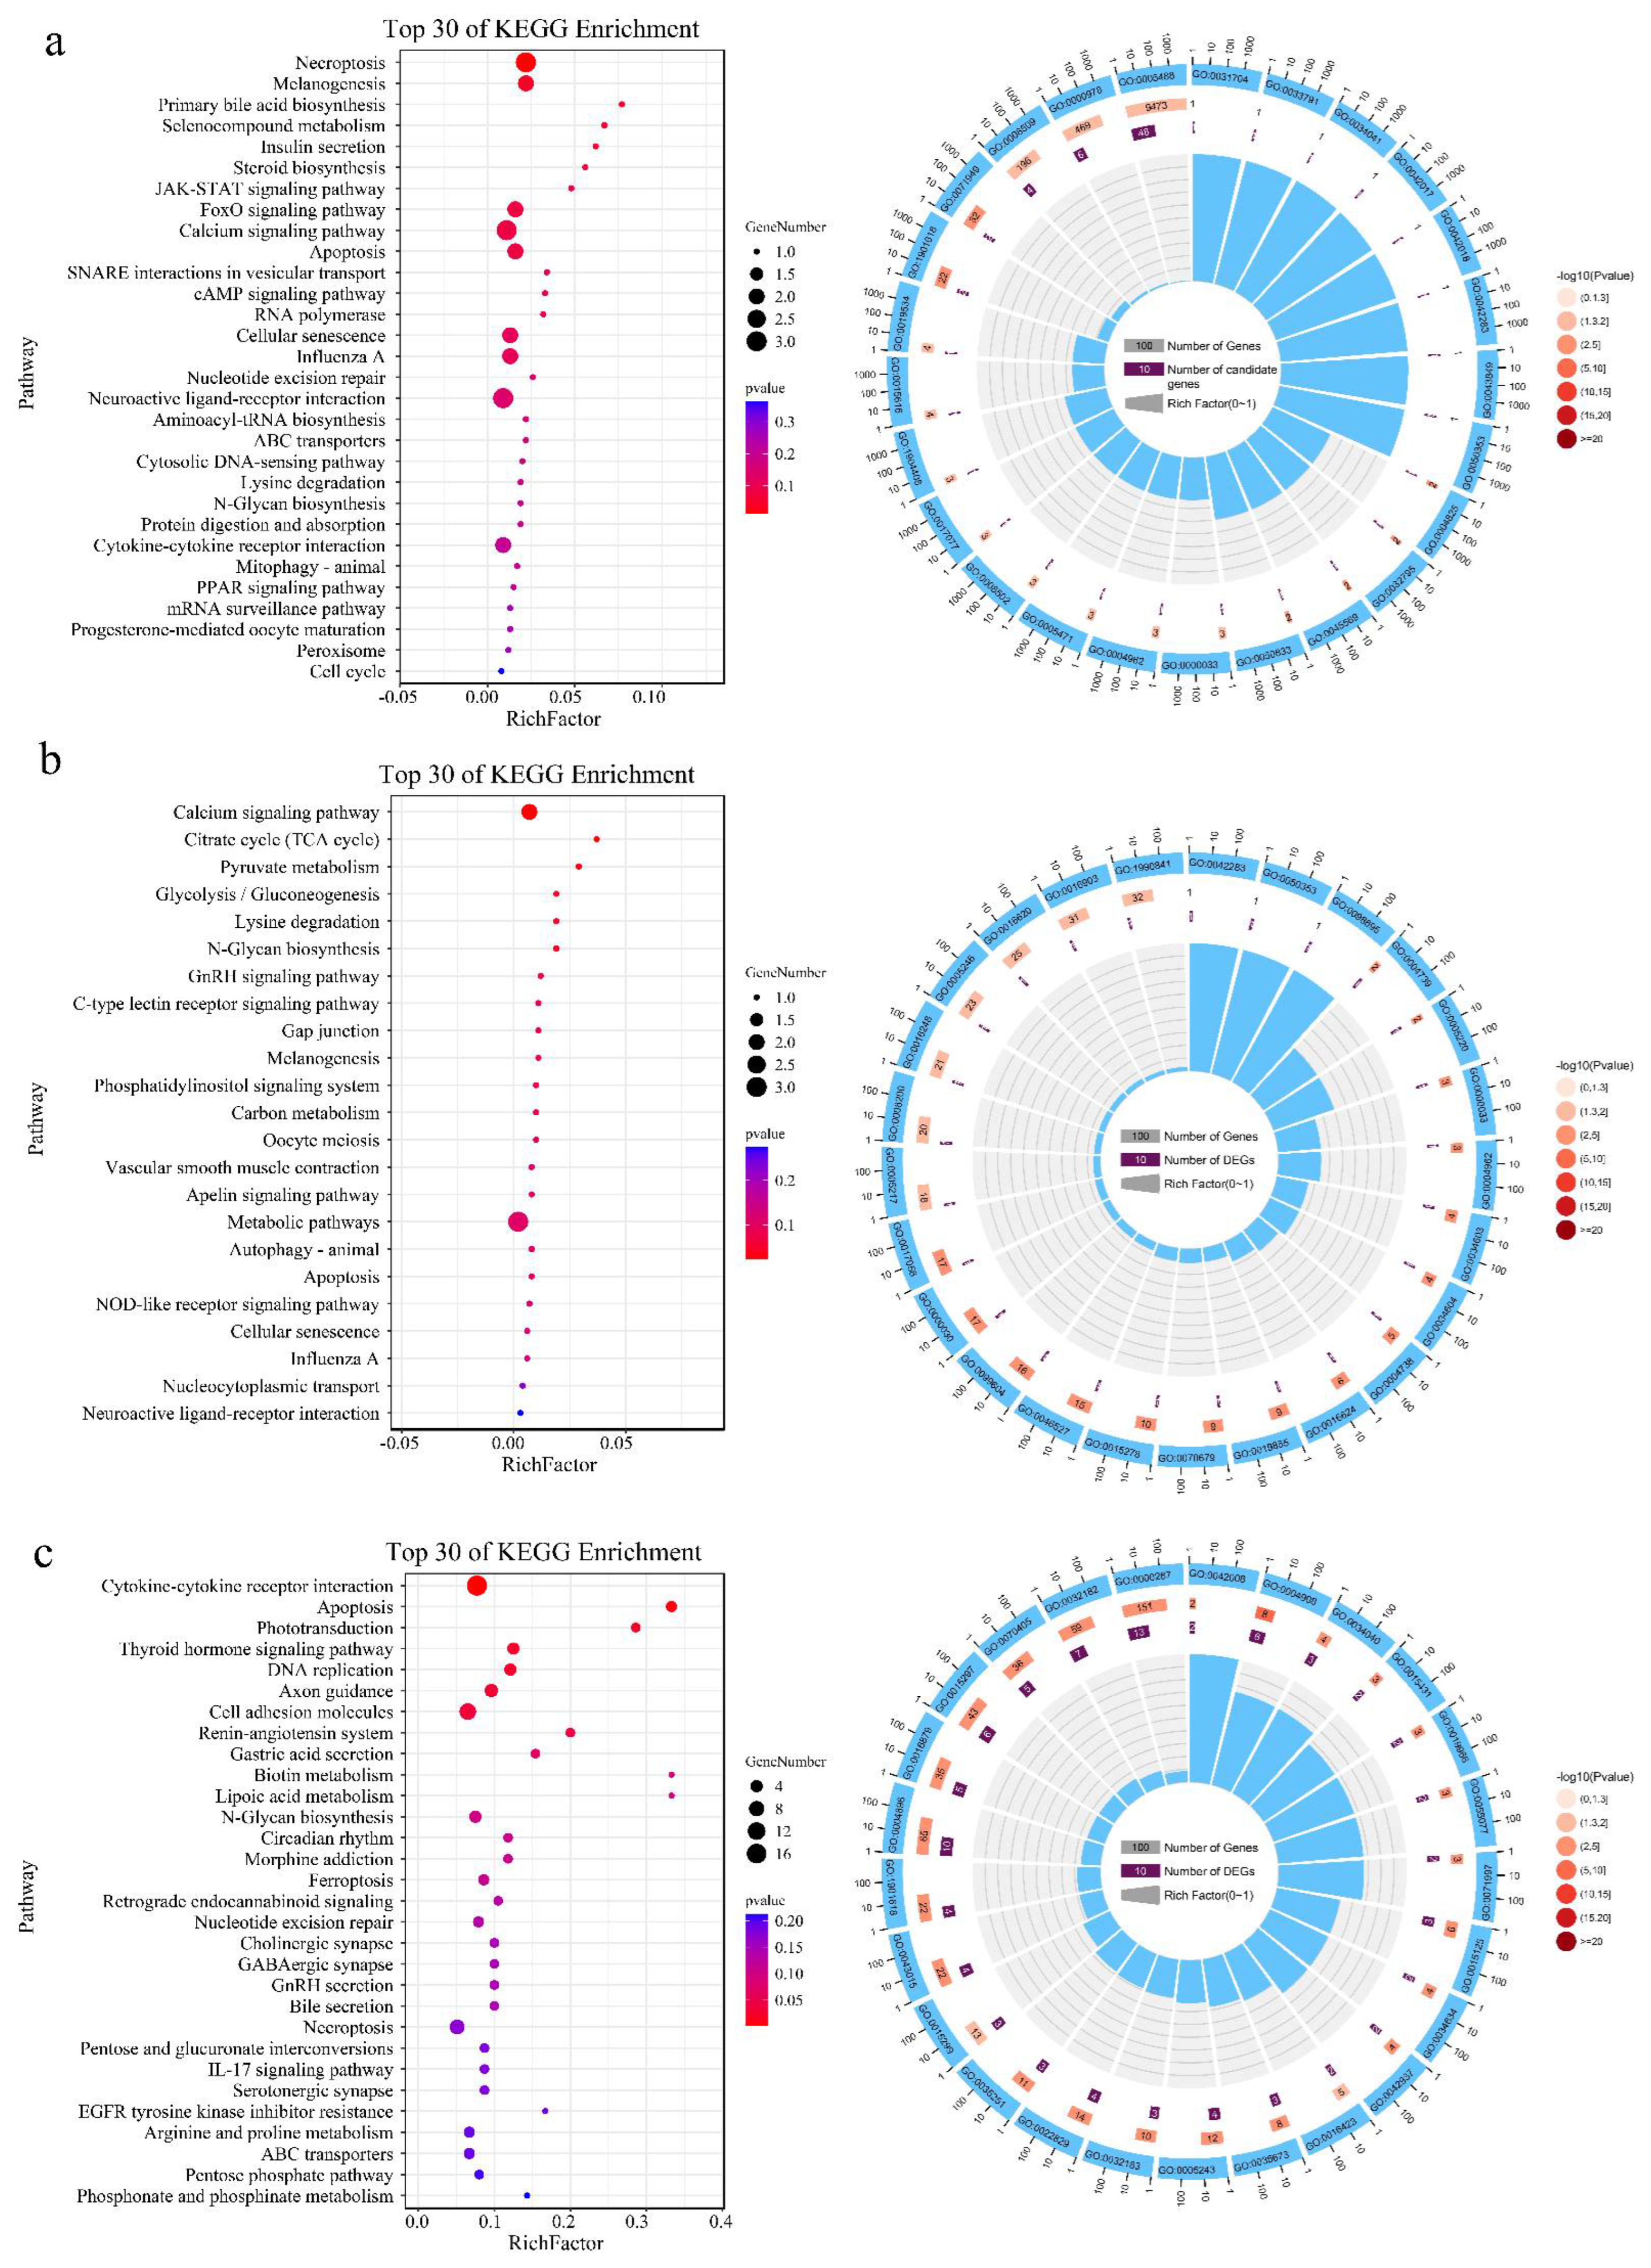
3.3. Functional Analysis
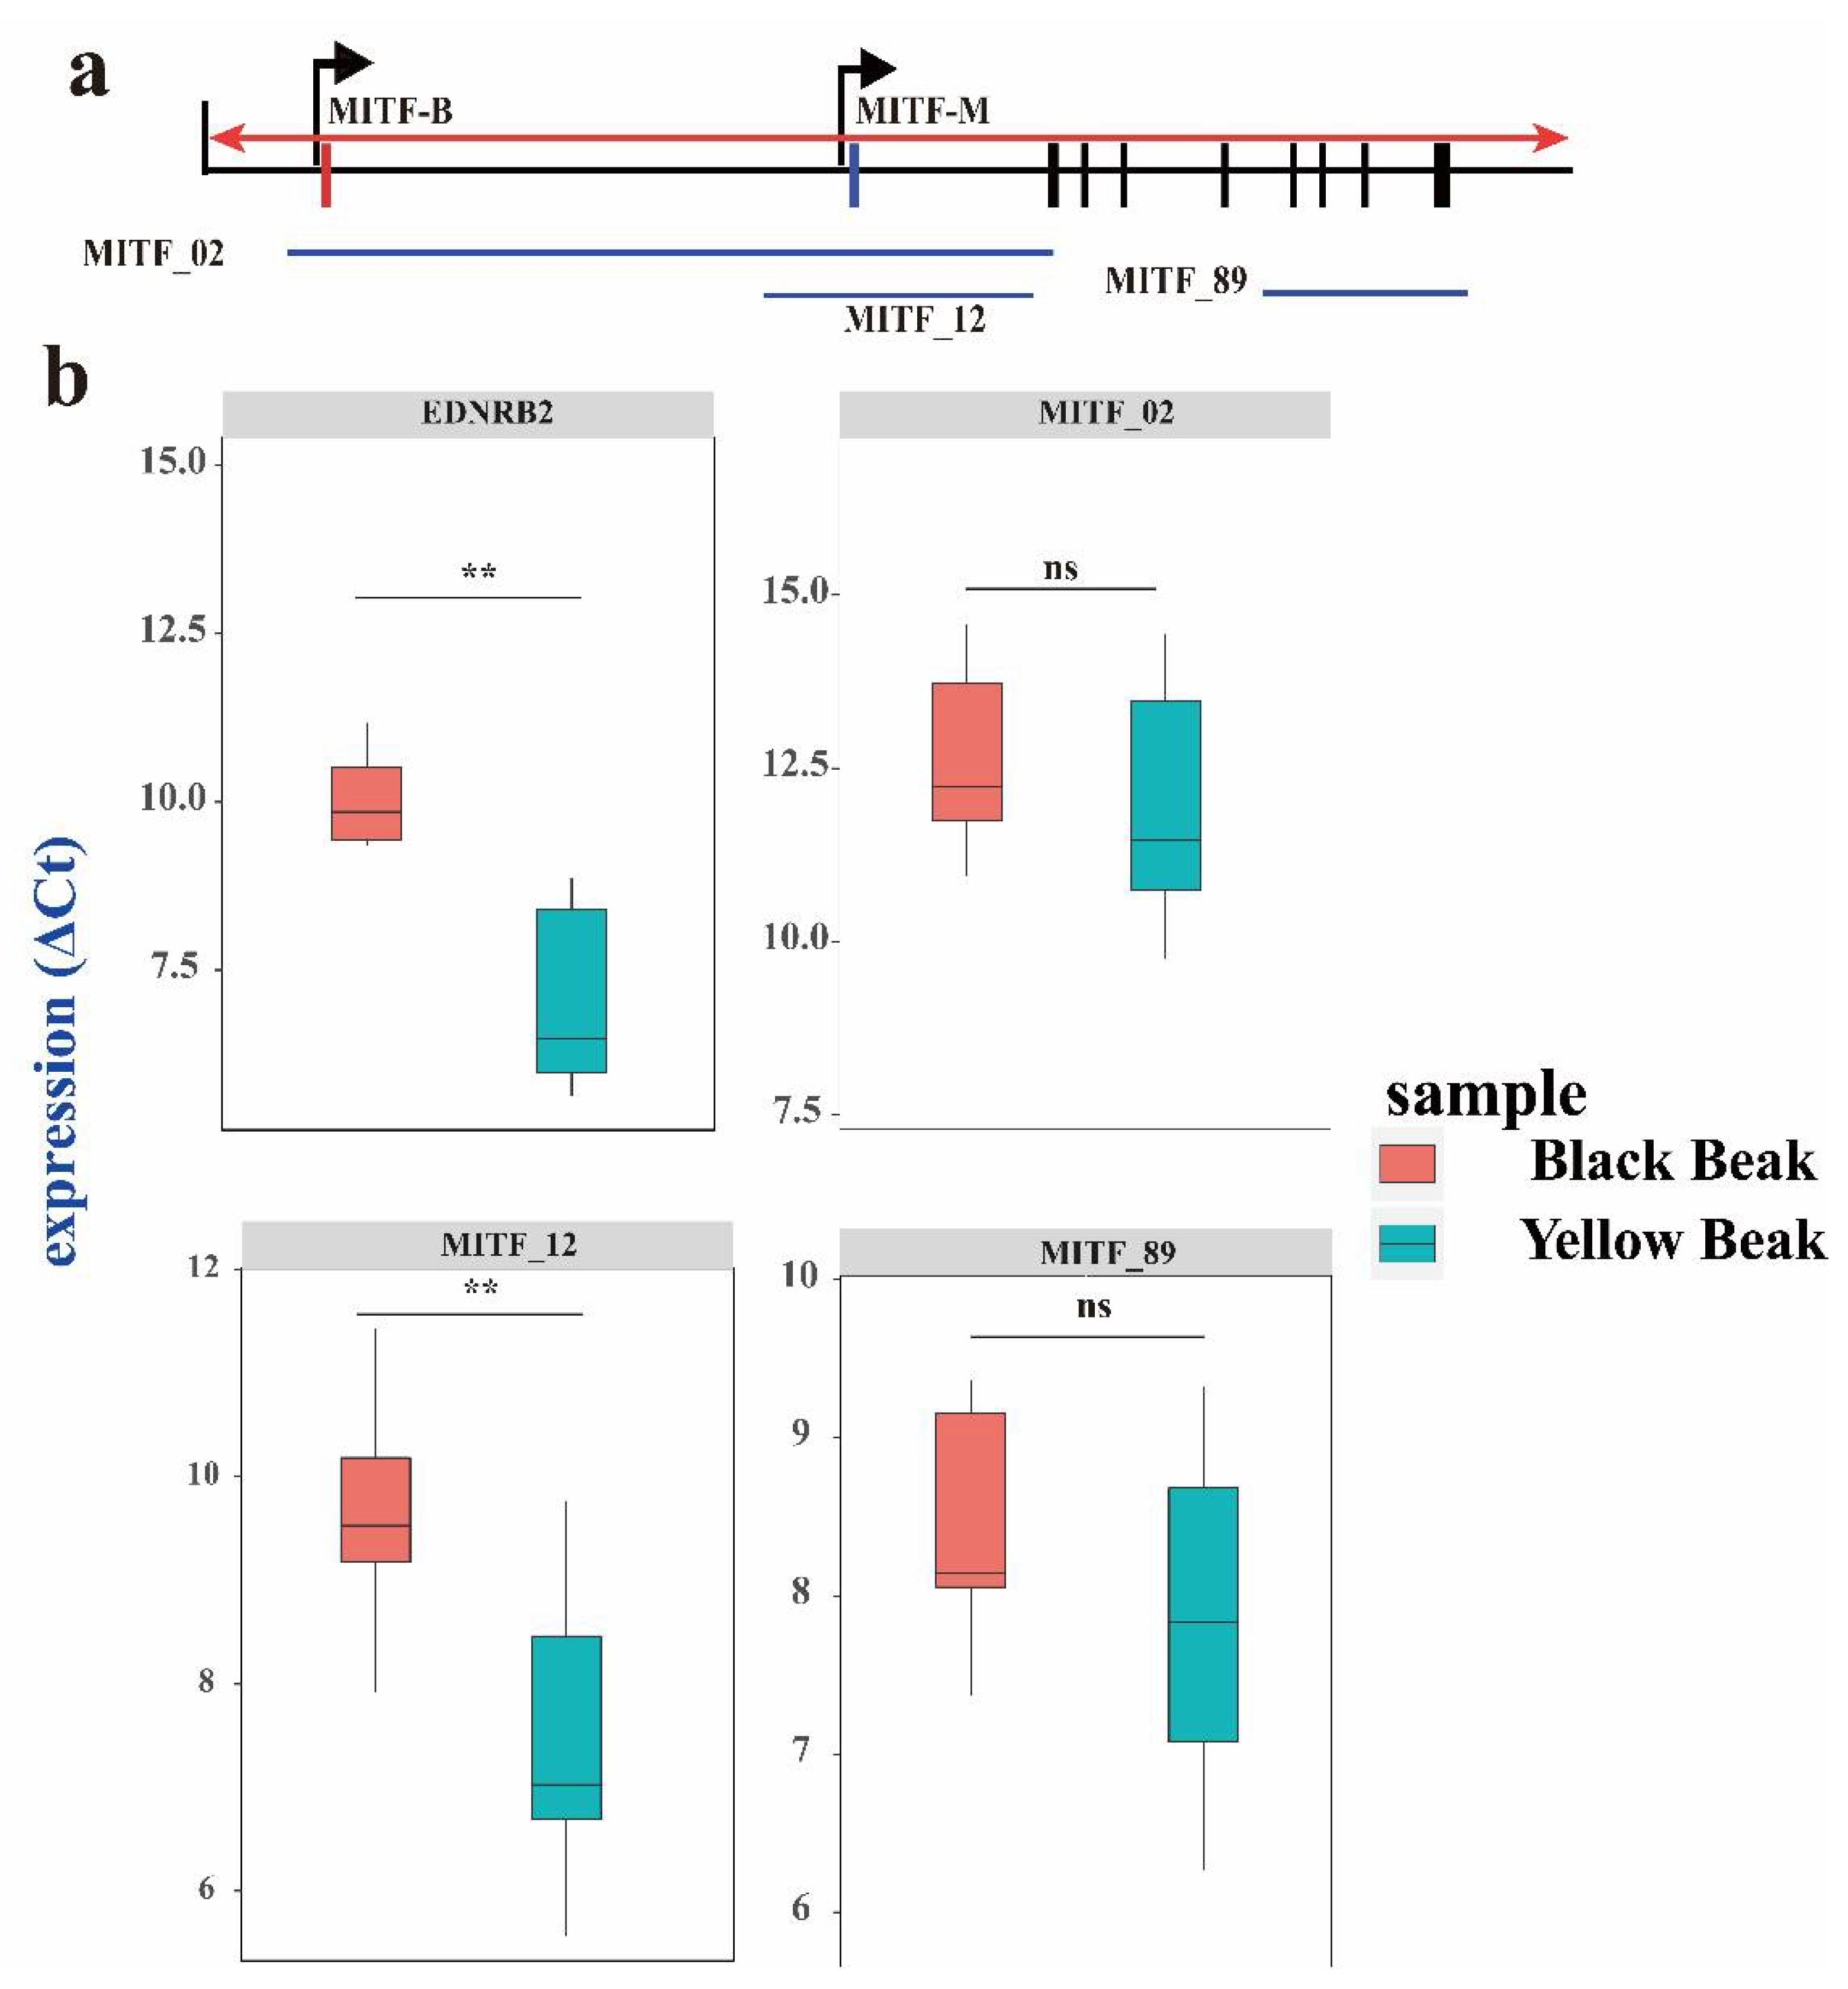
3.4. The EDNRB2 and MITF Isoform Expression Level in Black and Yellow Beaks
4. Discussion
5. Conclusions
Supplementary Materials
Author Contributions
Funding
Institutional Review Board Statement
Informed Consent Statement
Data Availability Statement
Acknowledgments
Conflicts of Interest
References
- Galván, I.; Rodríguez-Martínez, S.; Carrascal, L. Dark pigmentation limits thermal niche position in birds. Funct. Ecol. 2018, 32, 1531–1540. [Google Scholar] [CrossRef]
- Glogau, R.G. Physiologic and structural changes associated with aging skin. Dermatol. Clin. 1997, 15, 555–559. [Google Scholar] [CrossRef]
- Rittié, L.; Fisher, G.J. Natural and Sun-Induced Aging of Human Skin. Cold Spring Harb. Perspect. Med. 2015, 5, a015370. [Google Scholar] [CrossRef] [PubMed]
- Deng, L.; Xu, S. Adaptation of human skin color in various populations. Hereditas 2017, 155, 1. [Google Scholar] [CrossRef] [PubMed]
- Yamaguchi, Y.; Hearing, V.J. Melanocytes and their diseases. Cold Spring Harb. Perspect. Med. 2014, 4, a017046. [Google Scholar] [CrossRef] [PubMed]
- Shekar, S.N.; Luciano, M.; Duffy, D.L.; Martin, N.G. Genetic and Environmental Influences on Skin Pattern Deterioration. J. Investig. Dermatol. 2005, 125, 1119–1129. [Google Scholar] [CrossRef]
- Hubbard, J.K. Environmental and Genetic Influences on Melanin-Based Plumage Coloration: Implications for Population Divergence. Ph.D. Thesis, University of Colorado at Boulder, Boulder, CO, USA, 2014. [Google Scholar]
- Lin, J.Y.; Fisher, D.E. Melanocyte biology and skin pigmentation. Nature 2007, 445, 843–850. [Google Scholar] [CrossRef]
- Huang, X.; Otecko, N.O.; Peng, M.; Weng, Z.; Li, W.; Chen, J.; Zhong, M.; Zhong, F.; Jin, S.; Geng, Z.; et al. Genome-wide genetic structure and selection signatures for color in 10 traditional Chinese yellow-feathered chicken breeds. BMC Genom. 2020, 21, 316. [Google Scholar] [CrossRef]
- Aoki, K. Sexual selection as a cause of human skin colour variation: Darwin’s hypothesis revisited. Ann. Hum. Biol. 2002, 29, 589–608. [Google Scholar] [CrossRef]
- Wang, Y. Association of pigmentation related-genes polymorphisms and geographic environmental variables in the Chinese population. Hereditas 2021, 158, 24. [Google Scholar] [CrossRef]
- Pavan, W.J.; Sturm, R.A. The Genetics of Human Skin and Hair Pigmentation. Annu. Rev. Genom. Hum. Genet. 2019, 20, 41–72. [Google Scholar] [CrossRef] [PubMed]
- Hernandez-Pacheco, N.; Flores, C.; Alonso, S.; Eng, C.; Mak, A.C.; Hunstman, S.; Hu, D.; White, M.J.; Oh, S.S.; Meade, K.; et al. Identification of a novel locus associated with skin colour in African-admixed populations. Sci. Rep. 2017, 7, 44548. [Google Scholar] [CrossRef] [PubMed]
- A Sturm, R.; Duffy, D.L. Human pigmentation genes under environmental selection. Genome Biol. 2012, 13, 248. [Google Scholar] [CrossRef]
- Gerstenblith, M.R.; Shi, J.; Landi, M.T. Genome-wide association studies of pigmentation and skin cancer: A review and meta-analysis. Pigment. Cell Melanoma Res. 2010, 23, 587–606. [Google Scholar] [CrossRef] [PubMed]
- Morgan, M.D.; Pairo-Castineira, E.; Rawlik, K.; Canela-Xandri, O.; Rees, J.; Sims, D.; Tenesa, A.; Jackson, I.J. Genome-wide study of hair colour in UK Biobank explains most of the SNP heritability. Nat. Commun. 2018, 9, 5271. [Google Scholar] [CrossRef] [PubMed]
- Zhong, K.; Verkouteren, J.A.; Jacobs, L.C.; Uitterlinden, A.G.; Hofman, A.; Liu, F.; Nijsten, T.; Kayser, M. Pigmentation-Independent Susceptibility Loci for Actinic Keratosis Highlighted by Compound Heterozygosity Analysis. J. Investig. Dermatol. 2017, 137, 77–84. [Google Scholar] [CrossRef]
- Moscowitz, A.E.; Asif, H.; Lindenmaier, L.B.; Calzadilla, A.; Zhang, C.; Mirsaeidi, M. The Importance of Melanocortin Receptors and Their Agonists in Pulmonary Disease. Front. Med. 2019, 6, 145. [Google Scholar] [CrossRef]
- Serre, C.; Busuttil, V.; Botto, J.-M. Intrinsic and extrinsic regulation of human skin melanogenesis and pigmentation. Int. J. Cosmet. Sci. 2018, 40, 328–347. [Google Scholar] [CrossRef]
- Le, L.; Escobar, I.E.; Ho, T.; Lefkovith, A.J.; Latteri, E.; Haltaufderhyde, K.D.; Dennis, M.K.; Plowright, L.; Sviderskaya, E.V.; Bennett, D.C.; et al. SLC45A2 protein stability and regulation of melanosome pH determine melanocyte pigmentation. Mol. Biol. Cell 2020, 31, 2687–2702. [Google Scholar] [CrossRef]
- Tóth, L.; Fábos, B.; Farkas, K.; Sulák, A.; Tripolszki, K.; Széll, M.; Nagy, N. Identification of two novel mutations in the SLC45A2 gene in a Hungarian pedigree affected by unusual OCA type 4. BMC Med. Genet. 2017, 18, 27. [Google Scholar] [CrossRef]
- Cook, A.L.; Chen, W.; Thurber, A.E.; Smit, D.J.; Smith, A.G.; Bladen, T.G.; Brown, D.L.; Duffy, D.L.; Pastorino, L.; Bianchi-Scarra, G.; et al. Analysis of Cultured Human Melanocytes Based on Polymorphisms within the SLC45A2/MATP, SLC24A5/NCKX5, and OCA2/P Loci. J. Investig. Dermatol. 2009, 129, 392–405. [Google Scholar] [CrossRef] [PubMed]
- Reinders, A.; Ward, J.M. Investigating polymorphisms in membrane-associated transporter protein SLC45A2, using sucrose transporters as a model. Mol. Med. Rep. 2012, 12, 1393–1398. [Google Scholar] [CrossRef] [PubMed]
- Lu, J.; Fang, W.; Huang, J.; Li, S. The application of genome editing technology in fish. Mar. Life Sci. Technol. 2021, 3, 326–346. [Google Scholar] [CrossRef]
- Martin, A.R.; Lin, M.; Granka, J.M.; Myrick, J.W.; Liu, X.; Sockell, A.; Atkinson, E.G.; Werely, C.J.; Möller, M.; Sandhu, M.S.; et al. An Unexpectedly Complex Architecture for Skin Pigmentation in Africans. Cell 2017, 171, 1340–1353. [Google Scholar] [CrossRef] [PubMed]
- Patel, R.K.; Jain, M. NGS QC Toolkit: A Toolkit for Quality Control of Next Generation Sequencing Data. PLoS ONE 2012, 7, e30619. [Google Scholar] [CrossRef]
- Li, H. Aligning sequence reads, clone sequences and assembly contigs with BWA-MEM. arXiv 2013, arXiv:1303.3997. [Google Scholar]
- McKenna, A.; Hanna, M.; Banks, E.; Sivachenko, A.; Cibulskis, K.; Kernytsky, A.; Garimella, K.; Altshuler, D.; Gabriel, S.; Daly, M.; et al. The Genome Analysis Toolkit: A MapReduce framework for analyzing next-generation DNA sequencing data. Genome Res. 2010, 20, 1297–1303. [Google Scholar] [CrossRef]
- Danecek, P.; Auton, A.; Abecasis, G.; Albers, C.A.; Banks, E.; DePristo, M.A.; Handsaker, R.E.; Lunter, G.; Marth, G.T.; Sherry, S.T.; et al. The variant call format and VCFtools. Bioinformatics 2011, 27, 2156–2158. [Google Scholar] [CrossRef]
- Purcell, S.; Neale, B.; Todd-Brown, K.; Thomas, L.; Ferreira, M.A.R.; Bender, D.; Maller, J.; Sklar, P.; de Bakker, P.I.W.; Daly, M.J.; et al. PLINK: A Tool Set for Whole-Genome Association and Population-Based Linkage Analyses. Am. J. Hum. Genet. 2007, 81, 559–575. [Google Scholar] [CrossRef]
- Kang, H.M.; Sul, J.H.; Service, S.K.; Zaitlen, N.A.; Kong, S.-Y.; Freimer, N.B.; Sabatti, C.; Eskin, E. Variance component model to account for sample structure in genome-wide association studies. Nat. Genet. 2010, 42, 348–354. [Google Scholar] [CrossRef]
- Paschon, D.E.; Lussier, S.; Wangzor, T.; Xia, D.F.; Li, P.W.; Hinkley, S.J.; Scarlott, N.A.; Lam, S.C.; Waite, A.J.; Truong, L.N.; et al. Diversifying the structure of zinc finger nucleases for high-precision genome editing. Nat. Commun. 2019, 10, 1133. [Google Scholar] [CrossRef] [PubMed]
- Xie, C.; Mao, X.; Huang, J.; Ding, Y.; Wu, J.; Dong, S.; Kong, L.; Gao, G.; Li, C.-Y.; Wei, L. KOBAS 2.0: A web server for annotation and identification of enriched pathways and diseases. Nucleic Acids Res. 2011, 39, W316–W322. [Google Scholar] [CrossRef] [PubMed]
- Cieslak, M.; Reissmann, M.; Hofreiter, M.; Ludwig, A. Colours of domestication. Biol. Rev. 2011, 86, 885–899. [Google Scholar] [CrossRef] [PubMed]
- Slominski, A.; Tobin, D.J.; Shibahara, S.; Wortsman, J. Melanin pigmentation in mammalian skin and its hormonal regulation. Physiol. Rev. 2004, 84, 1155–1228. [Google Scholar] [CrossRef]
- Zheng, P.; Sun, H.; Liu, J.; Lin, J.; Zhang, X.; Qin, Y.; Zhang, W.; Xu, X.; Deng, X.; Yang, D.; et al. Comparative analyses of American and Asian lotus genomes reveal insights into petal color, carpel thermogenesis and domestication. Plant J. 2022, 110, 1498–1515. [Google Scholar] [CrossRef] [PubMed]
- Naik, P.P.; Farrukh, S.N. Influence of Ethnicities and Skin Color Variations in Different Populations: A Review. Ski. Pharmacol. Physiol. 2021, 35, 65–76. [Google Scholar] [CrossRef]
- Ralph, C.L. The Control of Color in Birds. Am. Zool. 1969, 9, 521–530. [Google Scholar] [CrossRef]
- Hitselberger, M.H.; Schleicher, R.L.; Beattie, C.W. Effects of Estradiol on Estrogen Receptor, Progesterone Receptor, and Tyrosinase in Hamster Melanoma Transplanted into Athymic Mice1. Cancer Res. 1988, 48, 3720–3727. [Google Scholar]
- Liu, H.; Wang, J.; Hu, J.; Wang, L.; Guo, Z.; Fan, W.; Xu, Y.; Liu, D.; Zhang, Y.; Xie, M.; et al. Genome-wide association analysis reveal the genetic reasons affect melanin spot accumulation in beak skin of ducks. BMC Genom. 2022, 23, 236. [Google Scholar] [CrossRef]
- Hofstetter, S.; Seefried, F.; Häfliger, I.; Jagannathan, V.; Leeb, T.; Drögemüller, C. A non-coding regulatory variant in the 5′-region of the MITF gene is associated with white-spotted coat in Brown Swiss cattle. Anim. Genet. 2018, 50, 27–32. [Google Scholar] [CrossRef]
- Philipp, U.; Lupp, B.; Mömke, S.; Stein, V.; Tipold, A.; Eule, J.C.; Rehage, J.; Distl, O. A MITF Mutation Associated with a Dominant White Phenotype and Bilateral Deafness in German Fleckvieh Cattle. PLoS ONE 2011, 6, e28857. [Google Scholar] [CrossRef] [PubMed]
- Fontanesi, L.; Scotti, E.; Russo, V. Haplotype variability in the bovine MITF gene and association with piebaldism in Holstein and Simmental cattle breeds. Anim. Genet. 2011, 43, 250–256. [Google Scholar] [CrossRef] [PubMed]
- Edea, Z.; Dadi, H.; Dessie, T.; Kim, I.-H.; Kim, K.-S. Association of MITF loci with coat color spotting patterns in Ethiopian cattle. Genes Genom. 2016, 39, 285–293. [Google Scholar] [CrossRef]
- Nakayama, A.; Nguyen, M.-T.T.; Chen, C.C.; Opdecamp, K.; A Hodgkinson, C.; Arnheiter, H. Mutations in microphthalmia, the mouse homolog of the human deafness gene MITF, affect neuroepithelial and neural crest-derived melanocytes differently. Mech. Dev. 1998, 70, 155–166. [Google Scholar] [CrossRef]
- Cheli, Y.; Guiliano, S.; Botton, T.; Rocchi, S.; Hofman, V.; Hofman, P.; Bahadoran, P.; Bertolotto, C.; Ballotti, R. Mitf is the key molecular switch between mouse or human melanoma initiating cells and their differentiated progeny. Oncogene 2011, 30, 2307–2318. [Google Scholar] [CrossRef]
- Hou, L.; Pavan, W.J. Transcriptional and signaling regulation in neural crest stem cell-derived melanocyte development: Do all roads lead to Mitf? Cell Res. 2008, 18, 1163–1176. [Google Scholar] [CrossRef]
- Hauswirth, R.; Haase, B.; Blatter, M.; Brooks, S.; Burger, D.; Drögemüller, C.; Gerber, V.; Henke, D.; Janda, J.; Jude, R.; et al. Mutations in MITF and PAX3 Cause “Splashed White” and Other White Spotting Phenotypes in Horses. PLoS Genet. 2012, 8, e1002653. [Google Scholar] [CrossRef]
- Magdesian, K.G.; Tanaka, J.; Bellone, R.R. A De Novo MITF Deletion Explains a Novel Splashed White Phenotype in an American Paint Horse. J. Hered. 2020, 111, 287–293. [Google Scholar] [CrossRef]
- Henkel, J.; Lafayette, C.; Brooks, S.A.; Martin, K.; Patterson-Rosa, L.; Cook, D.; Jagannathan, V.; Leeb, T. Whole-genome sequencing reveals a large deletion in the MITF gene in horses with white spotted coat colour and increased risk of deafness. Anim. Genet. 2019, 50, 172–174. [Google Scholar] [CrossRef]
- Hauswirth, R.; Jude, R.; Haase, B.; Bellone, R.R.; Archer, S.; Holl, H.; Brooks, S.A.; Tozaki, T.; Penedo, M.C.; Rieder, S.; et al. Novel variants in the KIT and PAX3 genes in horses with white-spotted coat colour phenotypes. Anim. Genet. 2013, 44, 763–765. [Google Scholar] [CrossRef]
- Körberg, I.B.; Sundström, E.; Meadows, J.R.S.; Pielberg, G.R.; Gustafson, U.; Hedhammar, Å.; Karlsson, E.K.; Seddon, J.; Söderberg, A.; Vilà, C.; et al. A Simple Repeat Polymorphism in the MITF-M Promoter Is a Key Regulator of White Spotting in Dogs. PLoS ONE 2014, 9, e104363. [Google Scholar] [CrossRef]
- Schmutz, S.M.; Berryere, T.G.; Dreger, D.L. MITF and White Spotting in Dogs: A Population Study. J. Hered. 2009, 100, S66–S74. [Google Scholar] [CrossRef][Green Version]
- Léger, S.; Balguerie, X.; Goldenberg, A.; Drouin-Garraud, V.; Cabot, A.; Amstutz-Montadert, I.; Young, P.; Joly, P.; Bodereau, V.; Holder-Espinasse, M.; et al. Novel and recurrent non-truncating mutations of the MITF basic domain: Genotypic and phenotypic variations in Waardenburg and Tietz syndromes. Eur. J. Hum. Genet. 2012, 20, 584–587. [Google Scholar] [CrossRef] [PubMed]
- Yasumoto, K.; Yokoyama, K.; Shibata, K.; Tomita, Y.; Shibahara, S. Microphthalmia-associated transcription factor as a regulator for melanocyte-specific transcription of the human tyrosinase gene. Mol. Cell. Biol. 1994, 14, 8058–8070. [Google Scholar] [CrossRef]
- Zhou, Z.K.; Li, M.; Cheng, H.; Fan, W.L.; Yuan, Z.R.; Gao, Q.; Xu, Y.X.; Guo, Z.B.; Zhang, Y.S.; Hu, J.; et al. An intercross population study reveals genes associated with body size and plumage color in ducks. Nat. Commun. 2018, 9, 2648. [Google Scholar] [CrossRef]
- Wang, Y.; Li, S.-M.; Huang, J.; Chen, S.-Y.; Liu, Y.-P. Mutations of TYR and MITF Genes are Associated with Plumage Colour Phenotypes in Geese. Asian-Australas. J. Anim. Sci. 2014, 27, 778–783. [Google Scholar] [CrossRef]
- Simcoe, M.; Valdes, A.; Liu, F.; Furlotte, N.A.; Evans, D.M.; Hemani, G.; Ring, S.M.; Smith, G.D.; Duffy, D.L.; Zhu, G.; et al. Genome-wide association study in almost 195,000 individuals identifies 50 previously unidentified genetic loci for eye color. Sci. Adv. 2021, 7, eabd1239. [Google Scholar] [CrossRef]
- Asgari, M.M.; Wang, W.; Ioannidis, N.M.; Itnyre, J.; Hoffmann, T.; Jorgenson, E.; Whittemore, A.S. Identification of Susceptibility Loci for Cutaneous Squamous Cell Carcinoma. J. Invest. Dermatol. 2016, 136, 930–937. [Google Scholar] [CrossRef]
- Wu, Z.; Deng, Z.; Huang, M.; Hou, Y.; Zhang, H.; Chen, H.; Ren, J. Whole-Genome Resequencing Identifies KIT New Alleles That Affect Coat Color Phenotypes in Pigs. Front. Genet. 2019, 10, 218. [Google Scholar] [CrossRef]
- Pla, P.; LaRue, L. Involvement of endothelin receptors in normal and pathological development of neural crest cells. Int. J. Dev. Biol. 2003, 47, 315–325. [Google Scholar]
- Braasch, I.; Volff, J.-N.; Schartl, M. The Endothelin System: Evolution of Vertebrate-Specific Ligand-Receptor Interactions by Three Rounds of Genome Duplication. Mol. Biol. Evol. 2009, 26, 783–799. [Google Scholar] [CrossRef] [PubMed]
- Verheij, J.B.G.M.; Kunze, G.; Osinga, J.; van Essen, A.J.; Hofstra, R.M.W. ABCD syndrome is caused by a homozygous mutation in the EDNRB gene. Am. J. Med. Genet. 2002, 108, 223–225. [Google Scholar] [CrossRef]
- Kinoshita, K.; Akiyama, T.; Mizutani, M.; Shinomiya, A.; Ishikawa, A.; Younis, H.H.; Tsudzuki, M.; Namikawa, T.; Matsuda, Y. Endothelin receptor B2 (EDNRB2) is responsible for the tyrosinase-independent recessive white (mo(w)) and mottled (mo) plumage phenotypes in the chicken. PLoS ONE 2014, 9, e86361. [Google Scholar] [CrossRef] [PubMed]
- Vignal, A.; Boitard, S.; Thébault, N.; Dayo, G.-K.; Yapi-Gnaore, V.; Karim, I.Y.A.; Berthouly-Salazar, C.; Pálinkás-Bodzsár, N.; Guémené, D.; Thibaud-Nissen, F.; et al. A guinea fowl genome assembly provides new evidence on evolution following domestication and selection in galliformes. Mol. Ecol. Resour. 2019, 19, 997–1014. [Google Scholar] [CrossRef] [PubMed]
- Xi, Y.; Xu, Q.; Huang, Q.; Ma, S.; Wang, Y.; Han, C.; Zhang, R.; Wang, J.; Liu, H.; Li, L. Genome-wide association analysis reveals that EDNRB2 causes a dose-dependent loss of pigmentation in ducks. BMC Genom. 2021, 22, 381. [Google Scholar] [CrossRef]
- Besch, R.; Berking, C. POU transcription factors in melanocytes and melanoma. Eur. J. Cell Biol. 2014, 93, 55–60. [Google Scholar] [CrossRef]
- Huang, S.; Sato, S. Progenitor cells in the adult zebrafish nervous system express a Brn-1-related POU gene, tai-ji. Mech. Dev. 1998, 71, 23–35. [Google Scholar] [CrossRef]
- Eng, S.R.; Dykes, I.M.; Lanier, J.; Fedtsova, N.; E Turner, E. POU-domain factor Brn3a regulates both distinct and common programs of gene expression in the spinal and trigeminal sensory ganglia. Neural Dev. 2007, 2, 3–17. [Google Scholar] [CrossRef]


Publisher’s Note: MDPI stays neutral with regard to jurisdictional claims in published maps and institutional affiliations. |
© 2022 by the authors. Licensee MDPI, Basel, Switzerland. This article is an open access article distributed under the terms and conditions of the Creative Commons Attribution (CC BY) license (https://creativecommons.org/licenses/by/4.0/).
Share and Cite
Guo, Q.; Jiang, Y.; Wang, Z.; Bi, Y.; Chen, G.; Bai, H.; Chang, G. Genome-Wide Analysis Identifies Candidate Genes Encoding Beak Color of Duck. Genes 2022, 13, 1271. https://doi.org/10.3390/genes13071271
Guo Q, Jiang Y, Wang Z, Bi Y, Chen G, Bai H, Chang G. Genome-Wide Analysis Identifies Candidate Genes Encoding Beak Color of Duck. Genes. 2022; 13(7):1271. https://doi.org/10.3390/genes13071271
Chicago/Turabian StyleGuo, Qixin, Yong Jiang, Zhixiu Wang, Yulin Bi, Guohong Chen, Hao Bai, and Guobin Chang. 2022. "Genome-Wide Analysis Identifies Candidate Genes Encoding Beak Color of Duck" Genes 13, no. 7: 1271. https://doi.org/10.3390/genes13071271
APA StyleGuo, Q., Jiang, Y., Wang, Z., Bi, Y., Chen, G., Bai, H., & Chang, G. (2022). Genome-Wide Analysis Identifies Candidate Genes Encoding Beak Color of Duck. Genes, 13(7), 1271. https://doi.org/10.3390/genes13071271