
Genome-Wide Analysis Identifies Candidate Genes Encoding Feather Color in Ducks

 and
and 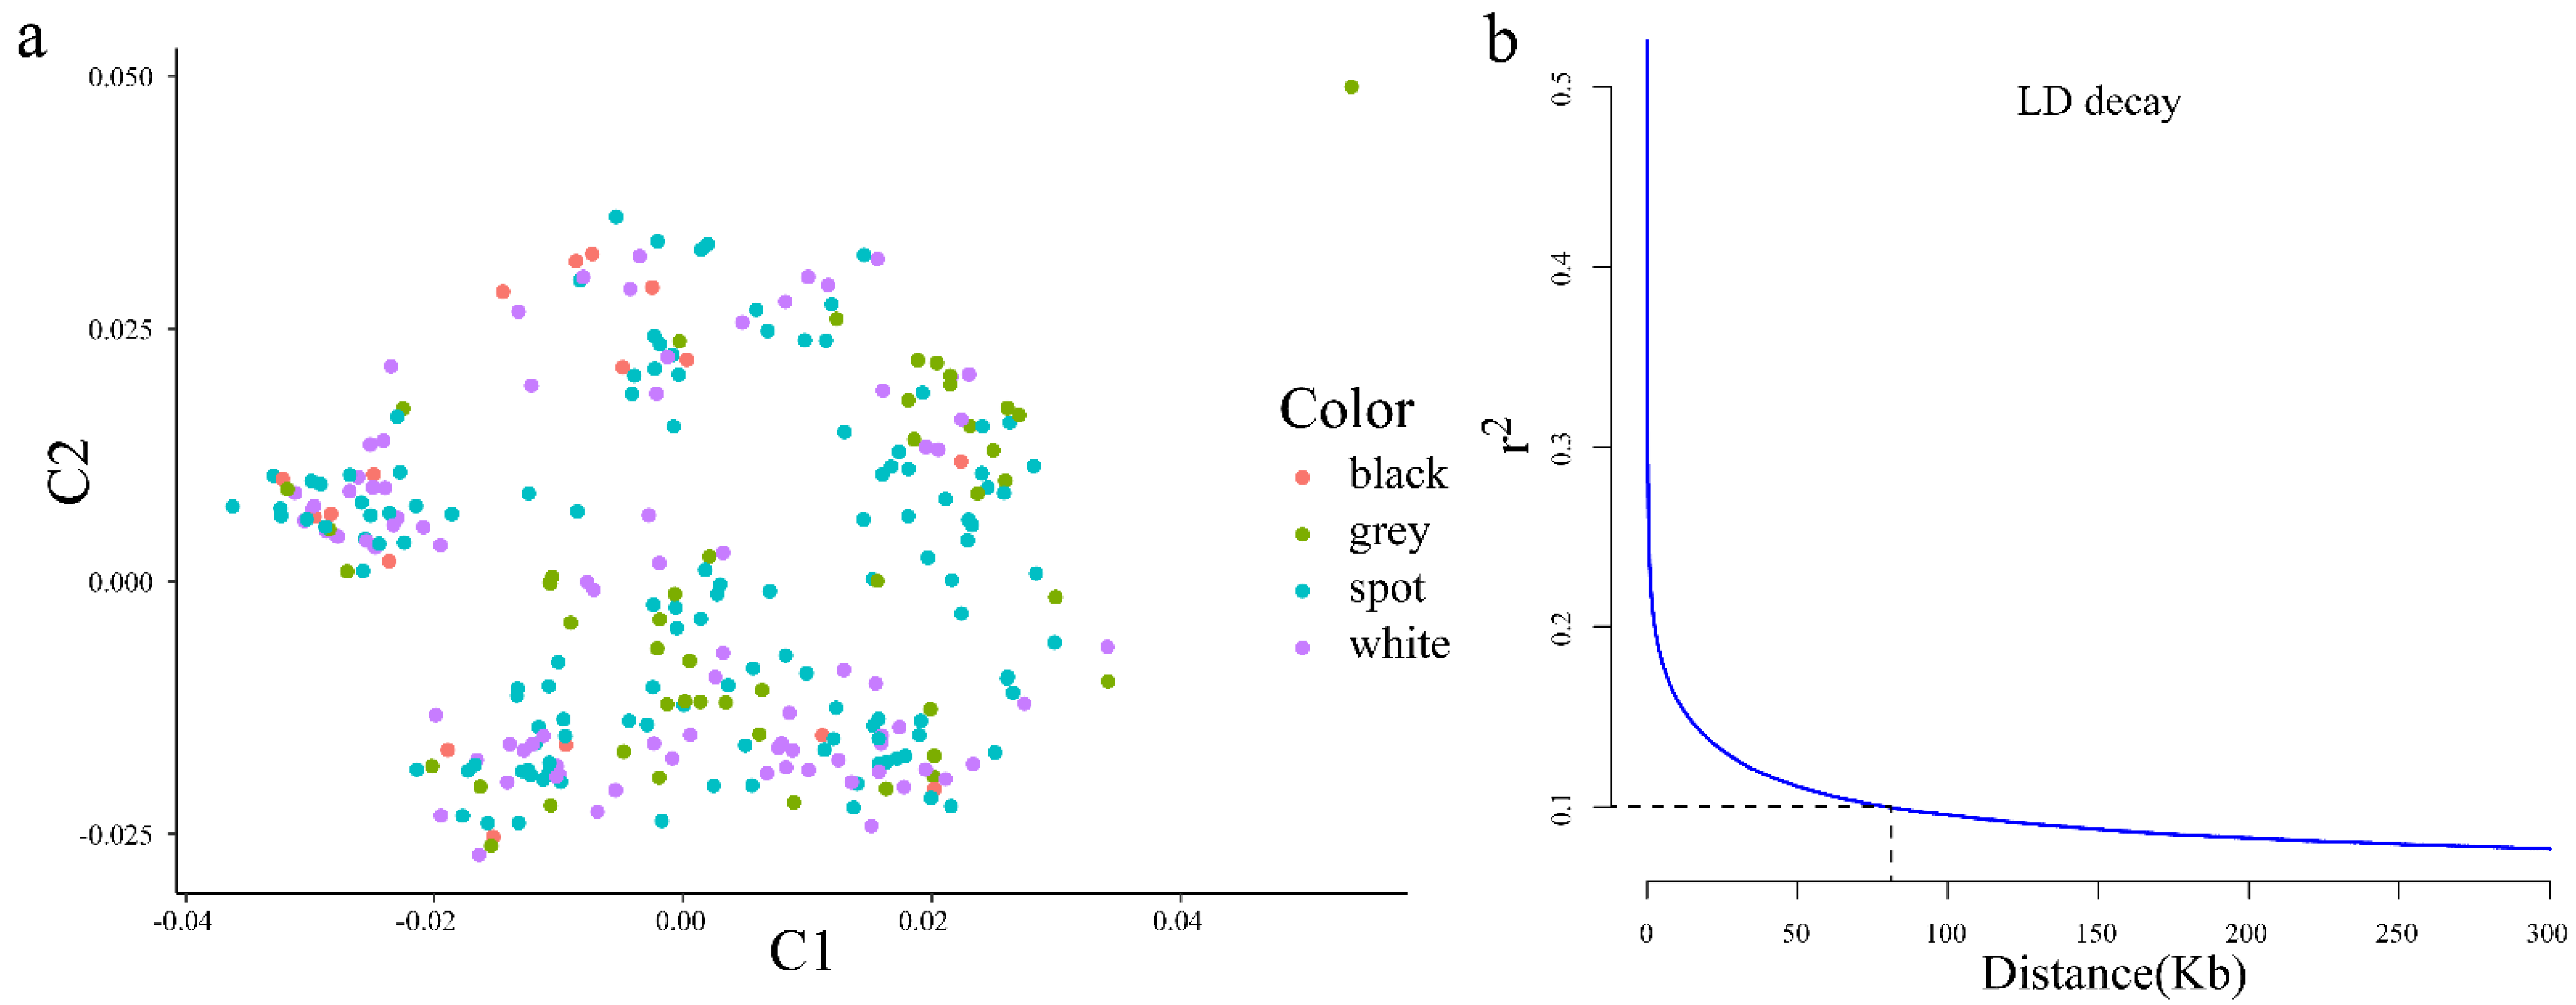
Abstract
1. Introduction
2. Materials and Methods
2.1. Ethical Approval
2.2. Samples and Sequencing
2.3. Variants Calling and Genotyping
2.4. Population Structure Analysis
2.5. Genome-Wide Association Analysis
2.6. Detection of Selection Signatures within Populations
2.7. Gene Ontology (GO) and Kyoto Encyclopaedia of Genes and Genomes (KEGG) Analyses
3. Results
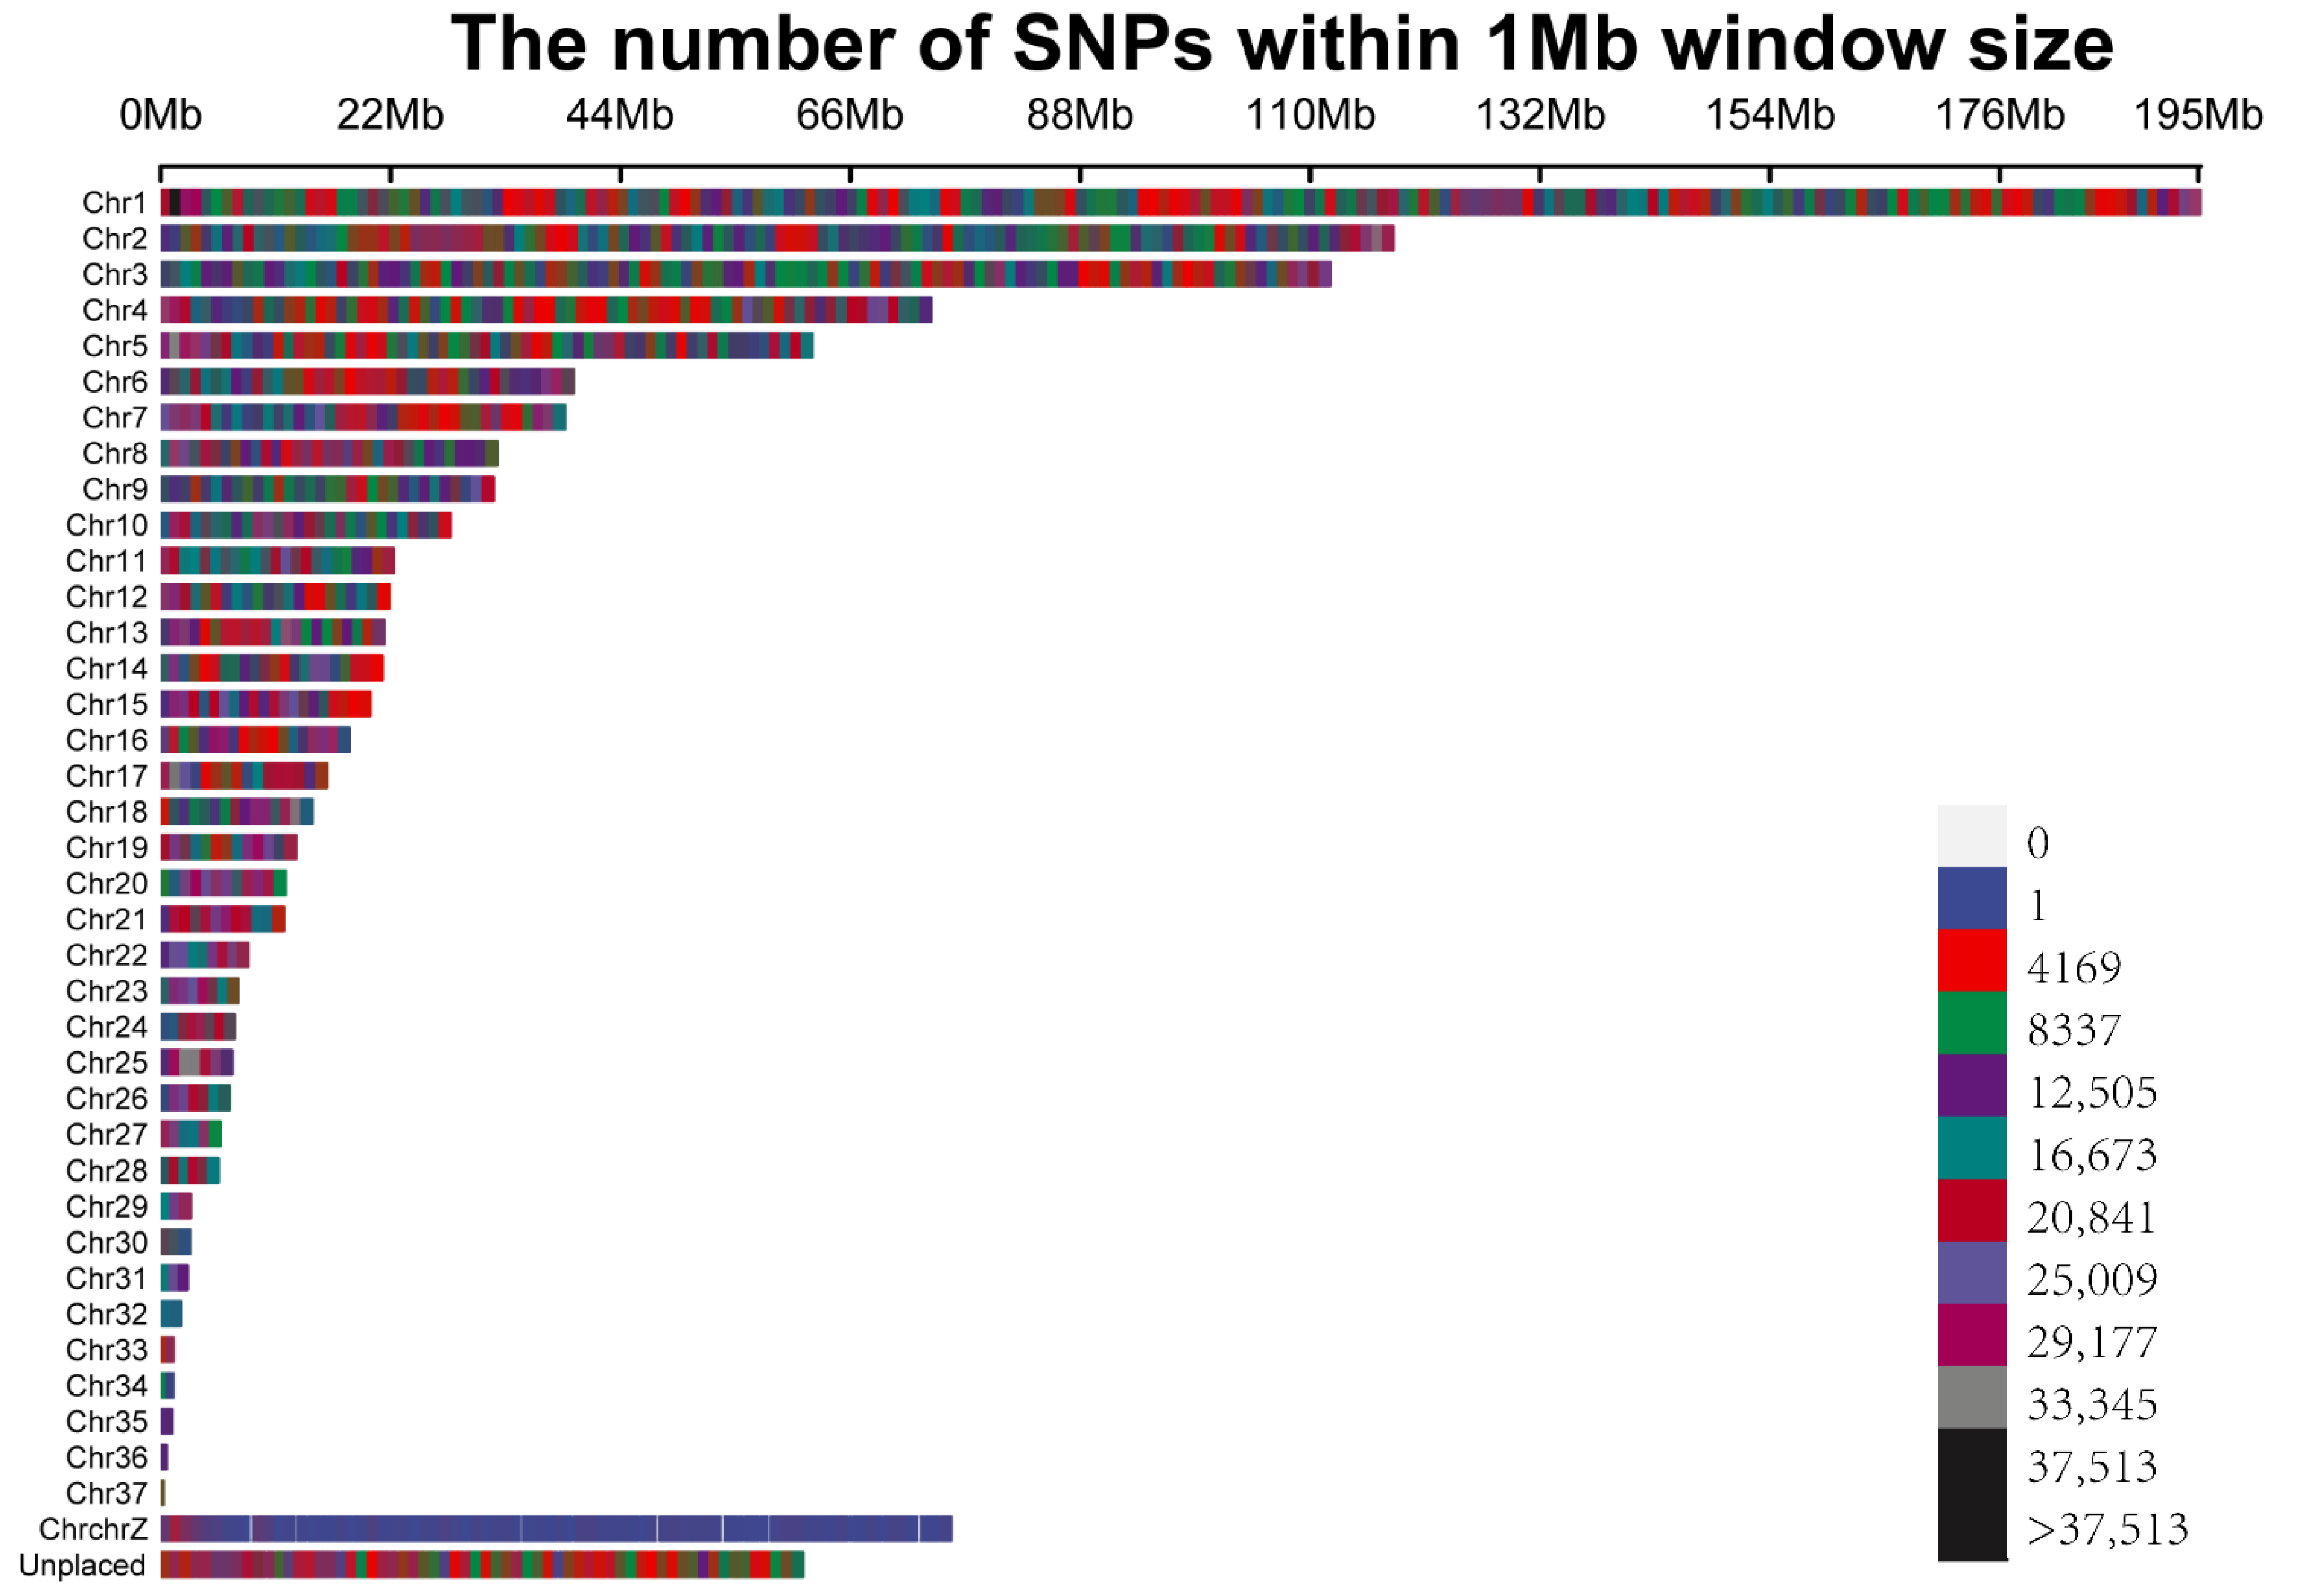
3.1. Population Structure, Linkage Disequilibrium, and Snp Distribution
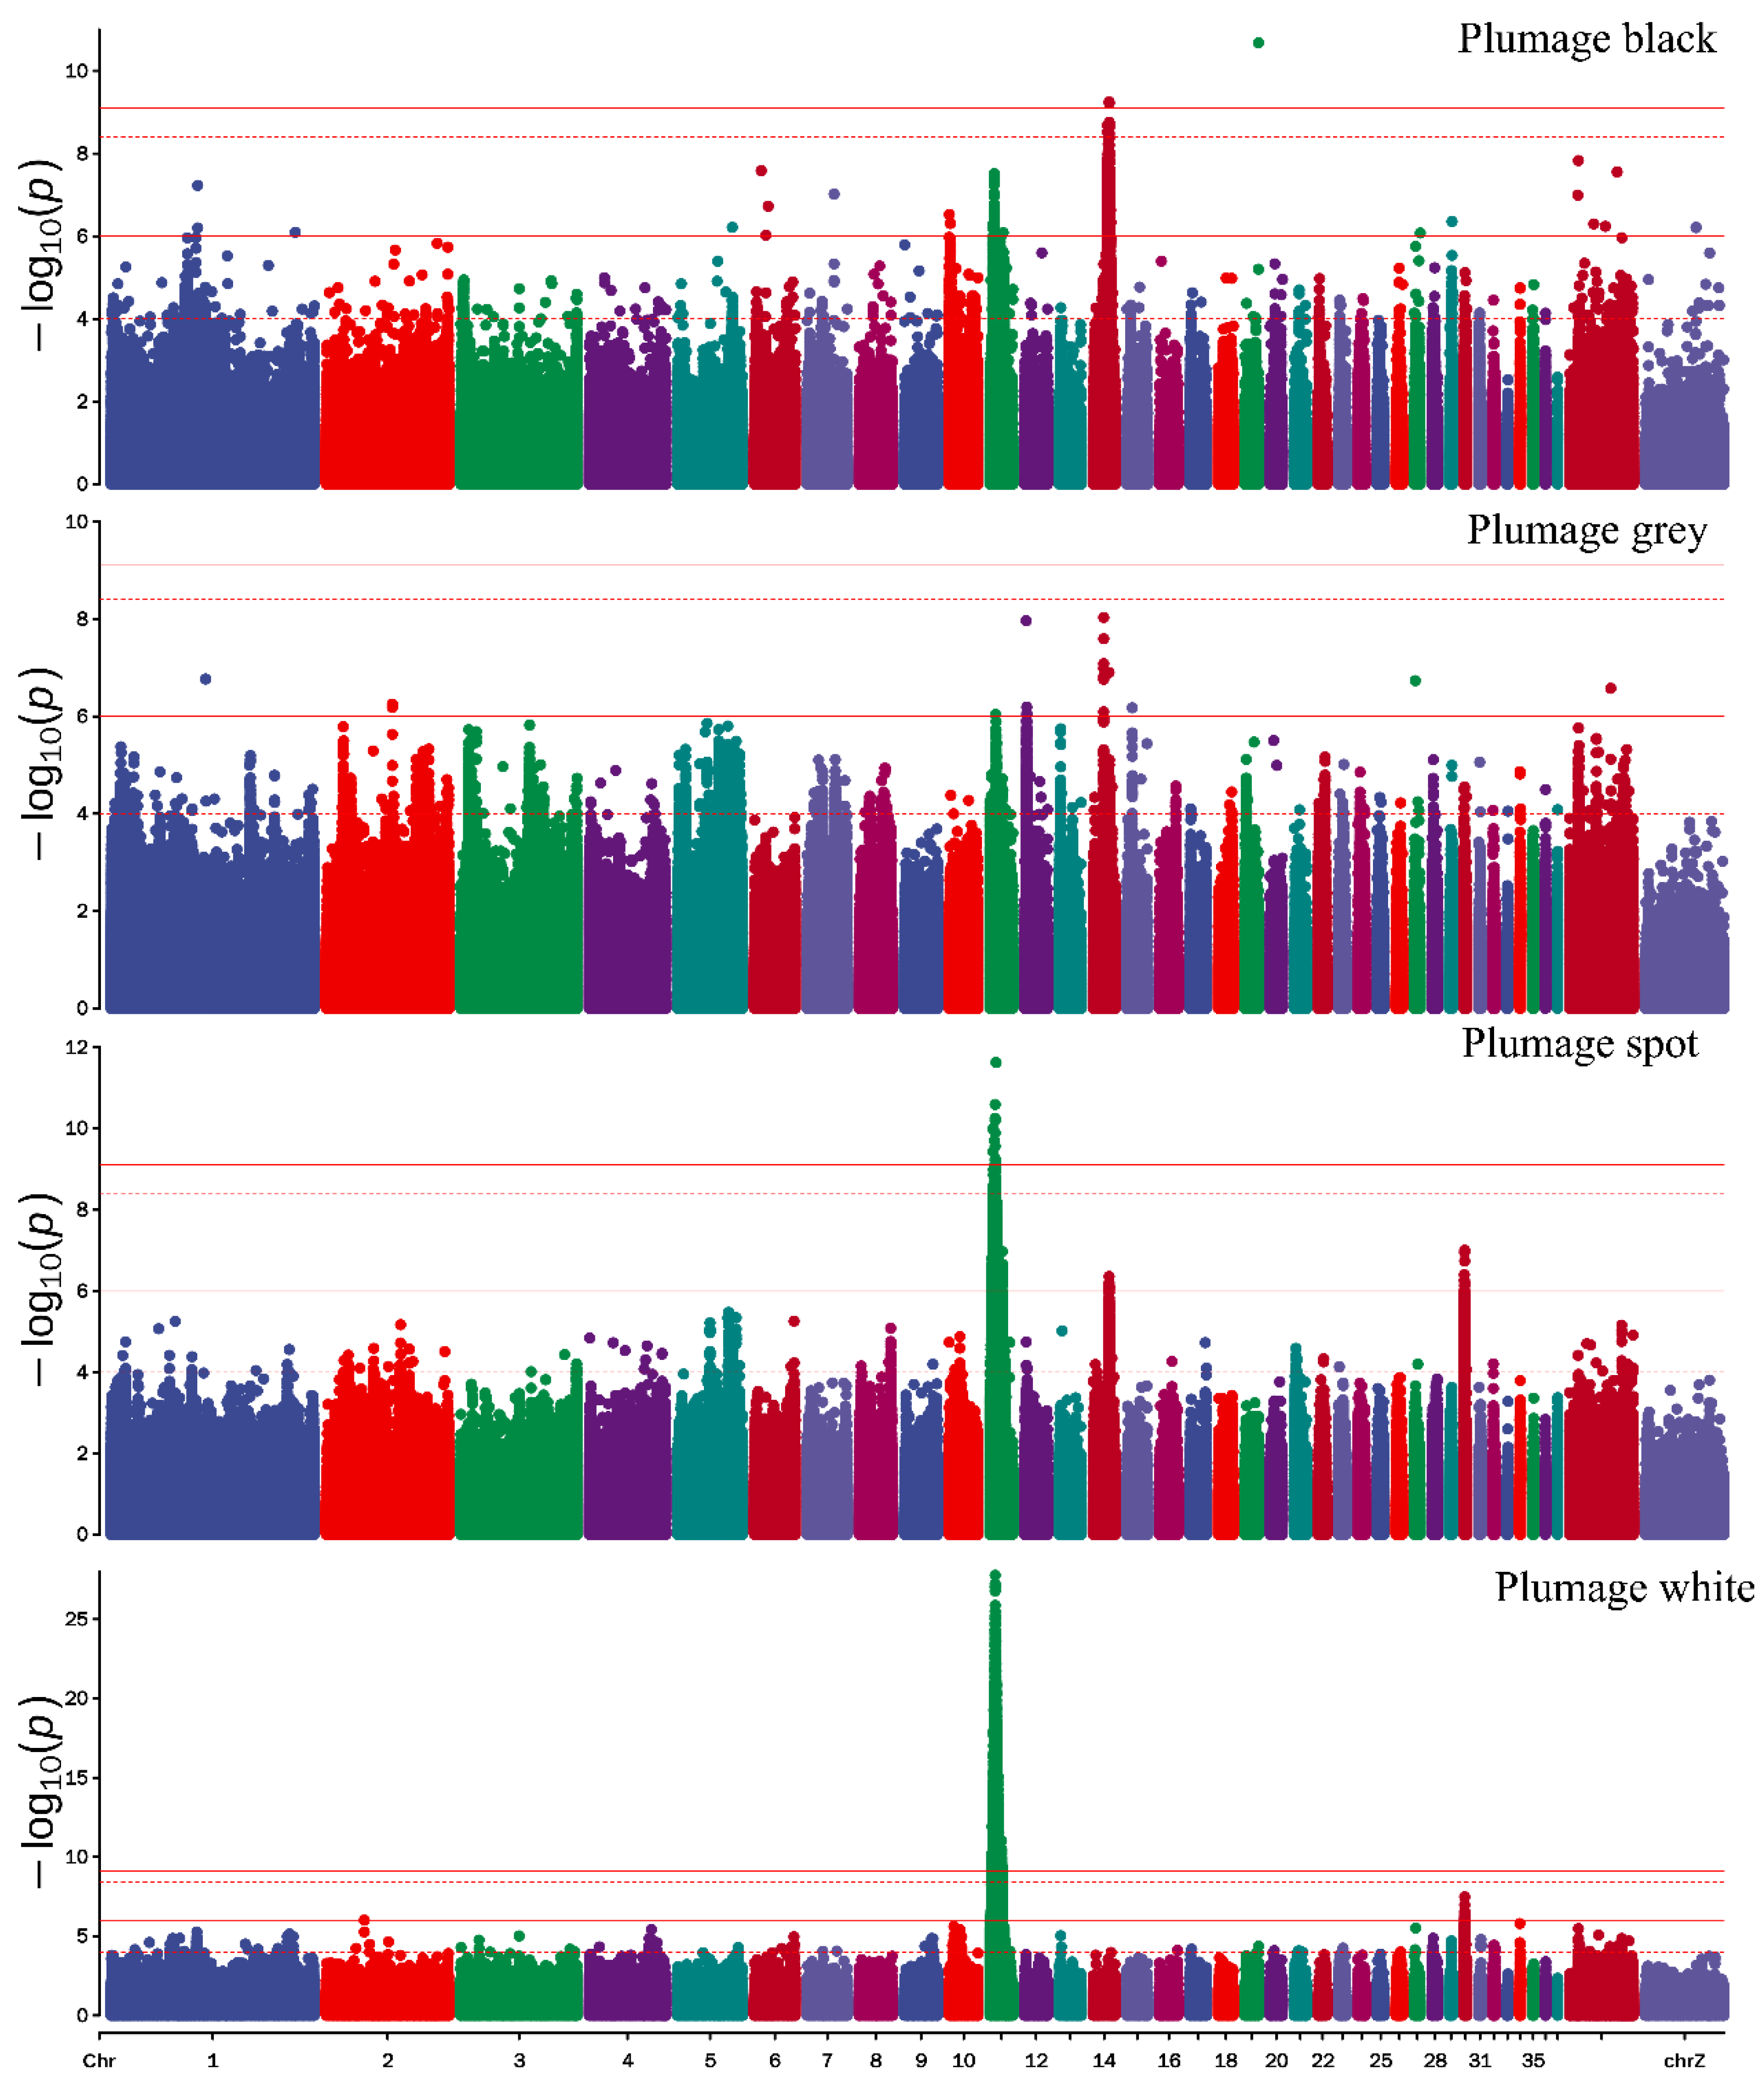
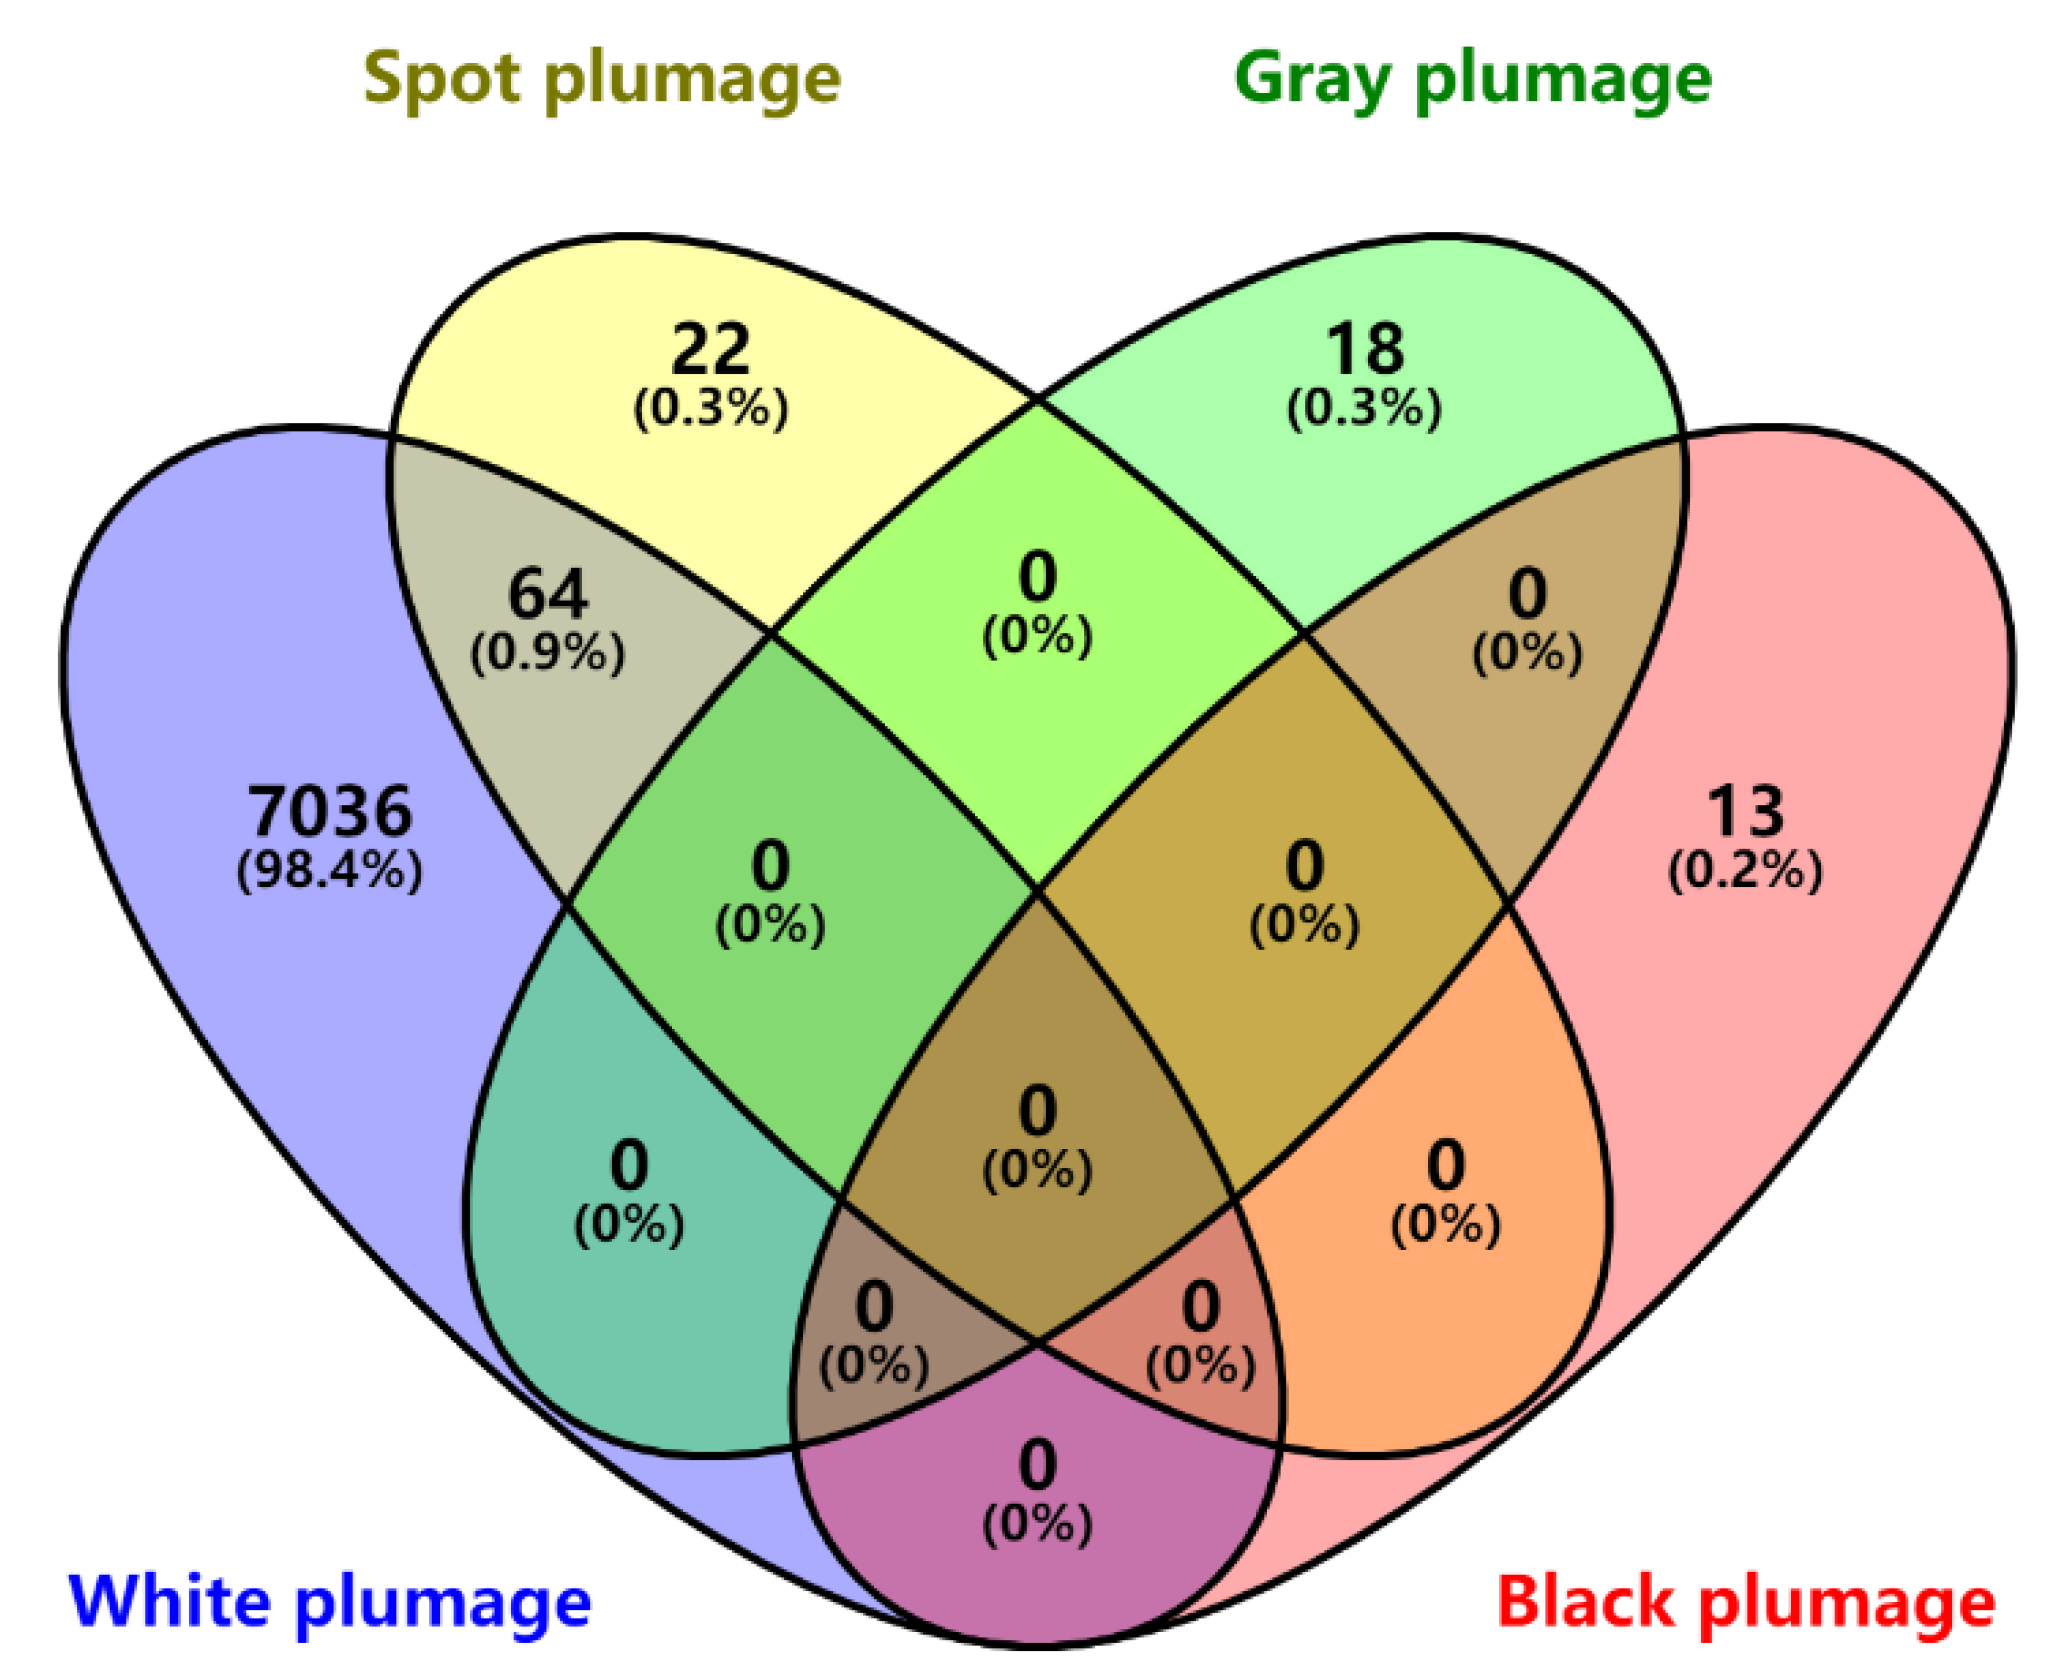
3.2. Genome-Wide Association Study Identified the Candidate Variants of Plumage Color
3.3. Selective Sweeps Analysis of the Candidate Genes of Color Plumage
4. Discussion
5. Conclusions
Supplementary Materials
Author Contributions
Funding
Institutional Review Board Statement
Informed Consent Statement
Data Availability Statement
Acknowledgments
Conflicts of Interest
References
- Shapiro, M.D.; Kronenberg, Z.; Li, C.; Domyan, E.T.; Pan, H.; Campbell, M.; Tan, H.; Huff, C.D.; Hu, H.; Vickrey, A.I.; et al. Genomic diversity and evolution of the head crest in the rock pigeon. Science 2013, 339, 1063–1067. [Google Scholar] [CrossRef]
- Price, T.D. Domesticated birds as a model for the genetics of speciation by sexual selection. Genetica 2002, 116, 311–327. [Google Scholar] [CrossRef] [PubMed]
- Zheng, P.; Sun, H.; Liu, J.; Lin, J.S.; Zhang, X.T.; Qin, Y.; Zhang, W.P.; Xu, X.M.; Deng, X.B.; Yang, D.; et al. Comparative analyses of American and Asian lotus genomes reveal insights into petal color, carpel thermogenesis and domestication. Plant J. 2022, 110, 1498–1515. [Google Scholar] [CrossRef] [PubMed]
- Stetter, M.G.; Vidal-Villarejo, M.; Schmid, K.J. Parallel Seed Color Adaptation during Multiple Domestication Attempts of an Ancient New World Grain. Mol. Biol. Evol. 2020, 37, 1407–1419. [Google Scholar] [CrossRef] [PubMed]
- Cieslak, M.; Reissmann, M.; Hofreiter, M.; Ludwig, A. Colours of domestication. Biol. Rev. 2011, 86, 885–899. [Google Scholar] [CrossRef]
- Ludwig, A.; Pruvost, M.; Reissmann, M.; Benecke, N.; Brockmann, G.A.; Castanos, P.; Cieslak, M.; Lippold, S.; Llorente, L.; Malaspinas, A.S.; et al. Coat Color Variation at the Beginning of Horse Domestication. Science 2009, 324, 485. [Google Scholar] [CrossRef]
- Marin, J.C.; Rivera, R.; Varas, V.; Cortes, J.; Agapito, A.; Chero, A.; Chavez, A.; Johnson, W.E.; Orozco-terWengel, P. Genetic Variation in Coat Colour Genes MC1R and ASIP Provides Insights Into Domestication and Management of South American Camelids. Front. Genet. 2018, 9, 487. [Google Scholar] [CrossRef]
- Zhang, Z.B.; Jia, Y.X.; Almeida, P.; Mank, J.E.; van Tuinen, M.; Wang, Q.; Jiang, Z.H.; Chen, Y.; Zhan, K.; Hou, S.S.; et al. Whole-genome resequencing reveals signatures of selection and timing of duck domestication. Gigascience 2018, 7, giy027. [Google Scholar] [CrossRef]
- Zhou, Z.K.; Li, M.; Cheng, H.; Fan, W.L.; Yuan, Z.R.; Gao, Q.; Xu, Y.X.; Guo, Z.B.; Zhang, Y.S.; Hu, J.; et al. An intercross population study reveals genes associated with body size and plumage color in ducks. Nat. Commun. 2018, 9, 2648. [Google Scholar] [CrossRef]
- Miao, Y.W.; Wu, G.S.; Wang, L.; Li, D.L.; Tang, S.K.; Liang, J.P.; Mao, H.M.; Luo, H.R.; Zhang, Y.P. The role of MC1R gene in buffalo coat color. Sci. China Life Sci. 2010, 53, 267–272. [Google Scholar] [CrossRef]
- Santana, C.J.S.; Alves, J.S.; Pinto, L.F.B.; Costa, R.B.; de Camargo, G.M.F. A deletion in the MC1R gene alters coat color in Guzerat cattle. Anim. Genet. 2021, 52, 896–897. [Google Scholar] [CrossRef] [PubMed]
- da Cruz, V.A.R.; Alves, J.S.; Bastos, M.S.; Oliveira, L.S.M.; Diaz, I.D.P.S.; Pinto, L.F.B.; Costa, R.B.; de Camargo, G.M.F. MC1R gene and coat color in buffaloes. Anim. Genet. 2020, 51, 345–346. [Google Scholar] [CrossRef]
- White, K.A.M.; Dailey, Y.T.; Guest, D.D.; Zielaskowski, K.; Robers, E.; Sussman, A.; Hunley, K.; Hughes, C.R.; Schwartz, M.R.; Kaphingst, K.A.; et al. MC1R Variation in a New Mexico Population. Cancer Epidemiol. Biomark. Prev. 2019, 28, 1853–1856. [Google Scholar] [CrossRef]
- Zhang, L.Y.; Huang, M.Y.; Li, Y.; Yang, X.D.; Luo, Y.S.; Shi, X.W. Molecular characteristics of MC1R gene in tile-grey plumage of domestic chicken. Br. Poult. Sci. 2020, 61, 382–389. [Google Scholar] [CrossRef] [PubMed]
- Araguas, R.M.; Sanz, N.; Vinas, J.; Vidal, O. MC1R polymorphism associated with plumage color variations in Coturnix chinensis. Anim. Genet. 2018, 49, 475–477. [Google Scholar] [CrossRef] [PubMed]
- Wang, Y.; Li, S.M.; Huang, J.; Chen, S.Y.; Liu, Y.P. Mutations of TYR and MITF Genes are Associated with Plumage Colour Phenotypes in Geese. Asian Austral. J. Anim. 2014, 27, 778–783. [Google Scholar] [CrossRef]
- Minvielle, F.; Cecchi, T.; Passamonti, P.; Gourichon, D.; Renieri, C. Plumage colour mutations and melanins in the feathers of the Japanese quail: A first comparison. Anim. Genet. 2009, 40, 971–974. [Google Scholar] [CrossRef]
- Wu, N.; Qin, H.; Wang, M.; Bian, Y.; Dong, B.; Sun, G.; Zhao, W.; Chang, G.; Xu, Q.; Chen, G. Variations in endothelin receptor B subtype 2 (EDNRB2) coding sequences and mRNA expression levels in 4 Muscovy duck plumage colour phenotypes. Brit. Poultry Sci. 2017, 58, 116–121. [Google Scholar] [CrossRef]
- Miwa, M.; Inoue-Murayama, M.; Aoki, H.; Kunisada, T.; Hiragaki, T.; Mizutani, M.; Ito, S. Endothelin receptor B2 (EDNRB2) is associated with the panda plumage colour mutation in Japanese quail. Anim. Genet. 2007, 38, 103–108. [Google Scholar] [CrossRef]
- Yang, C.W.; Ran, J.S.; Yu, C.L.; Qiu, M.H.; Zhang, Z.R.; Du, H.R.; Li, Q.Y.; Xiong, X.; Song, X.Y.; Xia, B.; et al. Polymorphism in MC1R, TYR and ASIP genes in different colored feather chickens. 3 Biotech 2019, 9, 203. [Google Scholar] [CrossRef]
- Liu, X.; Zhou, R.; Peng, Y.; Zhang, C.; Li, L.; Lu, C.; Li, X. Feather follicles transcriptome profiles in Bashang long-tailed chickens with different plumage colors. Genes Genom. 2019, 41, 1357–1367. [Google Scholar] [CrossRef] [PubMed]
- Xu, Y.; Zhang, X.H.; Pang, Y.Z. Association of Tyrosinase (TYR) and Tyrosinase-related Protein 1 (TYRP1) with Melanic Plumage Color in Korean Quails (Coturnix coturnix). Asian-Australas. J. Anim. Sci. 2013, 26, 1518–1522. [Google Scholar] [CrossRef] [PubMed]
- Theron, E.; Hawkins, K.; Bermingham, E.; Ricklefs, R.E.; Mundy, N.I. The molecular basis of an avian plumage polymorphism in the wild: A melanocortin-1-receptor point mutation is perfectly associated with the melanic plumage morph of the bananaquit, Coereba flaveola. Curr. Biol. 2001, 11, 550–557. [Google Scholar] [CrossRef]
- Baiao, P.C.; Schreiber, E.; Parker, P.G. The genetic basis of the plumage polymorphism in red-footed boobies (Sula sula): A melanocortin-1 receptor (MC1R) analysis. J. Hered. 2007, 98, 287–292. [Google Scholar] [CrossRef] [PubMed][Green Version]
- Mundy, N.I.; Badcock, N.S.; Hart, T.; Scribner, K.; Janssen, K.; Nadeau, N.J. Conserved genetic basis of a quantitative plumage trait involved in mate choice. Science 2004, 303, 1870–1873. [Google Scholar] [CrossRef] [PubMed]
- Steingrimsson, E.; Copeland, N.G.; Jenkins, N.A. Melanocytes and the Microphthalmia transcription factor network. Annu. Rev. Genet. 2004, 38, 365–411. [Google Scholar] [CrossRef]
- Hallsson, J.H.; Haflidadottir, B.S.; Schepsky, A.; Arnheiter, H.; Steingrimsson, E. Evolutionary sequence comparison of the Mitf gene reveals novel conserved domains. Pigm. Cell Res. 2007, 20, 185–200. [Google Scholar] [CrossRef]
- Levy, C.; Khaled, M.; Fisher, D.E. MITF: Master regulator of melanocyte development and melanoma oncogene. Trends Mol. Med. 2006, 12, 406–414. [Google Scholar] [CrossRef]
- Minvielle, F.; Bed’hom, B.; Coville, J.L.; Ito, S.; Inoue-Murayama, M.; Gourichon, D. The “silver” Japanese quail and the MITF gene: Causal mutation, associated traits and homology with the “blue” chicken plumage. BMC Genet. 2010, 11, 15. [Google Scholar] [CrossRef]
- Karlsson, E.K.; Baranowska, I.; Wade, C.M.; Salmon Hillbertz, N.H.C.; Zody, M.C.; Anderson, N.; Biagi, T.M.; Patterson, N.; Pielberg, G.R.; Kulbokas, E.J.; et al. Efficient mapping of mendelian traits in dogs through genome-wide association. Nat. Genet. 2007, 39, 1321–1328. [Google Scholar] [CrossRef]
- Li, S.J.; Wang, C.; Yu, W.H.; Zhao, S.H.; Gong, Y.Z. Identification of Genes Related to White and Black Plumage Formation by RNA-Seq from White and Black Feather Bulbs in Ducks. PLoS ONE 2012, 7, e36592. [Google Scholar] [CrossRef] [PubMed]
- Dong, X.; Li, J.; Zhang, Y.; Han, D.; Hua, G.; Wang, J.; Deng, X.; Wu, C. Genomic Analysis Reveals Pleiotropic Alleles at EDN3 and BMP7 Involved in Chicken Comb Color and Egg Production. Front. Genet. 2019, 10, 612. [Google Scholar] [CrossRef] [PubMed]
- Yang, L.; Du, X.; Wei, S.; Gu, L.; Li, N.; Gong, Y.; Li, S. Genome-wide association analysis identifies potential regulatory genes for eumelanin pigmentation in chicken plumage. Anim. Genet. 2017, 48, 611–614. [Google Scholar] [CrossRef] [PubMed]
- Li, H. Exploring single-sample SNP and INDEL calling with whole-genome de novo assembly. Bioinformatics 2012, 28, 1838–1844. [Google Scholar] [CrossRef] [PubMed]
- Purcell, S.; Neale, B.; Todd-Brown, K.; Thomas, L.; Ferreira, M.A.; Bender, D.; Maller, J.; Sklar, P.; de Bakker, P.I.; Daly, M.J.; et al. PLINK: A tool set for whole-genome association and population-based linkage analyses. Am. J. Hum. Genet. 2007, 81, 559–575. [Google Scholar] [CrossRef]
- Kang, H.; Sul, J.; Service, S.; Zaitlen, N.A.; Kong, S.-Y.; Freimer, N.B.; Sabatti, C.; Eskin, E. Variance component model to account for sample structure in genome-wide association studies. Nat. Genet. 2010, 42, 348–354. [Google Scholar] [CrossRef]
- Danecek, P.; Auton, A.; Abecasis, G.; Albers, C.A.; Banks, E.; De Pristo, M.A.; Handsaker, R.E.; Lunter, G.; Marth, G.T.; Sherry, S.T.; et al. 1000 Genomes Project Analysis Group. The variant call format and VCFtools. Bioinformatics 2011, 27, 2156–2158. [Google Scholar]
- Hunt, S.E.; Moore, B.; Amode, R.M.; Armean, I.M.; Lemos, D.; Mushtaq, A.; Parton, A.; Schuilenburg, H.; Szpak, M.; Thormann, A.; et al. Annotating and prioritizing genomic variants using the Ensembl Variant Effect Predictor-A tutorial. Hum. Mutat. 2021. [Google Scholar] [CrossRef]
- McLaren, W.; Gil, L.; Hunt, S.E.; Singh Riat, H.; Ritchie, G.R.S.; Thormann, A.; Flicek, P.; Cunningham, F. The Ensembl Variant Effect Predictor. Genome Biol. 2016, 17, 122. [Google Scholar] [CrossRef]
- Zhang, C.; Dong, S.-S.; Xu, J.-Y.; He, W.-M.; Yang, T.-L. PopLDdecay: A fast and effective tool for linkage disequilibrium decay analysis based on variant call format files. Bioinformatics 2019, 35, 1786–1788. [Google Scholar] [CrossRef]
- Xie, C.; Mao, X.; Huang, J.; Ding, Y.; Wu, J.; Dong, S.; Kong, L.; Gao, G.; Li, C.Y.; Wei, L. KOBAS 2.0: A web server for annotation and identification of enriched pathways and diseases. Nucleic Acids Res. 2011, 39, W316–W322. [Google Scholar]
- Ng, C.S.; Li, W.-H. Genetic and Molecular Basis of Feather Diversity in Birds. Genome Biol. Evol. 2018, 10, 2572–2586. [Google Scholar] [CrossRef] [PubMed]
- Boer, E.; Hollebeke, H.; Shapiro, M. Genomic determinants of epidermal appendage patterning and structure in domestic birds. Dev. Biol. 2017, 429, 409–419. [Google Scholar] [CrossRef] [PubMed]
- Javůrková, V.G.; Enbody, E.D.; Kreisinger, J.; Chmel, K.; Mrázek, J.; Karubian, J. Plumage iridescence is associated with distinct feather microbiota in a tropical passerine. Sci. Rep. 2019, 9, 12921. [Google Scholar] [CrossRef]
- Hill, G.E.; McGraw, K.J. Bird Coloration, Volume 1: Mechanisms and Measurements; Harvard University Press: London, UK, 2006. [Google Scholar]
- Auber, L. The distribution of structural colors and unusual pigments in the Call Aves. Ibis 2008, 99, 463–476. [Google Scholar] [CrossRef]
- Delmore, K.E.; Toews, D.P.; Germain, R.R.; Owens, G.L.; Irwin, D.E. The Genetics of Seasonal Migration and Plumage Color. Curr. Biol. 2016, 26, 2167–2173. [Google Scholar] [CrossRef]
- Davoodi, P.; Ehsani, A.; Vaez Torshizi, R.; Masoudi, A.A. New insights into genetics underlying of plumage color. Anim. Genet. 2022, 53, 80–93. [Google Scholar] [CrossRef]
- Ran, J.-S.; You, X.-Y.; Jin, J.; Zhou, Y.-G.; Wang, Y.; Lan, D.; Ren, P.; Liu, Y.-P. The Relationship between MC1R Mutation and Plumage Color Variation in Pigeons. BioMed Res. Int. 2016, 2016, 3059756. [Google Scholar] [CrossRef]
- Xin, Q.-W.; Miao, Z.-W.; Liu, Z.-Y.; Li, L.; Zhang, L.-L.; Zhu, Z.-M.; Zhang, Z.-H.; Zheng, N.-Z.; Wang, Z.-C. Expression and contribution of microphthalmia-associated transcription factor to the melanin deposition in Liancheng white ducks. J. Integr. Agric. 2020, 19, 800–809. [Google Scholar] [CrossRef]
- Yang, L.; Mo, C.; Shen, W.; Du, X.; Akbar Bhuiyan, A.; Li, L.; Li, N.; Gong, Y.; Li, S. The recessive C locus in the MITF gene plays a key regulatory role in the plumage colour pattern of duck (Anas platyrhynchos). Br. Poult. Sci. 2019, 60, 105–108. [Google Scholar] [CrossRef]
- Vachtenheim, J.; Borovanský, J. “Transcription physiology” of pigment formation in melanocytes: Central role of MITF. Exp. Dermatol. 2010, 19, 617–627. [Google Scholar] [CrossRef] [PubMed]
- Liu, H.; Wang, J.; Hu, J.; Wang, L.; Guo, Z.; Fan, W.; Xu, Y.; Liu, D.; Zhang, Y.; Xie, M.; et al. Genome-wide association analysis reveal the genetic reasons affect melanin spot accumulation in beak skin of ducks. BMC Genom. 2022, 23, 236. [Google Scholar] [CrossRef] [PubMed]
- Fridmanis, D.; Roga, A.; Klovins, J. ACTH receptor (MC2R) specificity: What do we know about underlying molecular mechanisms? Front. Endocrinol. 2017, 8, 13. [Google Scholar] [CrossRef]
- Xi, Y.; Wang, L.; Liu, H.; Ma, S.; Li, Y.; Li, L.; Wang, J.; Chunchun, H.; Bai, L.; Mustafa, A.; et al. A 14-bp insertion in endothelin receptor B-like (EDNRB2) is associated with white plumage in Chinese geese. BMC Genom. 2020, 21, 162. [Google Scholar] [CrossRef] [PubMed]
- Xi, Y.; Xu, Q.; Huang, Q.; Ma, S.; Wang, Y.; Han, C.; Zhang, R.; Wang, J.; Liu, H.; Li, L. Genome-wide association analysis reveals that EDNRB2 causes a dose-dependent loss of pigmentation in ducks. BMC Genom. 2021, 22, 381. [Google Scholar] [CrossRef] [PubMed]


Publisher’s Note: MDPI stays neutral with regard to jurisdictional claims in published maps and institutional affiliations. |
© 2022 by the authors. Licensee MDPI, Basel, Switzerland. This article is an open access article distributed under the terms and conditions of the Creative Commons Attribution (CC BY) license (https://creativecommons.org/licenses/by/4.0/).
Share and Cite
Guo, Q.; Jiang, Y.; Wang, Z.; Bi, Y.; Chen, G.; Bai, H.; Chang, G. Genome-Wide Analysis Identifies Candidate Genes Encoding Feather Color in Ducks. Genes 2022, 13, 1249. https://doi.org/10.3390/genes13071249
Guo Q, Jiang Y, Wang Z, Bi Y, Chen G, Bai H, Chang G. Genome-Wide Analysis Identifies Candidate Genes Encoding Feather Color in Ducks. Genes. 2022; 13(7):1249. https://doi.org/10.3390/genes13071249
Chicago/Turabian StyleGuo, Qixin, Yong Jiang, Zhixiu Wang, Yulin Bi, Guohong Chen, Hao Bai, and Guobin Chang. 2022. "Genome-Wide Analysis Identifies Candidate Genes Encoding Feather Color in Ducks" Genes 13, no. 7: 1249. https://doi.org/10.3390/genes13071249
APA StyleGuo, Q., Jiang, Y., Wang, Z., Bi, Y., Chen, G., Bai, H., & Chang, G. (2022). Genome-Wide Analysis Identifies Candidate Genes Encoding Feather Color in Ducks. Genes, 13(7), 1249. https://doi.org/10.3390/genes13071249