Article

Expression of HK2, PKM2, and PFKM Is Associated with Metastasis and Late Disease Onset in Breast Cancer Patients

1
Department of Biosciences, COMSATS University Islamabad, Islamabad 44000, Pakistan
2
Department of Molecular Biology, Shaheed Zulfiqar Ali Bhutto Medical University, Islamabad 44000, Pakistan
3
National Veterinary Lab, National Agricultural Research Centre, Islamabad 44000, Pakistan
4
Department of General Surgery, Rawalpindi Medical University, Rawalpindi 46000, Pakistan
5
Department of Botany, PMAS-Arid Agriculture University Rawalpindi, Rawalpindi 46300, Pakistan
6
Department of Food Science and Nutrition, College of Sciences, Taif University, P.O. Box 11099, Taif 21944, Saudi Arabia
7
Department of Physical Sport Science, College of Education, Princess Nourah bint Abdulrahman University, P.O. Box 84428, Riyadh 11671, Saudi Arabia
8
Department of Medical Laboratory Sciences, Faculty of Applied Medical Sciences, King Abdulaziz University, P.O. Box 80216, Jeddah 21589, Saudi Arabia
9
King Fahd Medical Research Center, King Abdulaziz University, P.O. Box 80216, Jeddah 21589, Saudi Arabia
*
Author to whom correspondence should be addressed.
Genes 2022, 13(3), 549; https://doi.org/10.3390/genes13030549
Submission received: 4 February 2022 / Revised: 9 March 2022 / Accepted: 16 March 2022 / Published: 20 March 2022
(This article belongs to the Special Issue Public Health Genetics and Genomics)

Abstract

:
The reprogramming of energy metabolism is one of the hallmarks of cancer and is crucial for tumor progression. Altered aerobic glycolysis is a well-known characteristic of cancer cell metabolism. In the present study, the expression profiles of key metabolic genes (HK2, PFKM, and PKM2) were assessed in the breast cancer cohort of Pakistan using quantitative polymerase chain reaction (qPCR) and IHC. Expression patterns were correlated with molecular subtypes and clinical parameters in the patients. A significant upregulation of key glycolytic genes was observed in tumor samples in comparison to their adjacent controls (p < 0.0001). The expression of the studied glycolytic genes was significantly increased in late clinical stages, positive nodal involvement, and distant metastasis (p < 0.05). HK2 and PKM2 were found to be upregulated in luminal B, whereas PFKM was overexpressed in the luminal A subtype of breast cancer. The genes were positively correlated with the proliferation marker Ki67 (p < 0.001). Moreover, moderate positive linear correlations between HK2 and PKM2 (r = 0.476), HK2 and PFKM (r = 0.473), and PKM2 and PFKM (r = 0.501) were also observed (p < 0.01). These findings validate that the key regulatory genes in glycolysis can serve as potential biomarkers and/or molecular targets for breast cancer management. However, the clinical significance of these molecules needs to be further validated through in vitro and in vivo experiments.

1. Introduction

Metabolic reprogramming or disturbance in energy metabolism is the most common characteristic in malignant tumors and one of the hallmarks of cancer [1]. To maintain rapid growth, cancer cells can alter their capability to metabolize lipids, carbohydrates, and proteins [2]. Normal cells follow oxidative phosphorylation (OXPHOS) by consuming glucose and oxygen in order to produce energy and shift metabolism to glycolysis in hypoxic conditions (oxygen-deprived environments) to fulfill their energy needs [3]. On the contrary, cancer cells mainly produce energy by glycolysis, even in the abundance of oxygen, which has been termed the “Warburg effect” [4].
Cancer glycolysis is a key step in oncogenic activation and tumor progression. Glycolysis leads to a breakdown of glucose molecules to pyruvate, with the help of hexokinase (HK), phosphofructokinase (PFK), and pyruvate kinase (PK) [5]. These enzymes exist in various isoforms, which are encoded by their specific genes. To date, four isoforms of HKs have been characterized in mammals [6]. Of these, the one encoded by the HK2 (hexokinase 2) gene was found to be overexpressed in a variety of cancers, i.e., colorectal [7], lung [8], digestive [9], and liver cancers [10]. HK2 catalyzes the initial step during glycolysis by phosphorylating glucose to produce glucose-6-phosphate (G-6P). Moreover, knockdown of HK2 leads to tumor growth inhibition in prostate, glioblastoma, and pancreatic cancers [8]. In addition, an association of hyperactive glycolysis with HK2 overexpression was found in hepatocellular carcinomas [11]. An increase in overall survival and decreased tumor burden was seen upon HK2 deletion in KRAS-driven lung cancer and ERBB2 driven breast cancer [8].
Phosphofructokinase is the key rate-limiting enzyme of all the glycolysis regulatory catalytic complexes. It is responsible for controlling the maximum percentage of glycolytic activity [12]. Conversion of fructose-6-phosphate to fructose-1,6-bisphosphate in glycolysis is mediated by phosphofructokinase with a release of energy [13]. Out of the three isoforms, the PFKM is a crucial regulatory target encoded by the PFKM (phosphofructokinase muscle) gene, as it serves as an activator of muscle glycolysis, which is critical for cancer dissemination [14]. Moreover, an in silico study reported PFKM as a potential therapeutic target for cancer and aerobic glycolysis. PFKM genetic mutation associated with different cancers, including human melanomas, breast cancer, bladder cancer, non-small-cell lung cancer, and glioma has also been observed [15].
PKM2 (pyruvate kinase isozyme M2) plays a key role in the regulation of cell metabolism by catalyzing the final step of glycolysis [16]. It converts phosphoenolpyruvate to produce pyruvate and ATP [17]. Studies have shown that PKM2 gene expression is critical for aerobic glycolysis in cancer cells [18]. PKM2 also functions as a coactivator of HIF1 (hypoxia-inducible factor) to promote Warburg metabolism [19]. It has been reported that a shift in metabolism from glycolysis to OXPHOS occurred when mice were engineered to express PKM1 instead of PKM2 [20]. The role of PKM2 has been studied in a variety of cancers including melanoma, lung, cervical, and colorectal cancers [21].
Dysregulation of key metabolic genes, namely, HK2, PFKM, and PKM2, has the potential to disrupt glycolytic metabolism and remove additional barriers against tumor progression [22,23]. Hence, the current study aims to explore the expression profiles of these genes in the breast cancer cohort of Pakistan. In addition, the correlation of glycolytic markers with clinicopathological parameters, the Ki67 proliferation marker, and molecular subtypes in breast cancer was also assessed. This study will provide insight into the potential role of glycolytic genes in breast tumor progression and metastasis.

2. Materials and Methods

2.1. Inclusion and Exclusion Criteria

Patients who were diagnosed with breast cancer were included in the study. Patients with a history of hereditary/familial diseases, hepatitis, and HIV (human immunodeficiency virus) were excluded.

2.2. Tissue and Data Collection

The current study was conducted after formal approval from biosafety and bio-ethical committees of COMSATS University and affiliated hospitals. The study cohort consisted of freshly excised breast tumor specimens along with their adjacent normal (2 cm away from the site of the tumor) tissues (n = 120; tumor tissue = 60; control tissue = 60). The samples were obtained with informed patient consent. Demographic data, including age, menopausal status, laterality, and clinicopathological findings (including tumor grade, stage, size, nodal involvement, and receptor status), were also retrieved. Samples were immediately transferred to RNA later solution and stored at −80 °C until further use.

2.3. RNA Extraction and cDNA Synthesis

Samples from both tumor tissues and adjacent controls were homogenized for RNA isolation using TRIzol® Reagent. The purity of RNA was measured using a spectrophotometer at absorbances of 260 nm and 280 nm. cDNA (complementary DNA) was generated from 0.5 µg of RNA using Revert Aid First Strand cDNA Synthesis Kit (Thermo Scientific, San Diego, USA) according to manufacturer’s instructions.

2.4. Primer Designing

Primers were designed using an online available tool PRIMER 3. Primer specificity was confirmed using NCBI primer Blast. Primer sequences for the studied genes, i.e., HK2, PKM2, PFKM, Ki67, and β-actin, along with their product sizes, are listed in Table 1.

2.5. Quantitative Real Time PCR

The resulting cDNA was then subjected to qPCR using SYBR green qPCR Master Mix (Thermo Scientific, San Diego, USA). The qPCR reaction was performed with initial denaturation for 12 min at 95 °C followed by 35 cycles of amplification (denaturation for 45 s at 94 °C, annealing at 59 °C for 30 s, and elongation for 30 s at 72 °C) as per the manufacturer’s instructions using the Applied Biosystems 9200 system. Β-actin was used as an internal control.

2.6. Immuno-Histochemistry (IHC)

IHC was performed with these antibodies (200 µg/mL), anti-hexokinase II (HXK II (B-8); sc-374091; dilution 1:400; Santa cruz, CA, USA); anti-phosphofructokinase (PFK1 (E-4); sc-377346; dilution 1:500; Santa cruz, CA, USA); and anti-pyruvate kinase muscle (PKM (C-11); sc-365684; dilution 1:200; Santa cruz, CA, USA), using the methodology described earlier [24]. Protein expression of the respective genes was compared between adjacent normal tissues as controls and tumor samples retrieved from paraffin-embedded formalin-fixed blocks of breast cancer-affected patients.

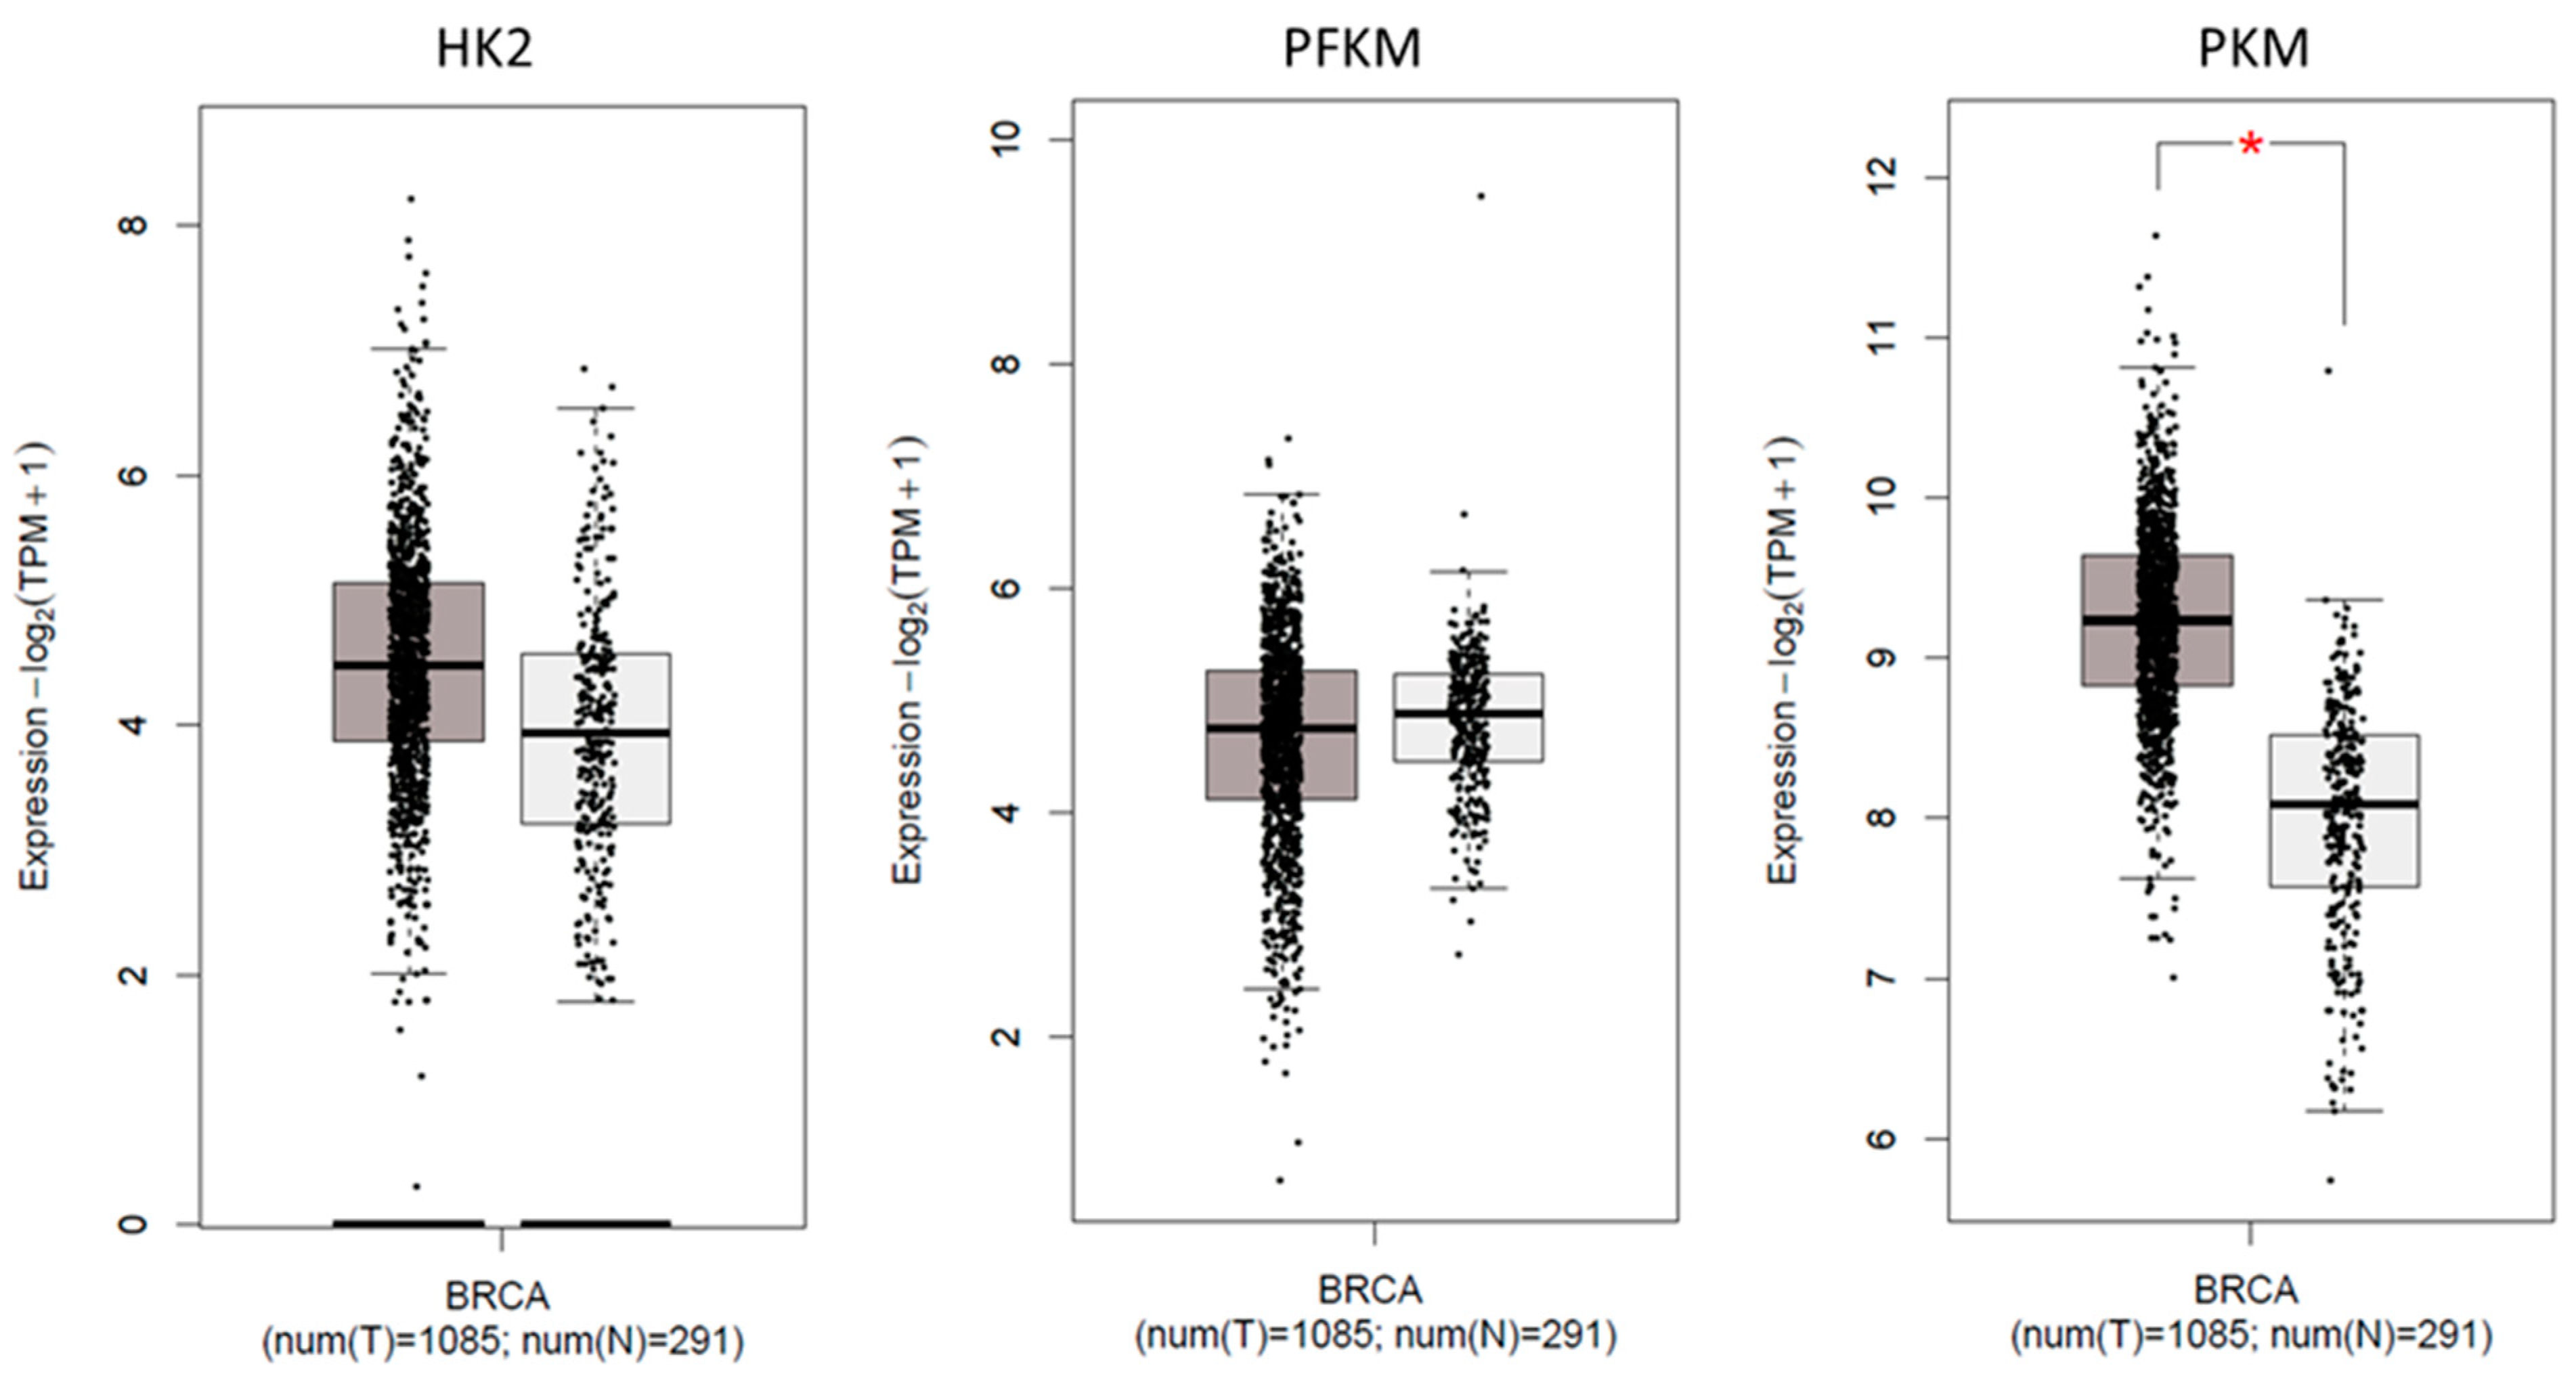
2.7. Expression of Glycolytic Genes in TCGA Cohort

The GEPIA platform was used for the TCGA dataset to perform tumor vs. normal comparisons. Expressions of HK2, PFKM, and PKM transcripts in the breast cancer cohort (BRCA) were evaluated in comparison to normal breast tissue in TCGA. Student’s t-test and cut-off (p < 0.05) were used in the GEPIA platform. BRCA was comprised of 1085 tumors and 291 normal breast tissue samples.

2.8. Statistical Evaluation of Data

Livak’s method (2−∆∆Ct) [25] was used to measure the comparative mRNA expression of target genes (HK2, PKM2, and PFKM) in tumor samples compared to their respective adjacent controls. The results are expressed as mean ± SEM. Wilcoxon signed-rank test was performed for statistical comparison between tumors and controls. Non-parametric methods of statistical testing, including Kruskal-Wallis and Mann-Whitney U tests, were used to investigate the association of clinicopathological characteristics with HK2, PKM2, and PFKM expressions. Data for molecular subtypes of breast cancer were analyzed using one-way ANOVA. Spearman rank test was used to assess the correlation between the expression of the glycolytic genes and Ki67. A Kaplan–Meier curve was generated, and overall survival was analyzed using a log-rank (Mantel–Cox) test. All statistical analyses were performed using GraphPad Prism version 10 (GraphPad, La Jolla, CA, USA). The results were considered as significant at p < 0.05.

3. Results

3.1. Association of Glycolytic Gene Expression with Demographic Characteristics

The mean age of breast cancer patients included in this study was 45 years with an age range between 24 and 70 years. In the cohort, 50% of patients were younger than 45 years at the time of diagnosis. Transcript levels of HK2 (p< 0.05) and PFKM (p < 0.001) were significantly elevated in older patients (age > 45 years) compared to younger patients. Expression of the glycolytic genes with respect to age at disease diagnosis is also indicated in Table 2 and Table 3, and Figure 1B, Figure 2B, and Figure 3B. Accordingly, significant overexpression of HK2, PKM2, and PFKM genes (p < 0.05) was observed in postmenopausal women in comparison to premenopausal women (Table 3 and Figure 1C, Figure 2C, and Figure 3C).

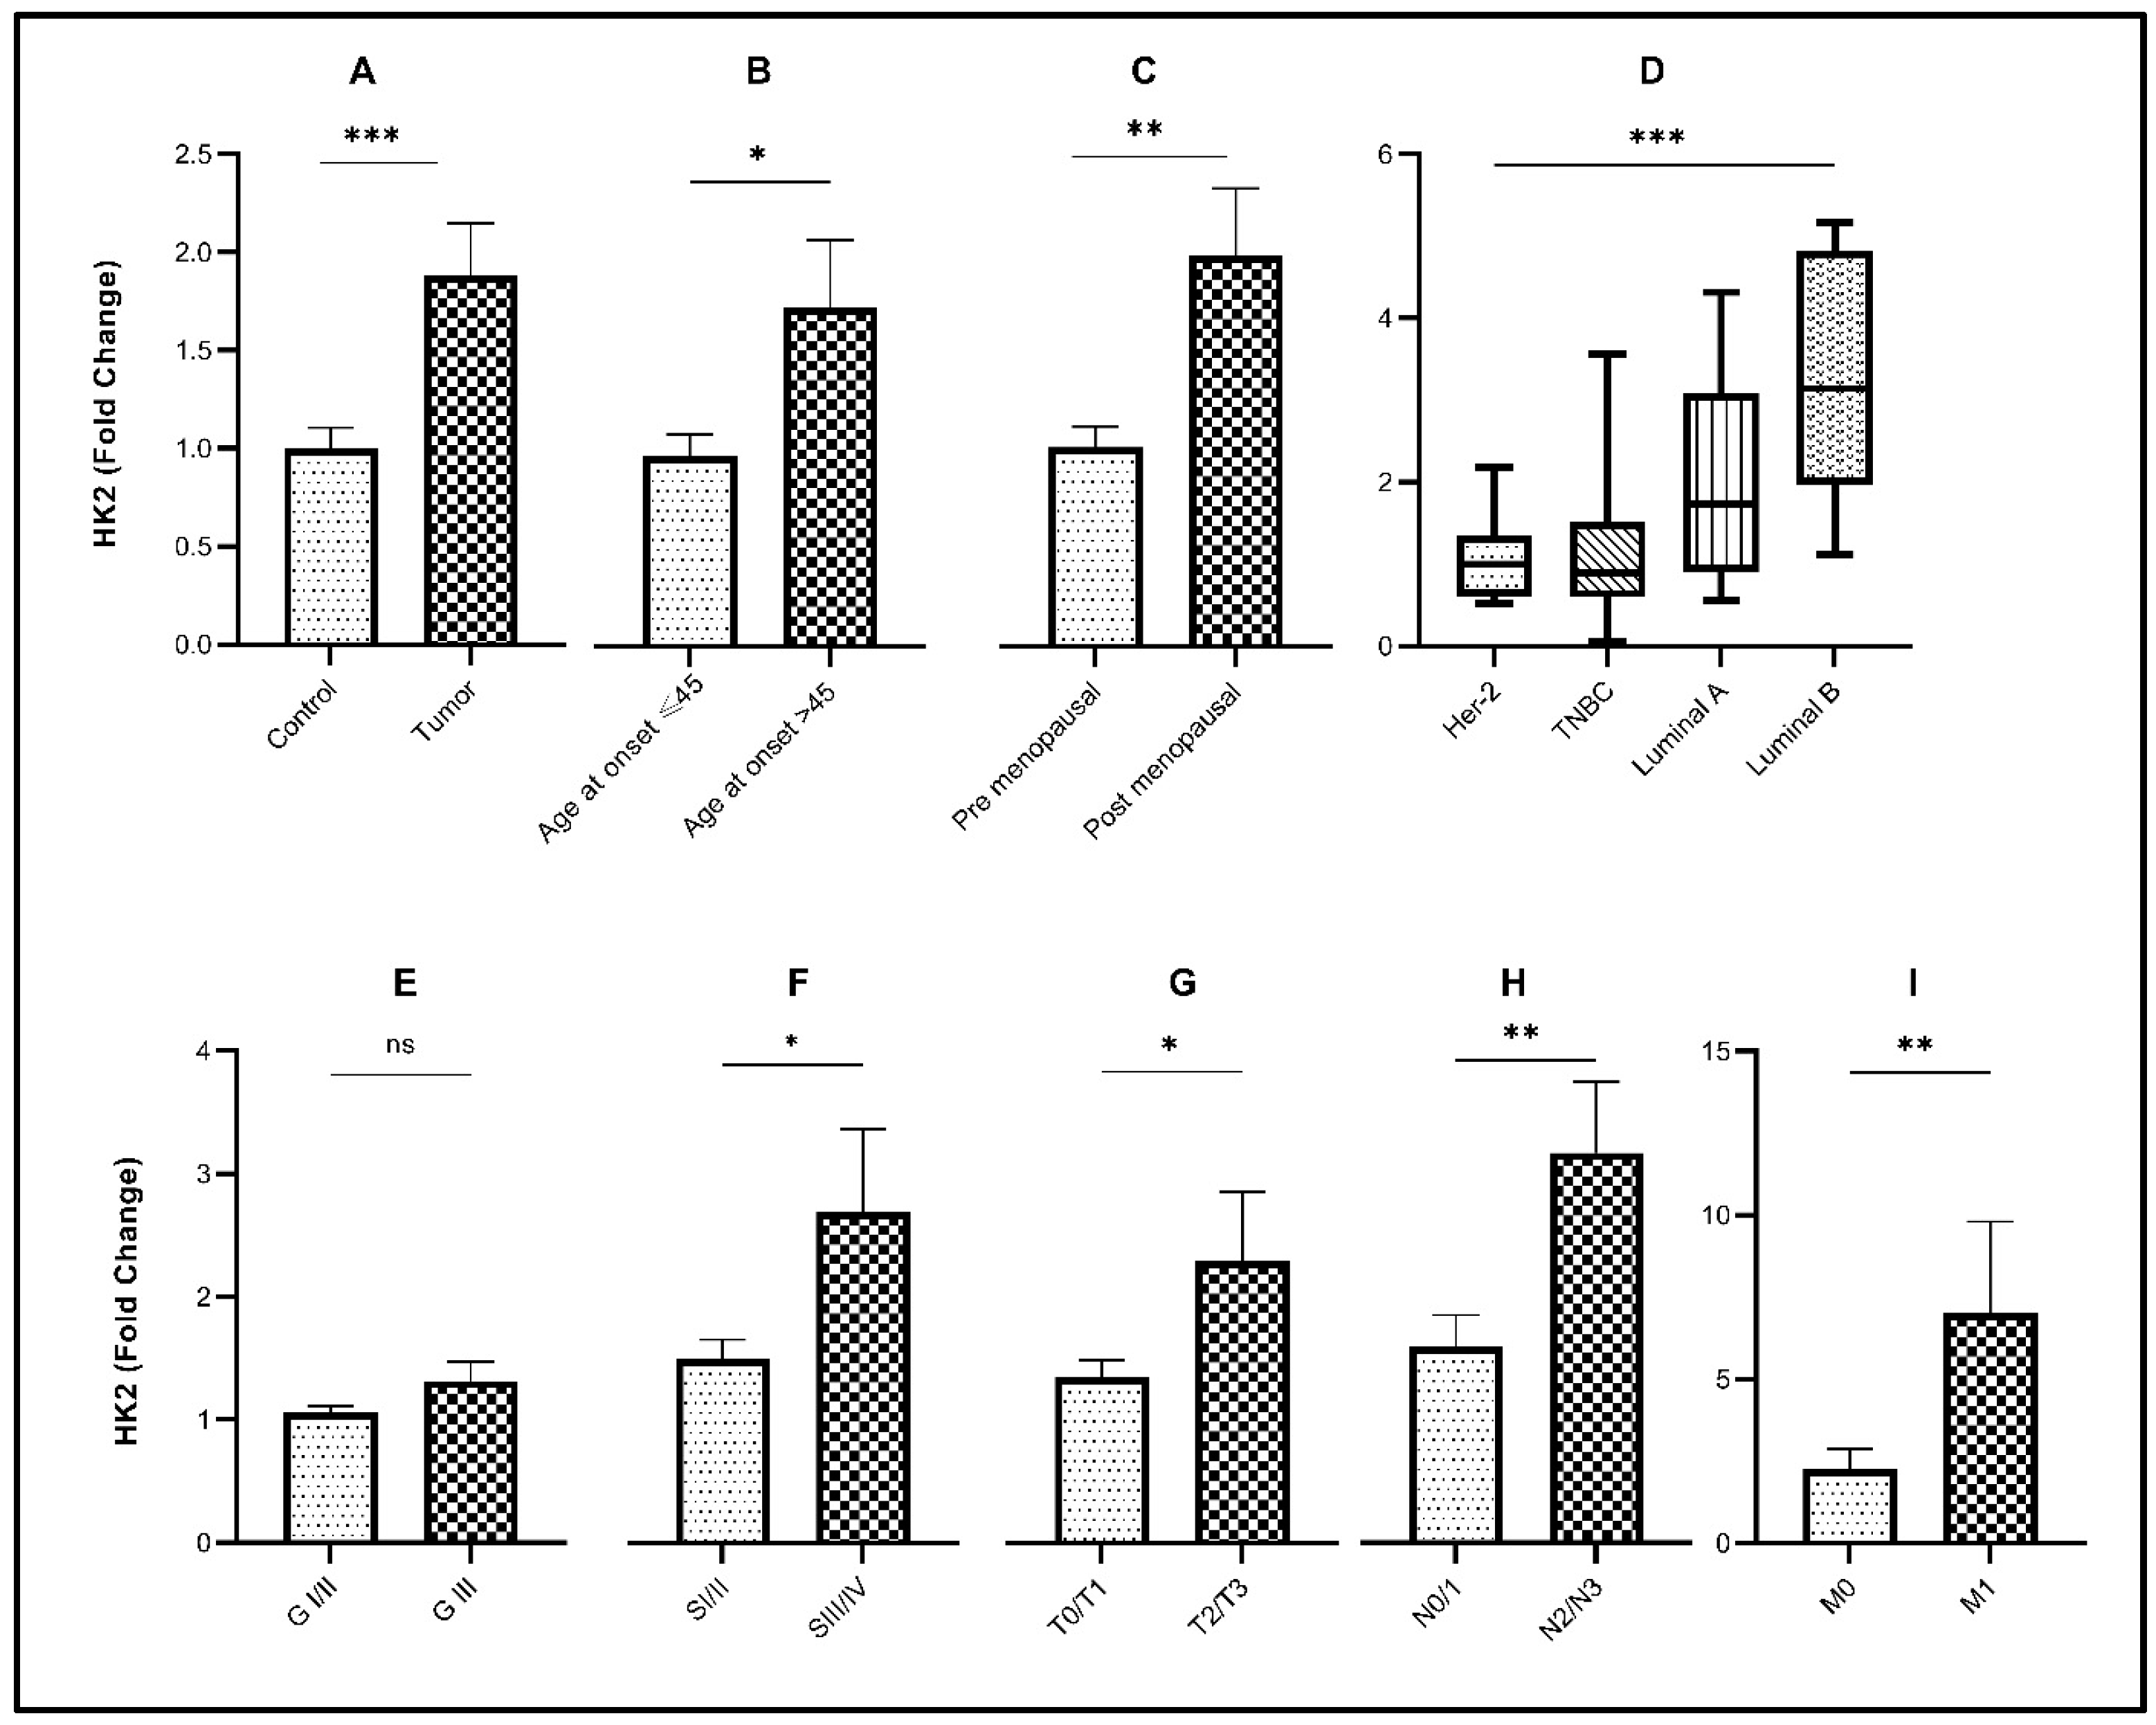
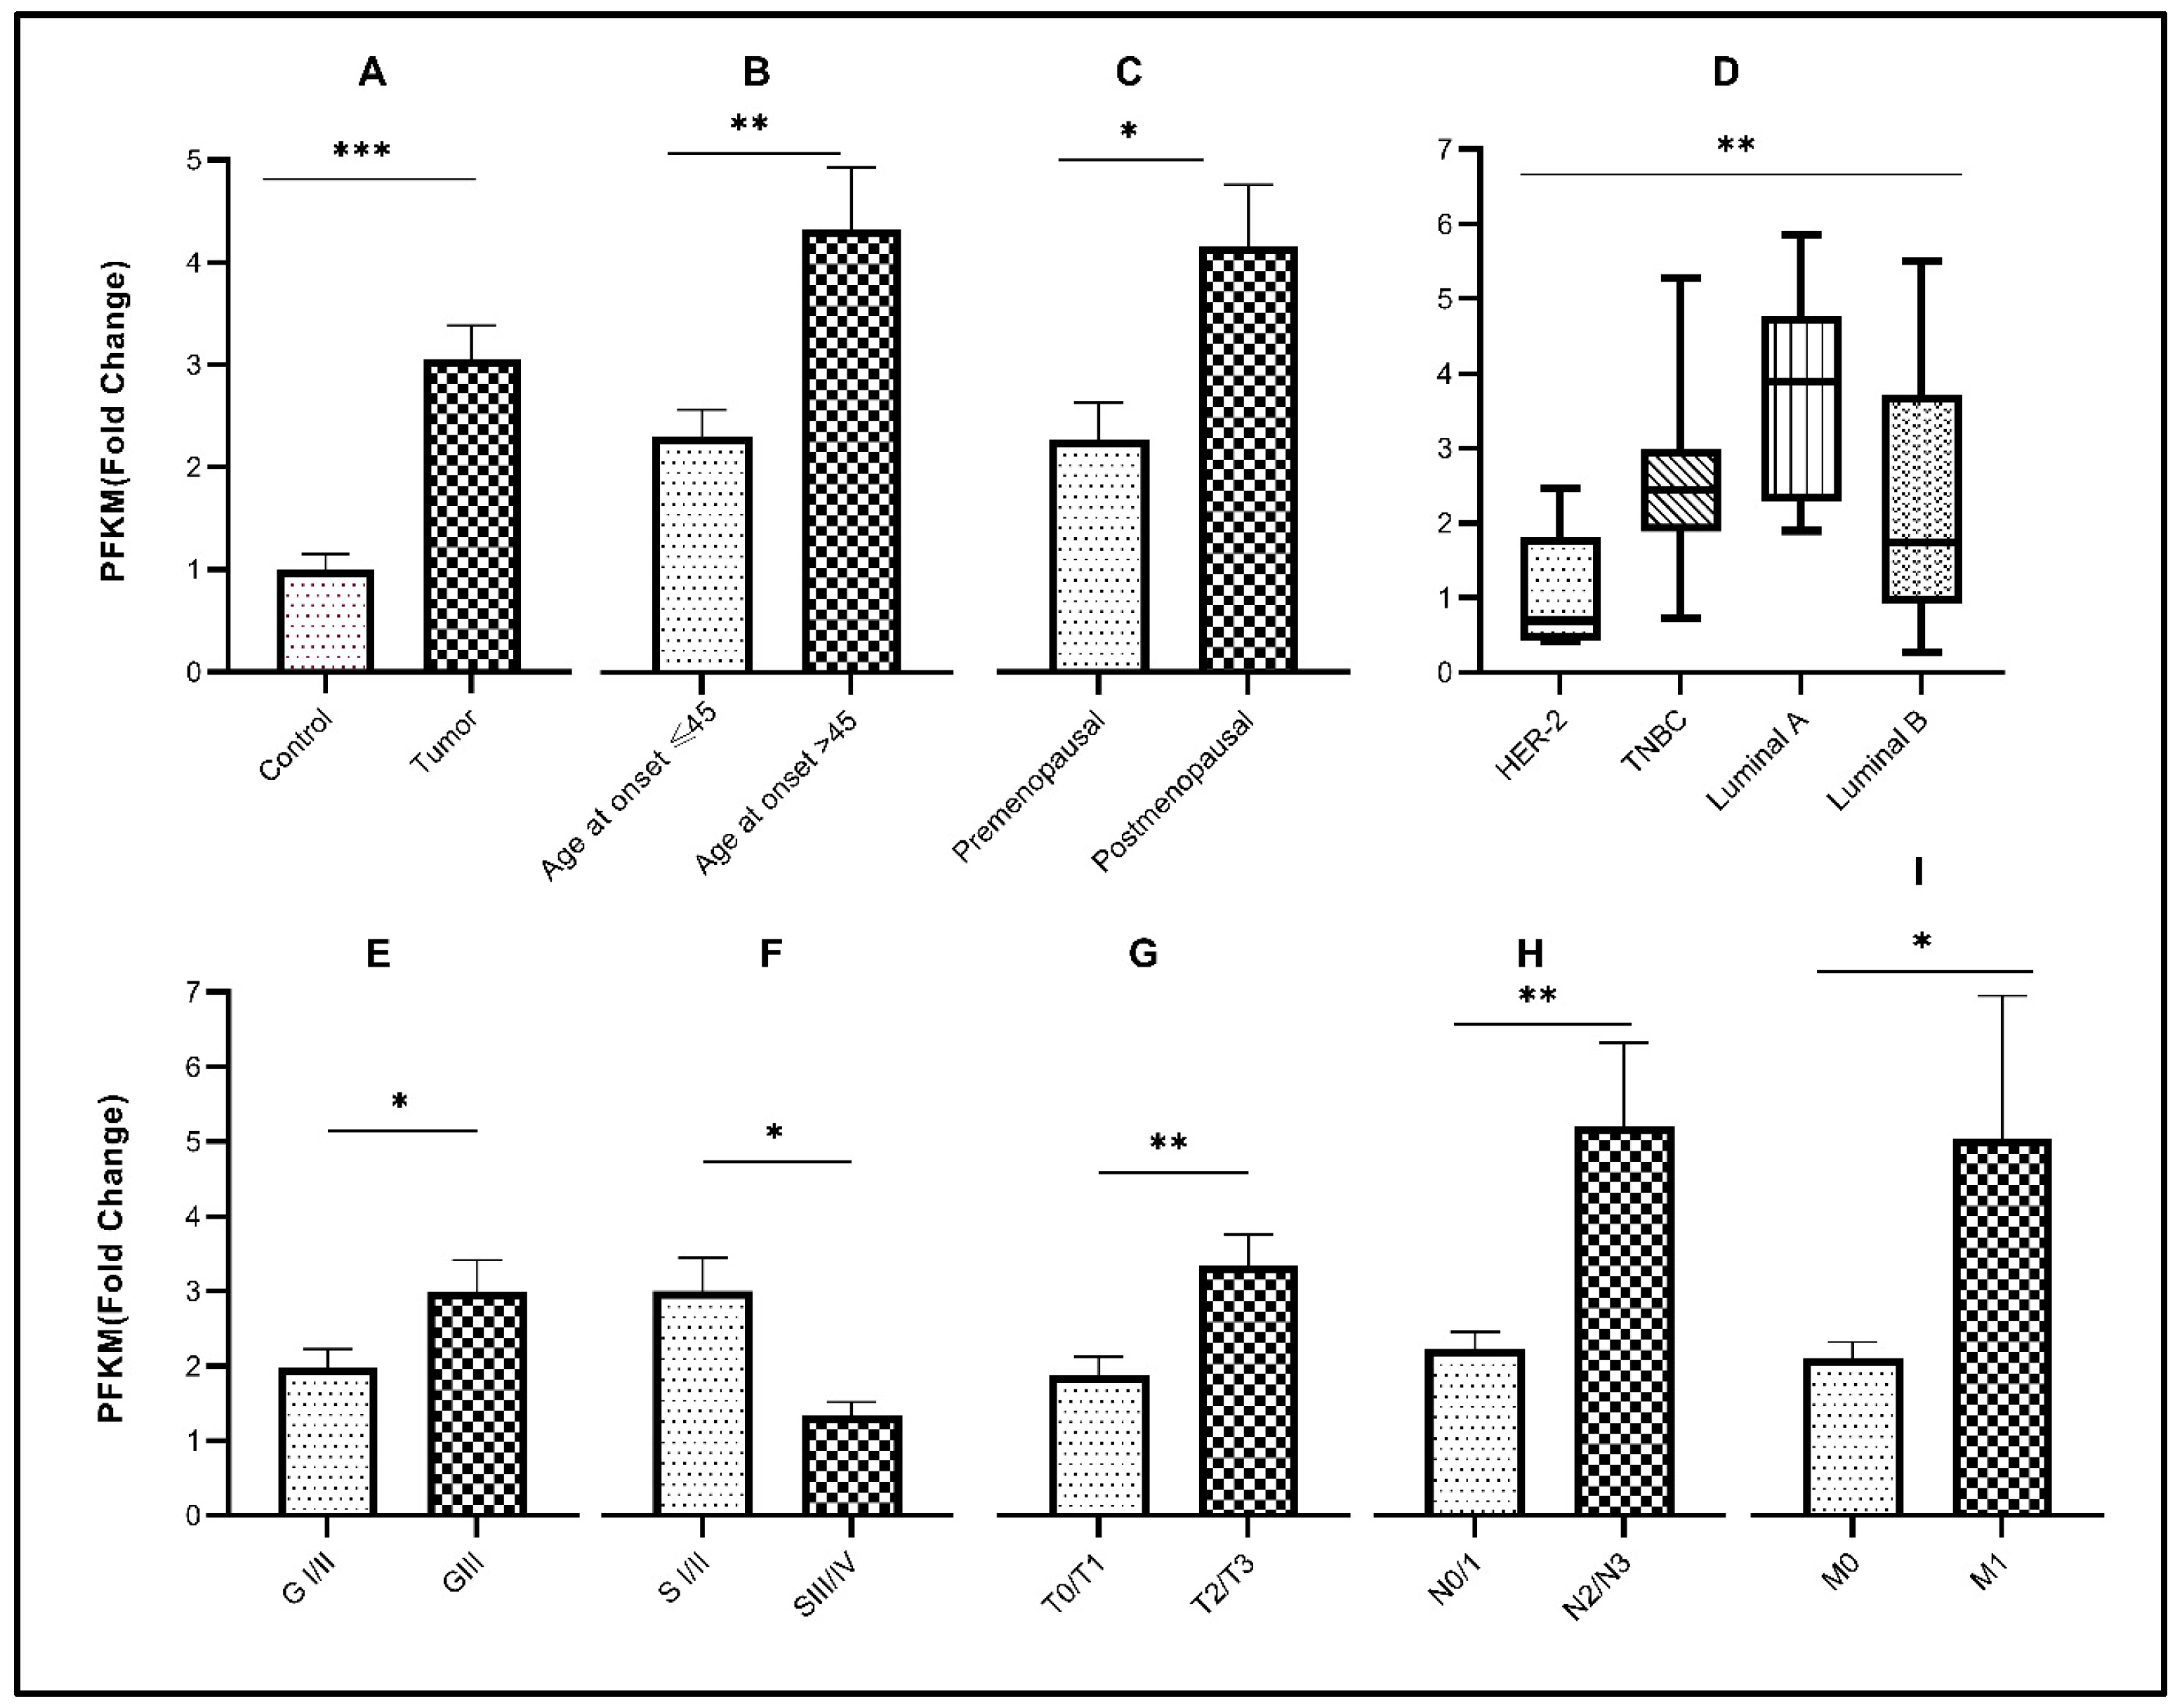
3.2. Relative Expression of Glycolytic Genes in Breast Cancer Study Cohort

Significant upregulation (p < 0.0001) of the glycolytic genes (HK2, PKM2, and PFKM) was observed in breast tumor tissues in comparison to their respective controls (Table 3 and Figure 1A, Figure 2A, and Figure 3A). About 68% of tumors showed high expression of HK2, whereas 73% were high for PKM2. Interestingly, 80% of the tumors had overexpressed the PFKM gene as indicated in Table 2. Protein expressions of HK2, PFKM and PKM were found to be high in tumor tissues with cytoplasmic localization (Figure 4). Analysis from the BRCA dataset of TCGA also validated that the PKM2 gene (p < 0.05) was significantly altered between tumors and normal breast samples. HK2 expression was elevated in TCGA breast tumors as well. However, PFKM was not altered between tumors and normal breast tissue as shown in Figure 5.

3.3. Association of Glycolytic Genes with Clinicopathological Characteristics of the Study Cohort

Out of the three glycolytic genes, PFKM (p < 0.05) showed significant upregulation in higher-grade tumors as compared to low-grade tumors as indicated in Table 3 and Figure 2E. Significant overexpression of the glycolytic genes HK2 and PKM2 (p < 0.05) was observed in advanced clinical stages (stage III/IV) of breast cancer as compared to early stages (stage I/II), as shown in Figure 1F and Figure 3F. Comparably, significant overexpression of the PFKM gene (p < 0.05) was seen in the early clinical stages (SI/II) of breast cancer. Tumor stage, nodal involvement, and metastasis data were also retrieved for the given breast cancer cohort. A significant increase in the expression of these glycolytic genes was observed in increased tumor size, nodal metastasis, and distant metastasis (p < 0.05). Glycolytic gene associations due to tumor stage, nodal involvement, and metastasis are also shown in Table 3 and Figure 1G–I, Figure 2G–I, and Figure 3G–I.
For the current study cohort, follow-up data related to the overall survival of patients were obtained for a period of 36 to 48 months post-surgery. A Kaplan–Meier plot for the three glycolytic genes was generated based on the log-rank test. Kaplan–Meier graphs showed that the elevated expressions of HK2 (HR = 1.95) and PFKM (HR = 2.03) are associated with poor prognosis in patients, as shown in Supplementary Figure S2.

3.4. Association of Glycolytic Genes with Molecular Subtypes of Breast Cancer

The present cohort consisted of 10% HER2, 21.7% TNBC, 21.7% luminal-A, and 46.6% luminal-B tumors. Among molecular subtypes, luminal-B had the highest expression of HK2 and PKM2 (p < 0.05), while PFKM showed the highest expression in the luminal A subtype (p < 0.05) as indicated in Figure 1D, Figure 2D, and Figure 3D. For each of the four subtypes, the expression of glycolytic genes HK2, PFKM, and PKM2 was upregulated in tumors as compared to their paired control tissues (Supplementary Figure S1).

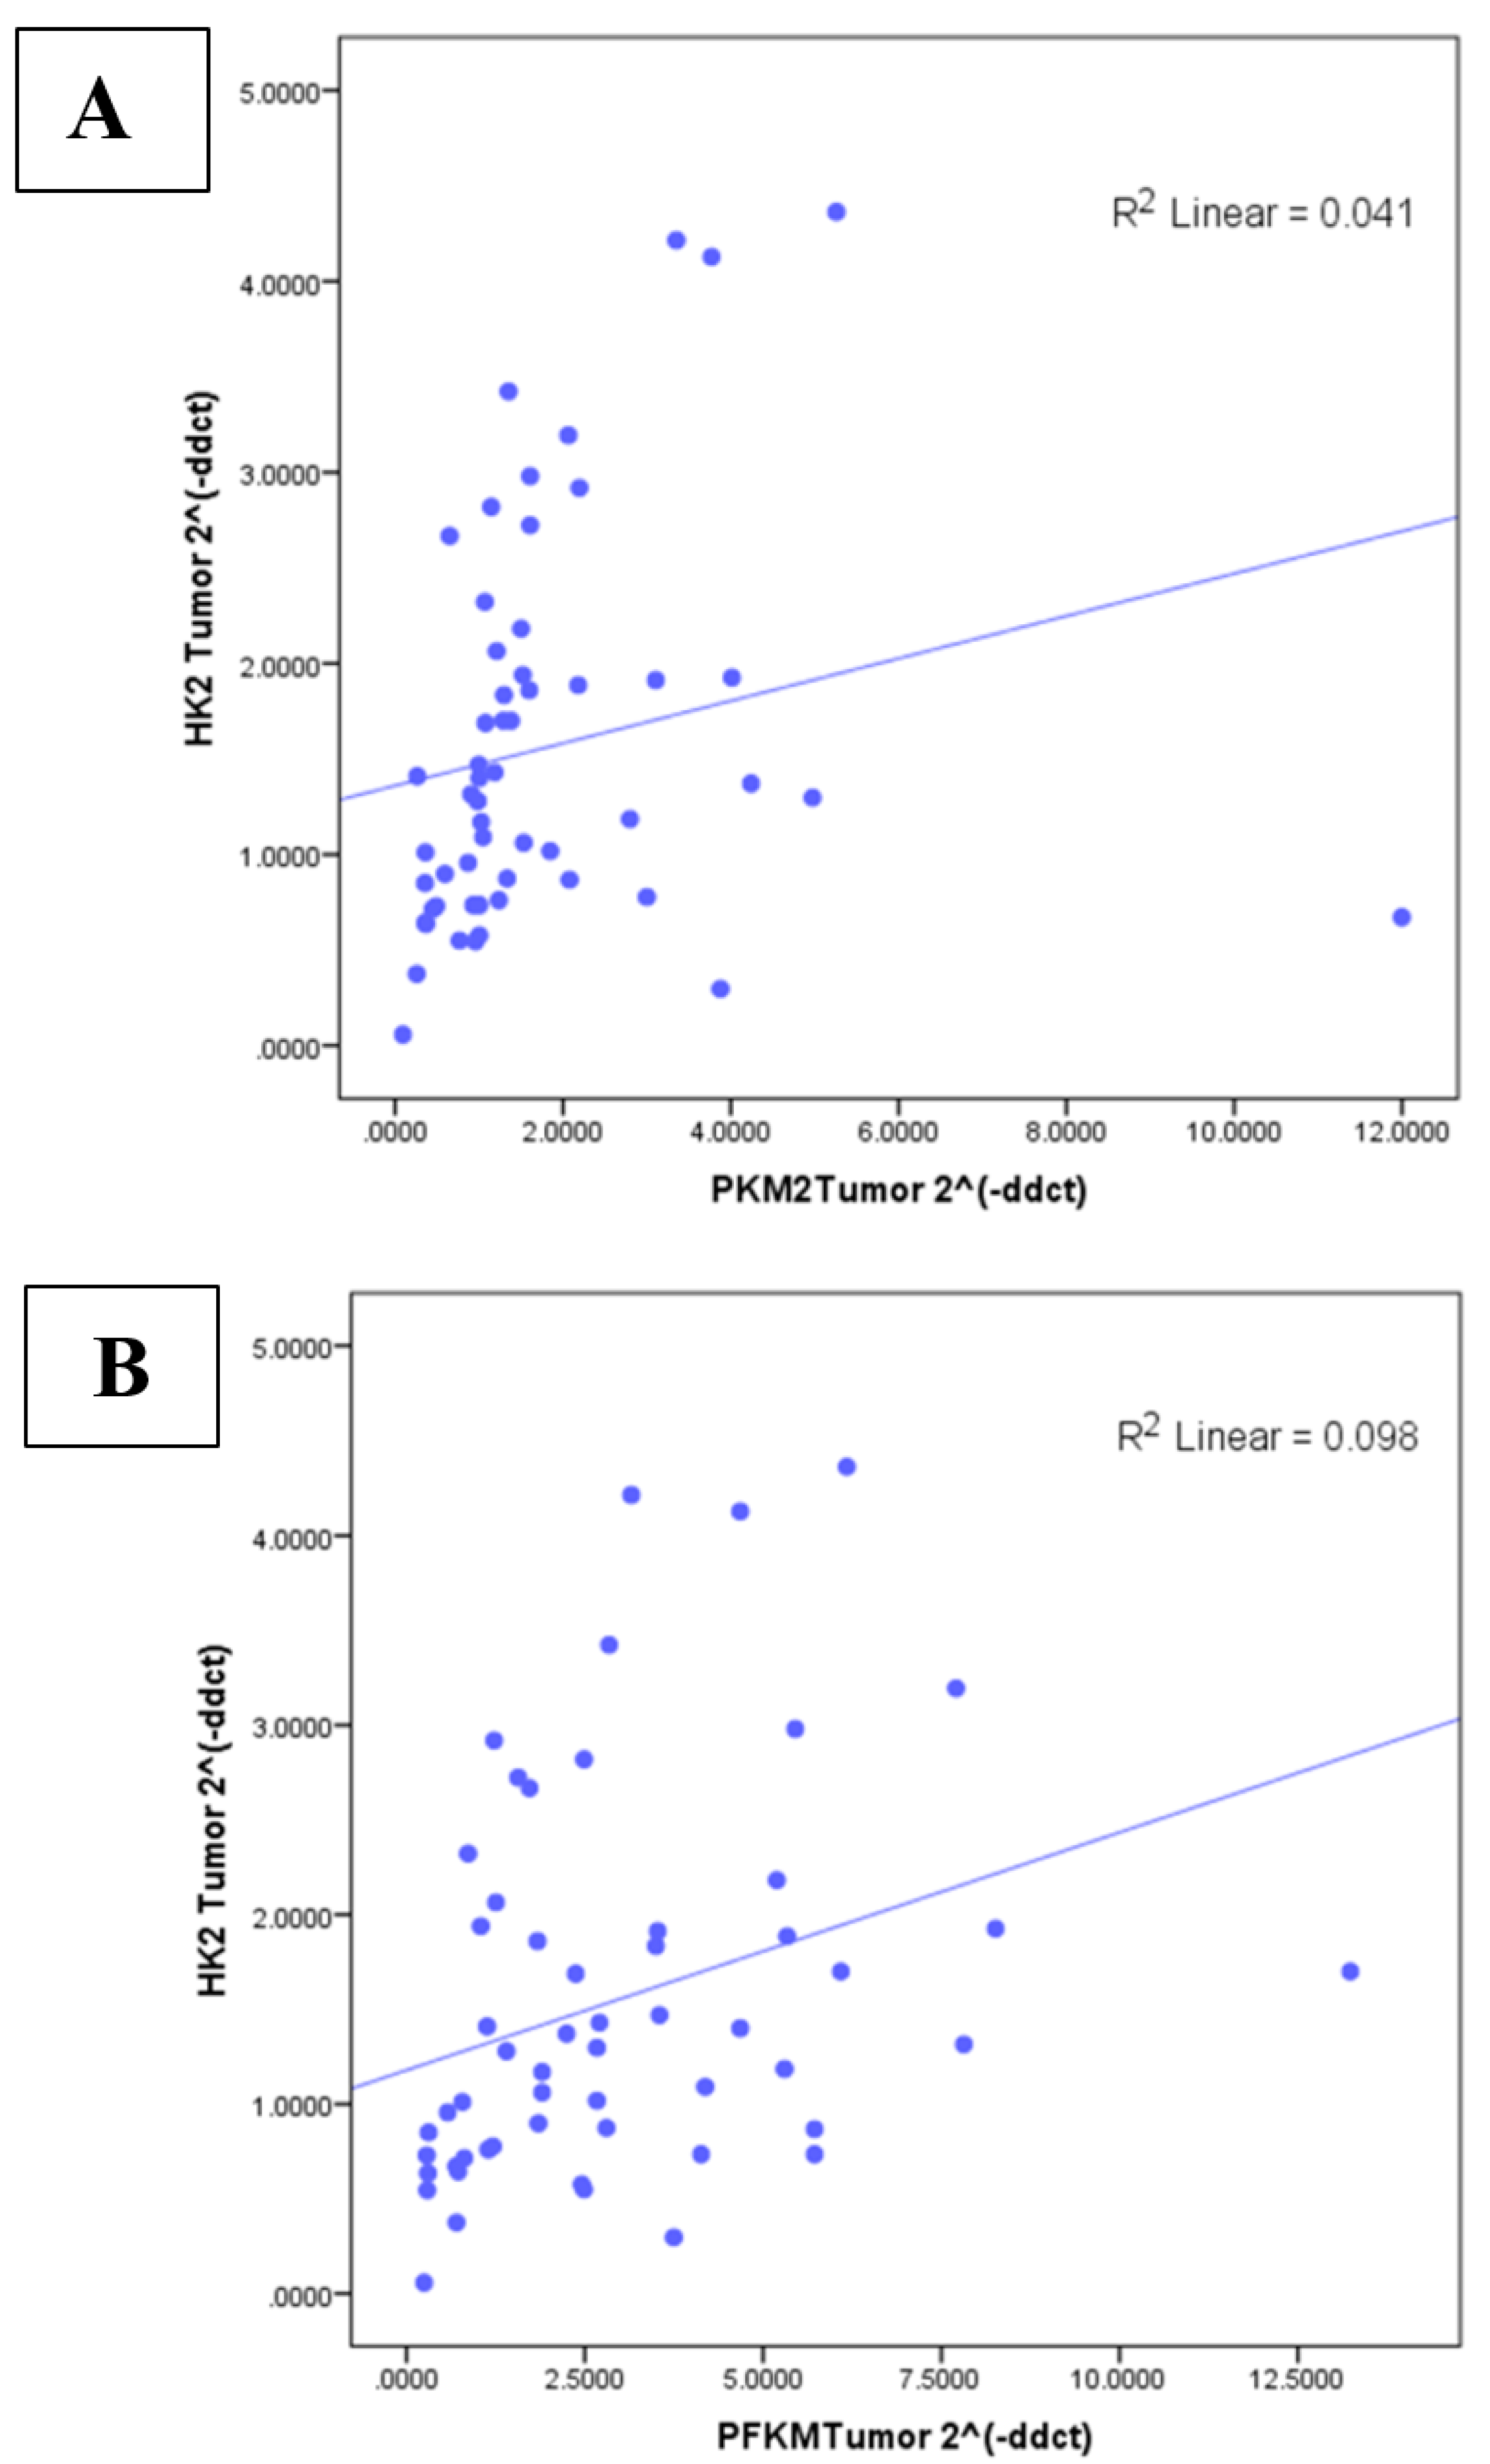
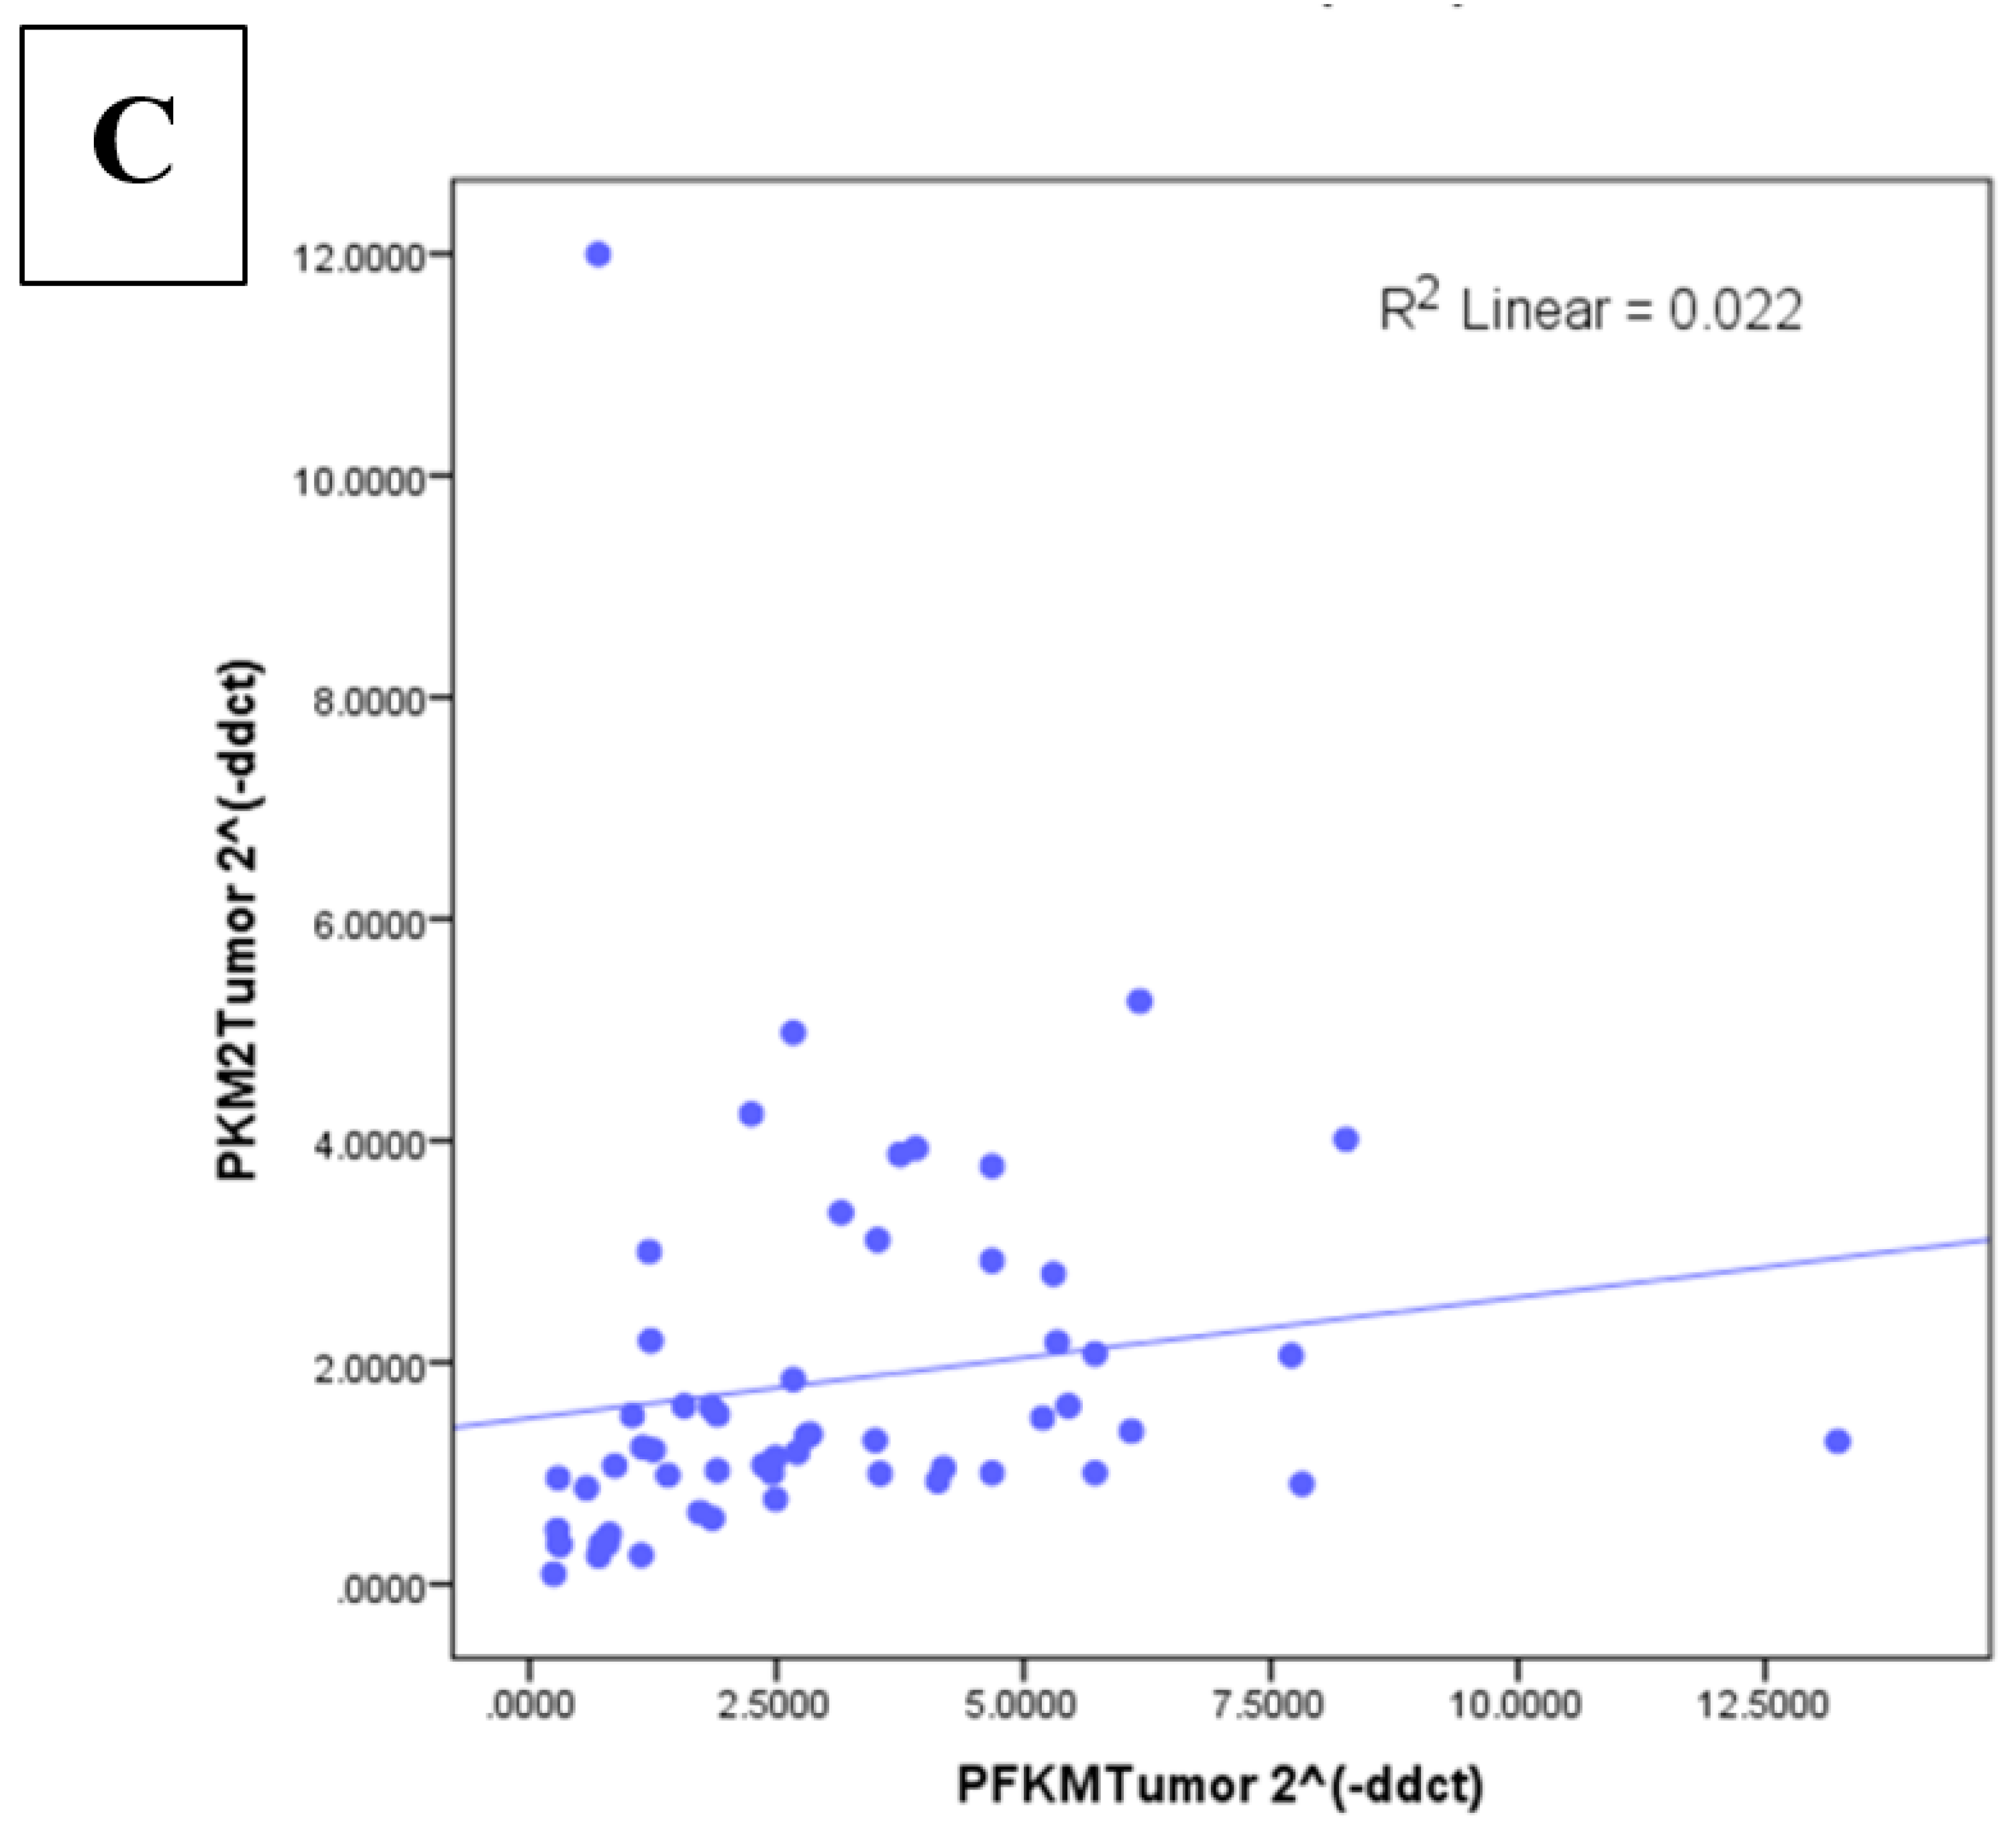
3.5. Correlation between Glycolytic Genes and Ki67 at mRNA Level

HK2 (r-value 0.529; p <  0.0001), PFKM (r = 0.509; p < 0.0001), and PKM2 (r = 0.597; p < 0.0001) expression showed significant positive correlation with the Ki67 proliferation marker as indicated in Supplementary Table S1. In addition, the correlation among the glycolytic genes was statistically significant and moderately positive, as indicated in Figure 6A–C.

4. Discussion

Cancer cells, due to their excessive proliferation rate, need considerable energy production. In contrast to non-transformed cells in normal physiological conditions, cancer cells reprogram their energy metabolism by prioritizing glycolysis over oxidative phosphorylation to fulfill their energy requirements. Additionally, it is hypothesized that the induction of aerobic glycolysis is also associated with aberrations in gene functions [26,27]. The current study was designed to assess the expression level of three key glycolytic genes, HK2, PFKM, and PKM2, along with their association with clinicopathological parameters and molecular subtypes in breast cancer cohort of Pakistan.
Our results showed highly significant overexpression of the crucial glycolytic genes (i.e., HK2, PFKM, and PKM2) in breast tumors as compared to their adjacent controls. These findings are consistent with previously reported HK2 studies on cervical cancer [11] and gastric carcinoma [28]. Similarly, the oncogenic role of HK2 has been studied in various cancer conditions, including lung [8], pancreatic [29], and colorectal [7] cancers; brain metastasis of breast cancer; and renal carcinoma [30]. HK2 overexpression was found to be highly significant in these malignant tumors. Moreover, PKM2 overexpression has been observed in a Chinese breast cancer cohort, as well as in pancreatic ductal adenocarcinoma using IHC [31,32]. However, not enough literature is available regarding PFKM gene overexpression in different solid tumors. A genome-wide association study and an in silico study analyzed the role of the PFKM as a novel breast cancer gene and as a potential therapeutic target for glycolysis, respectively [15,33]. Overexpression of HK2 and PKM2 has also been validated through IHC and TCGA data analysis. Elevated expression of all three glycolytic genes in tumor samples is suggestive of their role in breast cancer progression.
Although these metabolic genes were not correlated with age in several cancer cohorts, a statistically significant association of HK2 [28,34] and PFKM gene overexpression with age was observed in our data. Nonetheless, PKM2 transcript levels showed no significant association with age at disease onset in the Pakistani breast cancer cohort, which is in line with a previously published study [21]. Cancer patients with late disease onset showed higher expression of the glycolytic genes in comparison to patients with early disease onset in the present study cohort. This might be attributed to loss of p53 function with increasing age in elderly patients [35].
Expression of glycolytic genes was significantly higher in postmenopausal as compared to premenopausal women in the present cohort. Studies performed by Mandrup et al. suggest that there is a higher expression of hexokinase protein in abdominal adipose tissue as well as skeletal muscle tissue of postmenopausal women [36]. This may attribute to the estrogen production in adipose tissue; the key source of estrogen in post-menopausal women. Another probable reason for overexpression of the glycolytic genes might be the involvement of ER receptors, although estrogen and progesterone levels decrease with age and in postmenopausal women. Conversely, a study involving systematic analyses of clinical studies observed a two-fold increase in the expression of ER receptors in obese postmenopausal women [37]. Numerous studies have reported the role of estrogen and estrogen receptors in the regulation of glycolysis, whereby, increased expression of HK, PFK, and PK was also observed in female rat brains after estrogen treatment [38].
Among molecular subtypes of breast cancer, luminal B subtype patients showed a significant increase in HK2 and PKM2 expression, whereas most samples with upregulated PFKM fell into the luminal A subtype. This might be indicative of a potential interplay of these molecules with estrogen and/or progesterone in women with breast cancer. Usually, luminal B subtype tumors have a high recurrence rate, the worst prognosis, and long-term low treatment response [39]. The results are in line with previous findings [40]. Interestingly, PFKM was significantly associated with tumor differentiation. Expression of the glycolytic genes was higher in patients with poorly differentiated tumors in comparison to moderately differentiated and well-differentiated tumors in this study. Similarly, previous studies have also shown an association of the HK2 gene with advanced tumor grades in cervical [11] and head and neck cancers [41].
In this study, statistically significant overexpression of glycolytic genes HK2, PFKM, and PKM2 was observed in advanced cancer stages. Furthermore, transcript levels of these three glycolytic genes were observed to be higher in breast cancer patients with a greater number of lymph nodes involved, distant metastasis, and increased tumor size. Hence, breast tumors with overexpression of HK2, PFKM, and PKM2 may potentially be more malignant due to enhanced aerobic glycolysis. The current findings involving HK2 and PKM2 are consistent with those of previous reports [9,34,42]. However, no significant association of PFKM with tumor size, TNM stage, or nodal metastasis has been previously reported. To the best of our knowledge, this study is the first one of its kind to report the expressional significance of PFKM in breast cancer development and progression. Moreover, a positive correlation between glycolytic genes (HK2, PFKM, and PKM2) and a high Ki67 index was also observed, which is indicative of their association with cell proliferation and tumor aggressiveness. These findings emphasize the role of targeting glucose metabolism in tumorigenesis. Moderate positive correlation among the studied genes communicates the cross-talk between the glycolytic pathway genes during breast tumorigenesis in these patients.
Comprehensively, majority of the malignant tumors prioritize undergoing glycolysis to metabolize glucose. HK2, PFKM, and PKM2 are the rate-limiting genes in the glycolytic pathway. Taken together, all these findings are indicative of the role of HK2, PKM2, and PFKM genes in tumor growth, proliferation, lympho-vascular invasion, and metastasis in breast cancer. Consistent with previous findings, these results also highlight the use of these genes as potential therapeutic targets for breast cancer.

5. Conclusions

Conclusively, collective expression of all three rate limiting glycolytic genes (HK2, PFKM, and PKM2) as novel cancer metabolic biomarkers can be beneficial for predicting disease aggressiveness and diagnosis. Moreover, targeting key glycolytic regulatory genes may serve as an attractive strategy in breast cancer diagnosis and treatment.

Supplementary Materials

The following supporting information can be downloaded at: https://www.mdpi.com/article/10.3390/genes13030549/s1, Figure S1: Expression of glycolytic markers in molecular subtypes of breast cancer (tumor vs. paired control). Fold change of glycolytic gene in (A) HK2; (B) PFKM; (C) PKM2. Significance level * p < 0.05, ** p < 0.001 *** p < 0.0001.; Figure S2: Overall survival analysis using Log rank (Mantel-Cox) test of HK2 (HR = 1.951; p = 0.1), PFKM (HR = 2.03; p = 0.1) and PKM2 (HR = 0.6; p = 0.4) genes in breast cancer cohort. Table S1: Correlation of HK2, PFKM and PKM2 gene with Ki-67 (proliferation marker). * Spearmen correlation, all bold values are significant having p < 0.05.

Author Contributions

R.S. (Ramla Shahid) conceived the idea. M.I., N.B., S.K.R. and S.M. conducted the experiment and conducted the literature review. J.S.K. provided technical expertise. M.I. and Y.B. helped in statistical analysis. M.I. proofread and provided intellectual guidance. R.S. (Rokayya Sami), A.H.A. and S.A.A. contributed to funding. All authors read the first draft, helped in revision, and approved the article. All authors have read and agreed to the published version of the manuscript.

Funding

This study was funded under COMSATS Research Grant Program (CRGP), (Project No: 6-43 /CPRG/CIIT/ISL/17/1052) provided by COMSATS University, Islamabad.

Institutional Review Board Statement

The ethic committee of COMSATS University, Islamabad approved the protocol of present study (CIIT/Bio/ERB/17/63). In addition, subjects gave their approval in the form of informed consent for tissue and data collection.

Informed Consent Statement

Not applicable.

Data Availability Statement

Available upon request from the corresponding author.

Acknowledgments

Taif University Researchers Supporting Project Number (TURSP-2020/140), Taif University, Taif, Saudi Arabia. Princess Nourah bint Abdulrahman University Researchers Supporting Project Number (PNURSP2022R249), Princess Nourah bint Abdulrahman University, Riyadh, Saudi Arabia.

Conflicts of Interest

The authors declare no conflict of interest.

Abbreviations

OXPHOSOxidative phosphorylation
HKHexokinase
PFKPhosphofructokinase
PKPyruvate kinase
G-6PGlucose-6-phosphate
PFKMPhosphofructokinase muscle
PKM2Pyruvate kinase isozyme M2
HK2Hexokinase2
IHCImmunohistochemistry
qPCRQuantitative polymerase chain reaction
Ki67Marker of proliferation
HIF1Hypoxia inducible factor
cDNAComplimentary DNA
mRNAMessenger RNA
bpsBase pairs
TCGAThe Cancer Genome Atlas
TNBCTriple-negative breast cancer

References

  1. Tseng, P.L.; Chen, C.W.; Hu, K.H.; Cheng, H.C.; Lin, Y.H.; Tsai, W.H.; Cheng, T.J.; Wu, W.H.; Yeh, C.W.; Lin, C.C.; et al. The decrease of glycolytic enzyme hexokinase 1 accelerates tumor malignancy via deregulating energy metabolism but sensitizes cancer cells to 2-deoxyglucose inhibition. Oncotarget 2018, 9, 18949–18969. [Google Scholar] [CrossRef] [PubMed] [Green Version]
  2. Salvador, M.M.; de Cedrón, M.G.; Rubio, J.M.; Martínez, S.F.; Martínez, R.S.; Casado, E.; de Molina, A.R.; Sereno, M. Lipid metabolism and lung cancer. Crit. Rev. Oncol./Hematol. 2017, 112, 31–40. [Google Scholar] [CrossRef]
  3. Kalyanaraman, B. Teaching the basics of cancer metabolism: Developing antitumor strategies by exploiting the differences between normal and cancer cell metabolism. Redox Biol. 2017, 12, 833–842. [Google Scholar] [CrossRef] [PubMed]
  4. Fadaka, A.; Ajiboye, B.; Ojo, O.; Adewale, O.; Olayide, I.; Emuowhochere, R. Biology of glucose metabolization in cancer cells. J. Oncol. Sci. 2017, 3, 45–51. [Google Scholar] [CrossRef]
  5. Wu, Z.; Wu, J.; Zhao, Q.; Fu, S.; Jin, J. Emerging roles of aerobic glycolysis in breast cancer. Clin. Transl. Oncol. 2020, 22, 631–646. [Google Scholar] [CrossRef] [PubMed]
  6. Perrin-Cocon, L.; Vidalain, P.-O.; Jacquemin, C.; Aublin-Gex, A.; Olmstead, K.; Panthu, B.; Rautureau, G.J.P.; André, P.; Nyczka, P.; Hütt, M.-T.; et al. A hexokinase isoenzyme switch in human liver cancer cells promotes lipogenesis and enhances innate immunity. Commun. Biol. 2021, 4, 217. [Google Scholar] [CrossRef] [PubMed]
  7. Hamabe, A.; Yamamoto, H.; Konno, M.; Uemura, M.; Nishimura, J.; Hata, T.; Takemasa, I.; Mizushima, T.; Nishida, N.; Kawamoto, K.; et al. Combined evaluation of hexokinase 2 and phosphorylated pyruvate dehydrogenase-E1α in invasive front lesions of colorectal tumors predicts cancer metabolism and patient prognosis. Cancer Sci. 2014, 105, 1100–1108. [Google Scholar] [CrossRef] [PubMed]
  8. Zhao, Y.; Li, N.; Zhao, J.; Shi, S. High expression of hexokinase 2 promotes lung cancer proliferation and metastasis. Arch. Med. Sci. 2020, 16, 1–13. [Google Scholar] [CrossRef]
  9. Wu, J.; Hu, L.; Hu, F.; Zou, L.; He, T. Poor prognosis of hexokinase 2 overexpression in solid tumors of digestive system: A meta-analysis. Oncotarget 2017, 8, 32332. [Google Scholar] [CrossRef] [PubMed] [Green Version]
  10. Sun, Z.; Tan, Z.; Peng, C.; Yi, W. HK2 is associated with the Warburg effect and proliferation in liver cancer: Targets for effective therapy with glycyrrhizin Corrigendum in/10.3892/mmr. 2021.12143. Mol. Med. Rep. 2021, 23, 343. [Google Scholar] [CrossRef]
  11. Liu, C.; Wang, X.; Zhang, Y. The roles of HK2 on tumorigenesis of cervical cancer. Technol. Cancer Res. Treat. 2019, 18, 1533033819871306. [Google Scholar] [CrossRef]
  12. Ausina, P.; Da Silva, D.; Majerowicz, D.; Zancan, P.; Sola-Penna, M. Insulin specifically regulates expression of liver and muscle phosphofructokinase isoforms. Biomed. Pharmacother. 2018, 103, 228–233. [Google Scholar] [CrossRef]
  13. Li, X.B.; Gu, J.D.; Zhou, Q.H. Review of aerobic glycolysis and its key enzymes–new targets for lung cancer therapy. Thoracic cancer 2015, 6, 17–24. [Google Scholar] [CrossRef]
  14. Imbert-Fernandez, Y.; Clem, B.F.; O’Neal, J.; Kerr, D.A.; Spaulding, R.; Lanceta, L.; Clem, A.L.; Telang, S.; Chesney, J. Estradiol stimulates glucose metabolism via 6-phosphofructo-2-kinase (PFKFB3). J. Biol. Chem. 2014, 289, 9440–9448. [Google Scholar] [CrossRef] [Green Version]
  15. Rani, Y.; Kaur, K.; Sharma, M.; Kalia, N. In silico analysis of SNPs in human phosphofructokinase, Muscle (PFKM) gene: An apparent therapeutic target of aerobic glycolysis and cancer. Gene Rep. 2020, 21, 100920. [Google Scholar] [CrossRef]
  16. Li, X.; Kim, W.; Arif, M.; Gao, C.; Hober, A.; Kotol, D.; Strandberg, L.; Forsström, B.; Åsa, S.; Oksvold, P.; et al. Discovery of functional alternatively spliced PKM transcripts in human cancers. Cancers 2021, 13, 348. [Google Scholar] [CrossRef]
  17. Walls, J.F.; Subleski, J.J.; Palmieri, E.M.; Gonzalez-Cotto, M.; Gardiner, C.M.; McVicar, D.W.; Finlay, D.K. Metabolic but not transcriptional regulation by PKM2 is important for natural killer cell responses. Elife 2020, 9, e59166. [Google Scholar] [CrossRef]
  18. Hitosugi, T.; Kang, S.; Heiden, M.G.V.; Chung, T.-W.; Elf, S.; Lythgoe, K.; Dong, S.; Lonial, S.; Wang, X.; Chen, G.Z.; et al. Tyrosine phosphorylation inhibits PKM2 to promote the Warburg effect and tumor growth. Sci. Signal. 2009, 2, ra73. [Google Scholar] [CrossRef] [Green Version]
  19. Desai, S.; Ding, M.; Wang, B.; Lu, Z.; Zhao, Q.; Shaw, K.; Yung, W.A.; Weinstein, J.N.; Tan, M.; Yao, J. Tissue-specific isoform switch and DNA hypomethylation of the pyruvate kinase PKM gene in human cancers. Oncotarget 2014, 5, 8202. [Google Scholar] [CrossRef] [Green Version]
  20. Chen, X.; Chen, S.; Yu, D. Protein kinase function of pyruvate kinase M2 and cancer. Cancer Cell Int. 2020, 20, 523. [Google Scholar] [CrossRef]
  21. Zhang, X.; He, C.; He, C.; Chen, B.; Liu, Y.; Kong, M.; Wang, C.; Lin, L.; Dong, Y.; Sheng, H. Nuclear PKM2 expression predicts poor prognosis in patients with esophageal squamous cell carcinoma. Pathol. Res. Pract. 2013, 209, 510–515. [Google Scholar] [CrossRef] [PubMed]
  22. Marbaniang, C.; Kma, L. Dysregulation of glucose metabolism by oncogenes and tumor suppressors in cancer cells. Asian Pac. J. Cancer Prev. APJCP 2018, 19, 2377. [Google Scholar] [PubMed]
  23. Yan, X.; Hu, Y.; Wang, B.; Wang, S.; Zhang, X. Metabolic dysregulation contributes to the progression of Alzheimer’s disease. Front. Neurosci. 2020, 14, 1107. [Google Scholar] [CrossRef] [PubMed]
  24. Riaz, S.K.; Khan, J.S.; Shah, S.T.A.; Wang, F.; Ye, L.; Jiang, W.G.; Malik, M.F.A. Involvement of hedgehog pathway in early onset, aggressive molecular subtypes and metastatic potential of breast cancer. Cell Commun. Signal. 2018, 16, 3. [Google Scholar] [CrossRef] [Green Version]
  25. Livak, K.J.; Schmittgen, T.D. Analysis of relative gene expression data using real-time quantitative PCR and the 2−ΔΔCT method. Methods 2001, 25, 402–408. [Google Scholar] [CrossRef]
  26. Yu, L.; Chen, X.; Sun, X.; Wang, L.; Chen, S. The glycolytic switch in tumors: How many players are involved? J. Cancer 2017, 8, 3430. [Google Scholar] [CrossRef]
  27. Epstein, T.; Gatenby, R.A.; Brown, J.S. The Warburg effect as an adaptation of cancer cells to rapid fluctuations in energy demand. PLoS ONE 2017, 12, e0185085. [Google Scholar] [CrossRef] [Green Version]
  28. Rho, M.; Kim, J.; Jee, C.D.; Lee, Y.M.; Lee, H.E.; Kim, M.A.; Lee, H.S.; Kim, W.H. Expression of type 2 hexokinase and mito chondria-related genes in gastric carcinoma tissues and cell lines. Anticancer Res. 2007, 27, 251–258. [Google Scholar]
  29. Anderson, M.; Marayati, R.; Moffitt, R.; Yeh, J.J. Hexokinase 2 promotes tumor growth and metastasis by regulating lactate production in pancreatic cancer. Oncotarget 2017, 8, 56081–56094. [Google Scholar] [CrossRef] [Green Version]
  30. Liu, H.; Liu, N.; Cheng, Y.; Jin, W.; Zhang, P.; Wang, X.; Yang, H.; Xu, X.; Wang, Z.; Tu, Y. Hexokinase 2 (HK2), the tumor promoter in glioma, is downregulated by miR-218/Bmi1 pathway. PLoS ONE 2017, 12, e0189353. [Google Scholar]
  31. Lockney, N.; Zhang, M.; Lu, Y.; Sopha, S.C.; Washington, M.K.; Merchant, N.B.; Zhao, Z.; Shyr, Y.; Chakravarthy, A.B.; Xia, F. Pyruvate kinase muscle isoenzyme 2 (PKM2) expression is associated with overall survival in pancreatic ductal adenocarcinoma. J. Gastrointest. Cancer 2015, 46, 390–398. [Google Scholar] [CrossRef] [PubMed]
  32. Xiao, H.; Zhang, L.; Chen, Y.; Zhou, C.; Wang, X.; Wang, D.; Liu, Z. PKM2 Promotes Breast Cancer Progression by Regulating Epithelial Mesenchymal Transition. Anal. Cell. Pathol. 2020, 2020, 8396023. [Google Scholar] [CrossRef] [PubMed]
  33. Ahsan, H.; Halpern, J.; Kibriya, M.G.; Pierce, B.; Tong, L.; Gamazon, E.; McGuire, V.; Felberg, A.; Shi, J.; Jasmine, F.; et al. A genome-wide association study of early-onset breast cancer identifies PFKM as a novel breast cancer gene and supports a common genetic spectrum for breast cancer at any age. Cancer Epidemiol. Prev. Biomark. 2014, 23, 658–669. [Google Scholar] [CrossRef] [PubMed] [Green Version]
  34. Ogawa, H.; Nagano, H.; Konno, M.; Eguchi, H.; Koseki, J.; Kawamoto, K.; Nishida, N.; Colvin, H.; Tomokuni, A.; Tomimaru, Y.; et al. The combination of the expression of hexokinase 2 and pyruvate kinase M2 is a prognostic marker in patients with pancreatic cancer. Mol. Clin. Oncol. 2015, 3, 563–571. [Google Scholar] [CrossRef] [PubMed] [Green Version]
  35. Salminen, A.; Kaarniranta, K. Glycolysis links p53 function with NF-κB signaling: Impact on cancer and aging process. J. Cell. Physiol. 2010, 224, 1–6. [Google Scholar] [CrossRef] [PubMed]
  36. Mandrup, C.M.; Roland, C.B.; Egelund, J.; Nyberg, M.; Enevoldsen, L.H.; Kjaer, A.; Clemmensen, A.; Christensen, A.N.; Suetta, C.; Frikke-Schmidt, R.; et al. Effects of High-Intensity Exercise Training on Adipose Tissue Mass, Glucose Uptake and Protein Content in Pre-and Post-menopausal Women. Front. Sports Act. Living 2020, 2, 60. [Google Scholar] [CrossRef] [PubMed]
  37. Boonyaratanakornkit, V.; Pateetin, P. The role of ovarian sex steroids in metabolic homeostasis, obesity, and postmenopausal breast cancer: Molecular mechanisms and therapeutic implications. BioMed Res. Int. 2015, 2015, 140196. [Google Scholar] [CrossRef] [Green Version]
  38. Chen, J.-Q.; Brown, T.R.; Russo, J. Regulation of energy metabolism pathways by estrogens and estrogenic chemicals and potential implications in obesity associated with increased exposure to endocrine disruptors. Biochim. Biophys. Acta (BBA)-Mol. Cell Res. 2009, 1793, 1128–1143. [Google Scholar] [CrossRef] [Green Version]
  39. Serrano-Carbajal, E.A.; Espinal-Enriquez, J.; Hernández-Lemus, E. Targeting metabolic deregulation landscapes in breast cancer subtypes. Front. Oncol. 2020, 10, 97. [Google Scholar] [CrossRef] [Green Version]
  40. Martínez-Ordoñez, A.; Seoane, S.; Avila, L.; Eiro, N.; Macía, M.; Arias, E.; Pereira, F.; García-Caballero, T.; Gómez-Lado, N.; Aguiar, P.; et al. POU1F1 transcription factor induces metabolic reprogramming and breast cancer progression via LDHA regulation. Oncogene 2021, 40, 2725–2740. [Google Scholar] [CrossRef]
  41. Li, W.C.; Huang, C.H.; Hsieh, Y.T.; Chen, T.Y.; Cheng, L.H.; Chen, C.Y.; Liu, C.J.; Chen, H.M.; Huang, C.L.; Lo, J.F.; et al. Regulatory Role of Hexokinase 2 in Modulating Head and Neck Tumorigenesis. Front. Oncol. 2020, 10, 176. [Google Scholar] [CrossRef] [PubMed] [Green Version]
  42. Li, H.; Yan, M.; Wu, X.; Wang, Y.; Huang, L. Expression and clinical significance of pyruvate kinase M2 in breast cancer: A protocol for meta-analysis and bioinformatics validation analysis. Medicine 2021, 100, e25545. [Google Scholar] [CrossRef] [PubMed]
Figure 1. Association of HK2 gene expression with various clinicopathological parameters and molecular subtypes. Fold change of HK2 gene in (A) control vs. tumor tissues; (B) different age groups of disease onset; (C) menopausal status; (D) molecular subtypes of breast cancer; (E) tumor grade; (F) tumor stage; (G) tumor size; (H) nodal involvement; (I) metastasis. Significance level * p < 0.05, ** p < 0.001, *** p < 0.0001.
Genes 13 00549 g001
Figure 2. Association of PFKM gene expression with various clinicopathological parameters and molecular subtypes. Fold change of PFKM gene in (A) control vs. tumor tissues; (B) different age groups of disease onset; (C) menopausal status; (D) molecular subtypes of breast cancer; (E) tumor grade; (F) tumor stage; (G) tumor size; (H) nodal involvement; (I) metastasis. Significance level * p < 0.05, ** p < 0.001, *** p < 0.0001.
Genes 13 00549 g002
Figure 3. Association of PKM2 gene expression with various clinicopathological parameters and molecular subtypes. Fold change of PKM2 gene in (A) control vs. tumor tissues; (B) different age groups of disease onset; (C) menopausal status; (D) molecular subtypes of breast cancer; (E) tumor grade; (F) tumor stage; (G) tumor size; (H) nodal involvement; (I) metastasis. Significance level * p < 0.05, ** p < 0.001, *** p < 0.0001.
Genes 13 00549 g003
Figure 4. Immunostaining of representative breast tumor specimen compared with normal breast tissue. Protein expressions of HK2 (A,B), PFKM (C,D), and PKM (E,F) were found to be higher in the tumor tissues (B,D,F) in comparison to adjacent normal tissues (A,C,E) (scale: 600 µm).
Genes 13 00549 g004
Figure 5. Expression of glycolytic markers in BRCA cohort from TCGA (* p < 0.05).
Genes 13 00549 g005
Figure 6. Correlation between glycolytic genes at transcript level of (A) HK2 and PKM2 (r = 0.476, p < 0.01); (B) HK2 and PFKM (r = 0.473, p < 0.01); (C) PKM2 and PFKM (r = 0.501, p < 0.01) in breast cancer cohort.
Genes 13 00549 g006aGenes 13 00549 g006b
Table 1. Primer sequences of the studied genes.
S. No.Gene NameForward/Reverse Primer SeqProduct Size
1HK2GAGTTTGACCTGGATGTGGTTGC (Forward)130 bps
CCTCCATGTAGCAGGCATTGCT (Reverse)
2PKM2AGGACCTGAGATCCGAACTG(Forward)132 bps
AGCCACAGGATGTTCTCGTC (Reverse)
3PFKMATGACCCATGAAGAGCACCA (Forward)137 bps
GCACCGGTGAAGATACCAAC (Reverse)
4β-actinCTGAACCCCAAGGCCAAC (Forward)108 bps
AGAGGCGTACAGGGATAGCA (Reverse)
5Ki-67GCCTTGGTCTCTTGGGAATAC (Forward)123 bps
GGAGATTAGGAGCCAGTTTGAG (Reverse)
Table 2. Clinicopathological and demographic characterization of breast cancer samples along with expressions of HK2, PKM2, and PFKM.
VariablesTotal (%)HK2highPKM2highPFKMhigh
Age of disease onset ≤4530(50)192121
Age of disease onset >4530(50)222327
Premenopausal status25(42)142017
Postmenopausal status35(58)272431
Laterality (left)30(50)192123
Laterality (right)30(50)222325
Grade I/II45(75)283235
Grade III15(25)131213
Stage I/II41(68)263032
Stage III/IV19(22)151416
N0/N149(82)323638
N2/N311(18)9810
No metastasis(M0)57(95)384145
Distant metastasis(M1)3(5)333
T1/T240(67)282930
T3/T420(33)131518
N0/N1 = nodes involved ≤ 4; N2/N3 = nodes involved ≥ 4; T1/T2 = size of tumor is ≤5 cm; T3/T4 = size of tumor is ≥5 cm; M0 = cancer not spread to other parts of the body; M1 = cancer spread to other parts; % = percentage.
Table 3. Association of demographic and clinicopathological characteristics of the breast cancer cohort.
VariablesTotalHK2PKM2PFKM
Mean ± SEMp-ValueMean ± SEMp-ValueMean ± SEMp-Value
Age of disease onset <45301.197 ± 0.11290.0423 #2.112 ± 0.45160.5593 #2.393 ± 0.26880.0038 #
Age of disease onset >45301.786 ± 0.33991.599 ± 0.22394.495 ± 0.6518
Premenopausal status251.011 ± 0.10660.0233 #0.9701 ± 0.12950.0192 #2.229 ± 0.34760.0183 #
Postmenopausal status351.912 ± 0.31291.741 ± 0.20954.073 ± 0.5835
Laterality (left)301.553 ± 0.32260.1257 #1.044 ± 0.11620.0488 #2.584 ± 0.33950.5137 #
Laterality (right)301.909 ± 0.35222.233 ± 0.49113.368 ± 0.5807
Tumor601.948 ± 0.2848<0.0001 ¥1.960 ± 0.09343<0.0001 ¥3.056 ± 0.3269<0.0001 ¥
Control601.000 ± 0.10551.000 ± 0.24831.000 ± 0.15330
Grade I/II451.058 ± 0.054000.1121 #1.309 ± 0.13530.2237 #1.976 ± 0.24250.0403 #
Grade III151.314 ± 0.15602.165 ± 0.61732.987 ± 0.4276
Stage I/II411.496 ± 0.15720.0459 #1.161 ± 0.11640.0302 #2.786 ± 0.41990.0459 #
Stage III/IV192.694 ± 0.67081.881 ± 0.26091.241 ± 0.1621
N0/N1491.595 ± 0.25650.0010 #1.582 ± 0.18630.0084 #2.123 ± 0.22610.0078 #
N2/N3113.171 ± 0.58193.529 ± 0.87624.985 ± 1.071
No metastasis (M0)572.259 ± 0.61330.0039 #1.620 ± 0.17260.0088 #2.015 ± 0.20730.0432 #
Distant metastasis (M1)37.009 ± 1.7944.066 ± 0.63104.816 ± 1.835
T Stage: T1/T2401.349 ± 0.13430.0499 #1.652 ± 0.24000.0090 #1.801 ± 0.23170.0026 #
T Stage: T3/T4202.299 ± 0.55882.480 ± 0.46313.205 ± 0.3991
¥ Wilcoxon signed rank test; # Mann–Whitney U test; SEM = standard error mean.
Publisher’s Note: MDPI stays neutral with regard to jurisdictional claims in published maps and institutional affiliations.

