
Advances in Single-Cell Sequencing Technology and Its Application in Poultry Science
 ,
,
Abstract
1. Introduction
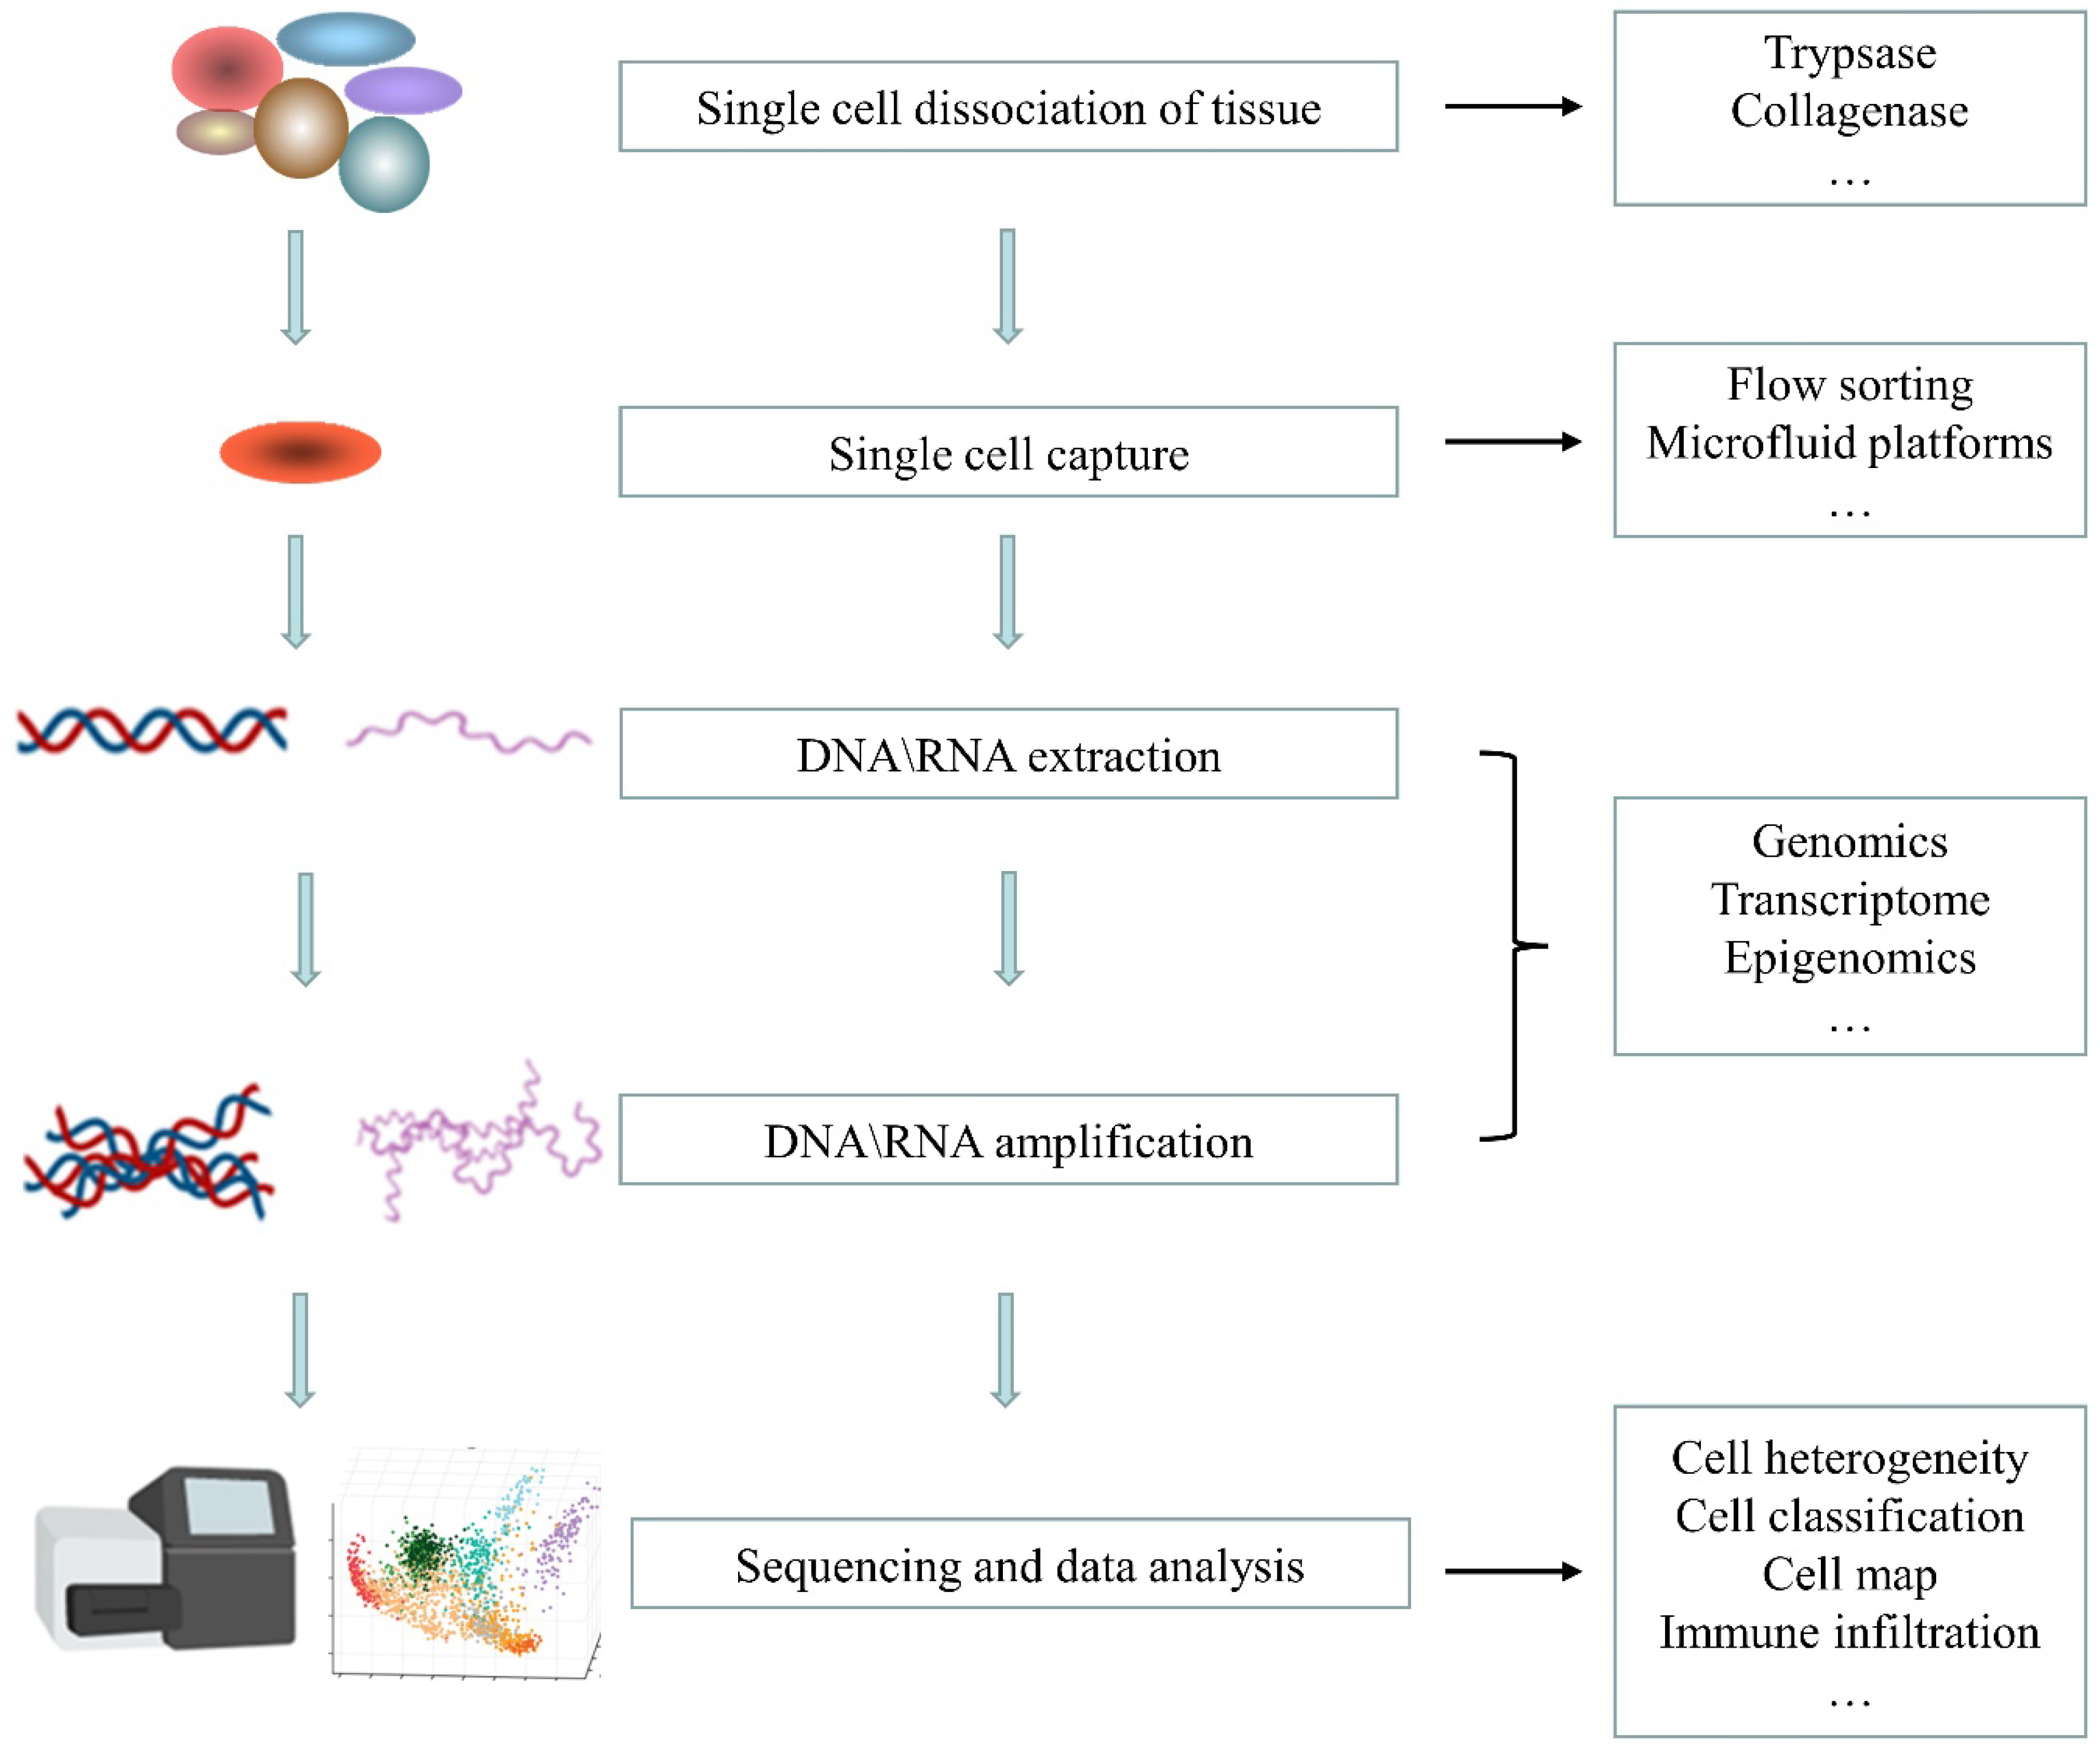
2. Single-Cell Sequencing Technology
2.1. Single-Cell Isolation
2.2. Nucleic Acid Amplification
2.2.1. Single-Cell Whole-Genome Amplification
2.2.2. Single-Cell Whole-Transcriptome Amplification
2.3. High-Throughput Sequencing
2.3.1. Single-Cell Genome Sequencing
2.3.2. Single-Cell Transcriptome Sequencing
2.3.3. Single-Cell Epigenetic Sequencing
2.3.4. Single-Cell Proteomic Analysis
2.3.5. Single-Cell Multi-omics Combined Analysis
2.4. Data Processing and Analysis
2.5. Common Databases for Single-Cell Sequencing Analysis
2.6. Single-Cell Sequencing Technology Platform
2.6.1. Single-Cell Isolation and Labeling Platform
2.6.2. Single-Cell High-Throughput Sequencing Platform
3. Application of SCS in Poultry Science
3.1. Application of SCS in Poultry Breeding
3.2. Application of SCS in Other Fields of Poultry
4. Challenges and Prospects
5. Conclusions
Author Contributions
Funding
Institutional Review Board Statement
Informed Consent Statement
Data Availability Statement
Conflicts of Interest
Abbreviations
| GI tract | Gastrointestinal tract |
| CTCs | Circulating tumor cells |
| EP-CAM | Epithelial/endothelial cell molecule |
| DEP-Array | Dielectrophoresis Array |
| LCM | Laser capture microdissection |
| LA-PCR | Ligation anchored PCR |
| PEP-PCR | Primer extension pre-amplification PCR |
| DOP-PCR | Degenerate oligonucleotide primed PCR |
| MDA | Multiple displacement amplification |
| MALBAC | Multiple annealing and looping-based amplification cycles |
| LIANTI | Linear amplification of transposon insertion |
| CNV | Copy Number Variation |
| UMI | Unique Molecular Identifier |
| IVT | In vitro transcription |
| SUPeR-seq | Single-cell universal polyA-independent RNA-seq |
| MATQ-seq | Multiple annealing and detailing based quantitative RNA-seq |
| SMART-seq | Switching mechanism at the 5′end of the RNA template |
| STRT-seq | Single-cell tagged reverse transcription |
| SCRB-seq | Single cell RNA barcoding and sequencing |
| Drop-seq | Droplets sequencing |
| CEL-seq | Cell expression by linear amplification and sequencing |
| MARS-seq | Massively parallel RNA single-cell sequencing |
| In Drops | Indexing droplets |
| scRRBS | Single-cell reduced-representation bisulfite sequencing |
| scATAC-seq | Single-cell assay for transposase-accessible chromatin |
| scCOOL-seq | Single-cell multi-omics sequencing |
| CoBATCH | Combinatorial barcoding and targeted chromatin release for single-cell profiling of genomic distribution of chromatin-binding proteins in cell culture and tissue |
| PLAYR | Proximity ligation assay for RNA |
| REAP-seq | RNA expression and protein sequencing assay |
| CITE-seq | Cellular indexing of transcriptomes and epitopes by sequencing |
| DR-seq | DNA-mRNA sequencing |
| G&T-seq | Genome and tranome sequencing |
| scM&T-seq | Simultaneous single-cell methylome and transcriptome sequencing |
| SNARE-seq | Single-nucleus chromatin accessibility and mRNA expression sequencing |
| scCAT-seq | Single-cell chromatin accessibility and transcriptome sequencing |
| scTrio –seq | Single-cell genome, DNA methylome, and transcriptome sequencing methods |
| scNMT-seq | Single-cellnucleosome, methylation and transcription sequencing |
References
- Zhou, Y.; Wang, C.J.; Zhu, C.C.; Chen, J.R.; Cheng, M.; Deng, Y.L.; Guo, Y. Single-cell gene variation analysis method for single gland. Yi Chuan = Hered. 2017, 39, 753–762. [Google Scholar]
- Lafzi, A.; Moutinho, C.; Picelli, S.; Heyn, H. Tutorial: Guidelines for the experimental design of single-cell RNA sequencing studies. Nat. Protoc. 2018, 13, 2742–2757. [Google Scholar] [CrossRef] [PubMed]
- Halper, J.; Kjaer, M. Basic components of connective tissues and extracellular matrix: Elastin, fibrillin, fibulins, fibrinogen, fibronectin, laminin, tenascins and thrombospondins. Adv. Exp. Med. Biol. 2014, 802, 31–47. [Google Scholar] [PubMed]
- Insua-Rodríguez, J.; Oskarsson, T. The extracellular matrix in breast cancer. Adv. Drug Deliv. Rev. 2016, 1, 41–55. [Google Scholar] [CrossRef] [PubMed]
- Reichard, A.; Asosingh, K. Best Practices for Preparing a Single Cell Suspension from Solid Tissues for Flow Cytometry. Cytom. A 2019, 95, 219–226. [Google Scholar] [CrossRef]
- Rao, M.V.; Zaidel-Bar, R. Formin-mediated actin polymerization at cell-cell junctions stabilizes E-cadherin and maintains monolayer integrity during wound repair. Mol. Biol. Cell 2016, 27, 2844–2856. [Google Scholar] [CrossRef]
- Burrows, K.; Chiaranunt, P.; Ngai, L.; Mortha, A. Rapid isolation of mouse ILCs from murine intestinal tissues. Methods Enzymol. 2020, 631, 305–327. [Google Scholar]
- Regan, C.; Preall, J. Practical Considerations for Single-Cell Genomics. Curr. Protoc. 2022, 2, e498. [Google Scholar] [CrossRef]
- Stern, R.; Jedrzejas, M.J. Hyaluronidases: Their genomics, structures, and mechanisms of action. Chem. Rev. 2006, 106, 818–839. [Google Scholar] [CrossRef]
- Khan, M.R.; Chandrashekran, A.; Smith, R.K.; Dudhia, J. Immunophenotypic characterization of ovine mesenchymal stem cells. Cytom. A 2016, 89, 443–450. [Google Scholar] [CrossRef]
- Panchision, D.M.; Chen, H.L.; Pistollato, F.; Papini, D.; Ni, H.T.; Hawley, T.S. Optimized flow cytometric analysis of central nervous system tissue reveals novel functional relationships among cells expressing CD133, CD15, and CD24. Stem. Cells 2007, 25, 1560–1570. [Google Scholar] [CrossRef]
- Stremnitzer, C.; Manzano-Szalai, K.; Willensdorfer, A.; Starkl, P.; Pieper, M.; König, P.; Mildner, M.; Tschachler, E.; Reichart, U.; Jensen-Jarolim, E. Papain Degrades Tight Junction Proteins of Human Keratinocytes In Vitro and Sensitizes C57BL/6 Mice via the Skin Independent of its Enzymatic Activity or TLR4 Activation. J. Investig. Dermatol. 2015, 135, 1790–1800. [Google Scholar] [CrossRef]
- Kolarevic, A.; Yancheva, D.; Kocic, G.; Smelcerovic, A. Deoxyribonuclease inhibitors. Eur. J. Med. Chem. 2014, 88, 101–111. [Google Scholar] [CrossRef]
- Price, P.A. The essential role of Ca2+ in the activity of bovine pancreatic deoxyribonuclease. J. Biol. Chem. 1975, 250, 1981–1986. [Google Scholar] [CrossRef]
- Robinson, A.P.; Rodgers, J.M.; Goings, G.E.; Miller, S.D. Characterization of oligodendroglial populations in mouse demyelinating disease using flow cytometry: Clues for MS pathogenesis. PLoS ONE 2014, 9, e107649. [Google Scholar] [CrossRef]
- Tsuji, K.; Ojima, M.; Otabe, K.; Horie, M.; Koga, H.; Sekiya, I.; Muneta, T. Effects of Different Cell-Detaching Methods on the Viability and Cell Surface Antigen Expression of Synovial Mesenchymal Stem Cells. Cell Transplant. 2017, 26, 1089–1102. [Google Scholar] [CrossRef]
- Nayar, S.; Campos, J.; Steinthal, N.; Barone, F. Tissue Digestion for Stromal Cell and Leukocyte Isolation. Methods Mol. Biol. 2017, 1591, 225–234. [Google Scholar]
- Yasen, A.; Aini, A.; Wang, H.; Li, W.; Zhang, C.; Ran, B.; Tuxun, T.; Maimaitinijiati, Y.; Shao, Y.; Aji, T.; et al. Progress and applications of single-cell sequencing techniques. Infect. Genet. Evol. 2020, 80, 104198. [Google Scholar] [CrossRef]
- Ben-David, A.; Davidson, C.E. Estimation method for serial dilution experiments. J. Microbiol. Methods. 2014, 107, 214–221. [Google Scholar] [CrossRef]
- Nagano, T.; Lubling, Y.; Stevens, T.J.; Schoenfelder, S.; Yaffe, E.; Dean, W.; Laue, E.D.; Tanay, A.; Fraser, P. Single-cell Hi-C reveals cell-to-cell variability in chromosome structure. Nature 2013, 502, 59–64. [Google Scholar] [CrossRef]
- Rinke, C.; Lee, J.; Nath, N.; Goudeau, D.; Thompson, B.; Poulton, N.; Dmitrieff, E.; Malmstrom, R.; Stepanauskas, R.; Woyke, T. Obtaining genomes from uncultivated environmental microorganisms using FACS-based single-cell genomics. Nat. Protoc. 2014, 9, 1038–1048. [Google Scholar] [CrossRef] [PubMed]
- Ellsworth, D.L.; Blackburn, H.L.; Shriver, C.D.; Rabizadeh, S.; Soon-Shiong, P.; Ellsworth, R.E. Single-cell sequencing and tumorigenesis: Improved understanding of tumor evolution and metastasis. Clin. Transl. Med. 2017, 6, 15. [Google Scholar] [CrossRef] [PubMed]
- Dalerba, P.; Kalisky, T.; Sahoo, D.; Rajendran, P.S.; Rothenberg, M.E.; Leyrat, A.A.; Sim, S.; Okamoto, J.; Johnston, D.M.; Qian, D.; et al. Single-cell dissection of transcriptional heterogeneity in human colon tumors. Nat. Biotechnol. 2011, 29, 1120–1127. [Google Scholar] [CrossRef] [PubMed]
- Replogle, J.M.; Norman, T.M.; Xu, A.; Hussmann, J.A.; Chen, J.; Cogan, J.Z.; Meer, E.J.; Terry, J.M.; Riordan, D.P.; Srinivas, N.; et al. Combinatorial single-cell CRISPR screens by direct guide RNA capture and targeted sequencing. Nat. Biotechnol. 2020, 38, 954–961. [Google Scholar] [CrossRef]
- Blainey, P.C. The future is now: Single-cell genomics of bacteria and archaea. FEMS Microbiol. Rev. 2013, 37, 407–427. [Google Scholar] [CrossRef]
- Zheng, G.X.; Terry, J.M.; Belgrader, P.; Ryvkin, P.; Bent, Z.W.; Wilson, R.; Ziraldo, S.B.; Wheeler, T.D.; McDermott, G.P.; Zhu, J.; et al. Massively parallel digital transcriptional profiling of single cells. Nat. Commun. 2017, 16, 14049. [Google Scholar] [CrossRef]
- Valihrach, L.; Androvic, P.; Kubista, M. Platforms for Single-Cell Collection and Analysis. Int. J. Mol. Sci. 2018, 19, 807. [Google Scholar] [CrossRef]
- Wang, Y.; Navin, N.E. Advances and applications of single-cell sequencing technologies. Mol. Cell 2015, 58, 598–609. [Google Scholar] [CrossRef]
- Nagrath, S.; Sequist, L.V.; Maheswaran, S.; Bell, D.W.; Irimia, D.; Ulkus, L.; Smith, M.R.; Kwak, E.L.; Digumarthy, S.; Muzikansky, A.; et al. Isolation of rare circulating tumour cells in cancer patients by microchip technology. Nature 2007, 450, 1235–1239. [Google Scholar] [CrossRef]
- Powell, A.A.; Talasaz, A.H.; Zhang, H.; Coram, M.A.; Reddy, A.; Deng, G.; Telli, M.L.; Advani, R.H.; Carlson, R.W.; Mollick, J.A.; et al. Single cell profiling of circulating tumor cells: Transcriptional heterogeneity and diversity from breast cancer cell lines. PLoS ONE 2012, 7, e33788. [Google Scholar] [CrossRef]
- Yu, M.; Stott, S.; Toner, M.; Maheswaran, S.; Haber, D.A. Circulating tumor cells: Approaches to isolation and characterization. J. Cell Biol. 2011, 192, 373–382. [Google Scholar] [CrossRef]
- Altomare, L.; Borgatti, M.; Medoro, G.; Manaresi, N.; Tartagni, M.; Guerrieri, R.; Gambari, R. Levitation and movement of human tumor cells using a printed circuit board device based on software-controlled dielectrophoresis. Biotechnol. Bioeng. 2003, 82, 474–479. [Google Scholar] [CrossRef]
- Choi, J.H.; Ogunniyi, A.O.; Du, M.; Du, M.; Kretschmann, M.; Eberhardt, J.; Love, J.C. Development and optimization of a process for automated recovery of single cells identified by microengraving. Biotechnol. Prog. 2010, 26, 888–895. [Google Scholar] [CrossRef]
- Dal, A.; Camillo, B. How to design a single-cell RNA-sequencing experiment: Pitfalls, challenges and perspectives. Brief. Bioinform. 2019, 20, 1384–1394. [Google Scholar]
- Klein, C.A.; Schmidt-Kittler, O.; Schardt, J.A.; Pantel, K.; Speicher, M.R.; Riethmüller, G. Comparative genomic hybridization, loss of heterozygosity, and DNA sequence analysis of single cells. Proc. Natl. Acad. Sci. USA 1999, 96, 4494–4499. [Google Scholar] [CrossRef]
- Dean, F.B.; Hosono, S.; Fang, L.; Wu, X.; Faruqi, A.F.; Bray-Ward, P.; Sun, Z.; Zong, Q.; Du, Y.; Du, J.; et al. Comprehensive human genome amplification using multiple displacement amplification. Proc. Natl. Acad. Sci. USA 2002, 99, 5261–5266. [Google Scholar] [CrossRef]
- Cheung, V.G.; Nelson, S.F. Whole genome amplification using a degenerate oligonucleotide primer allows hundreds of genotypes to be performed on less than one nanogram of genomic DNA. Proc. Natl. Acad. Sci. USA 1996, 93, 14676–14679. [Google Scholar] [CrossRef]
- Asken, R.S. Single-cell sequencing in its prime. Nat. Biotechnol. 2013, 31, 211–212. [Google Scholar] [CrossRef]
- Choudhury, S.; Huang, A.Y.; Kim, J.; Zhou, Z.; Morillo, K.; Maury, E.A.; Tsai, J.W.; Miller, M.B.; Lodato, M.A.; Araten, S.; et al. Somatic mutations in single human cardiomyocytes reveal age-associated DNA damage and widespread oxidative genotoxicity. Nat. Aging 2022, 2, 714–725. [Google Scholar] [CrossRef]
- Wang, K.; Yu, X.; Jiang, H.; Huang, J.; Wang, H.; Jiang, H.; Wei, S.; Liu, L. Genome-wide expression profiling-based copy number variations and colorectal cancer risk in Chinese. Mol. Carcinog. 2019, 58, 1324–1333. [Google Scholar] [CrossRef]
- Chen, C.; Xing, D.; Tan, L.; Li, H.; Zhou, G.; Huang, L.; Xie, X.S. Single-cell whole-genome analyses by Linear Amplification via Transposon Insertion (LIANTI). Science 2017, 356, 189–194. [Google Scholar] [CrossRef] [PubMed]
- Tang, F.; Barbacioru, C.; Wang, Y.; Nordman, E.; Lee, C.; Xu, N.; Wang, X.; Bodeau, J.; Tuch, B.B.; Siddiqui, A.; et al. mRNA-Seq whole-transcriptome analysis of a single cell. Nat. Methods. 2009, 6, 377–382. [Google Scholar] [CrossRef] [PubMed]
- Hu, Y.; Wang, X.; Hu, B.; Mao, Y.; Chen, Y.; Yan, L.; Yong, J.; Dong, J.; Wei, Y.; Wang, W.; et al. Dissecting the transcriptome landscape of the human fetal neural retina and retinal pigment epithelium by single-cell RNA-seq analysis. PLoS Biol. 2019, 17, e3000365. [Google Scholar] [CrossRef] [PubMed]
- Sasagawa, Y.; Nikaido, I.; Hayashi, T.; Danno, H.; Uno, K.D.; Imai, T.; Ueda, H.R. Quartz-Seq: A highly reproducible and sensitive single-cell RNA sequencing method, reveals non-genetic gene-expression heterogeneity. Genome Biol. 2013, 14, R31. [Google Scholar] [CrossRef] [PubMed]
- Fan, X.; Zhang, X.; Wu, X.; Guo, H.; Hu, Y.; Tang, F.; Huang, Y. Single-cell RNA-seq transcriptome analysis of linear and circular RNAs in mouse preimplantation embryos. Genome Biol. 2015, 16, 148. [Google Scholar] [CrossRef] [PubMed]
- Sheng, K.; Cao, W.; Niu, Y.; Deng, Q.; Zong, C. Effective detection of variation in single-cell transcriptomes using MATQ-seq. Nat. Methods 2017, 14, 267–270. [Google Scholar] [CrossRef]
- Ramsköld, D.; Luo, S.; Wang, Y.C.; Li, R.; Deng, Q.; Faridani, O.R.; Daniels, G.A.; Khrebtukova, I.; Loring, J.F.; Laurent, L.C.; et al. Full-length mRNA-Seq from single-cell levels of RNA and individual circulating tumor cells. Nat. Biotechnol. 2012, 30, 777–782. [Google Scholar] [CrossRef]
- Nichterwitz, S.; Chen, G.; Aguila-Benitez, J.; Yilmaz, M.; Storvall, H.; Cao, M.; Sandberg, R.; Deng, Q.; Hedlund, E. Laser capture microscopy coupled with Smart-seq2 for precise spatial transcriptomic profiling. Nat. Commun. 2016, 7, 12139. [Google Scholar] [CrossRef]
- Ziegenhain, C.; Vieth, B.; Parekh, S.; Reinius, B.; Guillaumet-Adkins, A.; Smets, M.; Leonhardt, H.; Heyn, H.; Hellmann, I.; Enard, W. Comparative Analysis of Single-Cell RNA Sequencing Methods. Mol. Cell. 2017, 65, 631–643. [Google Scholar] [CrossRef]
- Islam, S.; Kjällquist, U.; Moliner, A.; Zajac, P.; Fan, J.B.; Lönnerberg, P.; Linnarsson, S. Characterization of the single-cell transcriptional landscape by highly multiplex RNA-seq. Genome Res. 2011, 21, 1160–1167. [Google Scholar] [CrossRef]
- Stegle, O.; Teichmann, S.A.; Marioni, J.C. Computational and analytical challenges in single-cell transcriptomics. Nat. Rev. Genet. 2015, 16, 133–145. [Google Scholar] [CrossRef]
- Macosko, E.Z.; Basu, A.; Satija, R.; Nemesh, J.; Shekhar, K.; Goldman, M.; Tirosh, I.; Bialas, A.R.; Kamitaki, N.; Martersteck, E.M.; et al. Highly Parallel Genome-wide Expression Profiling of Individual Cells Using Nanoliter Droplets. Cell 2015, 161, 1202–1214. [Google Scholar] [CrossRef]
- Hashimshony, T.; Wagner, F.; Sher, N.; Yanai, I. CEL-Seq: Single-cell RNA-Seq by multiplexed linear amplification. Cell Rep. 2012, 2, 666–673. [Google Scholar] [CrossRef]
- Hashimshony, T.; Senderovich, N.; Avital, G.; Klochendler, A.; de Leeuw, Y.; Anavy, L.; Gennert, D.; Li, S.; Livak, K.J.; Rozenblatt-Rosen, O.; et al. CEL-Seq2: Sensitive highly-multiplexed single-cell RNA-Seq. Genome Biol. 2016, 17, 77. [Google Scholar] [CrossRef]
- Jaitin, D.A.; Kenigsberg, E.; Keren-Shaul, H.; Elefant, N.; Paul, F.; Zaretsky, I.; Mildner, A.; Cohen, N.; Jung, S.; Tanay, A.; et al. Massively parallel single-cell RNA-seq for marker-free decomposition of tissues into cell types. Science 2014, 343, 776–779. [Google Scholar] [CrossRef]
- Klein, A.M.; Mazutis, L.; Akartuna, I.; Tallapragada, N.; Veres, A.; Li, V.; Peshkin, L.; Weitz, D.A.; Kirschner, M.W. Droplet barcoding for single-cell transcriptomics applied to embryonic stem cells. Cell 2015, 161, 1187–1201. [Google Scholar] [CrossRef]
- Goodwin, S.; McPherson, J.D.; McCombie, W.R. Coming of age: Ten years of next-generation sequencing technologies. Nat. Rev. Genet. 2016, 17, 333–351. [Google Scholar] [CrossRef]
- Yuan, J.; Sheng, J.; Sims, P.A. SCOPE-Seq: A scalable technology for linking live cell imaging and single-cell RNA sequencing. Genome Biol. 2018, 19, 227. [Google Scholar] [CrossRef]
- Guo, H.; Zhu, P.; Guo, F.; Li, X.; Wu, X.; Fan, X.; Wen, L.; Tang, F. Profiling DNA methylome landscapes of mammalian cells with single-cell reduced-representation bisulfite sequencing. Nat. Protoc. 2015, 10, 645–659. [Google Scholar] [CrossRef]
- Cusanovich, D.A.; Hill, A.J.; Aghamirzaie, D.; Daza, R.M.; Pliner, H.A.; Berletch, J.B.; Filippova, G.N.; Huang, X.; Christiansen, L.; DeWitt, W.S.; et al. A Single-Cell Atlas of In Vivo Mammalian Chromatin Accessibility. Cell 2018, 174, 1309–1324. [Google Scholar] [CrossRef]
- Guo, F.; Li, L.; Li, J.; Wu, X.; Hu, B.; Zhu, P.; Wen, L.; Tang, F. Single-cell multi-omics sequencing of mouse early embryos and embryonic stem cells. Cell Res. 2017, 27, 967–988. [Google Scholar] [CrossRef] [PubMed]
- Wang, Q.; Xiong, H.; Ai, S.; Yu, X.; Liu, Y.; Zhang, J.; He, A. CoBATCH for High-Throughput Single-Cell Epigenomic Profiling. Mol. Cell. 2019, 76, 206–216. [Google Scholar] [CrossRef] [PubMed]
- Roussis, I.M.; Myers, F.A.; Scarlett, G.P. RNA Whole-Mount In Situ Hybridization Proximity Ligation Assay (rISH-PLA), an Assay for Detecting RNA-Protein Complexes in Intact Cells. Curr. Protoc. Cell Biol. 2017, 3, 17201–172010. [Google Scholar]
- Luo, J.; Erb, C.A.; Chen, K. Simultaneous Measurement of Surface Proteins and Gene Expression from Single Cells. Methods Mol. Biol. 2020, 2111, 35–46. [Google Scholar] [PubMed]
- Peterson, V.M.; Zhang, K.X.; Kumar, N.; Wong, J.; Li, L.; Wilson, D.C.; Moore, R.; McClanahan, T.K.; Sadekova, S.; Klappenbach, J.A. Multiplexed quantification of proteins and transcripts in single cells. Nat. Biotechnol. 2017, 35, 936–939. [Google Scholar] [CrossRef]
- Dey, S.S.; Kester, L.; Spanjaard, B.; Bienko, M.; Oudenaarden, A. Integrated genome and transcriptome sequencing of the same cell. Nat. Biotechnol. 2015, 33, 285–289. [Google Scholar] [CrossRef]
- Macaulay, I.C.; Teng, M.J.; Haerty, W.; Kumar, P.; Ponting, C.P.; Voet, T. Separation and parallel sequencing of the genomes and transcriptomes of single cells using G&T-seq. Nat. Protoc. 2016, 11, 2081–2103. [Google Scholar]
- Rodriguez-Meira, A.; Buck, G.; Clark, S.A.; Povinelli, B.J.; Alcolea, V.; Louka, E.; McGowan, S.; Hamblin, A.; Sousos, N.; Barkas, N.; et al. Unravelling Intratumoral Heterogeneity through High-Sensitivity Single-Cell Mutational Analysis and Parallel RNA Sequencing. Mol. Cell 2019, 73, 1292–1305. [Google Scholar] [CrossRef]
- Chaligne, R.; Nam, A.S.; Landau, D.A. TARGET-seq Takes Aim at Cancer Evolution through Multiomics Single-Cell Genotyping and Transcriptomics. Mol. Cell 2019, 73, 1092–1094. [Google Scholar] [CrossRef]
- Angermueller, C.; Clark, S.J.; Lee, H.J.; Macaulay, I.C.; Teng, M.J.; Hu, T.X.; Krueger, F.; Smallwood, S.; Ponting, C.P.; Voet, T.; et al. Parallel single-cell sequencing links transcriptional and epigenetic heterogeneity. Nat. Methods 2016, 13, 229–232. [Google Scholar] [CrossRef]
- Chen, S.; Lake, B.B.; Zhang, K. High-throughput sequencing of the transcriptome and chromatin accessibility in the same cell. Nat. Biotechnol. 2019, 37, 1452–1457. [Google Scholar] [CrossRef]
- Liu, L.; Liu, C.; Quintero, A.; Wu, L.; Yuan, Y.; Wang, M.; Cheng, M.; Leng, L.; Xu, L.; Dong, G.; et al. Deconvolution of single-cell multi-omics layers reveals regulatory heterogeneity. Nat. Commun. 2019, 10, 470. [Google Scholar] [CrossRef]
- Duckworth, A.D.; Gherardini, P.F.; Sykorova, M.; Yasin, F.; Nolan, G.P.; Slupsky, J.R.; Kalakonda, N. Multiplexed profiling of RNA and protein expression signatures in individual cells using flow or mass cytometry. Nat. Protoc. 2019, 14, 901–920. [Google Scholar] [CrossRef]
- Hou, Y.; Guo, H.; Cao, C.; Li, X.; Hu, B.; Zhu, P.; Wu, X.; Wen, L.; Tang, F.; Huang, Y.; et al. Single-cell triple omics sequencing reveals genetic, epigenetic, and transcriptomic heterogeneity in hepatocellular carcinomas. Cell Res. 2016, 26, 304–319. [Google Scholar] [CrossRef]
- Clark, S.J.; Argelaguet, R.; Kapourani, C.A.; Stubbs, T.M.; Lee, H.J.; Alda-Catalinas, C.; Krueger, F.; Sanguinetti, G.; Kelsey, G.; Marioni, J.C.; et al. scNMT-seq enables joint profiling of chromatin accessibility DNA methylation and transcription in single cells. Nat. Commun. 2018, 9, 781. [Google Scholar] [CrossRef]
- Vander-Auwera, G.A.; Carneiro, M.O.; Hartl, C.; Poplin, R.; Del-Angel, G.; Levy-Moonshine, A.; Jordan, T.; Shakir, K.; Roazen, D.; Thibault, J.; et al. From FastQ data to high confidence variant calls: The Genome Analysis Toolkit best practices pipeline. Curr. Protoc. Bioinform. 2013, 43, 11101–11103. [Google Scholar]
- Ding, B.; Zheng, L.; Zhu, Y.; Li, N.; Jia, H.; Ai, R.; Wildberg, A.; Wang, W. Normalization and noise reduction for single cell RNA-seq experiments. Bioinformatics 2015, 31, 2225–2227. [Google Scholar] [CrossRef]
- Nawade, B.; Kumar, A.; Maurya, R.; Subramani, R.; Yadav, R.; Singh, K.; Rangan, P. Longer Duration of Active Oil Biosynthesis during Seed Development Is Crucial for High Oil Yield-Lessons from Genome-Wide In Silico Mining and RNA-Seq Validation in Sesame. Plants 2022, 11, 2980. [Google Scholar] [CrossRef]
- Du, Y.; Huang, Q.; Arisdakessian, C.; Garmire, L.X. Evaluation of STAR and Kallisto on Single Cell RNA-Seq Data Alignment. G3 Genes Genomes Genet. 2020, 10, 1775–1783. [Google Scholar] [CrossRef]
- Risso, D. Normalization of Single-Cell RNA-Seq Data. Methods Mol. Biol. 2021, 2284, 303–329. [Google Scholar]
- Lun, A.T.; McCarthy, D.J.; Marioni, J.C. A step-by-step workflow for low-level analysis of single-cell RNA-seq data with Bioconductor. F1000Research 2016, 31, 2122. [Google Scholar] [CrossRef] [PubMed]
- Talwar, D.; Mongia, A.; Sengupta, D.; Majumdar, A. AutoImpute: Autoencoder based imputation of single-cell RNA-seq data. Sci. Rep. 2018, 8, 16329. [Google Scholar] [CrossRef] [PubMed]
- Hie, B.; Bryson, B.; Berger, B. Efficient integration of heterogeneous single-cell transcriptomes using Scanorama. Nat. Biotechnol. 2019, 37, 685–691. [Google Scholar] [CrossRef] [PubMed]
- McCarthy, D.J.; Campbell, K.R.; Lun, A.T.; Wills, Q.F. Scater: Pre-processing, quality control, normalization and visualization of single-cell RNA-seq data in R. Bioinformatics 2017, 33, 1179–1186. [Google Scholar] [CrossRef] [PubMed]
- Wolf, F.A.; Angerer, P.; Theis, F.J. SCANPY: Large-scale single-cell gene expression data analysis. Genome Biol. 2018, 19, 15. [Google Scholar] [CrossRef]
- Butler, A.; Hoffman, P.; Smibert, P.; Papalexi, E.; Satija, R. Integrating single-cell transcriptomic data across different conditions, technologies, and species. Nat. Biotechnol. 2018, 36, 411–420. [Google Scholar] [CrossRef]
- Stuart, T.; Butler, A.; Hoffman, P.; Hafemeister, C.; Papalexi, E.; Mauck, W.M.; Hao, Y.; Stoeckius, M.; Smibert, P.; Satija, R. Comprehensive Integration of Single-Cell Data. Cell 2019, 177, 1888–1902. [Google Scholar] [CrossRef]
- Andrews, T.S.; Hemberg, M. M3Drop: Dropout-based feature selection for scRNASeq. Bioinformatics 2019, 35, 2865–2867. [Google Scholar] [CrossRef]
- Setty, M.; Tadmor, M.D.; Reich-Zeliger, S.; Angel, O.; Salame, T.M.; Kathail, P.; Choi, K.; Bendall, S.; Friedman, N.; Pe’er, D. Wishbone identifies bifurcating developmental trajectories from single-cell data. Nat. Biotechnol. 2016, 34, 637–645. [Google Scholar] [CrossRef]
- Qiu, X.; Hill, A.; Packer, J.; Lin, D.; Ma, Y.A.; Trapnell, C. Single-cell mRNA quantification and differential analysis with Census. Nat. Methods 2017, 14, 309–315. [Google Scholar] [CrossRef]
- Pan, L.; Shan, S.; Tremmel, R.; Li, W.; Liao, Z.; Shi, H.; Chen, Q.; Zhang, X.; Li, X. HTCA: A database with an in-depth characterization of the single-cell human transcriptome. Nucleic Acids Res. 2022, 21, gkac791. [Google Scholar] [CrossRef]
- Sun, D.; Wang, J.; Han, Y.; Dong, X.; Ge, J.; Zheng, R.; Shi, X.; Wang, B.; Li, Z.; Ren, P.; et al. TISCH: A comprehensive web resource enabling interactive single-cell transcriptome visualization of tumor microenvironment. Nucleic Acids Res. 2021, 49, 1420–1430. [Google Scholar] [CrossRef]
- Zhou, Z.; Tan, C.; Chau, M.H.K.; Jiang, X.; Ke, Z.; Chen, X.; Cao, Y.; Kwok, Y.K.; Bellgard, M.; Leung, T.Y.; et al. TEDD: A database of temporal gene expression patterns during multiple developmental periods in human and model organisms. Nucleic Acids Res. 2022, 9, gkac978. [Google Scholar] [CrossRef]
- Gao, X.; Hong, F.; Hu, Z.; Zhang, Z.; Lei, Y.; Li, X.; Cheng, T. ABC portal: A single-cell database and web server for blood cells. Nucleic Acids Res. 2022, 3, gkac646. [Google Scholar] [CrossRef]
- Burlaka, Y.B.; Sukhoveev, O.V.; Grin, N.V.; Khilchevskyi, O.M.; Verevka, S.V. EPR spectroscopy studies of changes in erythrocyte membranes in patients with laryngeal cancer. Exp. Oncol. 2017, 39, 49–52. [Google Scholar] [CrossRef]
- Regev, A.; Teichmann, S.A.; Lander, E.S.; Amit, I.; Benoist, C.; Birney, E.; Bodenmiller, B.; Campbell, P.; Carninci, P.; Clatworthy, M.; et al. Human Cell Atlas Meeting Participants. The Human Cell Atlas. Elife 2017, 6, e27041. [Google Scholar] [CrossRef]
- Shalek, A.K.; Satija, R.; Shuga, J.; Trombetta, J.J.; Gennert, D.; Lu, D.; Chen, P.; Gertner, R.S.; Gaublomme, J.T.; Yosef, N.; et al. Single-cell RNA-seq reveals dynamic paracrine control of cellular variation. Nature 2014, 510, 363–369. [Google Scholar] [CrossRef]
- Yuan, H.; Yan, M.; Zhang, G.; Liu, W.; Deng, C.; Liao, G.; Xu, L.; Luo, T.; Yan, H.; Long, Z.; et al. CancerSEA: A cancer single-cell state atlas. Nucleic Acids Res. 2019, 47, 900–908. [Google Scholar] [CrossRef]
- Zhang, Y.; Zhang, Y.; Hu, J.; Zhang, J.; Guo, F.; Zhou, M.; Zhang, G.; Yu, F.; Su, J. scTPA: A web tool for single-cell transcriptome analysis of pathway activation signatures. Bioinformatics 2020, 36, 4217–4219. [Google Scholar] [CrossRef]
- Franzén, O.; Gan, L.M.; Björkegren, J.L.M. PanglaoDB: A web server for exploration of mouse and human single-cell RNA sequencing data. Database 2019, 1, baz046. [Google Scholar] [CrossRef]
- Andrews, T.S.; Hemberg, M. Identifying cell populations with scRNASeq. Mol. Aspects Med. 2018, 59, 114–122. [Google Scholar] [CrossRef] [PubMed]
- Hay, S.B.; Ferchen, K.; Chetal, K.; Grimes, H.L.; Salomonis, N. The Human Cell Atlas bone marrow single-cell interactive web portal. Exp. Hematol. 2018, 68, 51–61. [Google Scholar] [CrossRef]
- Aicher, T.P.; Carroll, S.; Raddi, G.; Gierahn, T.; Wadsworth, M.H.; Hughes, T.K.; Love, C.; Shalek, A.K. Seq-Well: A Sample-Efficient, Portable Picowell Platform for Massively Parallel Single-Cell RNA Sequencing. Methods Mol. Biol. 2019, 1979, 111–132. [Google Scholar] [PubMed]
- Birey, F.; Andersen, J.; Makinson, C.D.; Islam, S.; Wei, W.; Huber, N.; Fan, H.C.; Metzler, K.R.C.; Panagiotakos, G.; Thom, N.; et al. Assembly of functionally integrated human forebrain spheroids. Nature 2017, 545, 54–59. [Google Scholar] [CrossRef] [PubMed]
- Zeisel, A.; Hochgerner, H.; Lönnerberg, P.; Johnsson, A.; Memic, F.; vander-Zwan, J.; Häring, M.; Braun, E.; Borm, L.E.; La Manno, G.; et al. Molecular Architecture of the Mouse Nervous System. Cell 2018, 174, 999–1014. [Google Scholar] [CrossRef] [PubMed]
- Rozenblatt-Rosen, O.; Stubbington, M.J.T.; Regev, A.; Teichmann, S.A. The Human Cell Atlas: From vision to reality. Nature 2017, 550, 451–453. [Google Scholar] [CrossRef]
- Khan, S.; Kaihara, K.A. Single-Cell RNA-Sequencing of Peripheral Blood Mononuclear Cells with ddSEQ. Methods Mol. Biol. 2019, 1979, 155–176. [Google Scholar]
- Rosenberg, A.B.; Roco, C.M.; Muscat, R.A.; Kuchina, A.; Sample, P.; Yao, Z.; Graybuck, L.T.; Peeler, D.J.; Mukherjee, S.; Chen, W.; et al. Single-cell profiling of the developing mouse brain and spinal cord with split-pool barcoding. Science 2018, 360, 176–182. [Google Scholar] [CrossRef]
- Zhou, Y.; Jia, E.; Pan, M.; Zhao, X.; Ge, Q. Encoding Method of Single-cell Spatial Transcriptomics Sequencing. Int. J. Biol. Sci. 2020, 16, 2663–2674. [Google Scholar] [CrossRef]
- Freytag, S.; Tian, L.; Lönnstedt, I.; Ng, M.; Bahlo, M. Comparison of clustering tools in R for medium-sized 10× Genomics single-cell RNA-sequencing data. F1000Research 2018, 15, 1297. [Google Scholar] [CrossRef]
- Mostovoy, Y.; Levy-Sakin, M.; Lam, J.; Lam, E.T.; Hastie, A.R.; Marks, P.; Lee, J.; Chu, C.; Lin, C.; Džakula, Ž.; et al. A hybrid approach for de novo human genome sequence assembly and phasing. Nat. Methods 2016, 13, 587–590. [Google Scholar] [CrossRef]
- Chen, D.; Zhen, H.; Qiu, Y.; Liu, P.; Zeng, P.; Xia, J.; Shi, Q.; Xie, L.; Zhu, Z.; Gao, Y.; et al. Comparison of single cell sequencing data between two whole genome amplification methods on two sequencing platforms. Sci. Rep. 2018, 8, 4963. [Google Scholar] [CrossRef]
- Ashton, J.M.; Rehrauer, H.; Myers, J.; Myers, J.; Zanche, M.; Balys, M.; Foox, J.; Mason, C.E.; Steen, R.; Kuentzel, M.; et al. Comparative Analysis of Single-Cell RNA Sequencing Platforms and Methods. J. Biomol. Tech 2021, 32, 3fc1f5fe.3eccea01. [Google Scholar] [CrossRef]
- Estermann, M.A.; Williams, S.; Hirst, C.E.; Roly, Z.Y.; Serralbo, O.; Adhikari, D.; Powell, D.; Major, A.T.; Smith, C.A. Insights into Gonadal Sex Differentiation Provided by Single-Cell Transcriptomics in the Chicken Embryo. Cell Rep. 2020, 31, 107491. [Google Scholar] [CrossRef]
- Feregrino, C.; Sacher, F.; Parnas, O.; Tschopp, P. A single-cell transcriptomic atlas of the developing chicken limb. BMC Genom. 2019, 20, 401. [Google Scholar] [CrossRef]
- Mantri, M.; Scuderi, G.J.; Abedini-Nassab, R.; Wang, M.F.Z.; McKellar, D.; Shi, H.; Grodner, B.; Butcher, J.T.; Vlaminck, I. Spatiotemporal single-cell RNA sequencing of developing chicken hearts identifies interplay between cellular differentiation and morphogenesis. Nat. Commun. 2021, 12, 1771. [Google Scholar] [CrossRef]
- Zhang, J.; Lv, C.; Mo, C.; Liu, M.; Wan, Y.; Li, J.; Wang, Y. Single-Cell RNA Sequencing Analysis of Chicken Anterior Pituitary: A Bird’s-Eye View on Vertebrate Pituitary. Front. Physiol. 2021, 12, 562817. [Google Scholar] [CrossRef]
- Yamagata, M.; Yan, W.; Sanes, J.R. A cell atlas of the chick retina based on single-cell transcriptomics. Elife 2021, 4, e63907. [Google Scholar] [CrossRef]
- Sun, C.; Jin, K.; Zuo, Q.; Sun, H.; Song, J.; Zhang, Y.; Chen, G.; Li, B. Characterization of Alternative Splicing (AS) Events during Chicken (Gallus gallus) Male Germ-Line Stem Cell Differentiation with Single-Cell RNA-seq. Animals 2021, 11, 1469. [Google Scholar] [CrossRef]
- Rengaraj, D.; Cha, D.G.; Lee, H.J.; Lee, K.Y.; Choi, Y.H.; Jung, K.M.; Kim, Y.M.; Choi, H.J.; Choi, H.J.; Yoo, E.; et al. Dissecting chicken germ cell dynamics by combining a germ cell tracing transgenic chicken model with single-cell RNA sequencing. Comput. Struct. Biotechnol. J. 2022, 2, 1654–1669. [Google Scholar] [CrossRef]
- Li, J.; Xing, S.; Zhao, G.; Zheng, M.; Yang, X.; Sun, J.; Wen, J.; Liu, R. Identification of diverse cell populations in skeletal muscles and biomarkers for intramuscular fat of chicken by single-cell RNA sequencing. BMC Genom. 2020, 21, 752. [Google Scholar] [CrossRef] [PubMed]
- Li, Z.; Zheng, M.; Mo, J.; Li, K.; Yang, X.; Guo, L.; Zhang, X.; Abdalla, B.A.; Nie, Q. Single-cell RNA sequencing of preadipocytes reveals the cell fate heterogeneity induced by melatonin. J. Pineal Res. 2021, 70, e12725. [Google Scholar] [CrossRef] [PubMed]
- Dai, A.M.; Feng, M.; Li, Z.W.; Chen, W.S.; Liao, M. Chicken peripheral blood lymphocyte response to ALV-J infection assessed by single-cell RNA sequencing. Front. Microbiol. 2022, 13, 800618. [Google Scholar]
- Sacher, F.; Feregrino, C.; Tschopp, P.; Ewald, C.Y. Extracellular matrix gene expression signatures as cell type and cell state identifiers. Matrix Biol. Plus 2021, 21, 100069. [Google Scholar] [CrossRef] [PubMed]
- Hwang, B.; Lee, J.H.; Bang, D. Single-cell RNA sequencing technologies and bioinformatics pipelines. Exp. Mol. Med. 2018, 50, 1–14. [Google Scholar] [CrossRef]
- Kulkarni, A.; Anderson, A.G.; Merullo, D.P.; Konopka, G. Beyond bulk: A review of single cell transcriptomics methodologies and applications. Curr. Opin. Biotechnol. 2019, 58, 129–136. [Google Scholar] [CrossRef]
- Xiong, L.; Xu, K.; Tian, K.; Shao, Y.; Tang, L.; Gao, G.; Zhang, M.; Jiang, T.; Zhang, Q.C. SCALE method for single-cell ATAC-seq analysis via latent feature extraction. Nat. Commun. 2019, 10, 4576. [Google Scholar] [CrossRef]
- Xie, T.; Wang, Y.; Deng, N.; Huang, G.; Taghavifar, F.; Geng, Y.; Liu, N.; Kulur, V.; Yao, C.; Chen, P.; et al. Single-Cell Deconvolution of Fibroblast Heterogeneity in Mouse Pulmonary Fibrosis. Cell Rep. 2018, 22, 3625–3640. [Google Scholar] [CrossRef]
- Duan, B.; Zhou, C.; Zhu, C.; Yu, Y.; Li, G.; Zhang, S.; Zhang, C.; Ye, X.; Ma, H.; Qu, S.; et al. Model-based understanding of single-cell CRISPR screening. Nat. Commun. 2019, 10, 2233. [Google Scholar] [CrossRef]
- He, Y.; Yuan, H.; Wu, C.; Xie, Z. DISC: A highly scalable and accurate inference of gene expression and structure for single-cell transcriptomes using semi-supervised deep learning. Genome Biol. 2020, 21, 170. [Google Scholar] [CrossRef]
- Li, Y.; Haug, S.; Schlosser, P.; Teumer, A.; Tin, A.; Pattaro, C.; Köttgen, A.; Wuttke, M. Integration of GWAS Summary Statistics and Gene Expression Reveals Target Cell Types Underlying Kidney Function Traits. J. Am. Soc. Nephrol. 2020, 31, 2326–2340. [Google Scholar] [CrossRef]
- Farmer, A.; Thibivilliers, S.; Ryu, K.H.; Schiefelbein, J.; Libault, M. Single-nucleus RNA and ATAC sequencing reveals the impact of chromatin accessibility on gene expression in Arabidopsis roots at the single-cell level. Mol. Plant 2021, 14, 372–383. [Google Scholar] [CrossRef]
- Ranzoni, A.M.; Tangherloni, A.; Berest, I.; Riva, S.G.; Myers, B.; Strzelecka, P.M.; Xu, J.; Panada, E.; Mohorianu, I.; Zaugg, J.B.; et al. Integrative Single-Cell RNA-Seq and ATAC-Seq Analysis of Human Developmental Hematopoiesis. Cell Stem. Cell 2021, 28, 472–487. [Google Scholar] [CrossRef]


| Enzyme | Purpose | Attention | Ref. |
|---|---|---|---|
| Enzymes of break down the extracellular matrix | |||
| Dispase | Cleaves attachments between cells and extra- cellular matrix. | Able to cleave specific relevant surface molecules or antigens, resulting in loss of epitopes. | [6,7] |
| Collagenase | Breaks peptide bonds present in collagen. | Purified collagenase is more effective. | [8] |
| Hyaluronidase | Cleaves glycosidic bonds in hyaluronan. | Cleaves β-1,4-glycosidic in the glycosaminoglycan. | [9] |
| Enzymes of break cell–cell junctions | |||
| Trypsin | Degrades certain proteins in cell–cell junctions. | Affects cell membrane proteins. Leads to free-DNA-induced aggregation of cells. | [10,11] |
| Papain | [12] | ||
| Cleaves the phosphodiester linkages of the DNA main chain (Deoxyribonuclease) | |||
| DNase-I | Degrades free DNA; prevents cell aggregation. | -CaCl2 acts as enzyme activator. | [13,14] |
| Methods | Description | Sorting Function | Advantages | Disadvantages | Ref. |
|---|---|---|---|---|---|
| Tissue enzymatic hydrolysis Methods | |||||
| Abundant Cells | |||||
| Serial dilution | Prepared by diluting cell populations by a series of multiples. | No | Convenient operation. | Strong dependence on the calculation of gradient dilution; easily makes errors; time-consuming; low flux rate. | [19] |
| Mouth pipetting | Isolate single cells with glass pipettes. | No | Convenient operation. | Identifying cells is error-prone; technically challenging; low flux rate. | [20] |
| FACS | Single-cell suspensions are labeled with specific fluorescent pigments. The light detector captures cell-specific signals excited by the laser to analyze cell types. | Yes | Higher accuracy, throughput and sensitivity. | Expensive equipment; damages the cells; has certain requirements for the initial number of cells. | [21,22,23] |
| Micromanipulation | Uses a micromanipulator to separate cells under a high-power inverted microscope. | Yes | Convenient operation; low cost. | May cause mechanical damage to targeted cells; high error rates; low flux rate. | [24] |
| Microfluid platforms | Separates target cells on a microscale based mainly on their characteristics. | Yes | Cell contamination rates of the microfluidic devices and reagent consumption are relatively low. | Expensive consumables; high-throughput. | [25,26,27] |
| Rare Cells | |||||
| Nano filter | Size discrimination on nano filters. | No | Low cost. | Cells can adhere to filters during backwash; low flux rate. | [28] |
| IMS | Magnetic beads are employed to bind cell surface antigens with specific monoclonal antibodies and are retained in the magnetic field. | Yes | High enrichment of rare cells. | Operation is relatively complex; low flux rate. | [29,30,31] |
| Cell Selector | Robotic capillary micro-manipulator. | No | Efficient isolation; high-throughput. | Expensive system. | [32] |
| DEP-Array | Microchip with dielectrophoretic cages. | Yes | High sensitivity. | Time-consuming; cells are deposited; low flux rate. | [33] |
| Tissue slice Methods | |||||
| LCM | Cells are cut from a tissue section slide with lasers. | Yes | Determines the spatial position of individual cells. | High cost, low flux rate, limited accuracy. Cell nucleus can easily be cut. | [34] |
| Patch clamping | Single cell is obtained from a tissue section. | Yes | Spatial context is preserved. | Contamination surrounding cells; low flux rate. | [34] |
| Methods | Principle | Polymerase | Primer | Advantages | Disadvantages | Ref. |
|---|---|---|---|---|---|---|
| LA-PCR | After polymerase modifies the ends, the specific ligaments are used as the starting template, and the ligation sequences are used as primers for amplification. | Taq DNA polymerase | Random primers. | Less offset for sequence selection. | Nonspecific high amplification, low amplification efficiency, limited application, low genome coverage. | [35] |
| PEP-PCR | Fifteen oligonucleotides act as a primer in DNA polymerase, then the genome is randomly amplified. | Taq DNA polymerase | Random primers. | Arbitrarily primed PCR. | Nonspecific high amplification, low amplification efficiency, limited application, low genome coverage. | [36] |
| DOP-PCR | 3′ random sequence containing 6 bp of primers randomly combined with genomic DNA to achieve the amplification of the whole genome. | Taq DNA polymerase | Degenerate oligonucleotide primers. | Suitable for CNV on chromosomes quantitatively. | Nonspecific high amplification, low amplification efficiency, limited application, low genome coverage. | [37] |
| MDA | Random hexamer primers and the enzyme are used to initiate replication at multiple sites simultaneously under isothermal conditions, amplified by chain substitution. | φ29 DNA polymerase | Random primers. | High amplification ability, low PCR amplification deviation, simple experiment. | Uneven coverage of the whole genome, and allelic gene loss rate up to 65%, which is not suitable for analyses of CNV. | [38,39] |
| MALBAC | Combines MDA with PCR. | Bst DNA polymerase | Random primers and common marker primers. | Simple operation, high yield, high uniformity, low amplification bias, high coverage rate. | The amplification efficiency is relatively low; the complex DNA secondary structure cannot be effectively amplified. | [40] |
| LIANTI | The TN5 transposon is used to randomly cut DNA for in vitro transcription and reverse transcription. | Taq DNA polymerase | Random primers. | Sequence bias reduced, high gene coverage, high accuracy of CNV detection. | False positive value of C-T base pair is higher. | [41] |
| Methods | Principle | RNA Capture | cDNA Coverage | UMI | Advantages | Disadvantages | Ref. |
|---|---|---|---|---|---|---|---|
| PloyA tail was added | |||||||
| Tang RNA-seq | The polymeric T base is used as the primer to synthesize cDNA. The polymeric A base is added at the 3′ end as the binding site of the polymeric T base of the second cDNA strand. | ployA+ | Full-length with 3′-biased. | NO | Can detect the full length of transcript, more sensitive and accurate. | Bias to the 3′ end high, low throughput, more expensive. | [42,43] |
| Quartz-seq | Inhibitory PCR is used to self-hybridize the primers to form a pan structure to reduce the by-products, and a small fragment of the second strand of cDNA is formed into a hairpin structure. | ployA+ | Full-length with 3′-biased. | NO | Reduces PCR by-products, reduces contamination of small fragments. | Causes amplification bias. | [44] |
| SUPeR-seq | The first strand of cDNA is synthesized using random primers containing fixed anchoring sequences, which contain random nucleotide and oligonucleotide—DT. Poly adenylate and non-poly adenylate RNAs are sequenced. | ployA+ and ployA- | Full-length. | NO | RNA and genomic DNA are the least contaminated. | Low coverage rate. | [45] |
| MATQ-seq | The primers containing G, A and T bases are annealed for 10 cycles. After reverse transcription, the first chain of cDNAs is Ploy C, and then the G-enriched primers are used to efficiently synthesize the second chain. | ployA+ and ployA- | Full-length. | YES | High genome coverage, very sensitive. | Difficulty in detecting non-coding RNA. | [46] |
| 5′ template-based replacement | |||||||
| SMART-seq | The RNA is hybridized with a primer containing oligo(dT). Template-free C nucleotides are added to generate the first chain, and the oligonucleotide primer is hybridized with poly(C) highlight to synthesize the second chain. | ployA+ | Full-length with weak 3′-biased. | NO | Good sequence coverage. Selective transcriptional isomers and SNV can be detected. | Non-chain-specific amplification, transcriptome bias, inefficient transcription of sequences. | [47] |
| SMART-seq2 | Two to five template-free C nucleotides are added to the 3′ end of the cDNA. Then template conversion TSO is added to produce locking nucleotide modification at the 3′ end. | ployA+ | Nearly full-length. | NO | No purification steps, transcript coverage is improved. | Non-chain-specific amplification, only sequencing poly(A)+ RNA, more expensive. | [48] |
| STRT-seq | By combining molecular markers with microfluidic techniques. | ployA+ | 5′ tag (TSS). | NO | High throughput, relatively cheap. | Low sensitivity, not suitable for analyses of variable splicing and allele expression. | [49,50] |
| SCRB-seq | The cDNA is obtained from single-cell mRNAs by using primers containing a barcode, UMI, ligand and oligonucleotide -dT, converted by template-dependent reverse transcriptase. | ployA | 3′ tag (UTR). | YES | 3 ‘chain information is preserved and enriched. | Low coverage rate, difficulty in detecting non-coding RNA. | [51] |
| Drop-seq | A droplet-based method in which each cDNA is labeled with a cell-specific barcode and UMI. | ployA+ | 3′ tag (UTR). | YES | Low-cost, rapid preparation library. | Requires microfluidic platforms, single-cell genes have low sensitivity. | [52] |
| In vitro transcription-based linear amplification | |||||||
| CEL-seq | cDNA is obtained by an oligonucleotide-dT primer-containing barcode, connector and T7 promoter. cDNA polymerizations of multiple samples are homogenized for IVT. | ployA+ | 3′ tag (UTR). | NO | Reduced inter-sample contamination, low read length bias, chain specificity. | Severe 3 ‘bias, the high-abundance transcript is preferentially amplified. | [53] |
| CEL-seq2 | UMI is introduced on the basis of CEL-seq, and the lengths of the barcode, connector and T7 promoter primers are shortened. | ployA+ | 3′ tag (UTR). | YES | Nucleic acid purification, reduced inter-sample contamination. | Severe 3 ‘bias. | [54] |
| MARS-seq | An automated, large-scale parallel RNA single-cell sequencing framework for sorting individual cells into 384-well plates based on FACS. | ployA+ | 3′ tag (UTR). | YES | Can strictly control amplification bias and marking error. | More expensive. | [55] |
| In Drops | It is very similar to Drop-Seq, but the hydrogel particles used In Drops also contain T7 RNA polymerase promoter. | ployA+ | 3′ tag (UTR). | YES | Low-cost, rapid library preparation. | Needs edmicrofluidic platform, the sensitivity of single-cell genes was low. | [56] |
| Methods | Principle | Classification | Advantages | Disadvantages | Ref. |
|---|---|---|---|---|---|
| scRRBC | High-throughput bisulfite-transformed DNA methylation sequencing method is applied to the single-cell level. | High throughput. | Detection of single bases covering CpG island at the single-cell level throughout the genome. | Easy to degrade the DNA purification process, high bias, low coverage. | [59] |
| scATAC-seq | Sequencing nucleosome DNA in a single cell based on microfluidics or FACS. | High throughput. | Achieves genome-wide open chromatin sequencing at the single-cell level. | Cell capture, lysis, transposition and PCR using microfluidic chips. | [60] |
| scCOOL-seq | The integration, optimization and enhancement of genome-wide nucleosome mapping, DNA methylation sequencing and genome-wide bisulfite sequencing. | High throughput. | Better covers whole genome, solves the problem of insufficient effective data due to the enrichment of mitochondrial fragments. | [61] | |
| CoBATCH | Protein A-TN5 is used to identify and cleat antibody-bound genomic regions and is used in conjunction with bar-coded single-cell technology. | High throughput. | Significantly improves the efficiency of chips, achieves high-throughput labeling of single cells. | [62] |
| Methods | Principle | Advantages | Ref. |
|---|---|---|---|
| PLAYR | Proteins and RNA labeled with different metal isotopes by antibodies and probes are measured by flow cytometry with mass spectrometry to analyze the proteomes and transcripts. | Low cost, detection cell number is large, more than 40 kinds of mRNA and protein can be detected. | [63] |
| CITE-seq | Oligonucleotide-labeled antibodies and short oligonucleotide-labeled magnetic beads are used to bind cell surface protein and cytoplasmic mRNA, respectively. RNA and antibody labels are amplified and separated by size for quantitative analyses of proteins and transcripts. | About 100 proteins and tens of thousands of RNA transcripts can be detected, but compared with PLAYR, the number of cells detected at a time is smaller. | [64] |
| REAP-seq | Similar to cite-Seq technology, oligonucleotide cross-linked antibodies are used to detect cellular protein and transcript levels based on sequencing technology. | [65] |
| Methods | Classification | Principle | Advantages | Ref. |
|---|---|---|---|---|
| DR-seq | Transcriptome and genome | Parallel sequencing of the genome and transcriptome, which amplifies DNA and RNA from lysate after single-cell lysate. | Reduces nucleic acid loss and cross-contamination. | [66] |
| G&T-seq | Biotinylated oligo-dT primers are used to capture RNA released by the lysis of a single cell, which is separated from DNA by streptavidin-coated magnetic beads. The RNA captured on the magnetic beads is amplified by Smart-seq2. The DNA is amplified by multiple displacement amplification. | Avoids cross-contamination. | [67] | |
| TARGET-seq | The single-cell lysate and the protease are inactivated at high temperature, then specific primers of cDNA and gDNA are added to the mixture, followed by reverse transcription and PCR. | Can achieve parallel, non-bias and high-sensitivity whole-transcriptome mutation analysis, which reduces the complexity of library construction. | [68,69] | |
| scM&T-seq | Transcriptome and epigenome | Based on G&T-seq technology, genomic DNA is treated with bisulfite to convert unmethylated cytosine to uracil, and then amplified and sequenced to determine methylated groups. | The relationship between single-cell DNA methylation heterogeneity and specific gene expression differences is provided. | [70] |
| SNARE-seq | The accessible genomic loci captured in the permeable nucleus by the Tn5 transposable enzyme were packaged in the same droplet as the mRNA from the single nucleus. Design “splint oligonucleotide” complements the 5 ‘-end transposition insertion sequence and ends with Ploy A, which is captured by the Ploy T bead. The captured mRNA and fragmented gDNA are released by heating the droplets. | Accessible nuclear chromatin and mRNA expression sequencing, enables more accurate identification of various cell types. | [71] | |
| scCAT-seq | After single-cell lysis, the nucleus and cytoplasm are separated. Reverse transcription of cytoplasmic components is performed based on Smart-seq2. The Tn5 transferase and vector-DNA-mediated experimental protocol are used to amplify endogenous DNA and vector DNA in two steps. | Chromatin accessibility and transcriptome within a single cell can be detected simultaneously to study their regulatory relationships and identify transcription factors. | [72] | |
| PLAYR | Transcriptome and proteome | A technique for high multiple quantification of transcripts in a single cell by flow cytometry and mass spectrometry, allowing simultaneous staining of standard protein antibodies. | More than 40 different mRNA and proteins can be quantitatively analyzed simultaneously. | [73] |
| scTrio-seq | Genome, DNA methylome, and transcriptome | The nucleus is separated by centrifugation, and the membrane is selectively cleaved to separate the mRNA in the cytoplasm from the genomic DNA in the intact nucleus. Genomic DNA is tested for methylation groups using modified sulfite treatment and sequencing methods. | Genomic copy number variation (CNV), DNA methylation and transcriptome of a single cell can be analyzed simultaneously. | [74] |
| scNMT-seq | Nucleosome, methylation and transcription | Based on scM&T-seq, physical separation of DNA and RNA is performed prior to the bisulfite conversion step. The transcriptome of the cells is analyzed using Smart-seq2 sequencing. Chromatin accessibility and DNA methylation are detected by nucleosome occupancy and methylation sequencing. | Combined analysis of transcriptome, methylation and chromatin accessibility. | [75] |
| Name | Classification | Core Algorithm | Main Goal/Function | Advantages | Ref. |
|---|---|---|---|---|---|
| TopHat | Comparison of data | Bowtie | Short RNA sequences above 75 bp in length are compared with the reference genome to find a match, and selective splicing of exons is performed. | Small memory, high accuracy, low error tolerance. | [78] |
| STAR | Maximal mappable prefix | Direct selection of discontinuous sequences for comparison. | Fast running speed. | [79] | |
| SCnorm | Data Standardization | Normalization of sequencing data using quantile regression. | Improved principal component analyses and identification of differentially expressed genes. | [80] | |
| Scran | PCA,SCE algorithm | Data sets are easily standardized and shared. | Suitable for a variety of sequencing methods, has a comprehensive function. | [81] | |
| Interpolation | AutoImpute | Finds missing values by learning the intrinsic distribution and patterns of scRNA-Seq data. | Interpolation of the largest data set without memory consumption. | [82] | |
| Correction of batch effects | Scanorama | Batch effect corrections using matched information. | Does not depend on the order of the data set, reducing the search time. | [83] | |
| Scater | PCA,t-SNE | Focuses on data quality control and data visualization, applicable for toscRNA-seq. | Provides a rich suite of plotting tools for single-cell data and a flexible data structure that is compatible with existing tools, allowing data sets to be easily standardized and shared and batch effects to be identified and removed. | [84] | |
| Scanpy | Dimensionality reduction | PCA,t-SNE,UMAP | Large data sets are available. Facilitates data exchange between different laboratories. | Comprehensive functions, supports UMAP dimension reduction. | [85] |
| Seurat | Cell subtype identification | PCA,t-SNE | Achieves unbiased identification of shared gene–gene correlations across data sets, as well as the alignment of canonical correlation vectors using nonlinear ‘warping’ algorithms. | Suitable for a variety of sequencing methods, comprehensive functions. | [86,87] |
| M3Drop | Michaelis-Menten model | Takes advantage of the prevalence of zeros (dropouts) in scRNA-Seq data to identify features. Sets of genes are often reduced through feature selection, only removing genes subject to technical noise. | Good data compatibility, suitable for all kinds of transcriptome sequencing data. | [88] | |
| Wishbone | Proposed time series analysis | PCA,t-SNE | Uses the top diffusion components to construct graphs, capturing the major geometric structures in the data, while removing small fluctuations likely resulting from measurement noise. | Bifurcating branches are used to identify single- cell trajectories. | [89] |
| Monocle | DBSCAN, Louvain algorithm | Expression levels into relative transcript counts, applicable toscRNA-seq. | The relative quantification can be done accurately without control experiments. | [90] |
| Name | Organism | Classification | Contents | Website | Ref. |
|---|---|---|---|---|---|
| HTCA | Human | Adult and fetal phenotype mapping multi-omics single-cell database. | Interactive database of 3000 scRNA-seq samples containing in-depth phenotypic profiles of 19 healthy adult and fetal tissues. | http://www.htcatlas.org (accessed on 22 November 2022). | [91] |
| TISCH | Human | Tumor Microenvironment Single-Cell Database. | A total of 2045746 cells from 79 data sets and 28 cancer types. | http://tisch.comp-genomics.org (accessed on 22 November 2022). | [92] |
| TEDD | Human, mouse, etc. | Single-cell transcriptome and chromatin accessibility database for tissue and organ development. | RNA sequencing data from 2760 samples from humans and multiple model animals, and 5.1 million single-cell sequencing data. | https://TEDD.obg.cuhk.edu.hk/ (accessed on 22 November 2022). | [93] |
| ABC portal | Human, mouse | Shared database of blood cells and immune cells. | A total of 198 sets of human and mouse blood, immune-related single-cell transcriptome data sets. | http://abc.sklehabc.com (accessed on 22 November 2022). | [94] |
| Cancer SCEM | Human | Tumor Single-Cell Database. | A total of 208 single-cell RNA-Seq data sets of 20 human tumors. | https://ngdc.cncb.ac.cn/cancerscem/index (accessed on 22 November 2022). | [95] |
| HCA | Human | Cell Mapping Database. | Single-cell data from laboratories around the world. | https://data.humancellatlas.org/ (accessed on 22 November 2022). | [96] |
| Jingle Bells | Human | Immune and non-immune cell database. | Classification of single-cell data into immune and non-immune categories based on the single-cell literature. | http://jinglebells.bgu.ac.il/ (accessed on 22 November 2022). | [97] |
| CancerSEA | Human | Tumor single-cell functional state mapping database. | Cancer Single-Cell State Atlas. | http://biocc.hrbmu.edu.cn/CancerSEA/ (accessed on 22 November 2022). | [98] |
| scTPA | Human, mouse | Single-cell gene expression database for pathway activation signature. | Single-Cell Transcriptome Biopathway Annotation Tool. | https://www.sctpa.ca/ (accessed on 22 November 2022). | [99] |
| PanglaoDB | Human, mouse | Annotated database of cell fractions. | 1368 sets of human and mouse single-cell transcriptome databases. | https://panglaodb.se/index.html (accessed on 22 November 2022). | [100] |
| CellMarkrer | Human, mouse | Database of cell marker information, tissue types, cell types, etc. | 13605 Marker genes in 158 human tissues and 467 cell types. | http://bio-bigdata.hrbmu.edu.cn/CellMarker/ (accessed on 22 November 2022). | |
| BloodSpot | Human, mouse | Blood Cell Database. | Single-cell transcriptome data for health and blood disorders. | http://servers.binf.ku.dk/bloodspot/ (accessed on 22 November 2022). | |
| scRNASeqDB | Human | Human Single-Cell Gene Expression Database. | Covers 200 cell lines and 14,000 samples. | https://bioinfo.uth.edu/scrnaseqdb/ (accessed on 22 November 2022). | [101] |
| Single Cell Portal | Human, chicken | Understanding how cells and subsets of cells aggregate the database. | Collection of 3.4 million cell species | https://singlecell.broadinstitute.org/single-cell (accessed on 18 November 2022). | [102] |
| Platforms | Introduction | Advantages | Disadvantages | Applications | Ref. |
|---|---|---|---|---|---|
| C1TM Single-Cell are automatically prepared system | Microfluidic technology is used to complete the whole process of cell capture, lysis, reverse transcription and pre-amplification on the same chip. | 96 single sperm cells can be captured simultaneously. | High cost, complex operation. | Applications in reproductive development, stem cell differentiation, validation of biomarkers and silenced gene expression with RNA interference. | [97] |
| ICELL8 Single-Cell System | The cells to be measured ware captured, and an 8-channel nozzle is used to spray nanoscale onto the porous nanoscale chip, so that all kinds of cells stay in a single hole on the chip. | The process is simple, more cells can be separated each time (500~1000). | Cell capture efficiency is only 30%. | Suitable single-cell full-length transcriptome study. | [103] |
| BD RhapsodyTM Single-Cell Analysis System | Based on microfluidic chip technology, single cells are captured on magnetic microspheres and specific molecular labels are attached to each transcript of single cells. | Libraries can prepare 100~10,000 single cells at a time; the detection range can be focused on target genes. | Libraries cannot be built for rare or unlabeled cells. | It can be applied to the analysis of cell and cell subsets’ expression characteristic clustering and marker screening. | [104] |
| Chromium TM System | Constructs a reagent delivery system to separate cells or nuclei; sequencing libraries are prepared in parallel so that all fragments produced by each droplet are labeled with a common molecular label. | A total of 80000 cells can be captured at one time; the capture rate of single sample cell is up to 65%. | Cell activity requirement is greater than 90%. | Suitable for genome assembly to obtain large fragments of genetic information. | [105,106,107] |
| split-pool ligation-based transcriptome sequencing (SPLiT-seq) | Cells do not need to be pre-isolated, and the cells themselves are seen as a natural isolation chamber for RNA. In each round of split pooling, fixed cells or nuclei are randomly distributed into wells to label individual transcriptome-specific barcodes. | Transcriptional analysis of hundreds of thousands of fixed cells or nuclei in a single experiment. | Sequencing costs can be high. | Identifies gene expression changes associated with the pathogenesis of complex diseases, such as Parkinson’s disease or cancer. | [108,109] |
| 10X Geneomics | The single-cell suspension and labeled gel beads are encapsulated in droplets through a microfluidic chip for reverse transcription reaction, and the single-cell cDNA library is constructed and sequenced, then through data analysis, the mRNA sequence is identified | High cell-capture efficiency, fast cycle time, low cost and easy to operate. | Only the 3′ end is sequenced, and the coverage is relatively low. | It is used in research fields, such as Human Cell Atlas construction, development, immunity and disease. | [110,111] |
| Research Content | Method | Periodical and Year | IF | Ref. |
|---|---|---|---|---|
| Insights into Gonadal Sex Differentiation Provided in the Chicken Embryo | scRNA-seq | Cell Reports, 2020 | 8.109 | [114] |
| Developing chicken limb | scRNA-seq | BMC Genomics, 2019 | 3.594 | [115] |
| Early to late four-chambered heart stage development. | Spatiotemporal sigle-cell RNA sequencing | Nature communications, 2021 | 12.12 | [116] |
| Bird’s-Eye View on Vertebrate Pituitary | scRNA-seq | Front Physiol, 2021, | 4.566 | [117] |
| Cell atlas of the chicken retina | scRNA-seq | Elife, 2021 | 8.146 | [118] |
| Alternative Splicing Events during Chicken Male Germ-Line Stem Cell Differentiation. | scRNA-seq | Animals, 2021 | 2.852 | [119] |
| Identification of diverse cell populations in skeletal muscles and biomarkers for intramuscular fat | scRNA-seq | BMC Genomics, 2020 | 3.594 | [120] |
| Preadipocytes reveals induced by melatonin the cell fate heterogeneity. | scRNA-seq | Journal of Pineal Research, 2021 | 14.528 | [121] |
| Chicken peripheral blood lymphocyte response to ALV-J infection assessed | scRNA-seq | Front Microbol, 2022 | -- | [122] |
| Changes in expression during hair-cell development | Single-cell proteomics | Elife, 2019 | 8.146 | [123] |
| Single-cell sequencing of the bursa of Fabricius highlights the IBDV infection mechanism in chickens | scRNA-seq | Cell Bioscience, 2021 | 9.072 | [124] |
| Dying hair cells in the avian cochlea | scRNA-seq | Cell Reports, 2021 | 8.109 | [125] |
Publisher’s Note: MDPI stays neutral with regard to jurisdictional claims in published maps and institutional affiliations. |
© 2022 by the authors. Licensee MDPI, Basel, Switzerland. This article is an open access article distributed under the terms and conditions of the Creative Commons Attribution (CC BY) license (https://creativecommons.org/licenses/by/4.0/).
Share and Cite
Liu, Y.; Liang, S.; Wang, B.; Zhao, J.; Zi, X.; Yan, S.; Dou, T.; Jia, J.; Wang, K.; Ge, C. Advances in Single-Cell Sequencing Technology and Its Application in Poultry Science. Genes 2022, 13, 2211. https://doi.org/10.3390/genes13122211
Liu Y, Liang S, Wang B, Zhao J, Zi X, Yan S, Dou T, Jia J, Wang K, Ge C. Advances in Single-Cell Sequencing Technology and Its Application in Poultry Science. Genes. 2022; 13(12):2211. https://doi.org/10.3390/genes13122211
Chicago/Turabian StyleLiu, Yong, Shuangmin Liang, Bo Wang, Jinbo Zhao, Xiannian Zi, Shixiong Yan, Tengfei Dou, Junjing Jia, Kun Wang, and Changrong Ge. 2022. "Advances in Single-Cell Sequencing Technology and Its Application in Poultry Science" Genes 13, no. 12: 2211. https://doi.org/10.3390/genes13122211
APA StyleLiu, Y., Liang, S., Wang, B., Zhao, J., Zi, X., Yan, S., Dou, T., Jia, J., Wang, K., & Ge, C. (2022). Advances in Single-Cell Sequencing Technology and Its Application in Poultry Science. Genes, 13(12), 2211. https://doi.org/10.3390/genes13122211