Article

Full Mitochondrial Genomes Reveal Species Differences between the Venerid Clams Ruditapes philippinarum and R. variegatus

1
College of Fisheries and Life Science, Dalian Ocean University, Dalian 116023, China
2
Engineering Research Center of Shellfish Culture and Breeding in Liaoning Province, Dalian 116023, China
3
School of Marine Science and Environmental Technology, Dalian Ocean University, Dalian 116023, China
*
Authors to whom correspondence should be addressed.
Genes 2022, 13(11), 2157; https://doi.org/10.3390/genes13112157
Submission received: 19 October 2022 / Revised: 10 November 2022 / Accepted: 12 November 2022 / Published: 19 November 2022
(This article belongs to the Special Issue Genetic Breeding and Genomics of Marine Shellfish)

Abstract

:
In natural sea areas along the coast of China, venerid clams Ruditapes philippinarum and R. variegatus exhibit similar adult shell forms and are especially difficult to distinguish as spat and juveniles. This study used comparative mitochondrial genome analysis to reveal differences between these species. The results showed that: (1) the mitochondrial genomes of R. philippinarum and R. variegatus share a large number of similar gene clusters arranged in consistent order, yet they also display noncommon genes, with both gene rearrangements and random losses found; (2) the 13 protein-coding genes in R. philippinarum as well as two-fold and four-fold degenerate sites in R. variegatus have an evident AT bias; (3) the Ka/Ks ratio of the mitochondrial ATP8 gene was significantly higher in R. philippinarum than in R. variegatus, and an analysis of selection pressure revealed that the mitochondrial NADH dehydrogenase subunit 2 gene and NADH dehydrogenase subunit 6 gene of R. variegatus were under great selective pressure during its evolution; and finally, (4) the two species clustered into one branch on a phylogenetic tree, further affirming their phylogenetic closeness. Based on these results, we speculate that the species differences between R. variegatus and R. philippinarum are largely attributable to adaptive evolution to the environment. The present findings provide a reference for the development of germplasm identification.

1. Introduction

The economically important Manilla clam Ruditapes philippinarum has a wide distribution in coastal waters of the Indo-Pacific, including along the northern and southern coasts of China, such as the Liaoning, Hebei, Guangdong, and Fujian provinces. The species is cultured worldwide, and its annual production exceeds 3 million tons in China, where it is one of the four most farmed bivalve species and is the highest yielding, accounting for 22% of the output of shellfish culture [1]. The variegated carpet shell Ruditapes variegatus likewise has an Indo-Pacific distribution, but with less natural production; in China it occurs mainly along the south coast, notably in Pingtan County in Fujian Province [1] (Figure 1). Both species are found in natural seawater areas in Guangdong Province, and they are difficult to distinguish based on the external appearance of their shell, as well as at the spat and juvenile stages. Therefore, these species require study through the help of molecular markers to clarify whether this phenomenon is a result of gene introgression or natural hybrid progeny.
Mitochondrial DNA (mtDNA) is widely used in aquatic animal classification and species identification. Several studies have demonstrated that mitochondria can simultaneously regulate the death of cells and sense and respond to extracellular and intracellular signals and pressures [2,3,4,5,6,7,8,9,10,11]. Mitochondria are the ‘power station’ of the cell and provide energy through peroxidative phosphorylation, as well as the capacity for aerobic respiration in cells. Mitochondria are able to regulate cell death, act as energy sensors, and can respond to extracellular and intracellular signals and stresses. Most animal mtDNA is a closed circular double-stranded DNA molecule consisting of 13 protein-coding genes (PCGs), 22 tRNA genes, two rRNA genes, and one or two non-coding regions (Boore, 1999). mtDNA is characterized by small molecular weight, high energy content, simple structure, fast evolution, and maternal inheritance [12,13], highly conservative gene sequences [12], and high variability of gene order [14].
To date, reports on the mitochondrial genomes of aquatic animals have focused mainly on: (1) phylogenetic analyses, including relationship reconstructions; (2) between-species comparisons, such as through analysis of conserved gene clusters and determinations of the evolutionary conservation of species; (3) the phenomenon of gene rearrangements; (4) the mechanisms of tandem duplications; and (5) analyses of evolutionary selection pressures [14,15,16,17,18,19,20,21,22,23,24,25]. For instance, Tang et al. confirmed the status of the crab Helicana wuana (in the family Varunidae of subsection Thoracotremata) by analyzing the basic characteristics, gene arrangement, and phylogenetic inference of the mitochondrial genes [12]. Liu et al. compared structural characteristics of the mitochondrial genome and gene sequences among 16 bivalve species and found that the mitochondrial gene sequences were not obvious and their structures varied [26]. Iannelli et al. confirmed interspecific relationships in ascids by comparing mitochondrial genomes [13]. Sun et al. analyzed complete mitochondria from two species of Arcidae, Trisidos kiyoni and Potiarca pilula, and identified complex gene rearrangements in the mitochondrial genome as a key character in inferring the higher-level phylogenetic relationship of the Arcidae [27]. A recent study has shown that Ruditapes philippinarum and R. variegatus may belong to different genera, but a fully revised classification will require considerable additional genomic and morphological data from a wide sample of species and genera (Liu et al., 2022). In this study, we conducted a comparative analysis of the mitochondrial genomes of the two species to better differentiate them. This included assembly of the whole mitochondrial genome, as well as analyses of the gene content, repetitive sequences, gene arrangements, codon selection preferences, and selection pressure. Comparative analyses to determine differences between two mitochondrial genomes in the process of species differentiation accompanied by phylogenetic analysis can provide a basis for molecular species identification and the protection of genetic diversity and shellfish germplasm genetic resources for aquaculture.

2. Materials and Methods

2.1. Material Collection

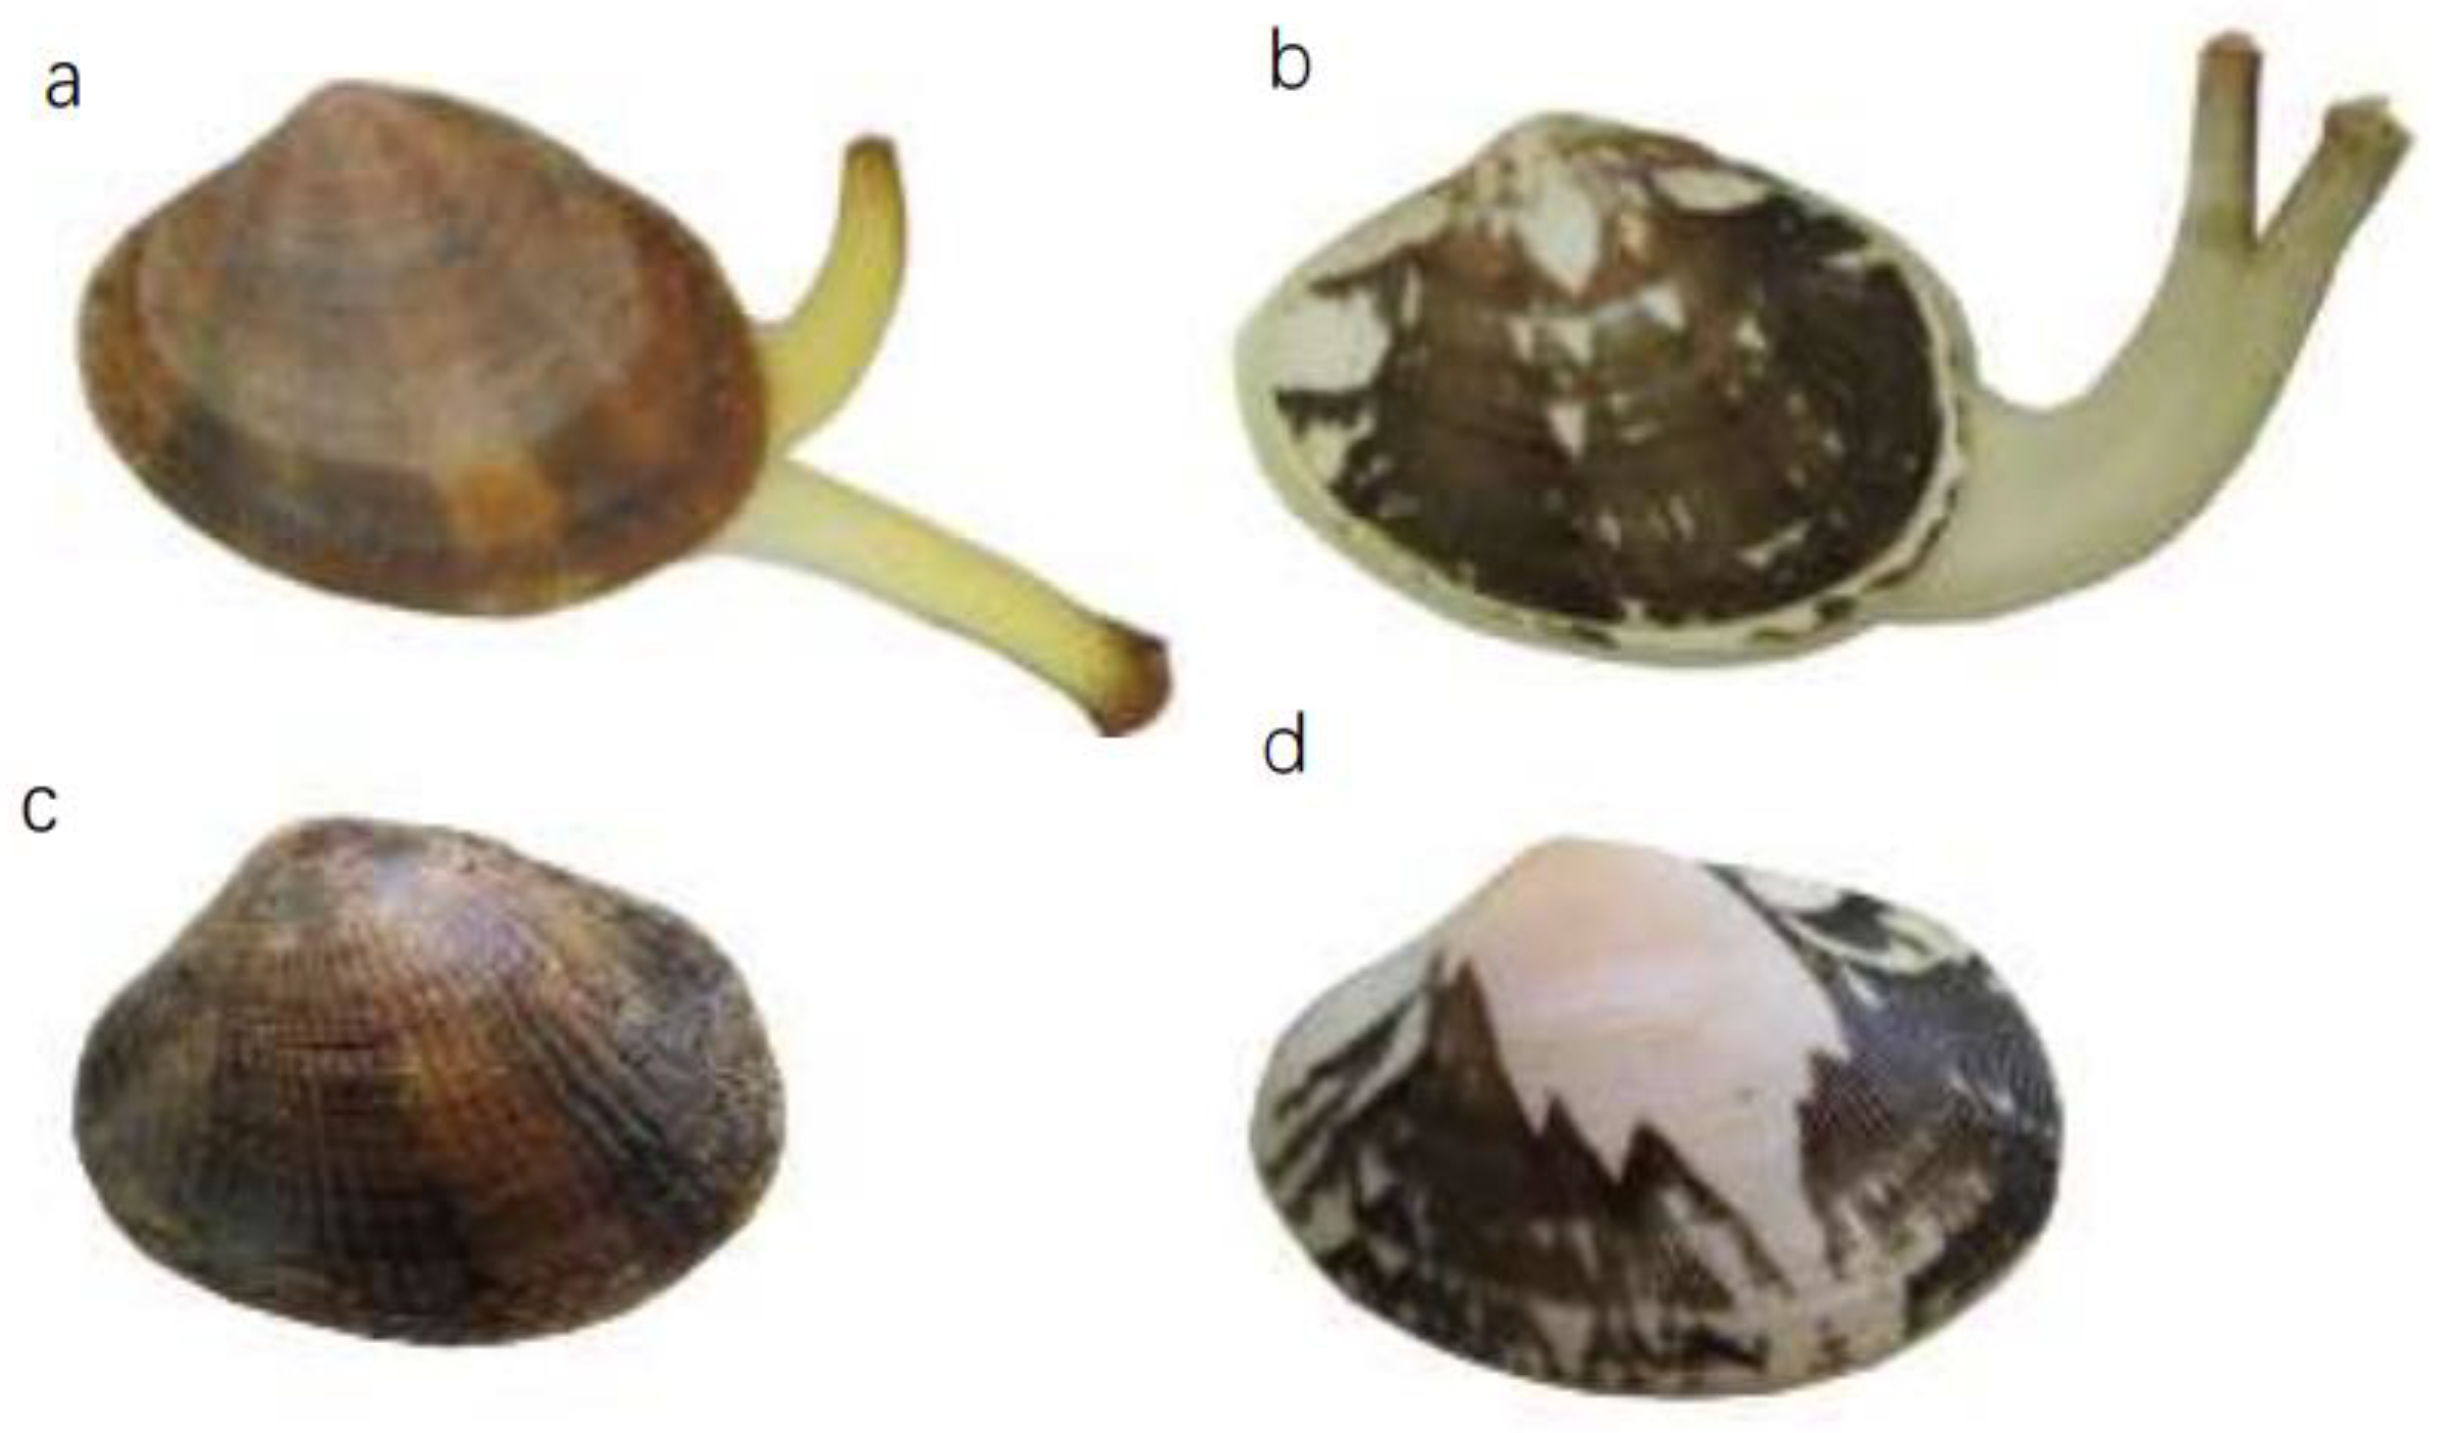
Specimens of R. philippinarum and R. variegatus were collected in Zhanjiang, Guangdong Province, China. The collected animals were transported to the laboratory of the Liaoning Engineering Research Center of Dalian Ocean University. The clams were temporarily maintained for one week in seawater with a temperature of 17 °C, salinity of 30 ppt, and pH 7.76–8.5, and were fed Chlorella. During this time, the degree of separation between the clams’ incurrent and excurrent siphons was observed to facilitate sorting of the two species to ensure the accuracy of the experimental material. In R. variegatus, the tubes appear completely separated at the base (Figure 2a), whereas in R. philippinarum the tubes are separated a short distance from the distal end (Figure 2b). The radial ribs of R. philippinarum are raised, thin, and closely spaced, and number approximately 90–100 (Figure 2c), while those of R. variegatus are more flattened and number approximately 50–70 (Figure 2d). Measures of shell length, shell width, shell height, soft-tissue dry weight, and hypertrophy in R. variegatus and R. philippinarum are given in Table 1. The values of the measured phenotypic traits did not differ significantly between species (p < 0.05).

2.2. Mitochondrial Genome Sequencing, Assembly, and Analysis

2.2.1. PCR Amplification and Sequencing

One specimen each of R. variegatus and R. philippinarum was selected as the experimental sample for total DNA extraction (using tissue of the dissected foot) with a Marine Animals DNA Extraction Kit (Shenzhen Huitong Biotechnology Co., Ltd., Shenzhen, China). The PCR amplification system was a 10-µL La-Taq system with the following reaction conditions: 0.1 µL of La-Taq, 0.5 µL of template DNA, 0.5 µL of each the forward and reverse primers, 1 µL of buffer, 1.6 µL of dNTPs, and 5.8 µL of ddH2O. The specific reaction steps were initial denaturation for 5 min at 94 °C, followed by 35 cycles of 5 min denaturation at 94 °C, annealing for 30 s at 50 °C and extension for 1 min at 72 °C, with the three steps repeated 35 times, and the final extension step carried out at 72 °C for 7 min. The PCR products were detected by agarose gel electrophoresis. The PCR amplification products were used as the samples for mitochondrial genome sequencing.
Sequencing of the total DNA sample was performed with Illumina next-generation sequencing technology. After build the Illumina paired-end DNA libraries, the raw image data obtained from Illumina HiSeq sequencing were transformed into sequence data after base calling. Raw sequencing data was uploaded to the NCBI (Ruditapes philippinarum Raw sequence reads, PRJNA896365; Ruditapes variegatus Raw sequence reads, PRJNA896706). Next, paired-end sequencing of the sample DNA used Illumina HiSeq sequencing to make the subsequent assembly more accurate, with shearing of the low-quality data in the raw sequencing data. Next, quality control (QC) of the sequencing data was performed with NGS QC software; the QC scores did not indicate low-quality read lengths.

2.2.2. Sequence Splicing and Gene Annotations

Gene sequence splicing was preliminary clean data on QC using SPAdes 3.9.0 to splice out all the scaffold that could be spelled out in the clean data. Next, blastn and exonerate alignment were performed using published data on the near-source organelle genome and sequences of the protein-encoding genes (PCGs) as a reference. The matching scaffold genes were then picked out; the coverage obtained after splicing was also ordered, and fragments that were clearly not the target genome were removed. The collected fragmented target sequences were used to extend and merge the splicing with PRICE and MITObim. The results of iterative splicing were data mapped against the original sequencing read lengths using bowtie2, and pairwise reads on the match were then singled out and restitched using the software SPAdes. Finally, the formed circular genome was extracted.
Genome annotations include the annotation of PCGs, RNA annotation, and structural annotation. PCG annotation was performed to confirm gene sequences and boundaries through blastn alignment of protein and protein-coding sequences from near-source species. The UGENE Open Reading Frames (ORFs) finder was then used. The Invertebrate Mitochondrial Code table was selected for sequence ORF prediction, and the predicted ORF was aligned using blastp to the nr database to annotate its function. The rRNA annotations were submitted to the RNAmmer 1.2 server (http://www.cbs.dtu.dk/services/RNAmmer, accessed on 15 November 2022.) for sequence prediction, supplemented by an orthologous sequence alignment, to correct for the boundary range. After sequence annotation, the Sequin software tool was used for structure annotation to submit the edited file to OGDRAW, which converts annotations in the GenBank format to graphical maps.

2.2.3. Analysis of Selective Pressure on the PCGs

To reflect the selective pressure on the PCGs of R. philippinarum versus R. variegatus during natural evolution, we selected two other venerid species, Antigona lamellaris and Paratapes textilis, as reference species based on the results of phylogenetic analysis. The advantage is that comparative analysis of selection pressure using species that differ in proximity and distance allows a more accurate search for PCGs in two similar species in which mitochondrial genetic variation rapidly aggregates. We calculated the ratio of the nonsynonymous substitution rate (Ka) to the synonymous substitution rate (Ks) of each PCG in R. philippinarum, R. variegatus, A. lamellaris, and P. textilis (i.e., R. philippinarum vs. R. variegatus; R. philippinarum vs. A. lamellaris; R. philippinarum vs. P. textilis; R. variegatus vs. R. philippinarum; R. variegatus vs. A. lamellaris; and R. variegatus vs. P. textilis). We speculated that in the natural evolution of R. philippinarum and R. variegatus, natural selection will act on the orientation and size of the PCGs in the target species. Sequences were aligned and formatted using the default parameters of ClustalW 2.1 and ParaAT2.0, respectively. The values of Ka, Ks, and the Ka/Ks ratio were calculated with the YN method of the KaKs_Calculator 2.0 software package (wangdp, Britain (UK)/GMT, https://sourceforge.net/projects/kakscalculator2/, accessed on 15 November 2022); the invertebrate mitochondrial code was selected as the reference genetic codes; and Fisher’s exact tests were performed to verify the validity of the Ka and Ks values [28,29].

2.2.4. Phylogenetic Analysis

To accurately determine the position of R. philippinarum in a phylogeny with R. variegatus, the whole-genome nucleotide sequences of 24 mollusk species were downloaded from GenBank (https://www.ncbi.nlm, accessed on 12 October 2021). These included species of Vesicomyidae (4 species), Mactridae (4 species), Veneridae (14 species), Sepiidae (1 species), and Ostreidae (1 species), with the Sepiidae and Ostreidae representing exogenous populations. Gene-length information and GenBank accession numbers by species are listed in Table 2. The whole-genome length of the mitochondrial DNA is approximately 15,000–22,000 bp. A phylogenetic tree was constructed for R. philippinarum and R. variegatus using the maximum-likelihood method and the whole-mitochondrial DNA genome sequences of the 24 downloaded mollusk species, with a bootstrap test value set to 1000.

3. Results

3.1. Mitochondrial Genome Features of R. variegatus and R. philippinarum

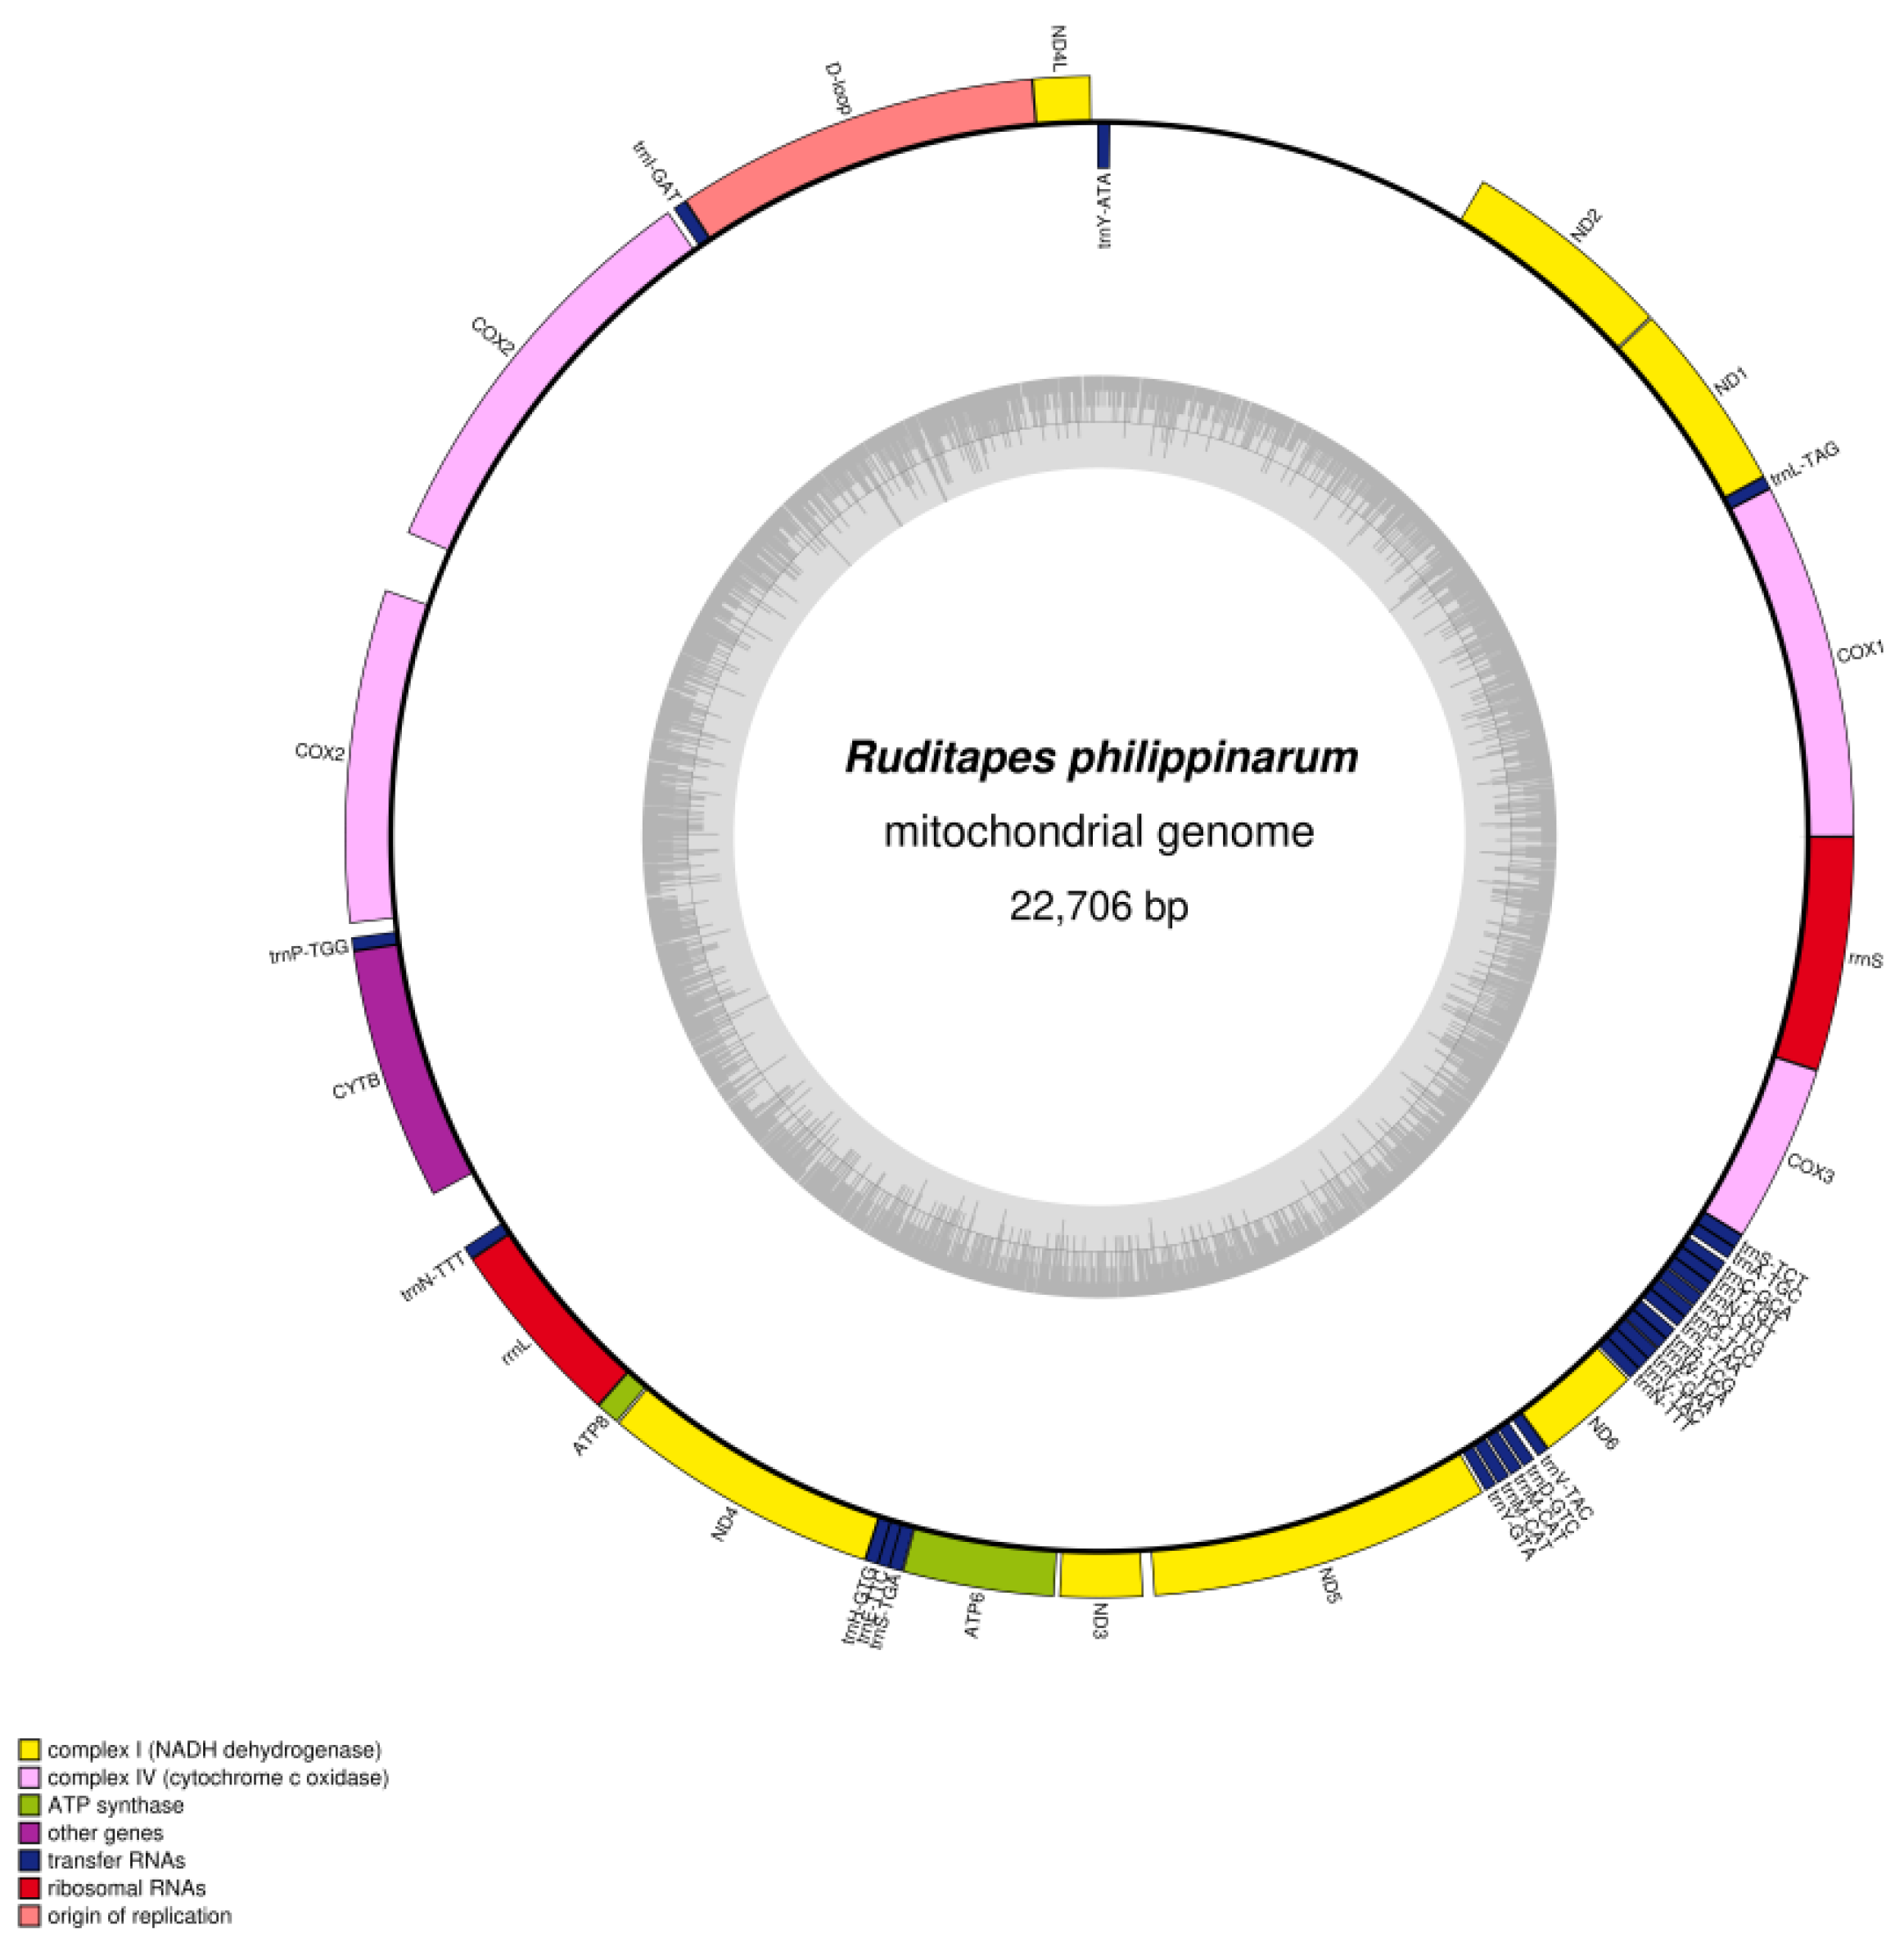
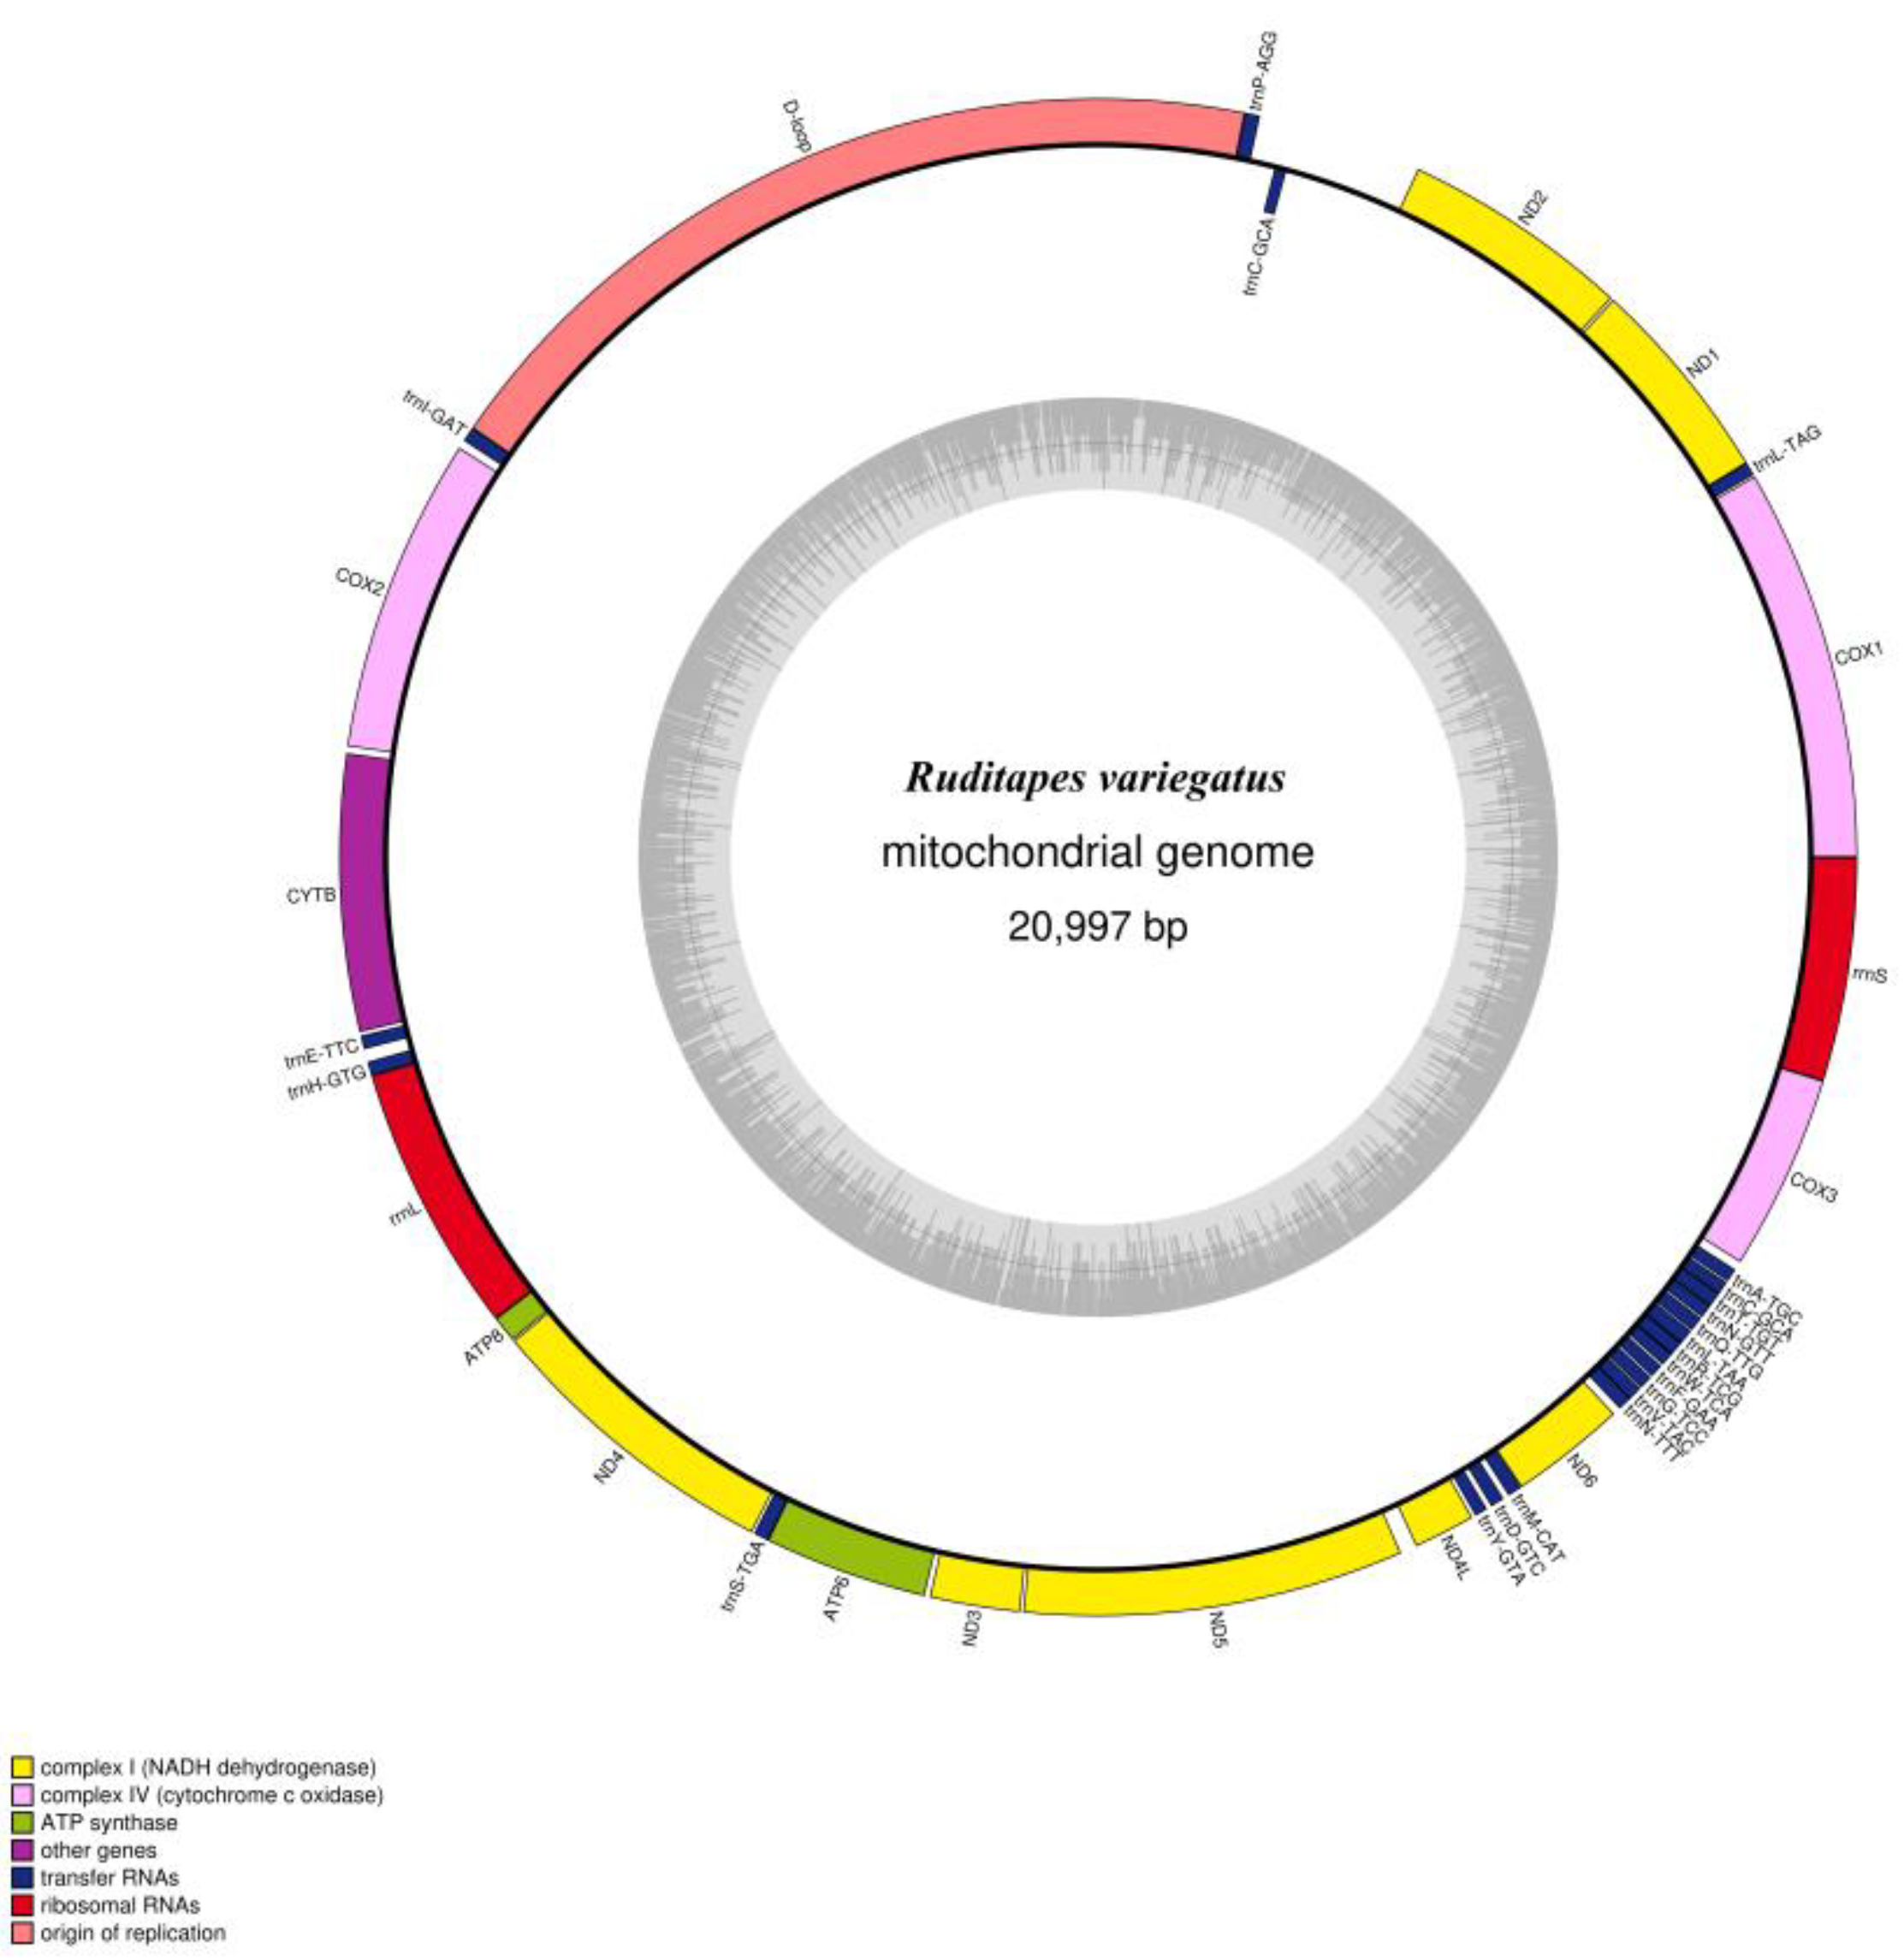
We determined the whole mitochondrial genome sequences of R. philippinarum and R. variegatus. The nucleotide sequences were uploaded to GenBank (https://www.ncbi.nlm.nih.gov/genome, accessed on 15 November 2022), with accession numbers MZ675529 and MZ675530 for R. philippinarum and R. variegatus, respectively. The mitochondrial genome of R. philippinarum is 22,706 bp, and R. variegatus is 20,997 bp; circular maps of the mitochondrial whole genome structure and loop annotations are presented in Figure 3 and Figure 4.
The total genome-wide GC content of R. philippinarum was 30.3%, and the composition of the whole mitochondrial nucleotide genes was A 30.2%, C 9.8%, G 20.5%, and T 39.6%, with an AT bias. Similar to the metazoan mitochondrial genome, the whole mitochondrial genome in R. philippinarum consists of 42 unique coding genes, comprising 14 PCGs, 26 tRNA genes, 2 rRNA genes, and 1 D-loop control region (Table 3). Furthermore, the genes were found to contain duplicates of the COX2, trnM-CAT, trnN-GTT, and trnV-TAC genes. In R. philippinarum the total length of the PCGs was 14,454 bp, representing 63.66% of the entire mitochondrial genome; the D-loop region represented 7.83%; and the tRNA and rRNA contents were 7.42% and 9.05%, respectively (Table 4).
The total genome length of the mitochondria of R. variegatus was 20,997 bp, with a total GC content of 36.4%, and other nucleotide content of A 28.1%, C 10.7%, G 25.7%, and T 35.5% (Table 5). The whole mitochondrial genome of R. variegatus consists of 37 unique encoding genes, comprising 13 PCGs, 22 tRNA genes, and 2 rRNA genes. The D-loop region, consisting of 18.53% of the entire mitochondrial genome length and 3892 bp, is the starting point of replication (Table 6). Only the trnC-GCA gene was duplicated, and the total length of the PCGs was 12,378 bp, accounting for 59% of the total genome length of the mitochondria in R. variegatus, and the tRNA and rRNA contents were 6.7% and 10.5%, respectively.
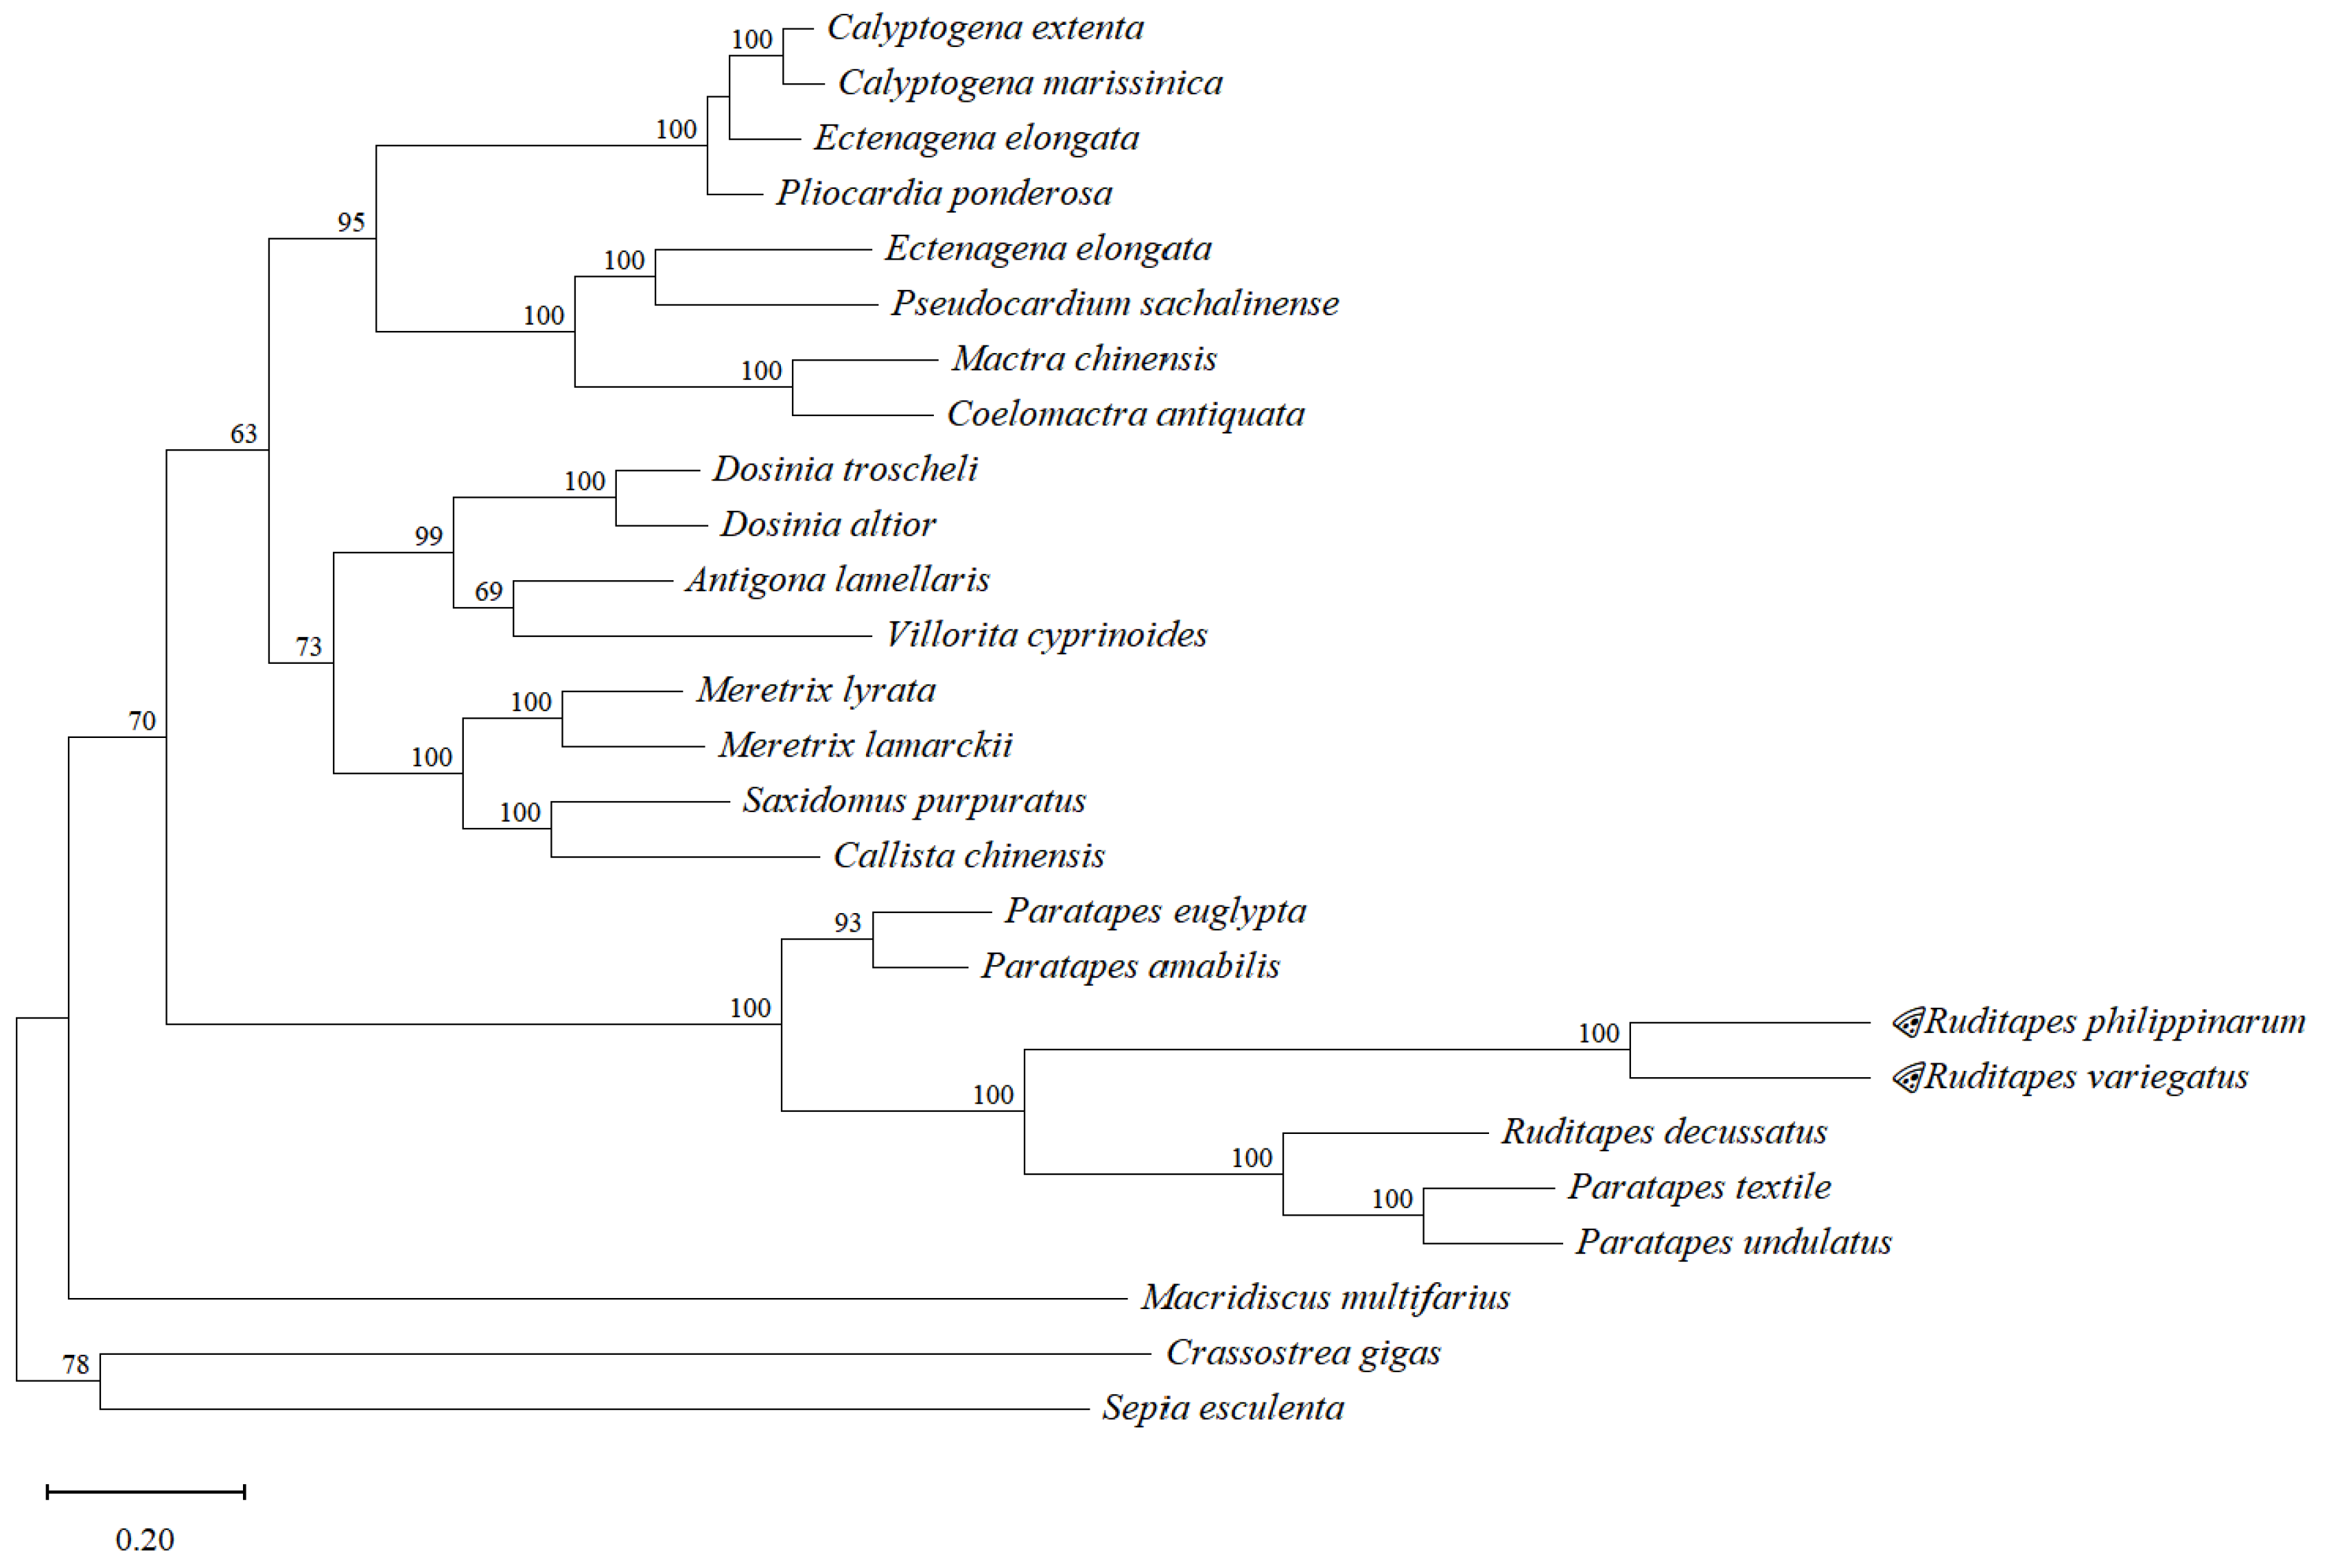
Phylogenetic trees constructed using genome data are more in line with traditional taxonomies based on morphological characters (Figure 5); however, in evolutionary trees constructed based on PCGs, individual species can differ from their traditional taxonomic status. We performed the phylogenetic tree construction through the mitochondrial genome-wide and tandem protein-encoding genomes of R. philippinarum and R. variegatus. The results showed that the phylogenetic trees constructed using genome-wide associations were consistent with the traditional morphological taxonomies (Figure 5: only the evolutionary trees constructed using the whole genome were shown). Overall, the phylogenetic tree branched into four subclades. The species of Vesicomyidae, Mactridae, and Veneridae clustered into the first large clade; R. philippinarum and R. variegatus clustered with the species of Veneridae into a second subclade; Crassostrea gigas of family Ostreidae clustered with Sepia esculenta of family Sepiidae; and Macridiscus multifarius of family Veneridae clustered alone as a subclade. As exogenous populations, Crassostrea gigas with Sepia esculenta together diverged as the outermost branch. On the whole, the representatives of the Veneridae split into three parts. Both the PCGs and the genome-wide constructed evolutionary trees support R. philippinarum and R. variegatus individually on the developmental tree, and these species are evolutionarily close to the polyclad genus Paphia. The phylogenetic tree constructed by this method is consistent with the species’ traditional taxonomic status, which further affirms the accuracy of the evolutionary tree classification.

3.2. Comparison of Gene Order in R. philippinarum and R. variegatus

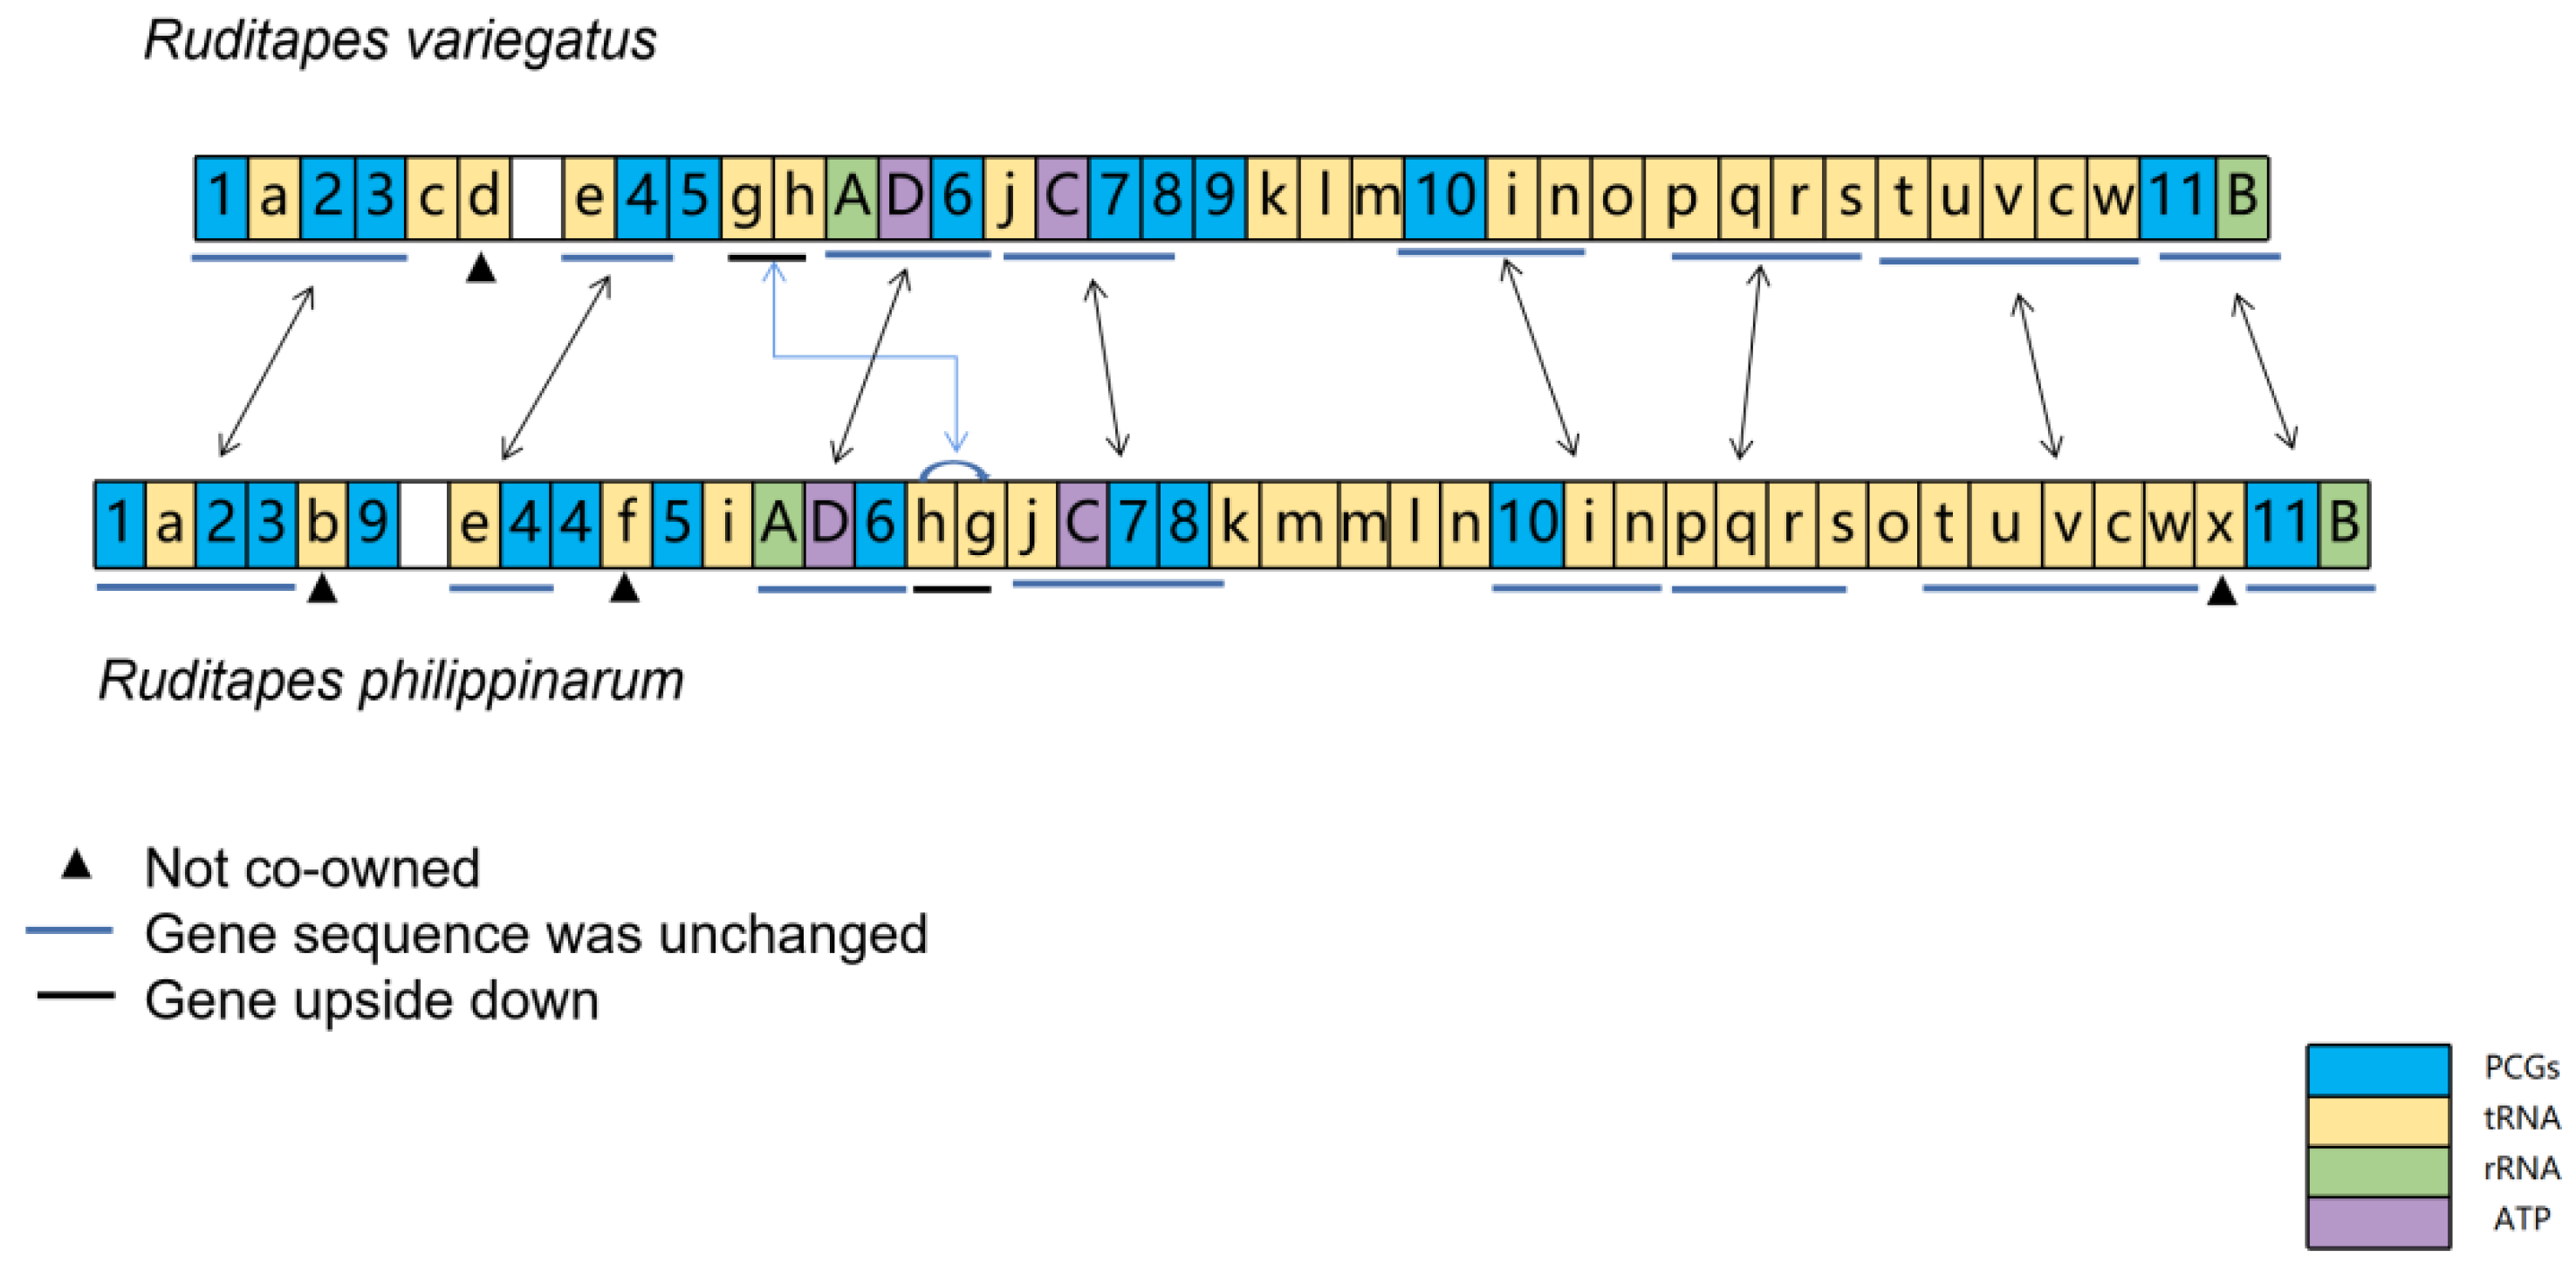
The comparative sequence of mitochondrial genes between R. philippinarum and R. variegatus shows high gene sequence similarity (Figure 6); their mitochondrial DNA share eight identical gene clusters, namely 1-a-2-3, e-4, A-D-6, C-7-8, 10-i-n, p-q-r-s, t-u-v-c-w, and 11-B (short blue lines). Moreover, the sequential order of these eight gene clusters is consistent in the mitochondrial genomes of R. philippinarum and R. variegatus, and no gene separation occurred during evolution. The highly similar order of mitochondrial genes indicates that R. philippinarum and R. variegatus are phylogenetically close, affirming the result that R. philippinarum and R. variegatus have phylogenetic proximity. Second, the gene cluster g-h of R. philippinarum and R. variegatus are mutually reversed in the arrangement; the gene trnP-AGG in R. variegatus was not found in R. philippinarum; and the genes trnY-ATA, trnP-TGG, and trnS-TCT in R. philippinarum mitochondria were absent in R. variegatus.

3.3. Analysis of Codon Usage Patterns of the PCGs

Table 7 presents basic information about the correlation between the initiation codons and gene lengths of the mitochondrial PCGs of R. philippinarum and R. variegatus. The genome of R. philippinarum contains 14 PCGs, all located on the heavy chain, and the gene COX2 contains two replicates. The start codons are ATN, GTG or GTG, where gene ND3 takes GTG as the start codon, and genes ND5 and ND6 take TTG as the start codon, and the stop codon is the typical ATG or TAA, where ATG is the start methionine codon. Ruditapes variegatus contains 13 PCGs, all of which are likewise located on the heavy chain; the start codons are GTG, ATG, TTG or ATT, with most using ATG as the start codon, but with genes COX1 and ND5 using GTG as the start codon, genes COX2 and ATP8 using TTG as the start codon, and with ATG and TAA as the stop codons.
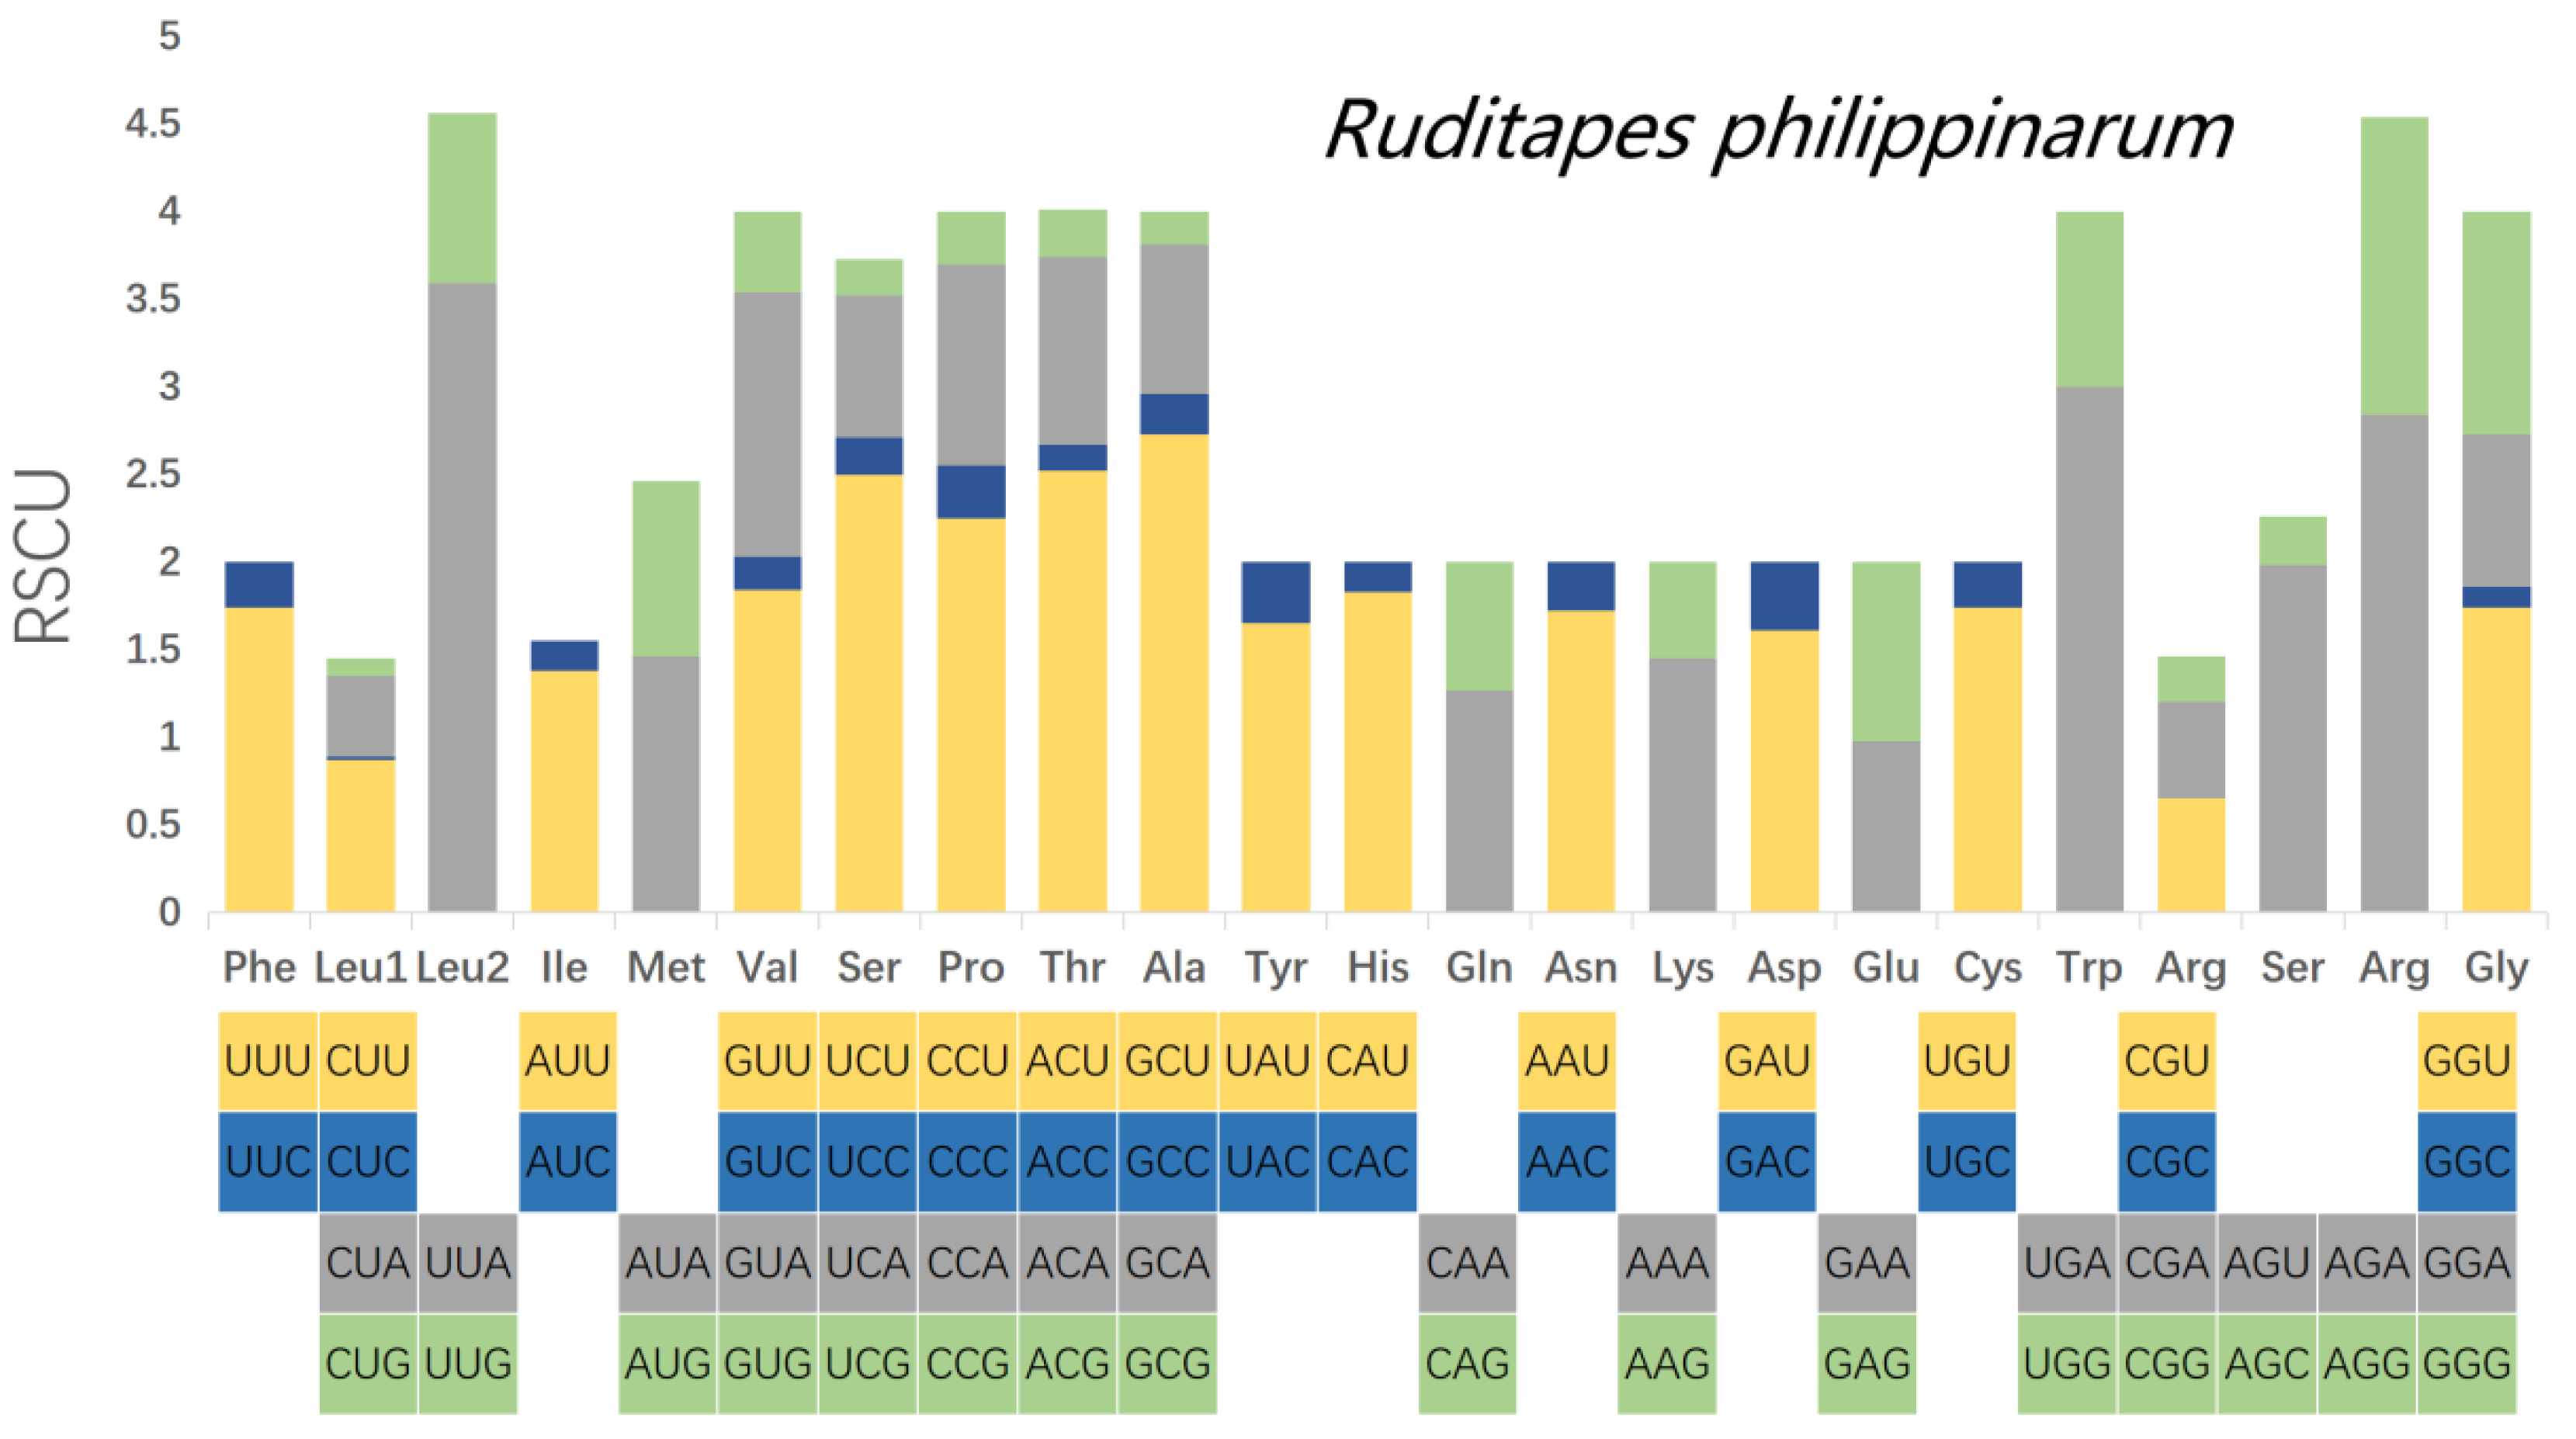
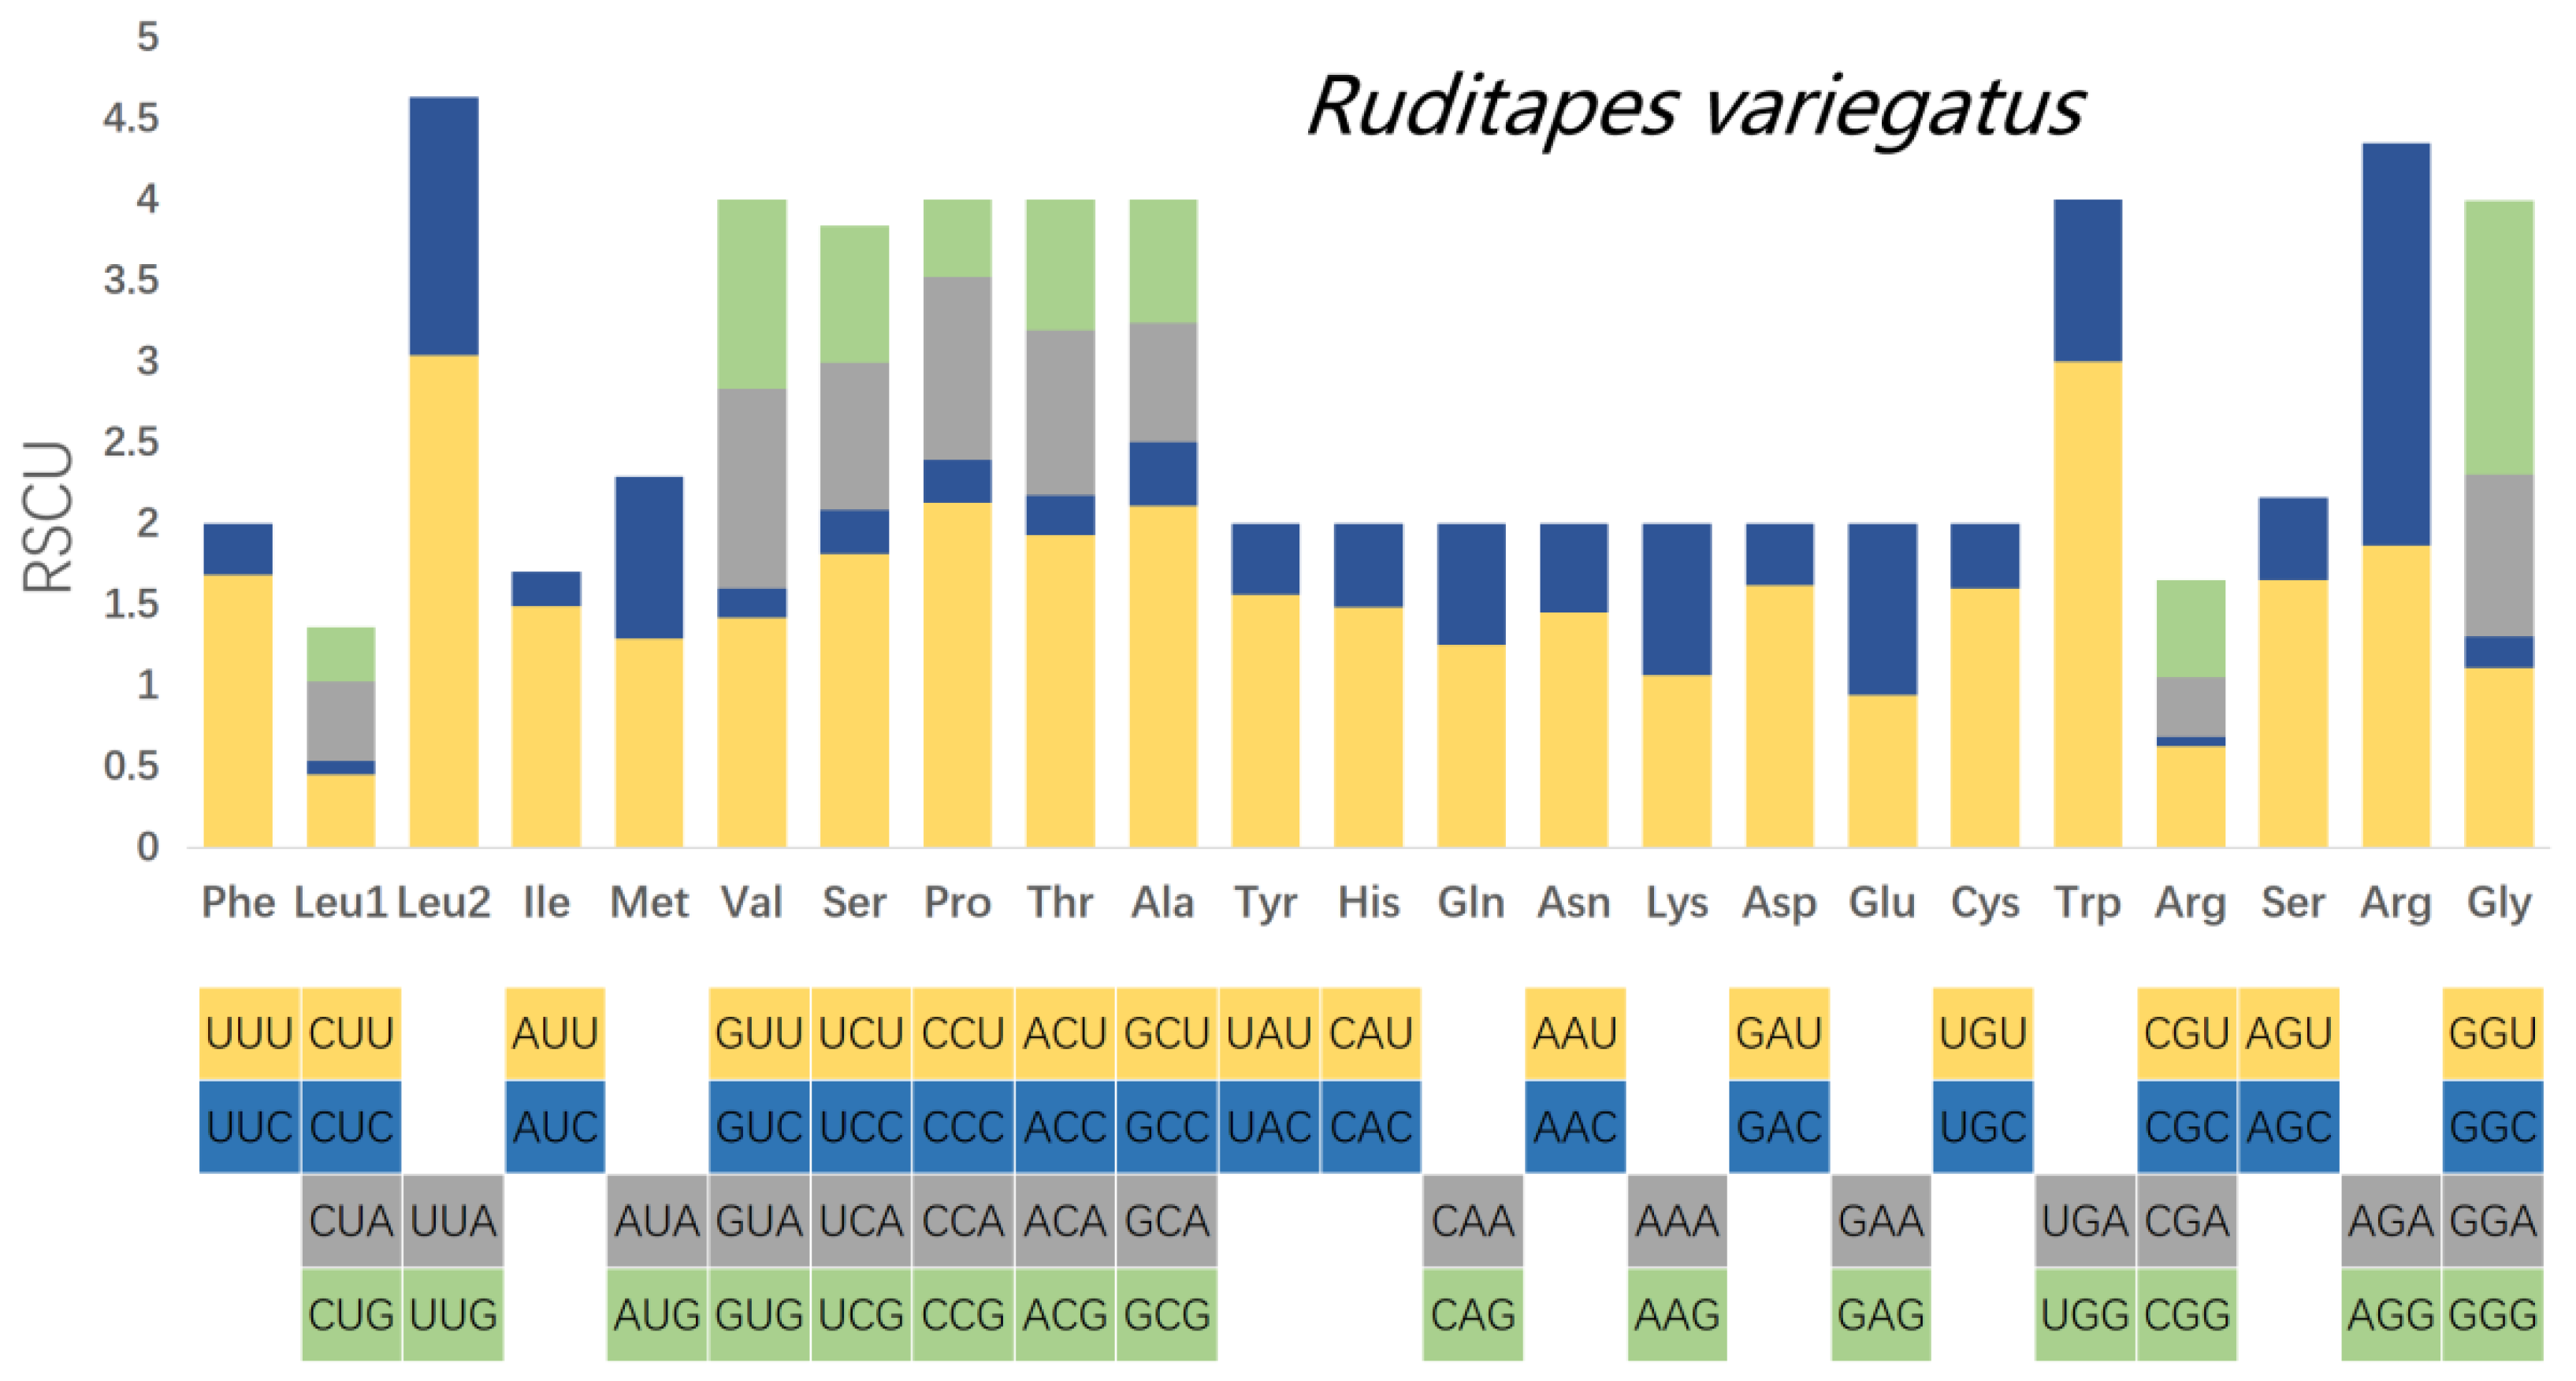
Relative synonymous codon usage (RSCU) was calculated for the mitochondrial PCGs of R. philippinarum and R. variegatus, as it is generally believed that similar species will have similar codon usage frequencies. Comparative analysis of RSCU values for white matter encoding genes in R. philippinarum and R. variegatus are summarized in Table 8 and Figure 7 and Figure 8. Excluding the stop codons, the PCGs of R. philippinarum consisted of 5189 codons, and the PCGs of R. variegatus consisted of 4081 codons. Both 2-fold and 4-fold degenerates have significant AT bias, as shown in Figure 7 and Figure 8 (orange and gray). Codon usage analysis indicated that leucine (Leu) and arginine (Arg) are the most commonly used amino acid residues, and isoleucine (IIe) is the least used amino acid residue.

3.4. Codon-Based Analysis of Selective Pressure

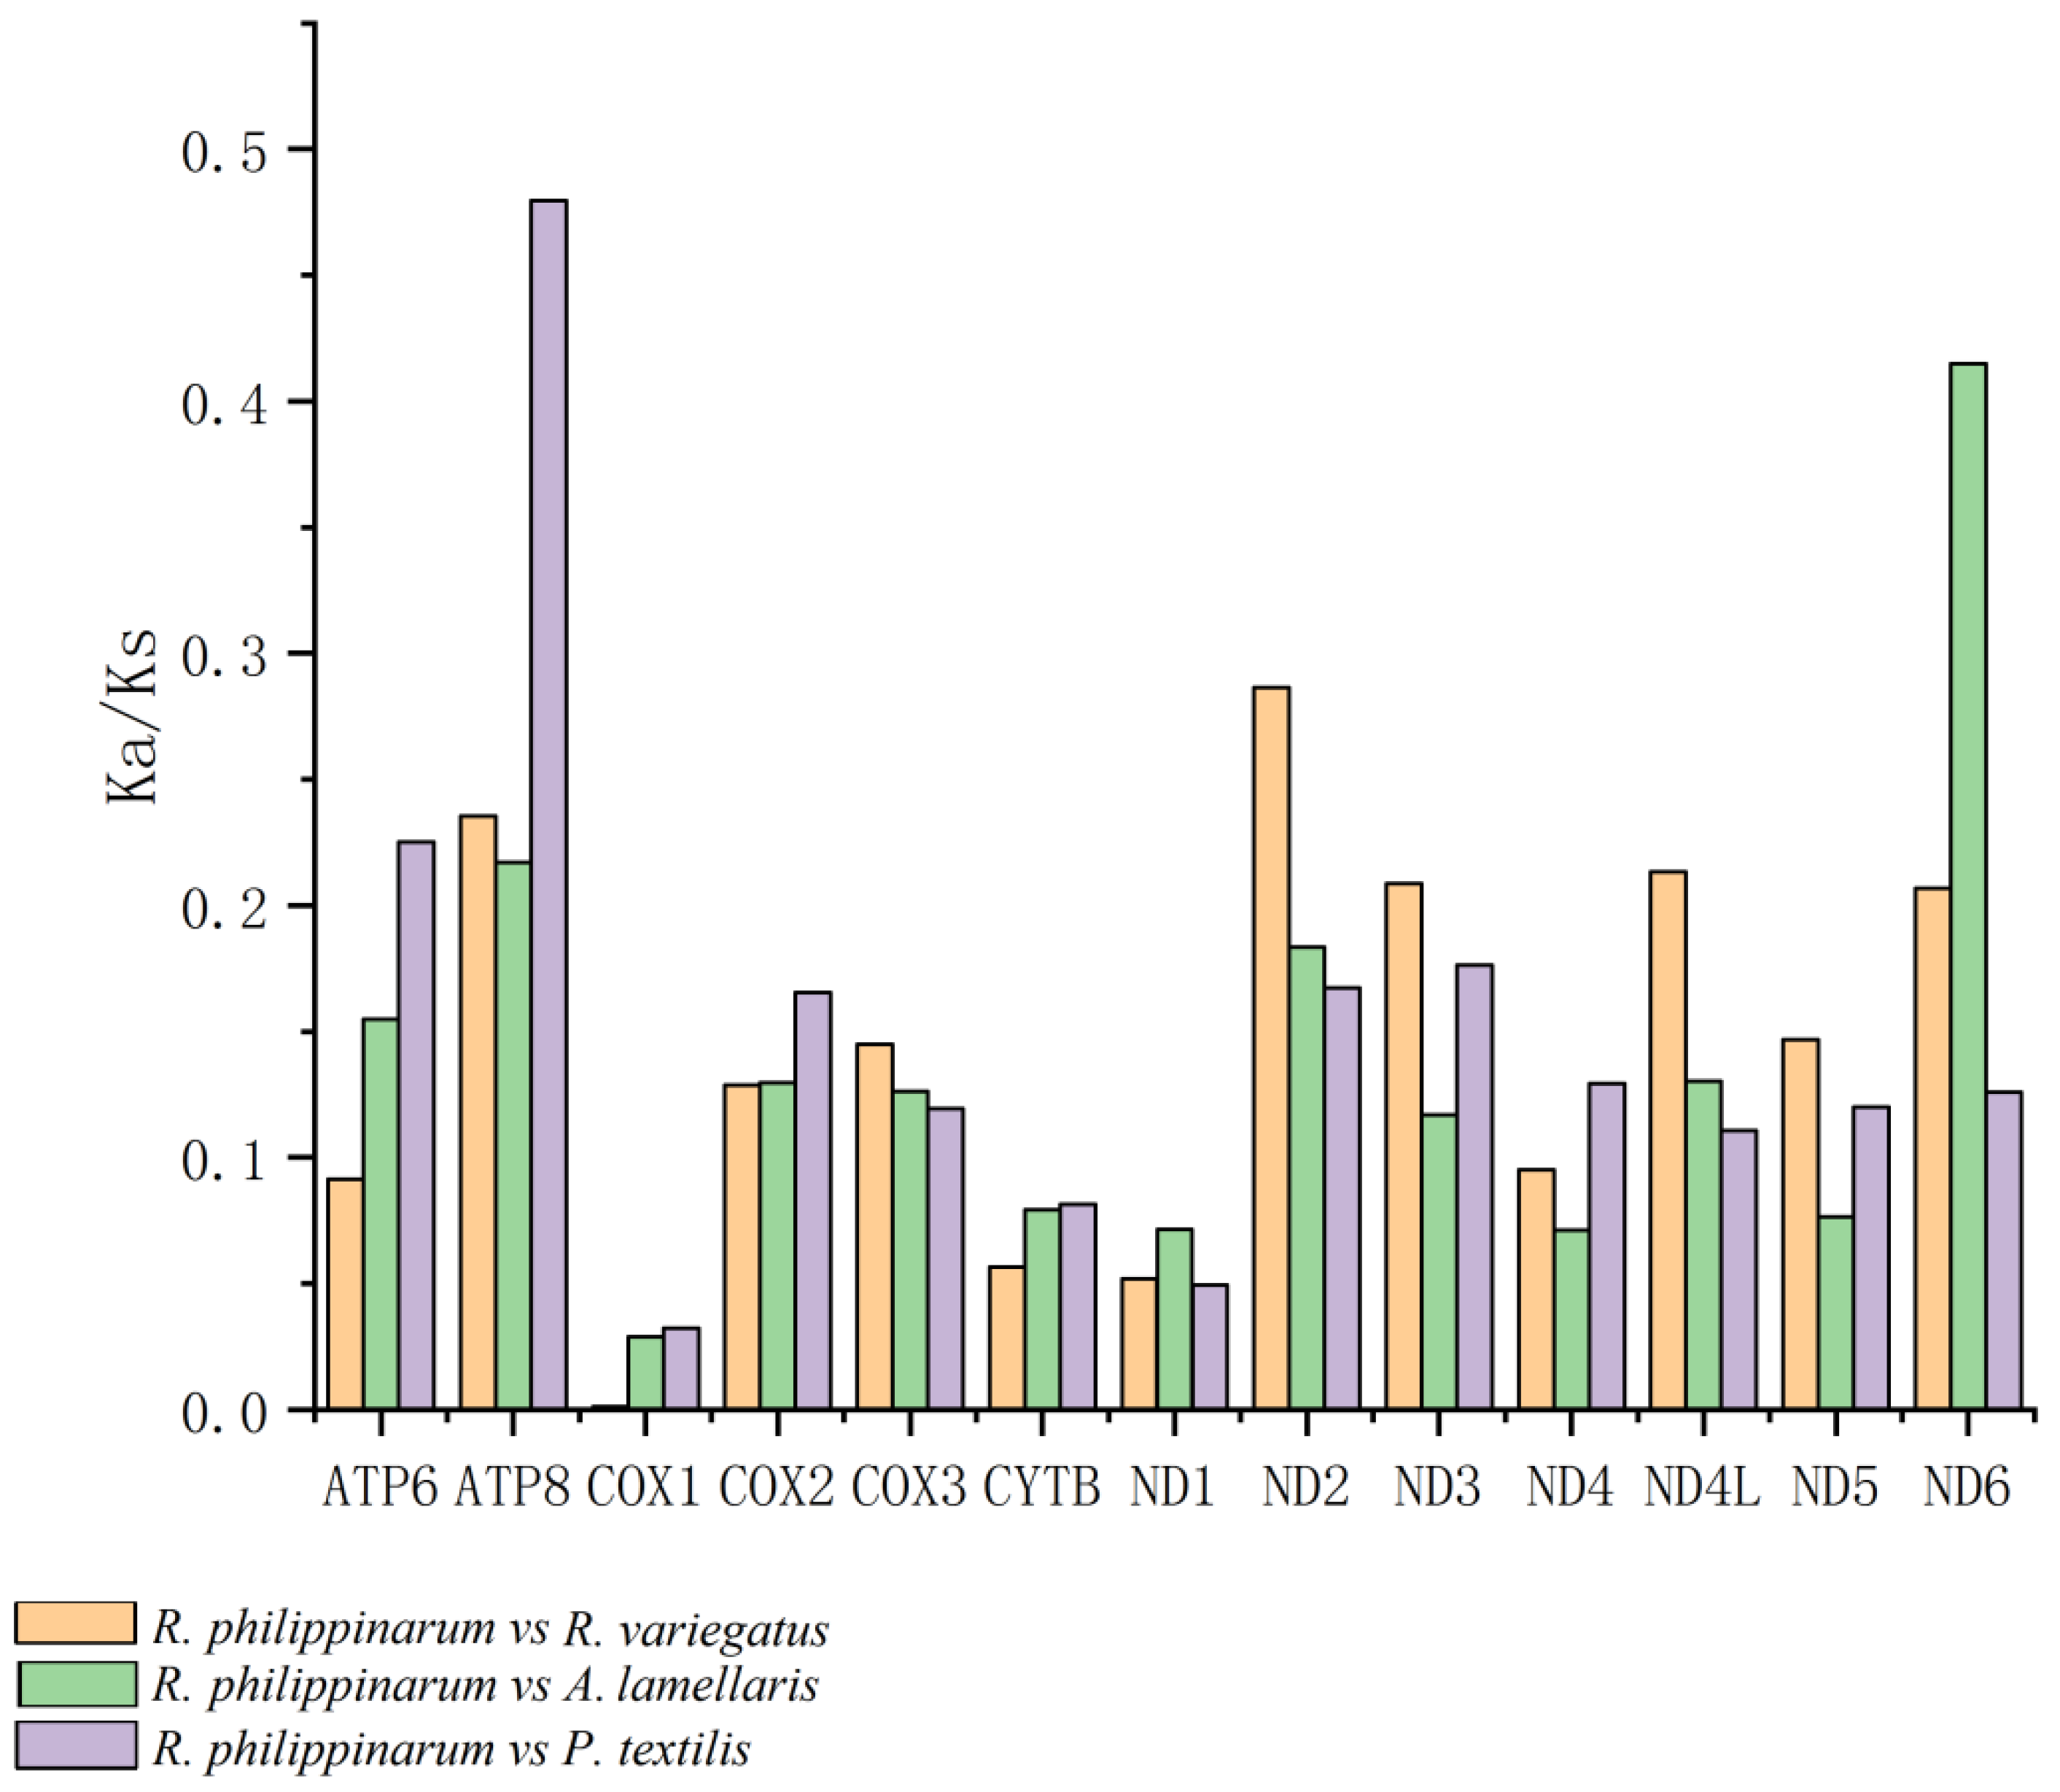
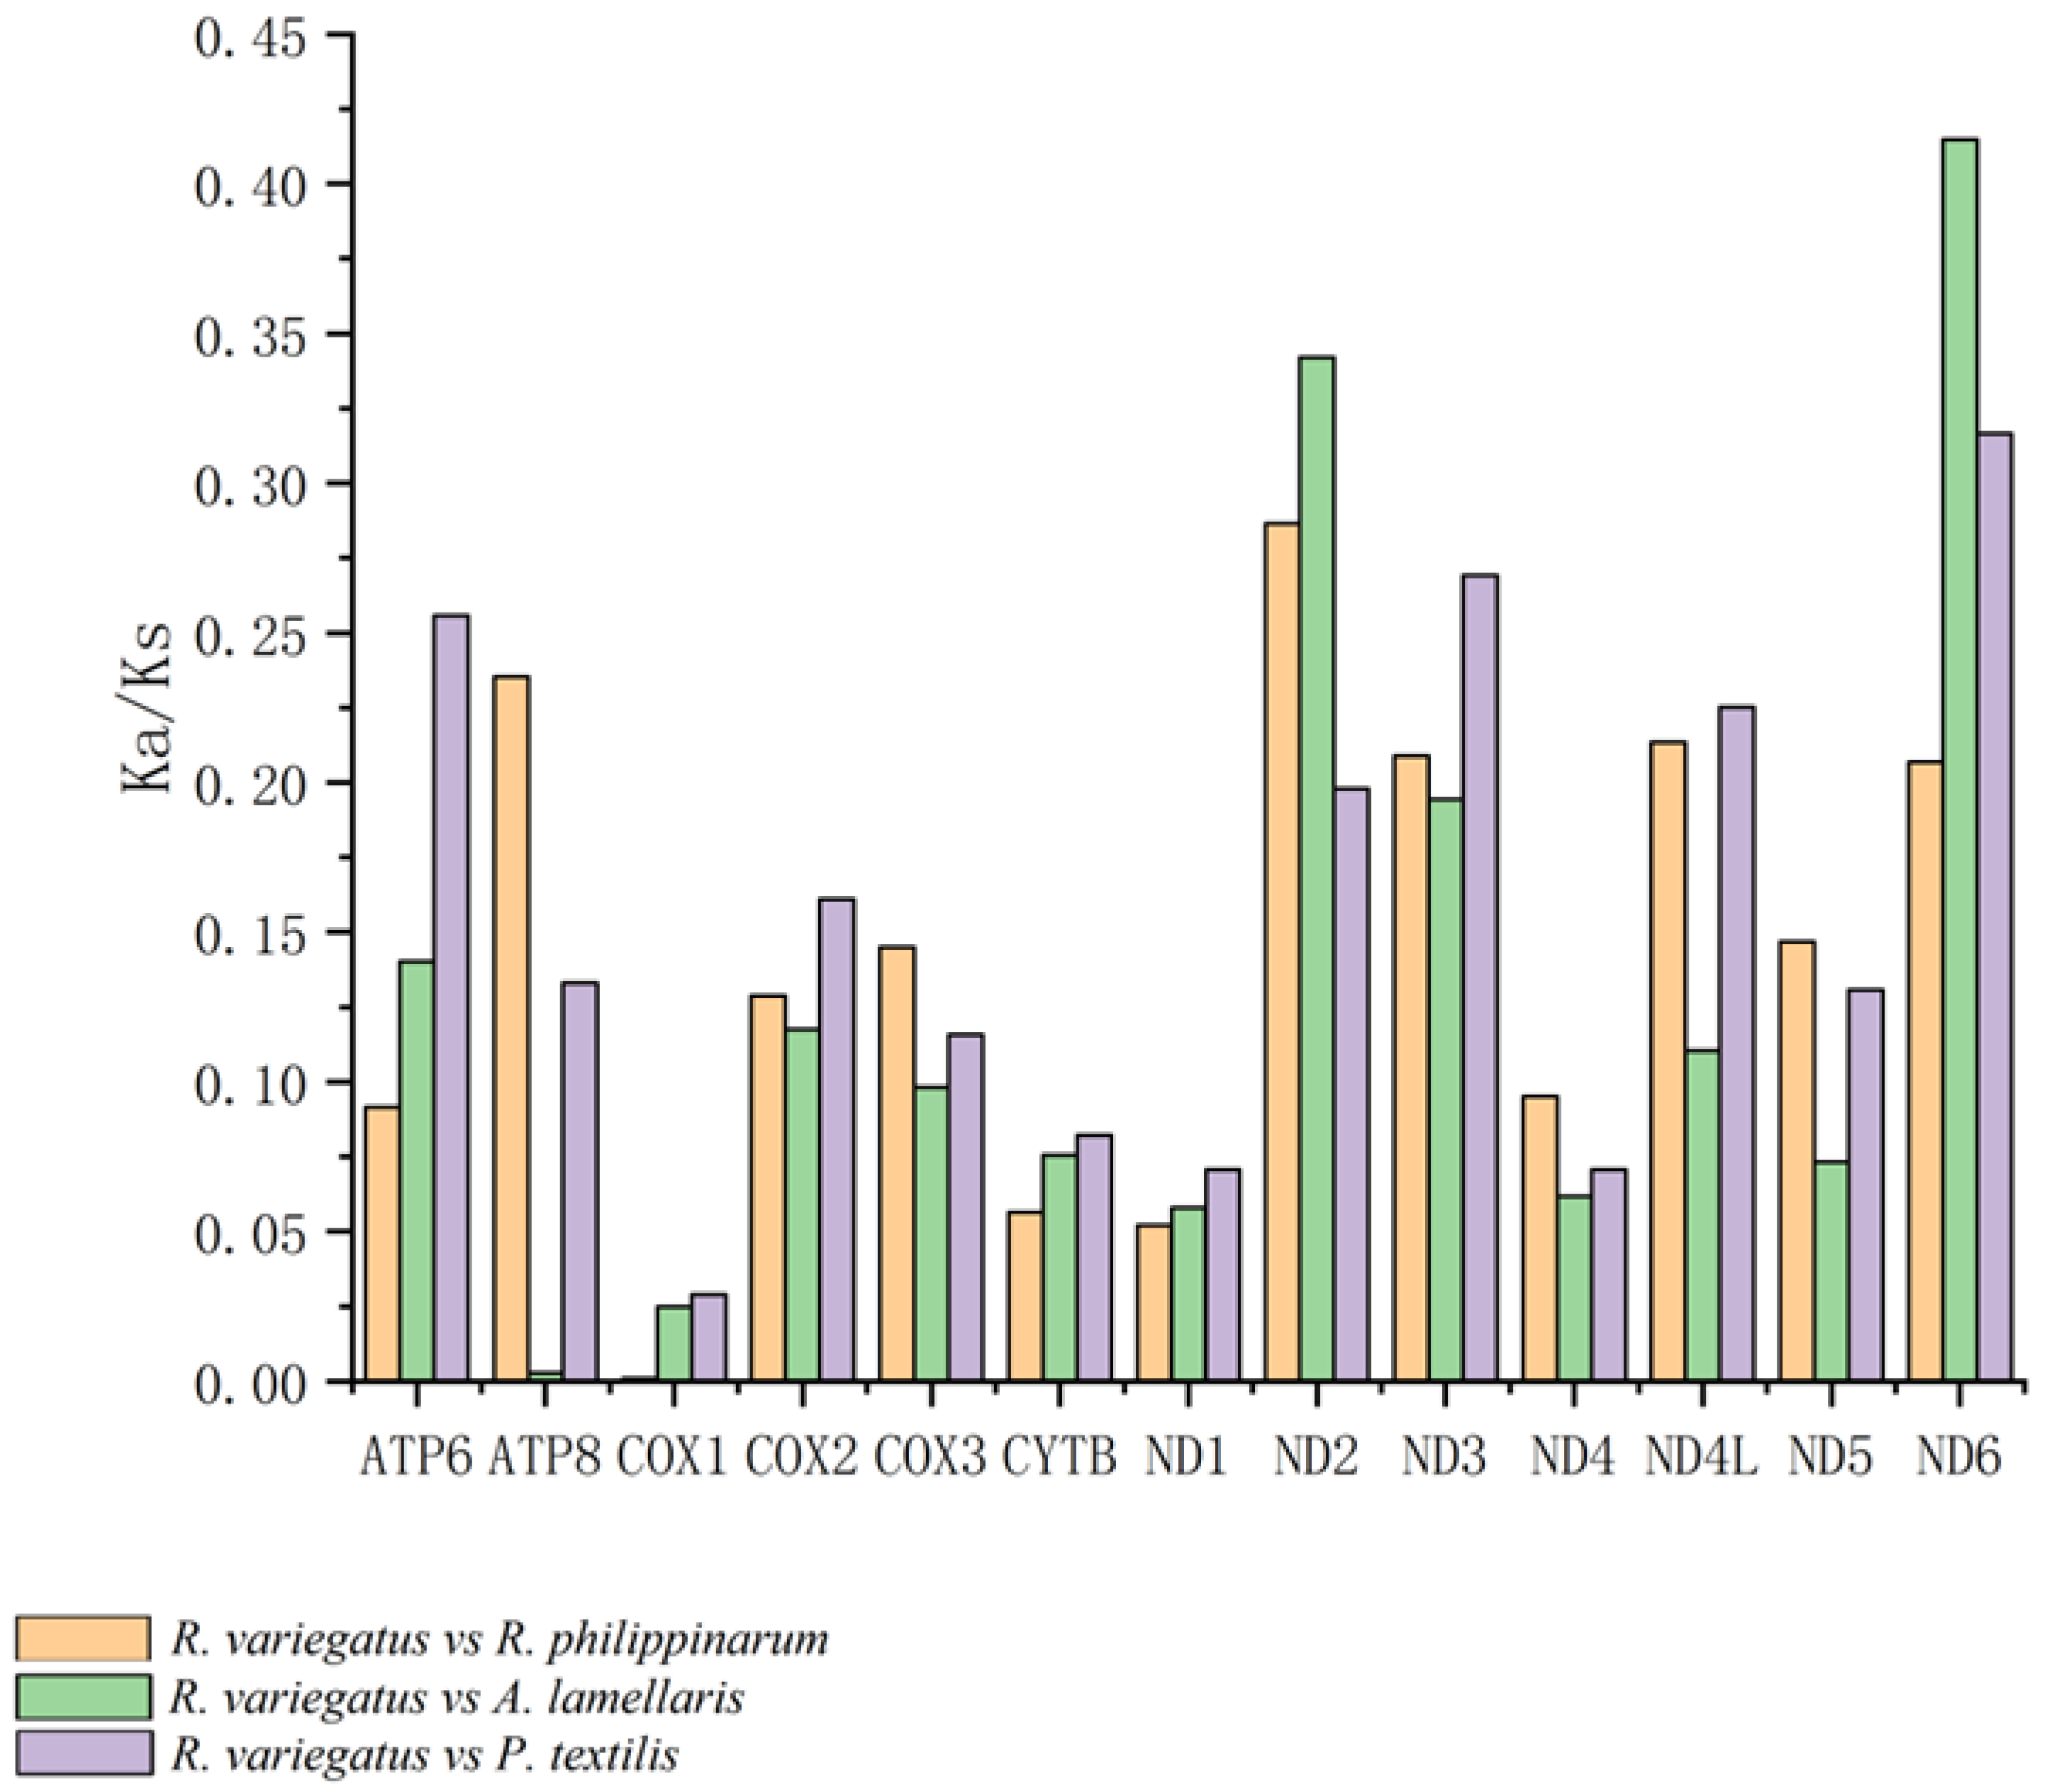
Values of the Ka/Ks ratio for the pairwise alignments of the 13 homologous PCGs of Ruditapes philippinarum, Antigona lamellaris, and Paratapes textilis are shown in Figure 9. The three genes with Ka/Ks values greater than 0.28 were ATP8 (0.479: R. philippinarum vs. P. textilis), ND6 (0.415: R. philippinarum vs. A. lamellaris), and ND2 (0.286: R. philippinarum vs. P. textilis). Figure 10 shows the Ka/Ks values for the alignment of 13 homologous PCGs between R. variegatus and A. lamellaris, and between R. variegatus and P. textilis. The four genes with Ka/Ks values greater than 0.28 were ND6 (0.415: R. variegatus vs. A. lamellaris), ND2 (0.342: R. variegatus vs. A. lamellaris), ND6 (0.316: R. variegatus vs. P. textilis), and ND2 (0.286: R. variegatus vs. R. philippinarum).
The Ka/Ks ratios of the 13 PCGs of R. philippinarum and R. variegatus versus those of A. lamellaris or P. textilis all yielded values of <1. Moreover, the Ka/Ks values of the genes COX1, COX2, COX3, CYTB, ND1, and ND4 are small and have similar values. The alignment of R. philippinarum to the ATP8 gene of P. textilis revealed that the Ka/Ks values of the ATP8 gene of R. philippinarum (0.479: R. philippinarum vs. P. textilis) were significantly greater than those of the ATP8 gene of R. variegatus (0.133: R. variegatus vs. P. textilis). With A. lamellaris as the alignment target, the Ka/Ks value of the ATP8 gene of R. variegatus is 0.003 (R. variegatus vs. A. lamellaris), which is close to 0, while that of the ATP8 gene of R. philippinarum is 0.217 (R. philippinarum vs. A. lamellaris), and the difference was significant.
In contrast, the comparison of the Ka/Ks values between R. philippinarum and R. variegatus versus A. lamellaris or P. textilis revealed that both have the largest number of relative nonsynonymous substitutions in genes ND6 and ND2. The Ka/Ks values were 0.415 (R. philippinarum vs. A. lamellaris), 0.415 (R. variegatus vs. A. lamellaris), 0.316 (R. variegatus vs. P. textilis), and 0.342 (R. variegatus vs. A. lamellaris), which are significantly higher than for the other groups; this indicates that the nonsynonymous substitution rate of genes ND6 and ND2 has been large in the course of evolution (i.e., variations in genes ND6 and ND2 are large). Furthermore, the Ka/Ks values for gene ND2 aligned to A. lamellaris, and the Ka/Ks values for genes ND4L and ND6 aligned to P. textilis and R. variegatus were greater than those for R. philippinarum.

4. Discussion

4.1. Expression of PCGs under Selective Pressure

Mitochondrial DNA has high mutation rates; numerous nucleotide substitutions may also accumulate quickly between diverging species in the short term, thus facilitating screening for genetic changes over a relatively short period in studies of molecular phylogenetics and evolution. This in turn allows comparisons of differences between homologous genetic loci in different species to determine their evolutionary relatedness. Calculating the evolutionary selection pressure (values of the Ka/Ks ratio) of mitochondrial PCGs in Ruditapes philippinarum and R. variegatus was significant for reconstructing a phylogeny and understanding the protein-coding sequence [30]. Selection pressure analysis makes it possible to detect mutated genes in species during their gradual adaptation to the environment. The Ka/Ks ratio represents the rates of nonsynonymous and synonymous substitutions between two species. It is generally accepted that PCGs are under positive selection (i.e., mutations are beneficial to the organism) when Ka/Ks > 1, under purifying selection (mutations are harmful to the organism) when Ka/Ks < 1, or under no selection (mutations have no effect) when Ka/Ks = 1. Therefore, by calculating the rates of nonsynonymous and synonymous substitutions of the mitochondrial PCGs for R. philippinarum and R. variegatus, it is evident that natural selection can act in the short term to change genes during evolution, which thus requires us to determine whether these changes are related to environmental pressure on the organism.
As mentioned, two other species of Veneridae, Antigona lamellaris and Paratapes textilis, were selected for comparison with R. philippinarum and R. variegatus for relative synonymous substitution rates at the codon level. Hence, comparison of the calculated values of Ka/Ks could signify the degree of recent variation and enrichment in the mitochondria among these members of the same family. In calculating the Ka/Ks values for the PCGs of R. philippinarum and R. variegatus, respectively, the same two species (Antigona lamellaris and Paratapes textilis) were used for the alignment. Therefore, the Ka/Ks ratio served to determine the extent to which the environment caused nucleotide substitutions in mitochondrial genes during evolution through observation of differential gene expression in the mitochondria of the two species.
In this study, all genes had a Ka/Ks value of <1, indicating that the mutation sites between R. philippinarum and R. variegatus did not reach the level of positive selection pressure when aligned with the species A. lamellaris and P. textilis, which showed values that manifest as purifying selection—that is, no deleterious genetic mutations remain. The mitochondrial COX I gene had the smallest Ka/Ks value and bears the largest purifying selection pressure, indicating high similarity of this gene between R. philippinarum and R. variegatus. The Ka/Ks value of the mitochondrial ATP8 gene in R. philippinarum was significantly greater than that of R. variegatus (Figure 9 and Figure 10), meaning that nonsynonymous substitution of APT8 in the genome of R. philippinarum represents environmental adaptation because it is preserved owing to less environmental pressure. Compared with the ATP8 gene in P. textilis, the Ka/Ks value of ATP8 in R. philippinarum (0.479: R. philippinarum vs. P. textilis) was significantly greater than the ATP8 gene in R. variegatus (0.133: R. variegatus vs. P. textilis); and compared with the ATP8 gene in A. lamellaris, the Ka/Ks value of R. variegatus is practically 0 (0.003: R. variegatus vs. A. lamellaris), while the ATP8 gene in R. philippinarum is 0.217 (R. philippinarum vs. A. lamellaris). In addition, the mitochondrial genes ND2 and ND6 in R. variegatus were under greater selective pressure during evolution than those genes in R. philippinarum, and the nonsynonymous substitution rate of ND2 and ND6 in R. variegatus was greater than that of R. philippinarum, and more mutations were retained. This reveals that mutations formed by the mitochondrial gene ATP8 of R. philippinarum and the mitochondrial genes ND6 and ND2 of R. variegatus have benefited these species’ adaption to their environments, and that these genes are under greater environmental pressure during genetic changes than other mitochondrial PCGs, which in R. philippinarum is mainly manifested on the gene ATP8, and in R. variegatus on genes ND6 and ND2.
The ATP8 gene is characterized by rapid adaptation changes, high interspecific mutation rates, and low intraspecific mutation rates, which can produce substantial diversity in a short period. The ATP8 gene tends to be particularly short, with only 100–200 bp in most animals, thus it can be difficult to detect; the ATP8 gene in both R. philippinarum and R. variegatus is 120 bp. Mietanka et al. found that ATP8 was crucial to the adaptive evolution of marine mussels [31]. Wu et al. likewise found that the ATP6 and ATP8 genes exhibited relatively fast rates of evolution [32]. Uddin et al. analyzed the compositional characteristics and codon usage bias of the ATP6 and ATP8 genes in fish, birds, and mammals; they discovered an uneven distribution of total bases at the third codon position in these genes in distinct species, and that the GC content of the ATP8 gene was highest in fish when compared with that in birds and mammals [33]. Nevertheless, the mitochondrial genes of R. philippinarum and R. variegatus were found to have a high AT bias, which may be due to fish being vertebrates, whereas mollusks differ in their mitochondrial energy metabolism. In an analysis of the mitochondrial genes of Eriosomatinae (woolly aphids), Lee et al. found that use of the ATP8 gene in DNA barcodes improved the accuracy of species identification in that and other insect taxa [34]. The finding that ATP8 exhibited lower intraspecific and higher interspecific genetic differences than COI is consistent with the large difference in relative codon usage of the mitochondrial ATP8 gene between R. philippinarum and R. variegatus found in this study, because patterns of codon usage are thought to be well conserved during evolution [30].
Liu et al. described how the deletion of the ATP8 gene in the mitochondrial genome of marine shellfish could have special significance for their evolution and gene function [26]. Those authors analyzed the mitochondrial genomes of 16 bivalve species and found that ATP8 was absent in all 14 marine shellfish examined, except for Hiatella arctica, but that the ATP6 gene was present; however, two freshwater bivalve species possessed the ATP8 gene. Liu et al. also speculated that because most marine shellfish were benthic and inhabit shallow rocky or sandy substrates in waters with low temperatures, they had low energy metabolism, resulting in degradation of the ATP8 gene coding function and the loss of gene segments [26]. In contrast, freshwater shellfish have higher levels of energy metabolism as they live in terrestrial freshwater waterbodies with generally higher temperatures. This is similar to the differential expression of the ATP8 gene in this study. Furthermore, Bernhard et al. noted the loss of ATP8 within flatworms and that this loss was restricted to the parasitic taxon Neodermata; they concluded that the deletion of the gene in parasitic flatworms, which did not require active temperature regulation, clearly indicateed that ATP8 was associated with temperature-regulated metabolism [35]. In summary, R. philippinarum has a higher nonsynonymous replacement rate than R. variegatus for gene ATP8. Ruditapes philippinarum can better tolerate low temperatures compared with R. variegatus; accordingly, R. philippinarum is distributed along the north and south coasts of China, while R. variegatus is only distributed south of Pingtan (119°97′ E, 24°60′ N) in Fujian Province.
Lee et al. found that the ATP8 gene evolveed faster than the COI gene if the genetic difference between individuals was large enough. However, if it was less than the threshold (i.e., COI distance is 1%) then ATP8 evolveed slower than COI [34]. Moreover, the genetic differentiation model of ATP8 is consistent with divisions in existing classification systems. For instance, Yi et al. investigated genetic diversity using 126 samples from 14 Bactrian camel populations from different regions to distinguish wild haplogroups (H1) and domestic haplogroups (H2–H16) through the mitochondrial genes ATP8 and ATP6 [36]. Additionally, the specific regulatory function of gene ATP8 has not been widely studied, and only Smt1p is found to regulate the translation of mitochondrial ATP8/ATP6 mRNA, as the expression of the mitochondrial-encoded ATP6 and ATP8 genes is translationally regulated by F1-ATPase. To further determine whether ATP8 is a key regulation gene for the temperature adaptability difference between R. philippinarum and R. variegatus, in-depth research examining transcriptional expression in these two shellfish is needed.
The mitochondrial gene ND2 plays a key role in controlling the production of mitochondrial reactive oxygen species. Yu et al. found that mt-ND2 was widely expressed in various tissues and its expression was influenced by dietary fat type and age [37]. Moreover, mt-ND2 could be considered as a candidate gene associated with adaptation to high-altitude environments [38]. The gene ND2 has a fast evolutionary rate; this difference in evolutionary rate does not result in significant incongruence between phylogenies derived from the two gene regions independently [39]. However, the gene ND6 was found to have little genetic variation at the intraspecific level, but large interspecific genetic variation [40]. This is consistent with the results of our study, in which the mitochondrial genes ND6 and ND2 differed most between the two species. In this study, R. variegatus showed less selective pressure in ND2 and ND6 compared with R. philippinarum, which had a wide temperature range and relatively wide distribution, whereas R. variegatus had a restricted distribution. Based on the present results, it can be inferred that the mitochondrial genes ND2 and ND6 are essential in the determination of interspecific differences.

4.2. Comparison of Gene Order

Comparison of mitochondrial gene arrangements has become a powerful means to infer evolutionary relationships in animals. The rearrangement of mitochondrial gene order was often considered unique (Boore, 1999), as even two evolutionarily close species might differ substantially in their mitochondrial genomes [41]. The order of gene clusters was similar in R. philippinarum and R. variegatus, as manifested mainly in eight gene clusters arranged in the same order. The differences were as follows: both species have their own unique genes (noncommon genes); tRNA trnP-AGG is present in the mitochondrial genome of R. variegatus, but not R. philippinarum; and trnY-ATA, trnP-TGG, and trnS-TCT were contained in the mitochondrial genome of R. philippinarum, but were absent in R. variegatus. Phylogenetic analysis showed that R. philippinarum and R. variegatus comprise a sister group. The order of mitochondrial genes between R. philippinarum and R. variegatus was compared in accordance with the tandem duplication–random loss (TDRL) model. The results show a relationship between k-m-m-l-n in R. philippinarum, and between K-l-m in R. variegatus; this allows speculation that tandem duplication followed by random loss occurs in k-l-m of R. variegatus, and in k-m-m-l-n of R. philippinarum [12,42,43].
To date, the TDRL model, as a stochastic approximation method, is the most widely accepted hypothesis used to explain the mechanism of mitochondrial gene rearrangement, assuming that the order of gene rearrangement occurs by tandem duplication and a new gene order is generated by random loss of certain repetitive genes or gene clusters [42,44]. A certain nonfunctional gene or gene cluster in a repeat gene is randomly lost or deleted to form a new gene arrangement sequence under natural selection [42]. Previous authors suggested that mitochondrial gene rearrangements could be used as auxiliary molecular markers for phylogenetic relationships because the mitochondrial gene order of close species was relatively stable [45,46,47]. Du et al. asserted that the order of mitochondrial gene arrangement in animals remains unchanged over long periods, although during rapid evolution of animal mitochondrial genome sequences, there is the theoretical possibility of large genome rearrangements [47,48]. The rearrangement of mitochondrial gene sequences has also been found in humans. Poulton et al. detected a family of mtDNA rearrangements in patients with mtDNA deletions [49], which suggests that rearrangements may be a transient intermediate form and that replicating molecules may be intermediate in deletion formation, as a manner of replication that could be a general mechanism for major mitochondrial DNA rearrangements.

5. Conclusions

Ruditapes philippinarum is found in both northern and southern coastal areas in China, whereas R. variegatus is mainly distributed on the south coast in Pingtan, Fujian Province. These venerids have a similar shell morphology and shell color, thus making them difficult to distinguish. This study determined the species’ whole mitochondrial genomes and compared them with two other venerids of genus Venus, also found in China. The results showed that R. philippinarum differed from R. variegatus in basic mitochondrial genome characteristics, which resolveed a historic confusion in classification of the two species. The phylogenetic analysis found that R. philippinarum and R. variegatus together formed a small branch on the constructed phylogenetic tree. The order of genes is highly similar in R. philippinarum and R. variegatus, substantiating that the two are close phylogenetically, although the existence of different coding genes indicates certain differences.
We speculate that as external environmental factors (e.g., geographic area and water temperature) that limit the flow between two genes diminish, and as the genetic distance gradually increases, the two species will gradually evolve. The mitochondrial gene orders in R. philippinarum and R. variegatus include noncommon genes; we also found that tandem duplication followed by random loss could occur between two of the gene clusters, namely k-l-m in R. variegatus and k-m-m-l-n in R. philippinarum. The PCGs of R. philippinarum and R. variegatus are significantly AT skewed. Our analysis of selection pressure shows that the nonsynonymous substitution rate in the ATP8 gene is significantly higher in R. philippinarum than in R. variegatus; the differential gene enrichment of the mitochondrial gene ATP8 is found to be associated with temperature-regulated related metabolism, which aligns with the geographical distribution background of the two species in this study, whereby R. philippinarum has a wider range and R. variegatus has a narrow geographic distribution. This investigation of differences in the mitochondrial genomes of R. philippinarum and R. variegatus presents scientific evidence for estimating interspecific phylogeny, molecular germplasm characterization, and crossbreeding.

Author Contributions

Conceptualization, Z.H., Y.L. and X.Y.; performed the experiments, Y.T. (Yumei Tang), L.Z. and W.Z.; performed the data analyses, Y.T. (Yumei Tang), Y.W. and Y.T. (Yue Tan); drafted the manuscript, Y.T. (Yumei Tang); revised the manuscript, Z.H., Y.L. and L.F. All authors have read and agreed to the published version of the manuscript.

Funding

This research was supported by a grant from the Chinese Ministry of Science and Technology through the National Key Research and Development Program of China (2019YFD0900704; 2018YFD0901400), National Science Foundation of China (41606133; 31502163), Liao Ning Revitalization Talents Program (XLYC1807271), Outstanding Young Scientific and Technological Talents Foundation of Dalian (2021 RJ09), and funds earmarked for Modern Agro-industry Technology Research System (CARS-49).

Institutional Review Board Statement

Not applicable.

Informed Consent Statement

Not applicable.

Data Availability Statement

The data that support the findings of this study are all generated by our experiments. The raw data has been uploaded to the NCBI Sequence Read Ar-chive (SRA). The BioProject ID are PRJNA896365 (R. philippinarum) and PRJNA896706 (R. variegatus). The nucleotide sequences were uploaded to GenBank (https://www.ncbi.nlm.nih.gov/genome), with accession numbers MZ675529 and MZ675530 for R. philippinarum and R. variegatus. (accessed on 15 November 2022).

Acknowledgments

We thank the anonymous reviewers for their helpful comments on this work.

Conflicts of Interest

The authors declare no known competing financial interests or personal relationships that could have influenced the work reported in this paper.

References

  1. Yan, X. The Culture Biology and Technology and Selective Breeding in Manila Clam, Ruditapes philippinarum; Institute of Oceanology, Chinese Academy of Science: Qingdao, China, 2005. (In Chinese) [Google Scholar]
  2. Zheng, K.; Yang, M.; Yan, C.; Tang, M.; Song, Z. Mitochondrial Dynamics and Apoptosis. Chin. J. Cell Biol. 2019, 41, 1467–1476. (In Chinese) [Google Scholar]
  3. Passamonti, M. De Novo Assembly of the Manila Clam Ruditapes philippinarum Transcriptome Provides New Insights into Expression Bias, Mitochondrial Doubly Uniparental Inheritance and Sex Determination. Mol. Biol. Evol. 2012, 29, 771–786. [Google Scholar] [CrossRef] [Green Version]
  4. Milani, L.; Ghiselli, F.; Iannello, M.; Passamonti, M. Evidence for somatic transcription of male-transmitted mitochondrial genome in the DUI species Ruditapes philippinarum (Bivalvia: Veneridae). Curr. Genet. 2014, 60, 163–173. [Google Scholar] [CrossRef] [PubMed]
  5. Wang, Z.; Bai, Y.; Nie, H.; Xu, Q.; Yin, Z.; Zhang, Y.; Yin, X.; Yan, X. Molecular mechanisms of wound healing and regeneration of siphon in the Manila clam Ruditapes philippinarum revealed by transcriptomic analysis. Genomics 2021, 113, 1011–1025. [Google Scholar] [CrossRef] [PubMed]
  6. Wu, Q.-D.; Tan, Y.; Wang, J.; Xie, Q.; Huo, Z.; Fang, L.; Yan, X. Effect of estradiol stimulation on Dmrt gene expression in Manila clam Ruditapes philippinarum. J. Dalian Ocean. Univ. 2019, 34, 362–369. [Google Scholar] [CrossRef]
  7. Guerra, D.; Ghiselli, F.; Milani, L.; Breton, S.; Passamonti, M. Early replication dynamics of sex-linked mitochondrial DNAs in the doubly uniparental inheritance species Ruditapes philippinarum (Bivalvia, Veneridae). Heredity 2016, 116, 324–332. [Google Scholar] [CrossRef] [Green Version]
  8. Liu, X.; Zhang, L.; You, L.; Yu, J.; Zhao, J.; Li, L.; Wang, Q.; Li, F.; Li, C.; Liu, D.; et al. Differential toxicological effects induced by mercury in gills from three pedigrees of Manila clam Ruditapes philippinarum by NMR-based metabolomics. Ecotoxicology 2011, 20, 177–186. [Google Scholar] [CrossRef]
  9. Delaporte, M.; Soudant, P.; Moal, J.; Lambert, C.; Quéré, C.; Miner, P.; Choquet, G.; Paillard, C.; Samain, J. Effect of a mono-specific algal diet on immune functions in two bivalve species—Crassostrea gigas and Ruditapes philippinarum. J. Exp. Biol. 2003, 206, 3053–3064. [Google Scholar] [CrossRef] [PubMed] [Green Version]
  10. Lee, H.-C.; Wei, Y.-H. Mitochondrial role in life and death of the cell. J. Biomed. Sci. 2000, 7, 2–15. [Google Scholar] [CrossRef]
  11. Suzuki, A.; Tsutomi, Y.; Yamamoto, N.; Shibutani, T.; Akahane, K. Mitochondrial regulation of cell death: Mitochondria are essential for procaspase 3-p21 complex formation to resist Fas-mediated cell death. Mol. Cell. Biol. 1999, 19, 3842–3847. [Google Scholar] [CrossRef] [Green Version]
  12. Tang, B.-P.; Liu, Y.; Xin, Z.-Z.; Zhang, D.-Z.; Wang, Z.-F.; Zhu, X.-Y.; Wang, Y.; Zhang, H.-B.; Zhou, C.-L.; Chai, X.-Y.; et al. Characterisation of the complete mitochondrial genome of Helice wuana (Grapsoidea: Varunidae) and comparison with other Brachyuran crabs. Genomics 2018, 110, 221–230. [Google Scholar] [CrossRef]
  13. Iannelli, F.; Pesole, G.; Sordino, P.; Gissi, C. Mitogenomics reveals two cryptic species in Ciona intestinalis. Trends Genet. 2007, 23, 419–422. [Google Scholar] [CrossRef] [Green Version]
  14. Shen, C.; Sun, S.-C. Mitochondrial genome of Micrura bella (Nemertea: Heteronemertea), the largest mitochondrial genome known to phylum Nemertea. Mitochondrial DNA Part A DNA Mapp. Seq. Anal. 2016, 27, 2899–2900. [Google Scholar] [CrossRef]
  15. Liao, X.; Zhao, Y.; Kong, X.; Khan, A.; Zhou, B.; Liu, D.; Kashif, M.H.; Chen, P.; Wang, H.; Zhou, R. Complete sequence of kenaf (Hibiscus cannabinus) mitochondrial genome and comparative analysis with the mitochondrial genomes of other plants. Sci. Rep. 2018, 8, 1–13. [Google Scholar] [CrossRef] [PubMed] [Green Version]
  16. Li, T.; Yang, J.; Li, Y.; Cui, Y.; Xie, Q.; Bu, W.; Hillis, D.M. A Mitochondrial Genome of Rhyparochromidae (Hemiptera: Heteroptera) and a Comparative Analysis of Related Mitochondrial Genomes. Sci. Rep. 2016, 6, 35175. [Google Scholar] [CrossRef] [PubMed] [Green Version]
  17. Herd, K.E.; Barker, S.C.; Shao, R. The mitochondrial genome of the chimpanzee louse, Pediculus schaeffi: Insights into the process of mitochondrial genome fragmentation in the blood-sucking lice of great apes. BMC Genom. 2015, 16, 1–8. [Google Scholar] [CrossRef] [PubMed] [Green Version]
  18. Xia, Y.; Zheng, Y.; Miura, I.; Wong, P.B.; Murphy, R.W.; Zeng, X. The evolution of mitochondrial genomes in modern frogs (Neobatrachia): Nonadaptive evolution of mitochondrial genome reorganization. BioMed Cent. 2014, 15, 691. [Google Scholar] [CrossRef] [PubMed] [Green Version]
  19. Liu, G.; Cao, D.; Li, S.; Su, A.; Geng, J.; Grover, C.E.; Hu, S.; Hua, J. The Complete Mitochondrial Genome of Gossypium hirsutum and Evolutionary Analysis of Higher Plant Mitochondrial Genomes. PLoS ONE 2013, 8, e69476. [Google Scholar] [CrossRef] [PubMed] [Green Version]
  20. Wei, D.-D.; Shao, R.; Yuan, M.-L.; Dou, W.; Barker, S.C.; Wang, J.-J. The Multipartite Mitochondrial Genome of Liposcelis bostrychophila: Insights into the Evolution of Mitochondrial Genomes in Bilateral Animals. PLoS ONE 2012, 7, e33973. [Google Scholar] [CrossRef] [Green Version]
  21. Brockman, S.A.; McFadden, C.S. The Mitochondrial Genome of Paraminabea aldersladei (Cnidaria: Anthozoa: Octocorallia) Supports Intramolecular Recombination as the Primary Mechanism of Gene Rearrangement in Octocoral Mitochondrial Genomes. Genome Biol. Evol. 2012, 4, 994–1006. [Google Scholar] [CrossRef] [PubMed] [Green Version]
  22. Chang, S.; Yang, T.; Du, T.; Huang, Y.; Chen, J.; Yan, J.; He, J.; Guan, R. Mitochondrial genome sequencing helps show the evolutionary mechanism of mitochondrial genome formation in Brassica. BMC Genom. 2011, 12, 497. [Google Scholar] [CrossRef]
  23. Zhang, H.; Liu, Q.; Lu, C.; Deng, J.; Huang, X. The First Complete Mitochondrial Genome of Lachninae Species and Comparative Genomics Provide New Insights into the Evolution of Gene Rearrangement and the Repeat Region. Insects 2021, 12, 55. [Google Scholar] [CrossRef] [PubMed]
  24. Zhang, Y.; Xue, S. Characterization and phylogenetic analysis of the mitochondrial genome of Macdunnoughia hybrida (Lepidoptera: Noctuidae: Plusiinae). Mitochondrial DNA Part B 2021, 6, 2294–2296. [Google Scholar] [CrossRef] [PubMed]
  25. Cao, J.; Wang, Y.; Guo, X.; Wang, G.; Li, W.; Murányi, D. Two Complete Mitochondrial Genomes from Leuctridae (Plecoptera: Nemouroidea): Implications for the Phylogenetic Relationships among Stoneflies. J. Insect Sci. 2021, 21, 882–894. [Google Scholar] [CrossRef] [PubMed]
  26. Song, W.-T.; Gao, X.-G.; Li, Y.-F.; Liu, W.-D.; Liu, Y.; He, C.-B. Comparison of mitochondrial genomes of bivalves. Hereditas 2009, 31, 1127–1134. (In Chinese) [Google Scholar] [CrossRef] [PubMed]
  27. Sun, S.; Li, Q.; Kong, L.; Yu, H. Complete mitochondrial genomes of Trisidos kiyoni and Potiarca pilula: Varied mitochondrial genome size and highly rearranged gene order in Arcidae. Sci. Rep. 2016, 6, 33794. [Google Scholar] [CrossRef] [PubMed] [Green Version]
  28. Teimori, A.; Esmaeili, M.R.; Motamedi, M. Scanning electron microscopy and morphological analysis reveal size-dependent changes in the scale surface ornamentation of tooth-carp Aphaniops hormuzensis (Teleostei; Aphaniidae). Microsc. Res. Tech. 2021, 84, 1710–1720. [Google Scholar] [CrossRef]
  29. Nie, H.; Jiang, L.; Huo, Z.; Liu, L.; Yang, F.; Yan, X. Transcriptomic responses to low temperature stress in the Manila clam, Ruditapes philippinarum. Fish Shellfish. Immunol. 2016, 55, 358–366. [Google Scholar] [CrossRef] [PubMed]
  30. Ikemura, T. Codon usage and tRNA content in unicellular and multicellular organisms. Mol. Biol. Evol. 1985, 2, 13–34. [Google Scholar]
  31. Śmietanka, B.; Burzyński, A.; Wenne, R. Comparative Genomics of Marine Mussels (Mytilus spp.) Gender Associated mtDNA: Rapidly Evolving atp8. J. Mol. Evol. 2010, 71, 385–400. [Google Scholar] [CrossRef] [PubMed]
  32. Wu, X.; Yan, P.; Liang, C.; Guo, X. Bioinformatics analysis of the ATP6 and ATP8 genes in yak. <The Sixth China Cattle Industry Development Conference> proceedings. Association. 2011, pp. 346–349. (In Chinese). Available online: https://xueshu.baidu.com/usercenter/paper/show?paperid=0560b0332c2d4c2713115353af28f783 (accessed on 18 October 2022).
  33. Uddin, A.; Mazumder, T.H.; Barbhuiya, P.A.; Chakraborty, S. Similarities and dissimilarities of codon usage in mitochondrial ATP genes among fishes, aves, and mammals. IUBMB Life 2020, 72, 899–914. [Google Scholar] [CrossRef] [PubMed]
  34. Lee, W.; Akimoto, S.-I. Development of new barcoding loci in gall-forming aphids (Eriosomatinae: Eriosomatini): Comparing three mitochondrial genes, ATP6, ATP8, and COI. J. Asia-Pac. Èntomol. 2015, 18, 267–275. [Google Scholar] [CrossRef]
  35. Bernhard, E.; Lutz, B.; Bastian, F. Atp8 is in the ground pattern of flatworm mitochondrial genomes. BMC Genom. 2017, 18, 414. [Google Scholar]
  36. Yi, L.; Ai, Y.; Ming, L.; Hai, L.; He, J.; Guo, F.-C.; Qiao, X.-Y.; Ji, R. Molecular diversity and phylogenetic analysis of domestic and wild Bactrian camel populations based on the mitochondrial ATP8 and ATP6 genes. Livest. Sci. 2017, 199, 95–100. [Google Scholar] [CrossRef]
  37. Zhang, W.; Hou, L.; Wang, T.; Lu, W.; Tao, Y.; Chen, W.; Du, X.; Huang, Y. The expression characteristics of mt-ND2 gene in chicken. Mitochondrial DNA Part A 2015, 27, 3787–3792. [Google Scholar] [CrossRef]
  38. Shi, Y.; Hu, Y.; Wang, J.; Elzo, M.A.; Yang, X.; Lai, S. Genetic diversities of MT-ND1 and MT-ND2 genes are associated with high-altitude adaptation in yak. Mitochondrial DNA Part A 2017, 29, 485–494. [Google Scholar] [CrossRef] [PubMed]
  39. Johnson, K.P.; Lanyon, S.M. Molecular Systematics of the Grackles and Allies, and the Effect of Additional Sequence (Cyt B and ND2). Ornithology 1999, 116, 759–768. [Google Scholar] [CrossRef]
  40. Jones, D.A.; Gibbs, H.L. Intra- and Interspecific Sequence Variation in a Portion of the Mitochondrial ND6 Gene in Cuckoos. Ornithol. Appl. 1997, 99, 815–818. [Google Scholar] [CrossRef]
  41. Bi, C.; Lu, N.; Xu, Y.; He, C.; Lu, Z. Characterization and Analysis of the Mitochondrial Genome of Common Bean (Phaseolus vulgaris) by Comparative Genomic Approaches. Int. J. Mol. Sci. 2020, 21, 3778. [Google Scholar] [CrossRef]
  42. Moritz, C.; Brown, W.M. Tandem Duplications in Animal Mitochondrial DNAs: Variation in Incidence and Gene Content among Lizards. Proc. Natl. Acad. Sci. USA 1987, 84, 7183–7187. [Google Scholar] [CrossRef] [PubMed] [Green Version]
  43. Wong, G.K.-S. KaKs_Calculator: Calculating Ka and Ks Through Model Selection and Model Averaging. Genom. Proteom. Bioinform. 2006, 2006, 259–263. [Google Scholar] [CrossRef] [Green Version]
  44. Arndt, A.; Smith, M.J. Mitochondrial gene rearrangement in the sea cucumber genus Cucumaria. Mol. Biol. Evol. 1998, 15, 1009–1016. [Google Scholar] [CrossRef] [Green Version]
  45. Boore, J.L.; Brown, W.M. Big trees from little genomes: Mitochondrial gene order as a phylogenetic tool. Curr. Opin. Genet. Dev. 1998, 8, 668–674. [Google Scholar] [CrossRef]
  46. Lavrov, D.V.; Lang, B.F. Poriferan mt DNA and animal phylogeny based on mitochondrial gene arrangements. Syst. Biol. 2005, 54, 651–659. [Google Scholar] [CrossRef] [PubMed] [Green Version]
  47. Du, S. Molecular Evolution and Phylogenetic Study of the Mitochondrial Genome of Freshwater Crabs in Gecarcinucidae Rathbun. Master’s Thesis, Nanjing Normal University, Nanjing, China, 2021. Available online: https://kns.cnki.net/kcms/detail/detail.aspx?doi=10.27245/d.cnki.gnjsu.2021.000959&dbcode=CMFD (accessed on 18 October 2022). (In Chinese).
  48. Boore, J.L. Animal mitochondrial genomes. Nucleic Acids Res. 1999, 27, 1767–1780. [Google Scholar] [CrossRef] [Green Version]
  49. Poulton, J.; Deadman, M.E.; Bindoff, L.; Morten, K.; Land, J.; Brown, G. Families of mtDNA rearrangements can be detected in patients with mtDNA deletions: Duplications may be a transient intermediate form. Hum. Mol. Genet. 1993, 223–230. [Google Scholar] [CrossRef]
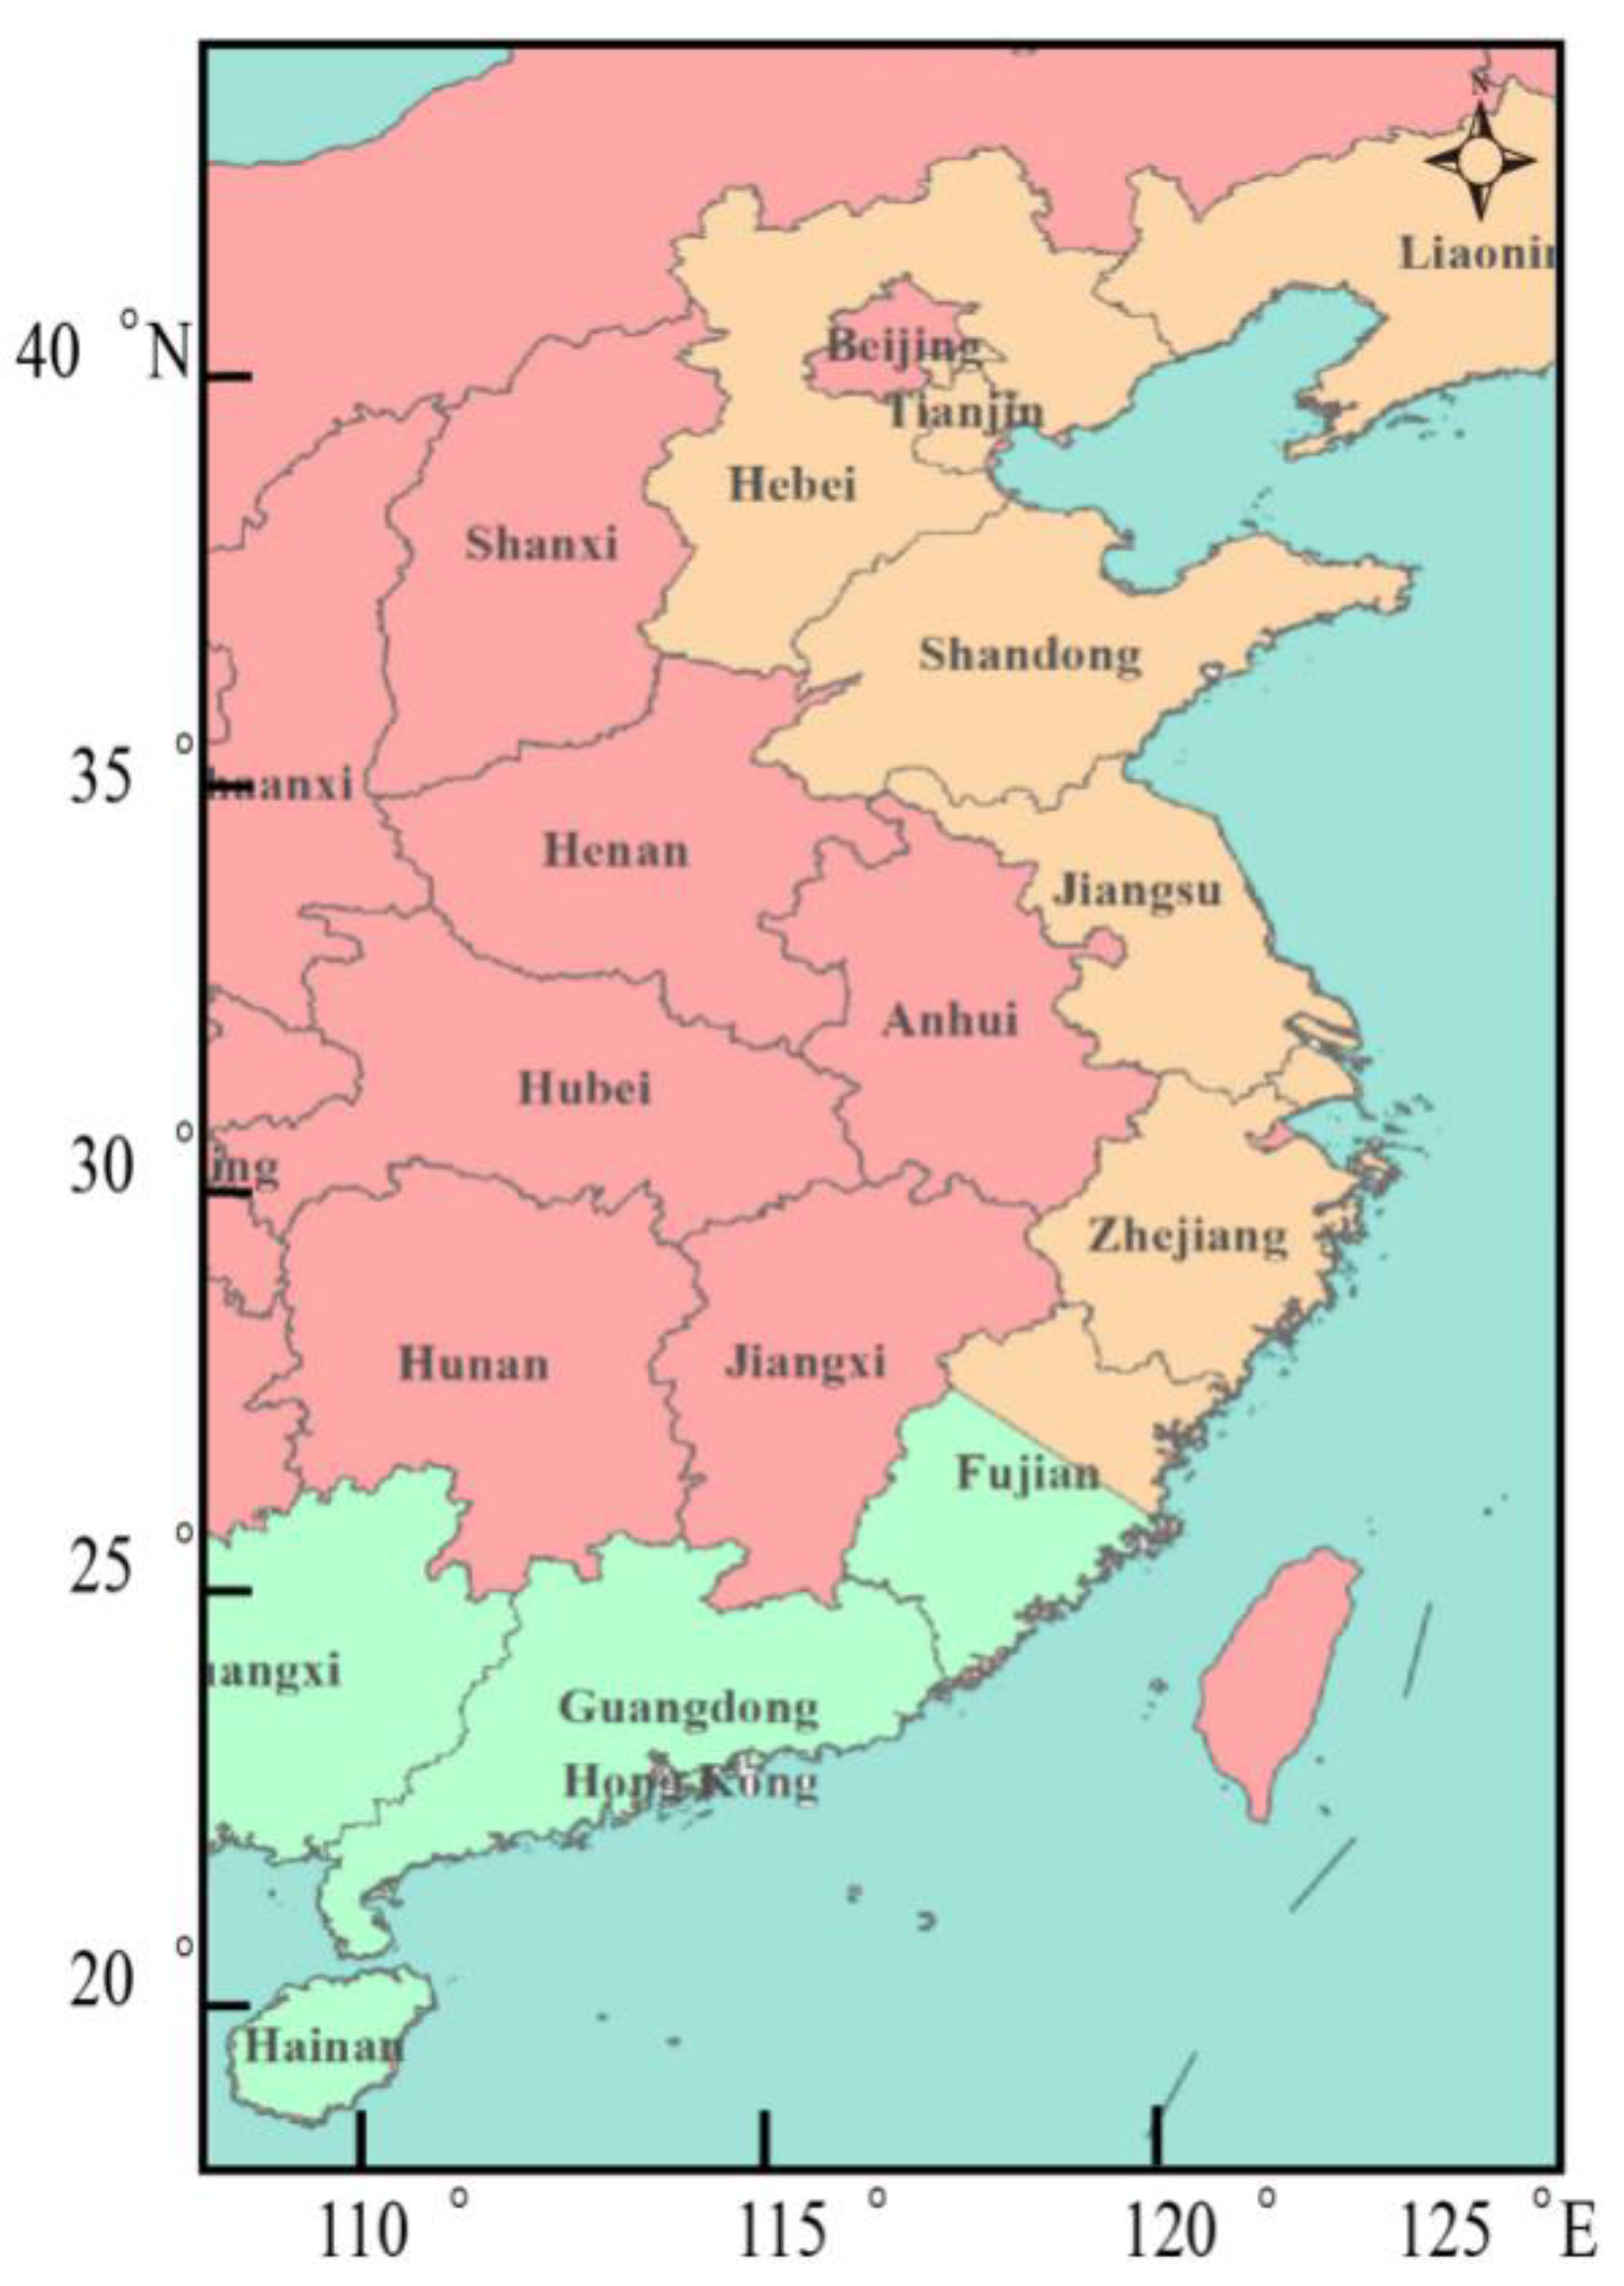
Figure 1. Coastal provinces of China where Ruditapes philippinarum (orange and green) and R. variegatus (only green) are found in natural seawater areas.
Genes 13 02157 g001
Figure 2. Comparison of the external radial ribs and degree of separation of the incurrent and excurrent siphons of (a,c) Ruditapes variegatus and (b,d) R. philippinarum.
Genes 13 02157 g002
Figure 3. Circular genome map of Ruditapes philippinarum mitochondrial DNA. The transcription direction of the gene in the ring proceeds clockwise, while transcription of the gene outside the ring proceeds counterclockwise. Different functional genes are marked with different colors. The inner gray circle depicts GC content along the genome, and the gray line at the center denotes the 50% threshold.
Genes 13 02157 g003
Figure 4. Circular genome map of Ruditapes variegatus mitochondrial DNA. The transcription direction of the gene depicted in the ring proceeds clockwise, while transcription of the gene outside the ring proceeds counterclockwise. Different functional genes are marked with different colors. The inner gray circle depicts GC content along the genome, and the gray line at the center denotes the 50% threshold.
Genes 13 02157 g004
Figure 5. Maximum-likelihood phylogenetic tree constructed for Ruditapes philippinarum and R. variegatus.
Genes 13 02157 g005
Figure 6. Comparison of mitochondrial DNA gene sequences between Ruditapes philippinarum and R. variegatus. The lowercase letters a–x respectively denote: trnL-TAG, trnY-ATA, trnC-GCA, trnP-AGG, trnI-GAT, trnP-TGG, trnE-TTC, trnH-GTG, trnN-TTT, trnS-TGA, trnY-GTA, trnD-GTC, trnM-CAT, trnV-TAC, trnG-TCC, trnF-GAA, trnW-TCA, trnR-TCG, trnL-TAA, trnQ-TTG, trnN-GTT, trnT-TGT, trnA-TGC, and trnS-TCT; the numbers 1–11 respectively denote COX1, ND1, ND2, COX2, CYTB, ND4, ND3, ND5, ND4L, ND6, and COX3; capital letters A–D indicate rrnL, ATP8, ATP6, and rrnS, respectively.
Genes 13 02157 g006
Figure 7. Relative synonymous codon usage (RSCU) in the mitochondrial genome of Ruditapes philippinarum.
Genes 13 02157 g007
Figure 8. Relative synonymous codon usage (RSCU) in the mitochondrial genome of Ruditapes variegatus.
Genes 13 02157 g008
Figure 9. Values of the Ka/Ks ratio in 13 protein-coding genes of Ruditapes philippinarum in relation to those of R. variegatus, Antigona lamellaris, and Paratapes textilis.
Genes 13 02157 g009
Figure 10. Values of the Ka/Ks ratio in 13 protein-coding genes of Ruditapes variegatus in relation to those of R. philippinarum, Antigona lamellaris, and Paratapes textilis.
Genes 13 02157 g010
Table 1. Comparison of phenotype traits between Ruditapes philippinarum (n = 30) and R. variegatus (n = 30), made from specimens collected on the south coast of China.
MaterialShellShellShellTissue DryMeat
LengthWidthHeightWeightCondition
R. variegatus32.66 ± 2.0714.37 ± 1.5623.67 ± 1.570.27 ± 0.056.11 ± 1.85
R. philippinarum34.96 ± 1.3315.28 ± 0.6923.56 ± 1.030.28 ± 0.067.30 ± 1.40
Table 2. List of 24 mollusk species analyzed to construct a phylogenetic tree for Ruditapes philippinarum and R. variegatus with the maximum-likelihood method.
SpeciesFamilybp LengthGenBank
Accession No.
Calyptogena marissinicaVesicomyidae17,374NC_044766.1
Calyptogena extentaVesicomyidae16,106MF981085.1
Ectenagena elongataVesicomyidae16,827NC_051454.1
Pliocardia ponderosaVesicomyidae16,275MF981084.1
Pseudocardium sachalinenseMactridae17,978MG431821.1
Mactra antiquataMactridae17,199JQ423460.1
Mactra chinensisMactridae17,285KJ754823.1
Lutraria maximaMactridae17,082MF784266.1
Paphia amabilisVeneridae19,629JF969276.1
Paratapes textilisVeneridae18,561JF969277.1
Paratapes undulatusVeneridae18,154JF969278.1
Paphia euglyptaVeneridae18,643GU269271.1
Macridiscus multifariusVeneridae20,171NC_045888.1
Ruditapes decussatusVeneridae18,995KP089983.1
Dosinia altiorVeneridae17,536NC_037916.1
Dosinia troscheliVeneridae17,229NC_037917.1
Saxidomus purpurataVeneridae19,637KP419933.1
Callista chinensisVeneridae19,703MT742541.1
Meretrix lamarckiiVeneridae21,209GU071281.1
Villorita cyprinoidesVeneridae15,880NC_050989.1
Meretrix lyrataVeneridae21,625KC832317.1
Antigona lamellarisVeneridae17,532NC_051506.1
Sepia esculentaSepiidae16,199NC_009690.1
Crassostrea gigasOstreidae18,224MZ497416.1
Table 3. Gene content of the Ruditapes philippinarum genome.
Group of GenesGene Name
complex Ⅰ (NADH dehydrogenase)ND1, ND2, ND3, ND4, ND5, ND6, ND4L
complex Ⅳ (cytochrome c oxidase)COX1, COX2 (2 copies), COX3
ATP synthaseATP6, ATP8
other genesCYTB
transfer RNAstrnY-ATA, trnY-GTA, trnl-GAT, trnP-TGG, trnN-TTT, trnN-GTT (2 copies), trnH-GTG, trnE-TTC, trnS-TGA, trnS-TCT, trnM-CAT (2 copies), trnM-CAT, trnD-GTC, trnV-TAC (2 copies), trnF-GAA, trnW-TCA, trnR-TCG, trnG-TCC, trnQ-TTG, trnT-GCA, trnA-TGC, trnL-TAG, trnL-TAA
ribosomal RNAsRrnL, rrnS
origin of replicationD-loop
Table 4. Genomic features of Ruditapes philippinarum.
Ruditapes philippinarumA%C%G%T%GC%Size (bp)Proportion in Genome (%)
Whole genome30.29.8020.539.630.3022,706100
Protein-coding genes27.49.921.741.131.5714,45463.66
tRNA genes32.811.818.237.329.9716857.42
rRNA genes35.410.418.535.728.8720549.05
D-loop34.712.021.631.733.6517777.83
Table 5. Gene content of the Ruditapes variegatus genome.
Group of GenesGene Name
complex Ⅰ (NADH dehydrogenase)ND4, ND3, ND5, ND4L, ND6, ND1, ND2
complex Ⅳ (cytochrome c oxidase)COX2, COX3, COX1
ATP synthaseATP8, ATP6
other genesCYTB
transfer RNAstrnC-GCA (2 copies), trnP-AGG, trnl-GAT, trnE-TTC, trnH-GTG, trnS-TGA, trnY-GAT, trnD-GTC, trnM-CAT, trnN-TTT, trnN-GTT, trnV-TAC, trnG-TCC, trnF-GAA, trnW-TCA, trnR-TCG, trnL-TAA, trnL-TAG, trnQ-TTG, trnT-TGT, trnA-TGC
ribosomal RNAsrrnL, rrnS
origin of replicationD-loop
Table 6. Genomic features of Ruditapes variegatus.
Ruditapes variegatusA%C%G%T%GC%Size (bp)Proportion in Genome (%)
Whole genome28.110.725.735.536.420,997100
Protein-coding genes24.710.826.238.337.012,37859.0
tRNA genes30.912.722.733.735.414146.7
rRNA genes33.511.322.133.133.4220710.5
D-loop33.49.427.130.136.5389218.5
Table 7. Genomic organization and expression profile of the mitochondrial protein-coding genes in Ruditapes philippinarum and R. variegatus.
Ruditapes philippinarumRuditapes variegatus
Gene NameLengthStart CodonStop CodonDirectionGene
Name
LengthStart
Codon
Stop
Codon
Direction
COX11719ATATAG+COX11758GTGTAG+
ND1930ATATAA+ND1933ATGTAG+
ND21035ATTTAG+ND21029ATGTAG+
ND4L282ATTTAA+COX21416TTGTAG+
COX21995ATCTAA+CYTB1239ATTTAA+
COX21608ATATAA+ATP8120TTGTAA+
CYTB1224ATTTAA+ND41356ATGTAA+
ATP8120ATTTAG+ATP6735ATGTAG+
ND41359ATGTAA+ND3405ATGTAA+
ATP6738ATATAG+ND51704GTGTAA+
ND3405GTGTAA+ND4L279ATGTAG+
ND51665TTGTAA+ND6522ATGTAG+
ND6510TTGTAA+COX3882ATTTAA+
COX3864ATTTAA+
Table 8. Codon number and relative synonymous codon usage (RSCU) in the mitochondrial genomes of Ruditapes philippinarum and R. variegatus.
Ruditapes philippinarumRuditapes variegatus
CodonCountRSCUCodonCountRSCUCodonCountRSCUCodonCountRSCU
UUU(F)4301.74GCG(A)90.19UUU(F)3241.68GCG(A)370.76
UUC(F)630.26UAU(Y)1711.65UUC(F)610.32UAU(Y)1401.56
UUA(L)4303.59UAC(Y)360.35UUA(L)2653.04UAC(Y)400.44
UUG(L)1160.97CAU(H)731.83UUG(L)1391.59CAU(H)461.48
CUU(L)1040.87CAC(H)70.17CUU(L)390.45CAC(H)160.52
CUC(L)20.02CAA(Q)381.27CUC(L)70.08CAA(Q)381.25
CUA(L)550.46CAG(Q)220.73CUA(L)430.49CAG(Q)230.75
CUG(L)120.1AAU(N)1531.72CUG(L)300.34AAU(N)721.45
AUU(I)2391.38AAC(N)250.28AUU(I)1741.49AAC(N)270.55
AUC(I)290.17AAA(K)1381.45AUC(I)250.21AAA(K)711.06
AUA(M)2531.46AAG(K)530.55AUA(M)1511.29AAG(K)630.94
AUG(M)791GAU(D)991.61AUG(M)981GAU(D)771.62
GUU(V)2381.84GAC(D)240.39GUU(V)1541.42GAC(D)180.38
GUC(V)250.19GAA(E)910.98GUC(V)200.18GAA(E)660.94
GUA(V)1951.51GAG(E)951.02GUA(V)1341.23GAG(E)741.06
GUG(V)590.46UGU(C)1051.74GUG(V)1271.17UGU(C)881.6
UCU(S)1412.5UGC(C)160.26UCU(S)681.81UGC(C)220.4
UCC(S)120.21UGA(W)653UCC(S)100.27UGA(W)393
UCA(S)460.81UGG(W)721UCA(S)340.91UGG(W)651
UCG(S)120.21CGU(R)350.65UCG(S)320.85CGU(R)300.62
CCU(P)822.25CGC(R)00CCU(P)662.13CGC(R)30.06
CCC(P)110.3CGA(R)300.55CCC(P)80.26CGA(R)180.37
CCA(P)421.15CGG(R)140.26CCA(P)351.13CGG(R)290.6
CCG(P)110.3AGU(S)1121.98CCG(P)150.48AGU(S)621.65
ACU(T)1042.52AGC(S)160.28ACU(T)571.93AGC(S)190.51
ACC(T)60.15AGA(R)1542.84ACC(T)70.24AGA(R)901.86
ACA(T)441.07AGG(R)921.7ACA(T)301.02AGG(R)1212.49
ACG(T)110.27GGU(G)1801.74ACG(T)240.81GGU(G)981.11
GCU(A)1292.73GGC(G)120.12GCU(A)1032.11GGC(G)170.19
GCC(A)110.23GGA(G)900.87GCC(A)190.39GGA(G)881
GCA(A)400.85GGG(G)1311.27GCA(A)360.74GGG(G)1491.69
Publisher’s Note: MDPI stays neutral with regard to jurisdictional claims in published maps and institutional affiliations.