
Analysis of the Small Auxin-Up RNA (SAUR) Genes Regulating Root Growth Angle (RGA) in Apple

Abstract
1. Introduction
2. Results
2.1. Identification of SAUR Gene Family in Apple Genome GDDH13
2.2. Phylogenetic Relationships of SAUR Genes in Arabidopsis and Apple
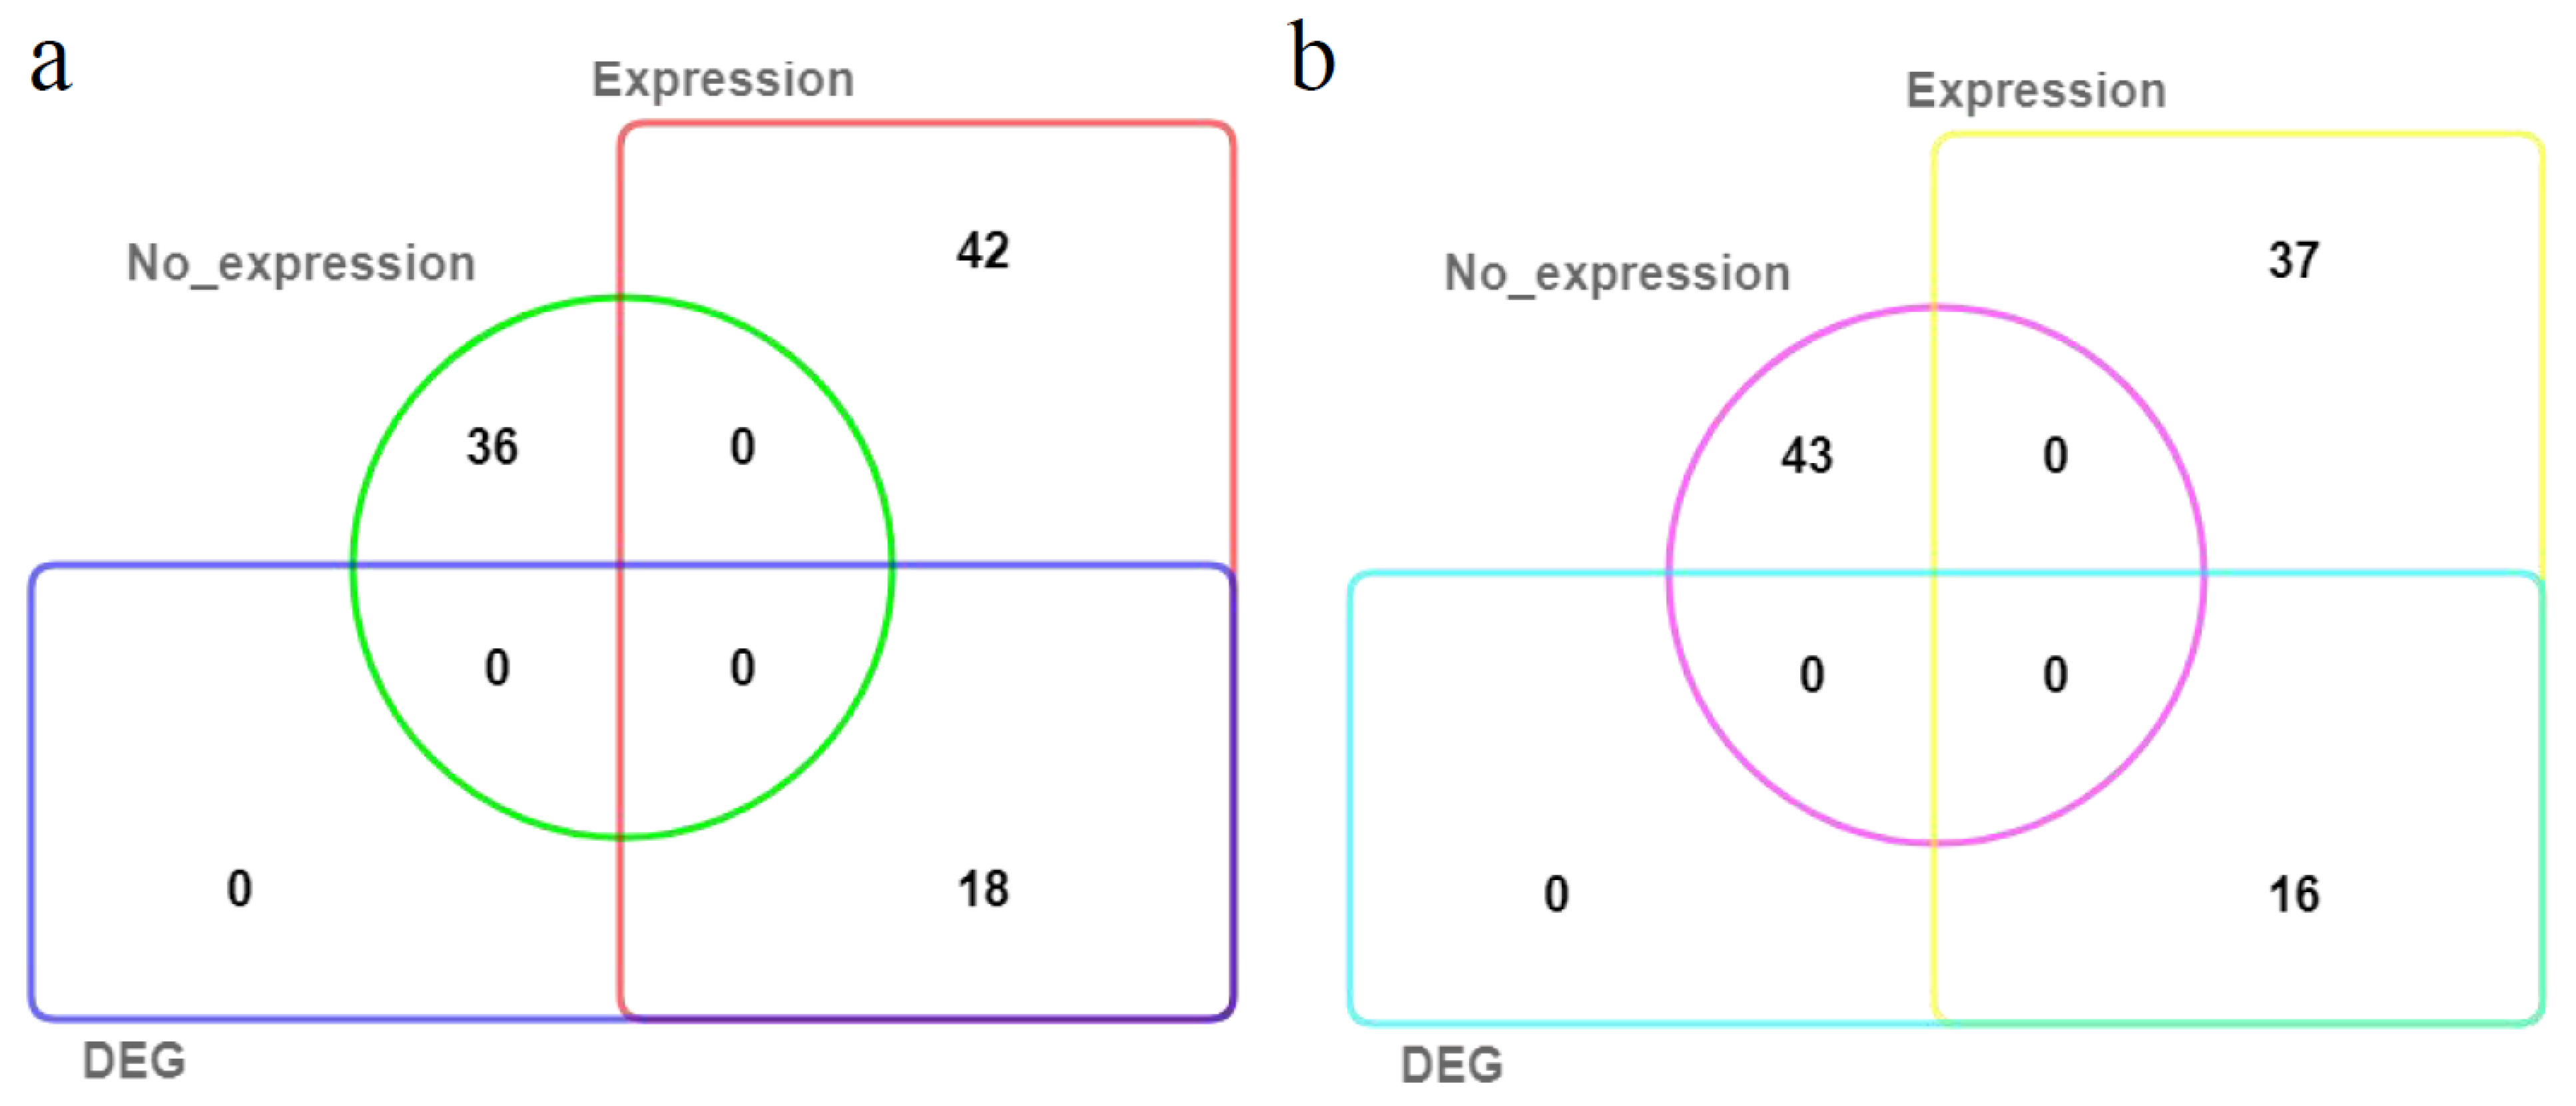
2.3. Expression Analysis of MdSAUR Genes in Stems and Roots
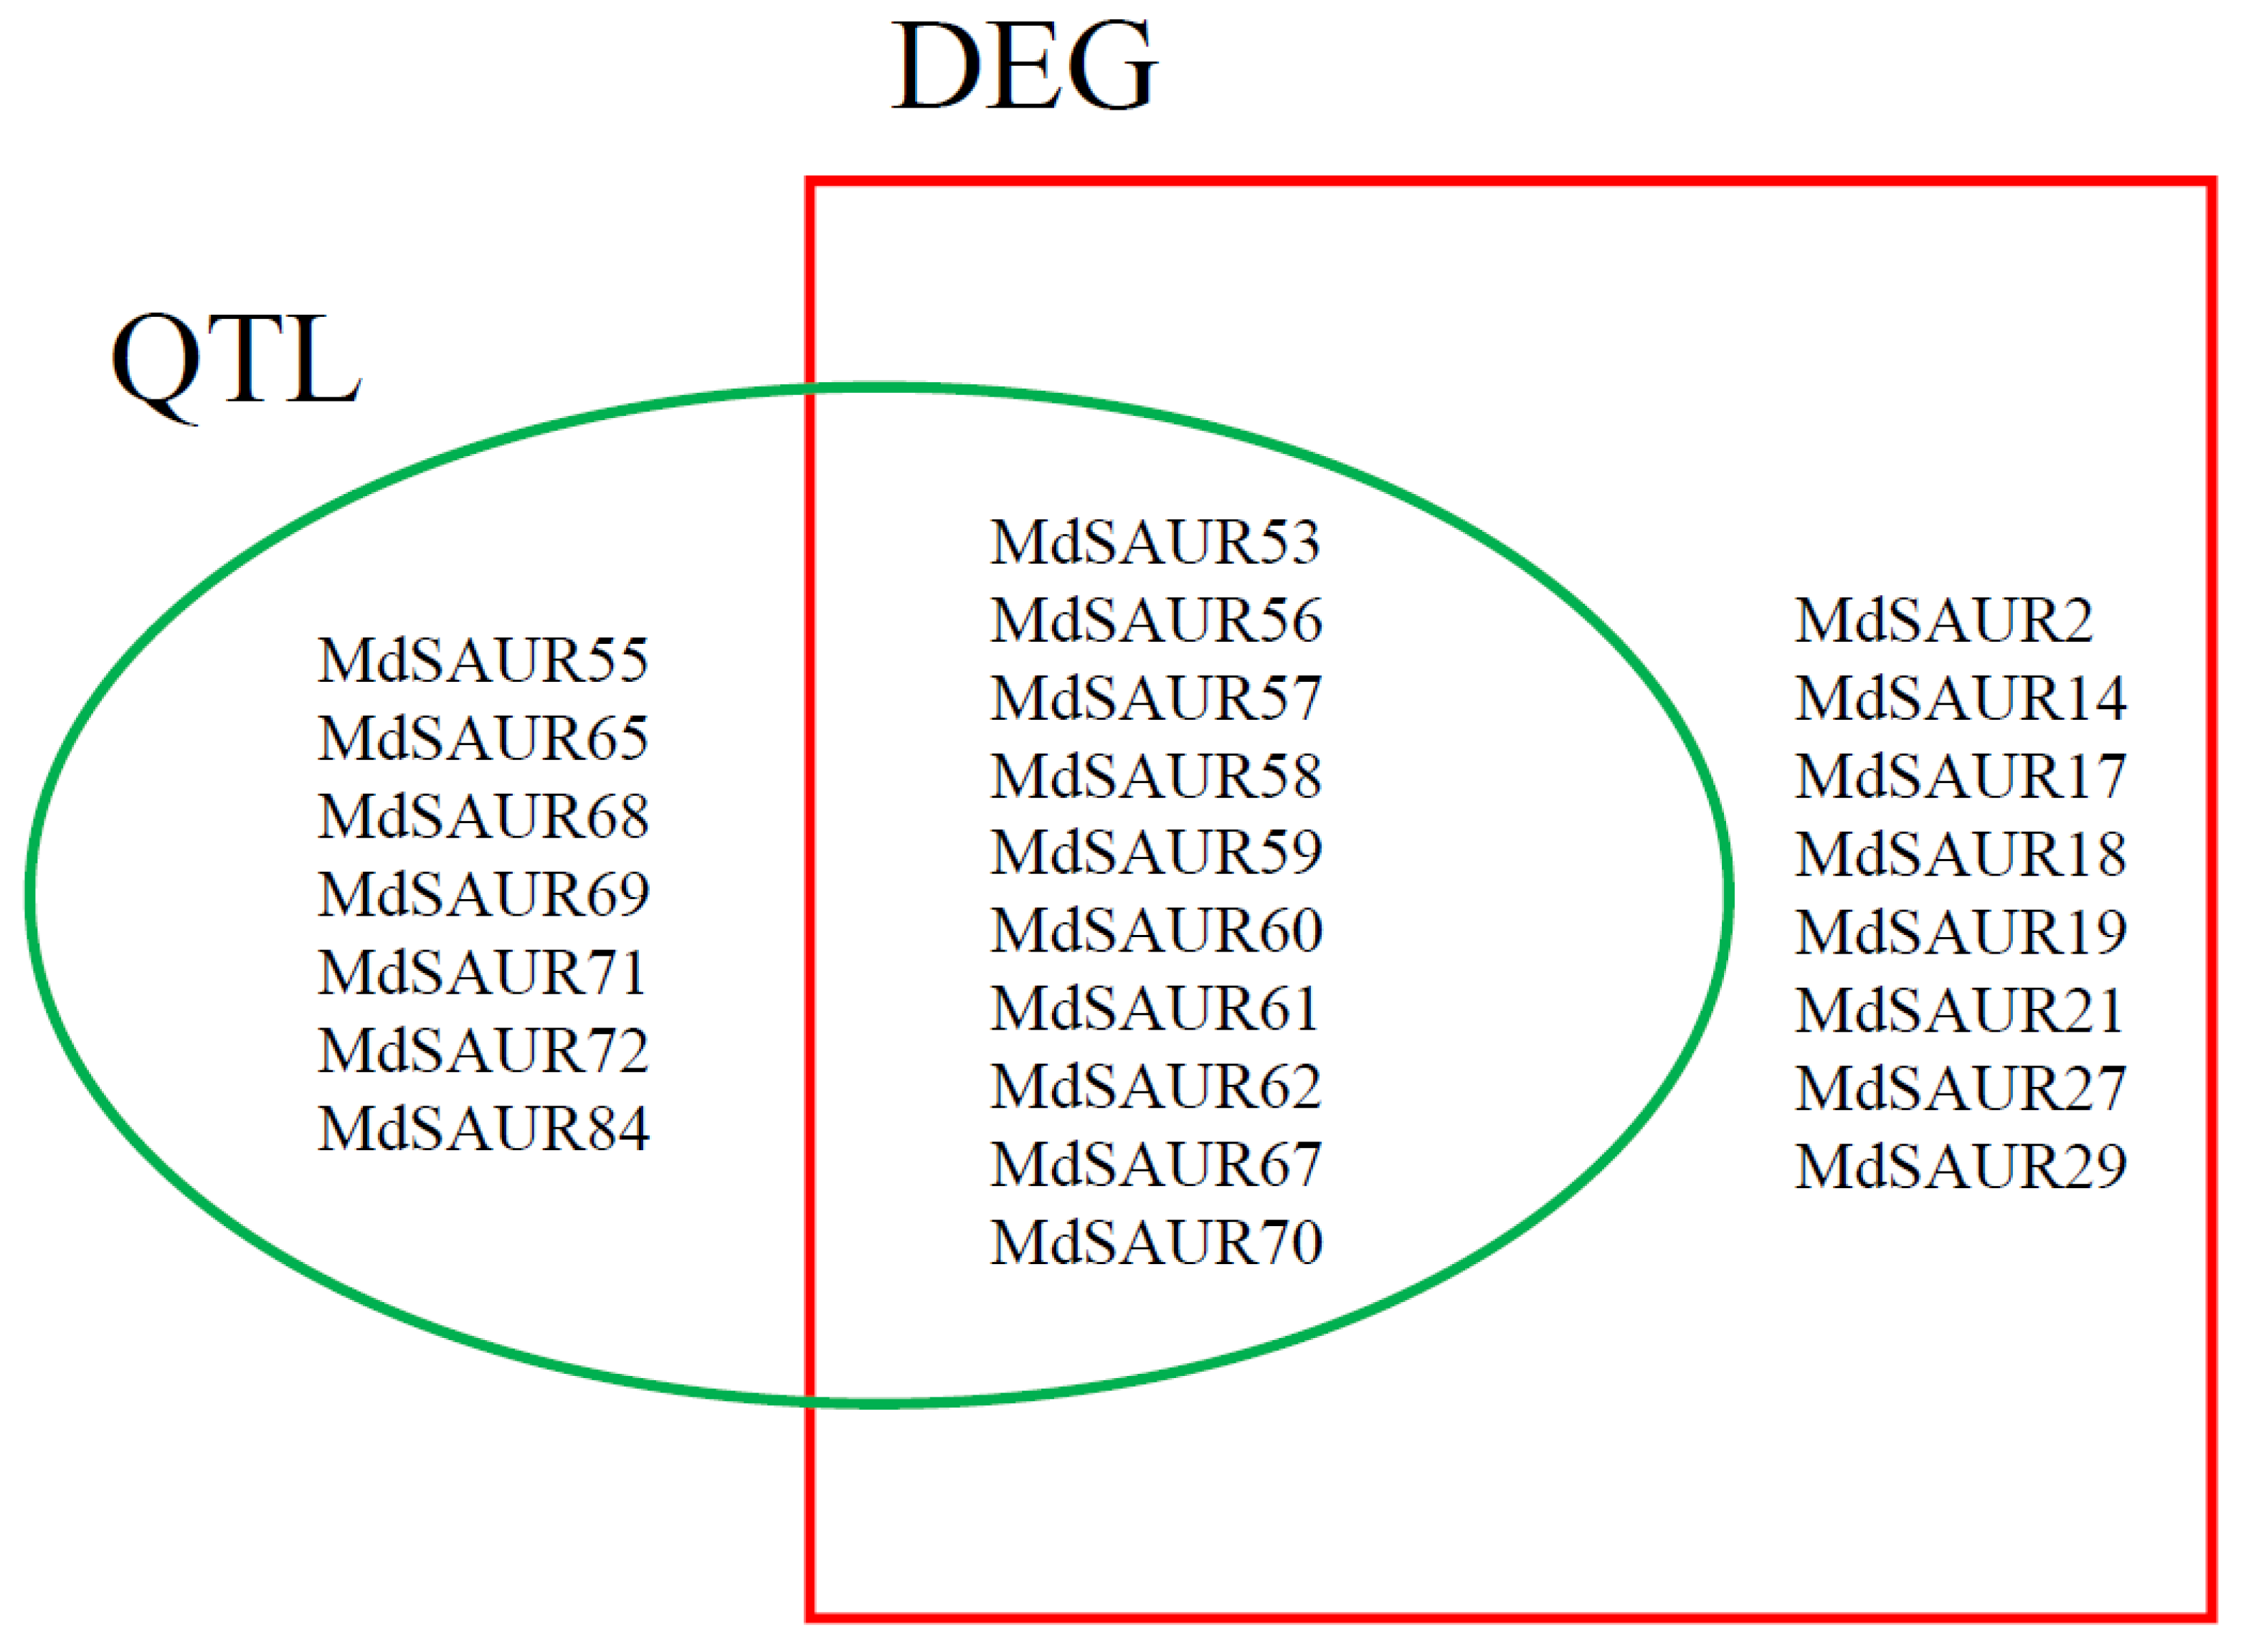
2.4. Co-Localization of MdSAURs with QTL for RGA
2.5. Joint Screening of Candidate MdSAURs Regulating RGA
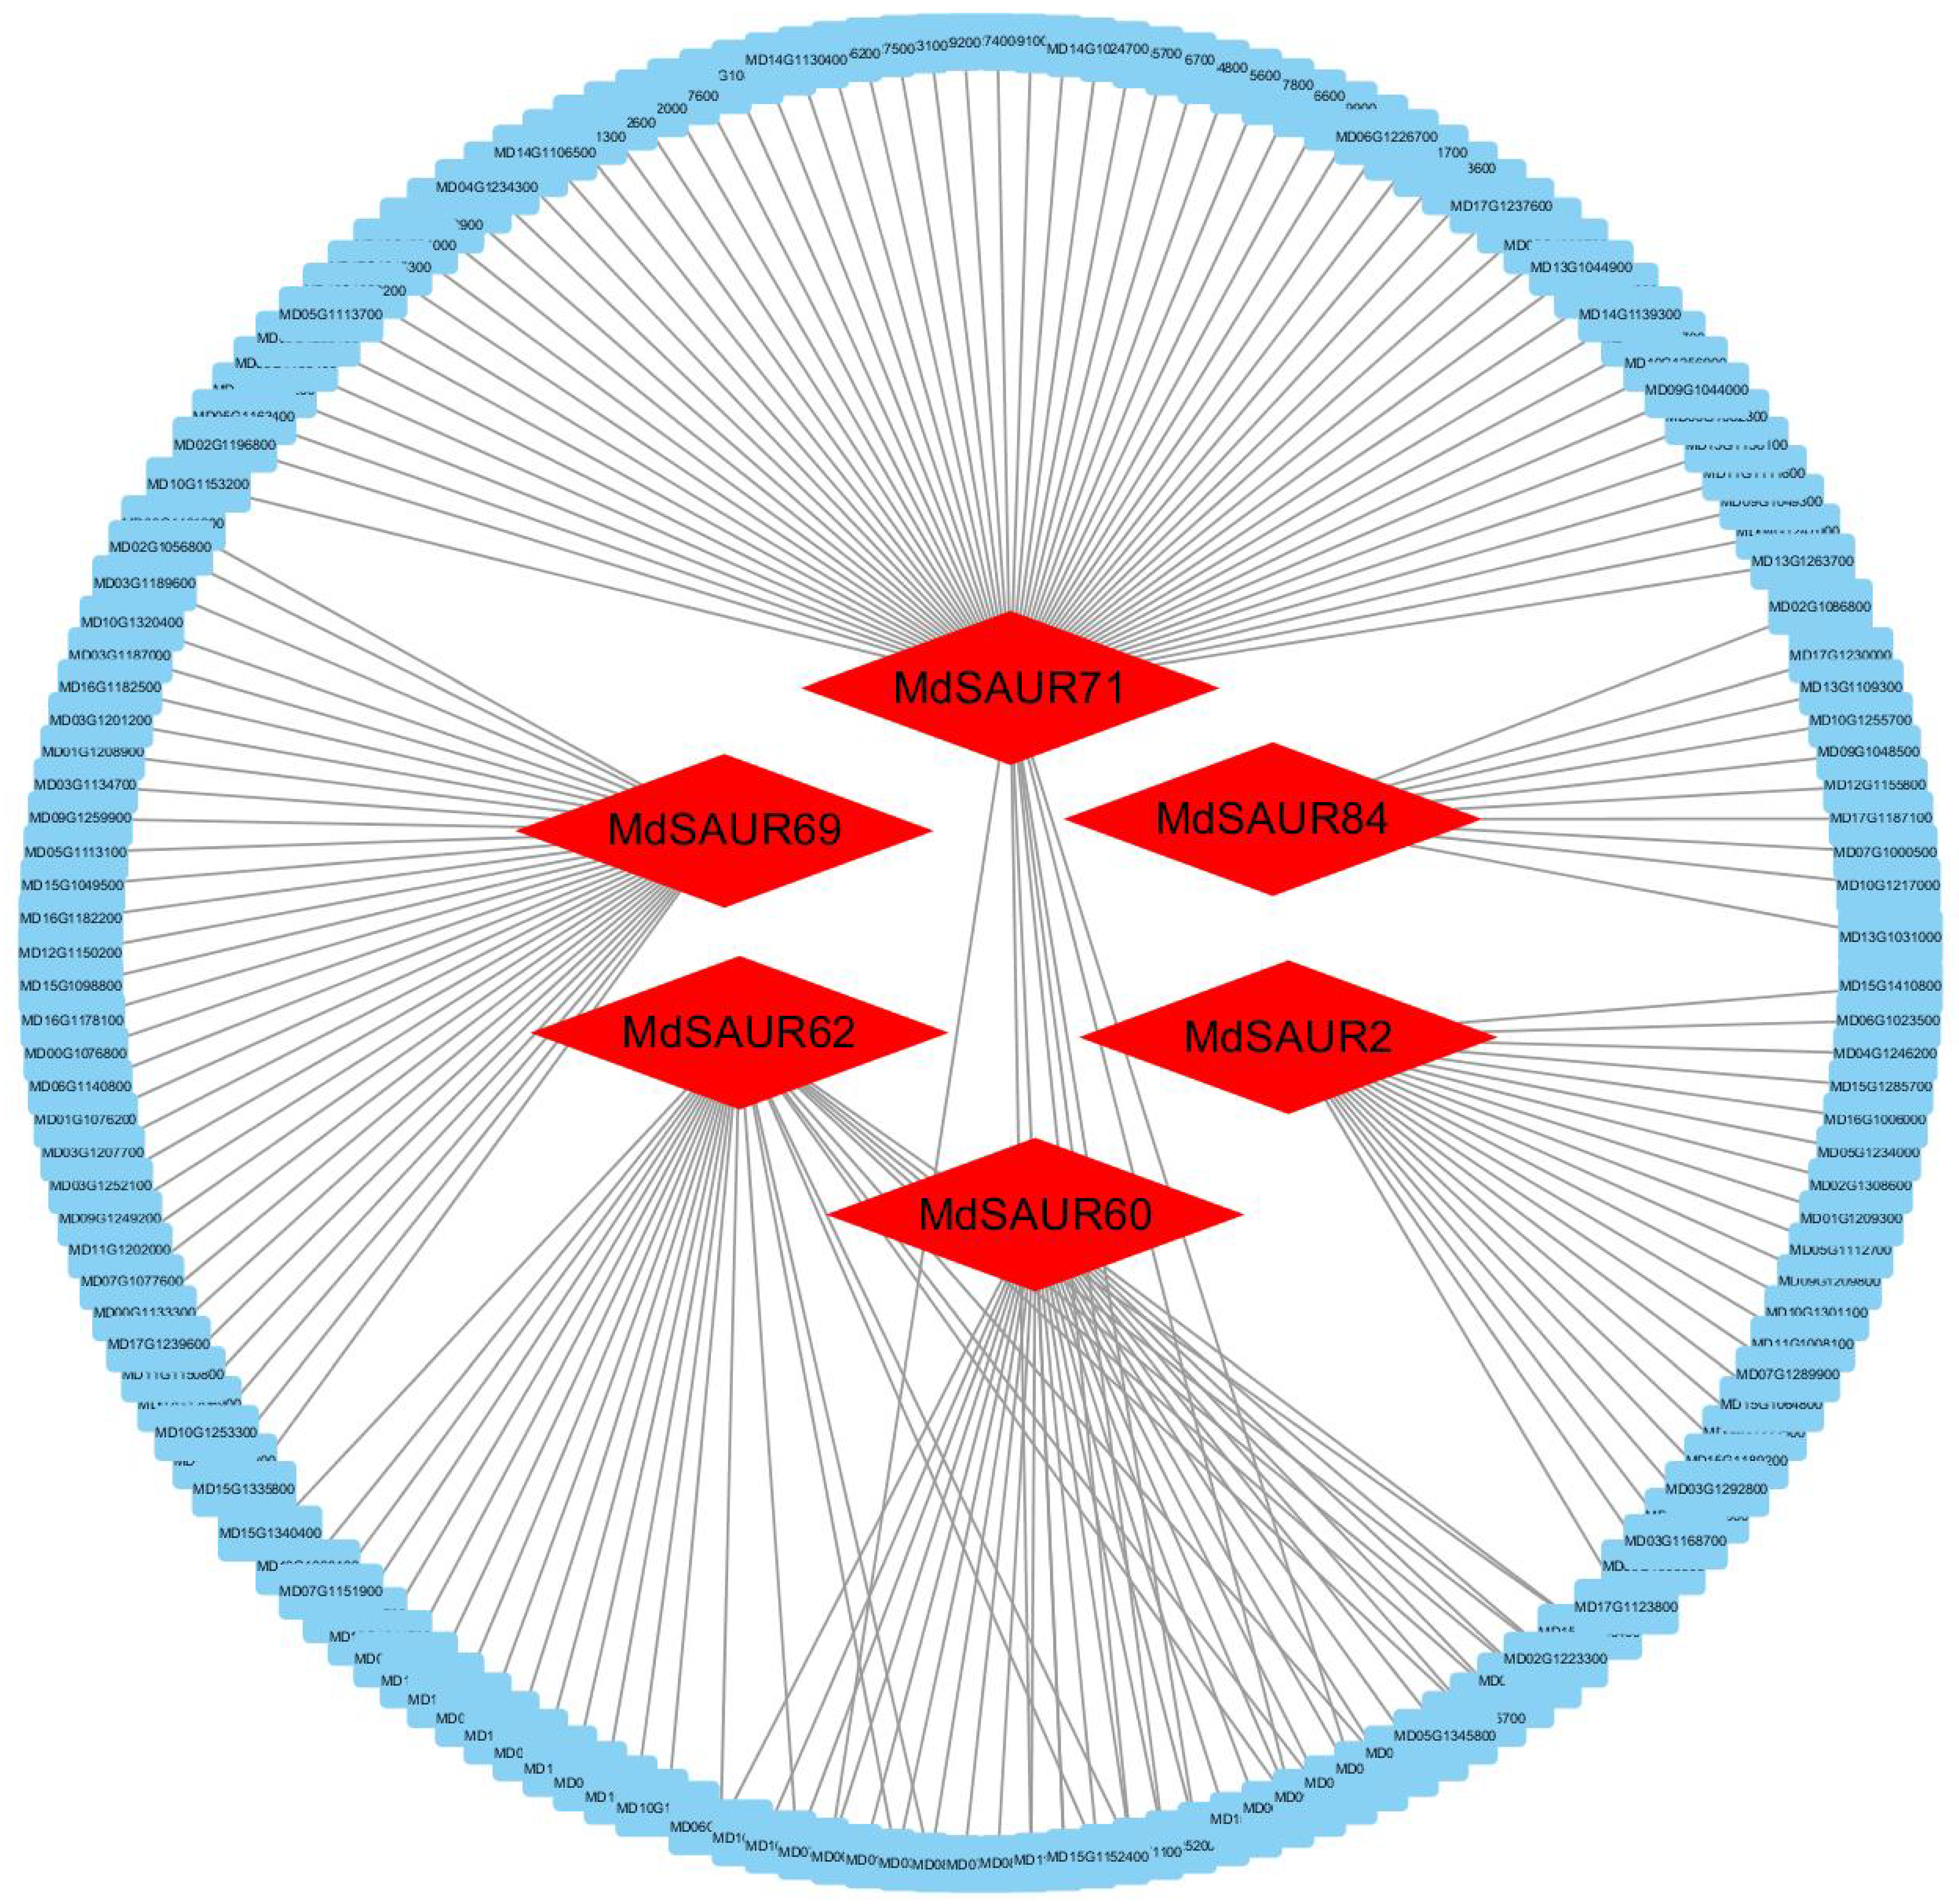
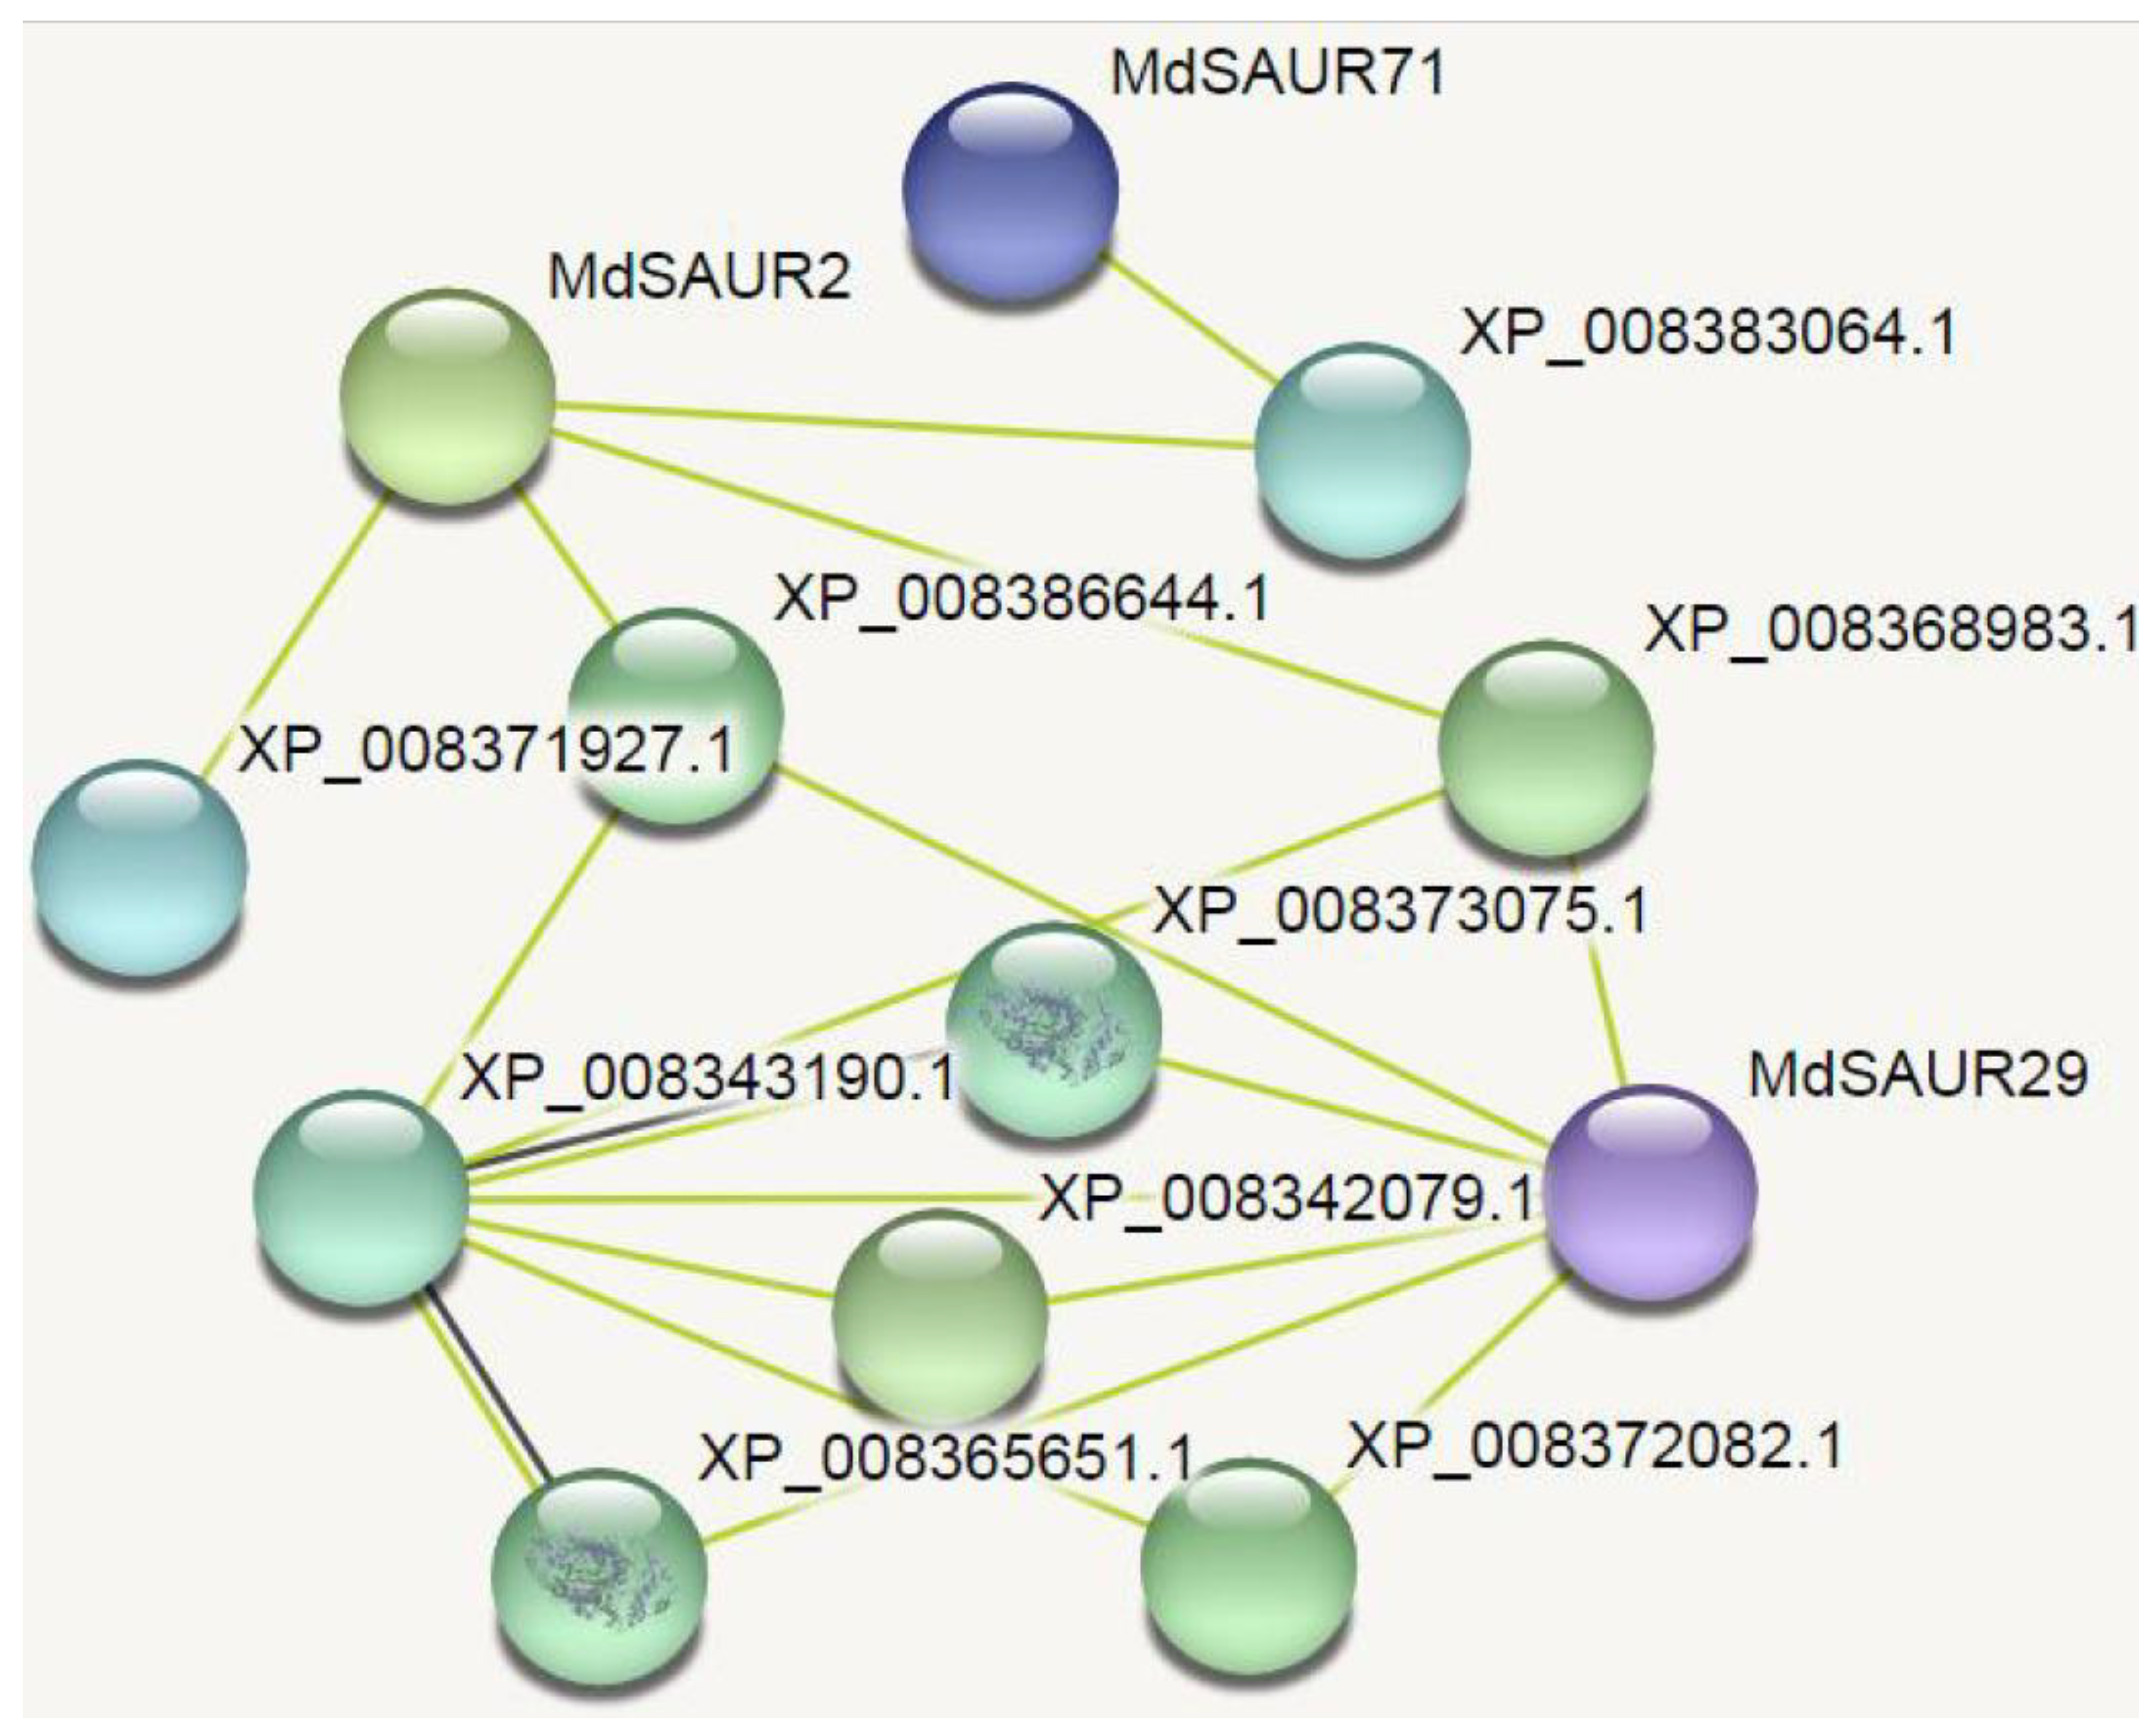
2.6. Network Analysis of Candidate MdSAURs
2.7. Protein–Protein Interaction Analysis of Candidate MdSAURs
2.8. Function Analysis of Primary Candidate MdSAURs
3. Discussion
3.1. MdSAUR Gene Family in Apple Genome GDDH13
3.2. Differential Expression of MdSAUR Genes
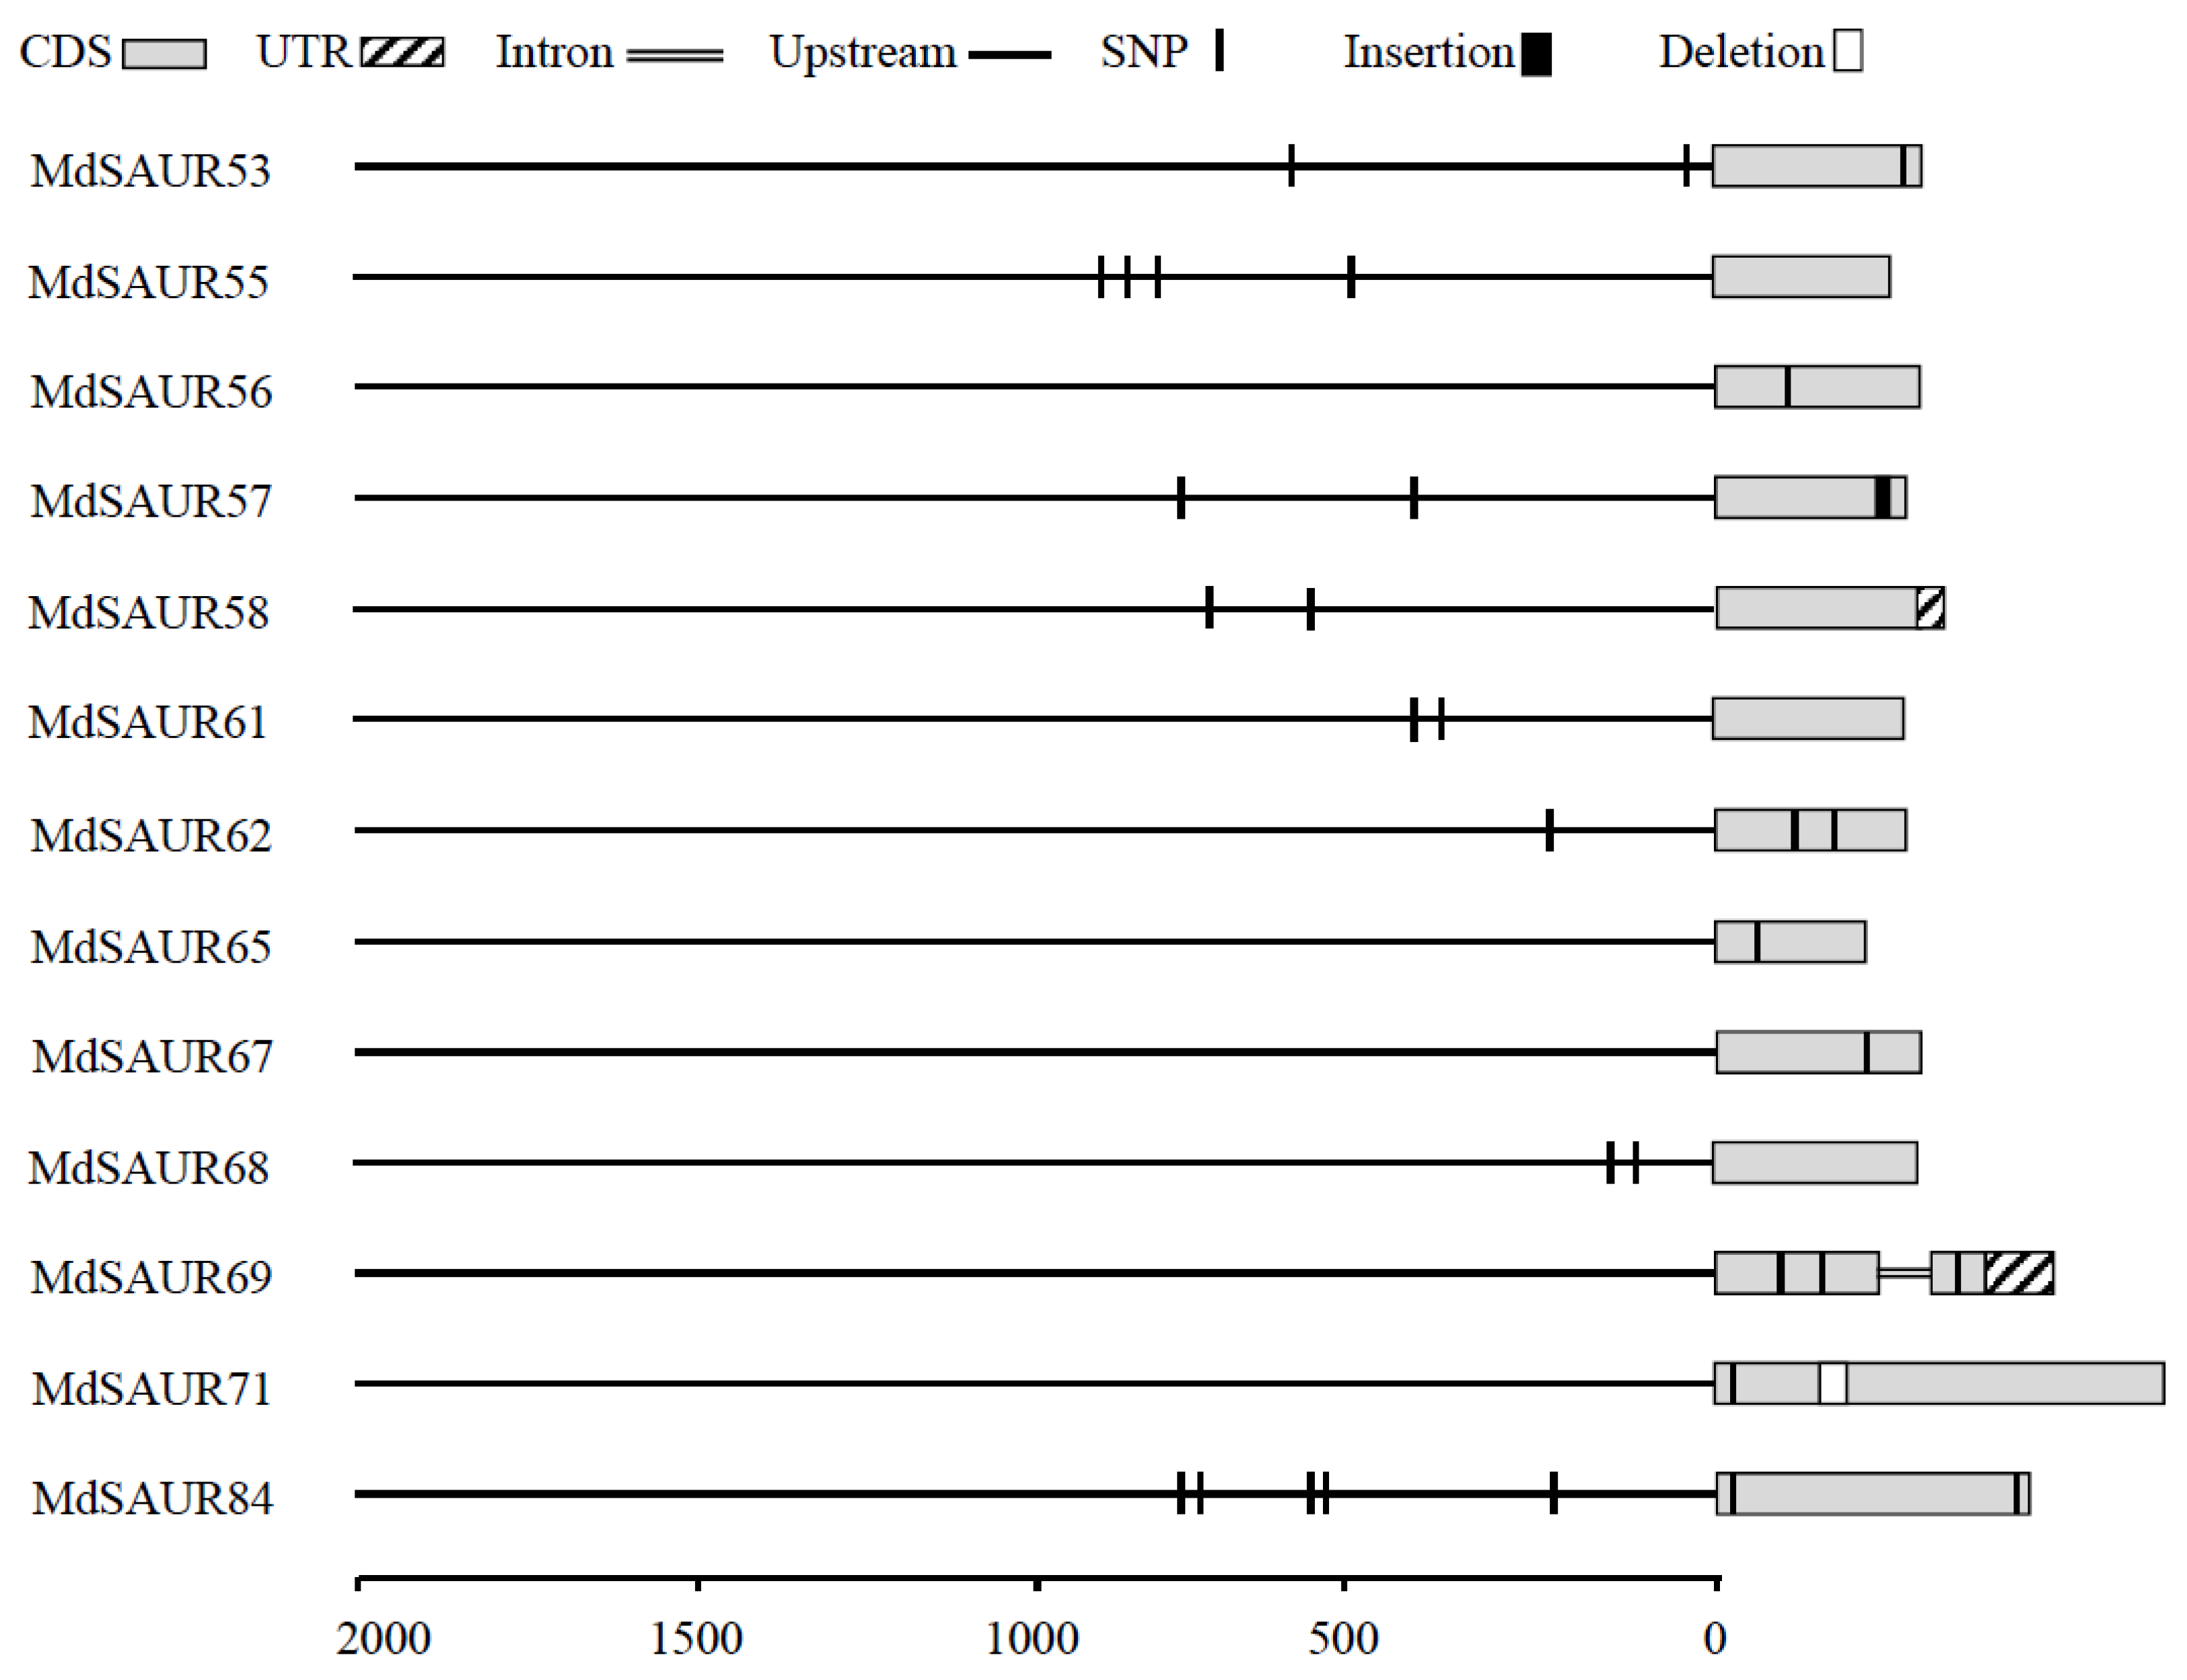
3.3. Allelic Variations and Gene Structures of MdSAUR Genes in QTLs
3.4. Primary Candidate MdSAURs for RGA Formation
4. Materials and Methods
4.1. Sequence Retrieval and Characterization Analysis
4.2. Phylogenetic Analysis in Arabidopsis, Rice, and Apple
4.3. Gene Expression and qRT-PCR Analysis
4.4. Gene Structure and Allelic Variations Analysis
4.5. Network Analysis
4.6. Statistical Analysis
5. Conclusions
Supplementary Materials
Author Contributions
Funding
Institutional Review Board Statement
Informed Consent Statement
Data Availability Statement
Acknowledgments
Conflicts of Interest
References
- Jia, D.; Shen, F.; Wang, Y.; Wu, T.; Xu, X.; Zhang, X.; Han, Z. Apple fruit acidity is genetically diversified by natural variations in three hierarchical epistatic genes: MdSAUR37, MdPP2CH and MdALMTII. Plant J. 2018, 95, 427–443. [Google Scholar] [CrossRef] [PubMed]
- Ma, L.; Hou, C.; Zhang, X.; Li, H.; Wang, Y.; Han, Z. Seasonal growth and spatial distribution of apple tree roots on different rootstocks or interstems. J. Am. Soc. Hortic. Sci. 2013, 138, 79–87. [Google Scholar] [CrossRef]
- Maeght, J.L.; Rewald, B.; Pierret, A. How to study deep roots-and why it matters. Front. Plant Sci. 2013, 4, 299. [Google Scholar] [CrossRef] [PubMed]
- Uga, Y.; Sugimoto, K.; Ogawa, S.; Rane, J.; Ishitani, M.; Hara, N.; Kitomi, Y.; Inukai, Y.; Ono, K.; Kanno, N.; et al. Control of root system architecture by DEEPER ROOTING 1 increases rice yield under drought conditions. Nat. Genet. 2013, 45, 1097–1102. [Google Scholar] [CrossRef] [PubMed]
- Bastien, R.; Bohr, T.; Moulia, B.; Douady, S. Unifying model of shoot gravitropism reveals proprioception as a central feature of posture control in plants. Proc. Natl. Acad. Sci. USA 2013, 110, 755–760. [Google Scholar] [CrossRef]
- Feraru, M.I.; Kleine-Vehn, J.; Feraru, E. Auxin carrier and signaling dynamics during gravitropic root growth. Methods Mol. Biol. 2015, 1309, 71–80. [Google Scholar]
- Liscum, E.; Reed, J.W. Genetics of Aux /IAA and ARF action in plant growth and development. Plant Mol. Biol. 2002, 49, 387–400. [Google Scholar] [CrossRef]
- Fukaki, H.; Tameda, S.; Masuda, H.; Tasaka, M. Lateral root formation is blocked by a gain-of-function mutation in the SOLITARY-ROOT/IAA14 gene of Arabidopsis. Plant J. 2002, 29, 153–168. [Google Scholar] [CrossRef]
- Yang, X.; Lee, S.; So, J.; Dharmasiri, S.; Dharmasiri, N.; Ge, L.; Jensen, C.; Hangarter, R.; Hobbie, L.; Estelle, M. The IAA1 protein is encoded by AXR5 and is a substrate of SCFTIR1. Plant J. 2004, 40, 772–782. [Google Scholar] [CrossRef]
- Park, J.; Park, J.; Kim, Y.; Staswick, P.; Jeon, J.; Yun, J.; Kim, S.; Kim, J.; Lee, Y.; Park, C. GH3-mediated auxin homeostasis links growth regulation with stress adaptation response in Arabidopsis. J. Biol. Chem. 2007, 282, 10036–10046. [Google Scholar] [CrossRef]
- Hui, S.; Zhang, M.; Hao, M.; Yuan, M. Rice group I GH3 gene family, positive regulators of bacterial pathogens. Plant Signal. Behav. 2019, 14, 5. [Google Scholar] [CrossRef] [PubMed]
- Quint, M.; Gray, W.M. Auxin signaling. Curr. Opin. Plant Biol. 2006, 9, 448–453. [Google Scholar] [CrossRef] [PubMed]
- Xu, Y.; Xiao, M.; Liu, Y.; Fu, J.; He, Y.; Jiang, D. The small auxin-up RNA OsSAUR45 affects auxin synthesis and transport in rice. Plant Mol. Biol. 2017, 94, 97–107. [Google Scholar] [CrossRef] [PubMed]
- Newman, T.C.; Ohme-Takagi, M.; Taylor, C.B.; Green, P.J. DST sequences, highly conserved among plant SAUR genes, target reporter transcripts for rapid decay in tobacco. Plant Cell 1993, 5, 701–714. [Google Scholar]
- Esmon, C.; Tinsley, A.; Ljung, K.; Sandberg, G.; Hearne, L.; Liscum, E. A gradient of auxin and auxin-dependent transcription precedes tropic growth responses. Proc. Natl. Acad. Sci. USA 2006, 103, 236–241. [Google Scholar] [CrossRef]
- Spartz, A.; Lee, S.; Wenger, J.; Gonzalez, N.; Itoh, H.; Inze, D.; Peer, W.; Murphy, A.; Overvoorde, P.; Gray, W. The SAUR19 subfamily of small auxin-up RNA genes promote cell expansion. Plant J. 2012, 70, 978–990. [Google Scholar] [CrossRef]
- McClure, B.A.; Guilfoyle, T. Characterization of a class of small auxin-inducible soybean polyadenylated RNAs. Plant Mol. Biol. 1987, 9, 611–623. [Google Scholar] [CrossRef]
- Ren, H.; Gray, W.M. SAUR proteins as effectors of hormonal and environmental signals in plant growth. Mol. Plant 2015, 8, 1153–1164. [Google Scholar] [CrossRef]
- Bai, Q.; Hou, D.; Li, L.; Cheng, Z.; Ge, W.; Liu, J.; Li, X.; Mu, S.; Gao, J. Genome-wide analysis and expression characteristics of small auxin-up RNA (SAUR) genes in Moso bamboo (Phyllostachys edulis). Genome 2016, 60, 325–336. [Google Scholar] [CrossRef]
- Hu, W.; Yan, H.; Luo, S.; Pan, F.; Wang, Y.; Xiang, Y. Genome-wide analysis of poplar SAUR gene family and expression profiles under cold, polyethylene glycol and indole-3-acetic acid treatments. Plant Physiol. Biochem. 2018, 128, 50. [Google Scholar] [CrossRef]
- Velasco, R.; Zharkikh, A.; Affourtit, J.; Dhingra, A.; Cestaro, A.; Kalyanaraman, A.; Fontana, P.; Bhatnagar, S.; Troggio, M.; Pruss, D.; et al. The genome of the domesticated apple (Malus × domestica). Nat. Genet. 2010, 42, 833–839. [Google Scholar] [CrossRef] [PubMed]
- Wang, P.; Lu, S.; Xie, M.; Wu, M.; Ding, S.; Khaliq, A.; Ma, Z.; Mao, J.; Chen, B. Identification and expression analysis of the small auxin-up RNA (SAUR) gene family in apple by inducing of auxin. Gene 2020, 21, 550. [Google Scholar] [CrossRef] [PubMed]
- Daccord, N.; Celton, J.M.; Linsmith, G.; Becker, C.; Choisne, N.; Schijlen, E.; van de Geest, H.; Bianco, L.; Micheletti, D.; Velasco, R.; et al. High-quality de novo assembly of the apple genome and methylome dynamics of early fruit development. Nat. Genet. 2017, 49, 1099–1106. [Google Scholar] [CrossRef] [PubMed]
- Liu, J.; Shen, F.; Xiao, Y.; Fang, H.; Qiu, C.; Li, W.; Wu, T.; Xu, X.; Wang, Y.; Zhang, X.; et al. Genomics-assisted prediction of salt and alkali tolerances and functional marker development in apple rootstocks. BMC Genom. 2020, 21, 550. [Google Scholar] [CrossRef]
- Zheng, C.; Shen, F.; Wang, Y.; Wu, T.; Xu, X.; Zhang, X.; Han, Z. Intricate genetic variation networks control the adventitious root growth angle in apple. BMC Genom. 2020, 21, 852. [Google Scholar] [CrossRef]
- Hagen, G.; Guilfoyle, T.J. Auxin-responsive gene expression: Genes, promoters and regulatory factors. Plant Mol. Biol. 2002, 49, 373–385. [Google Scholar] [CrossRef]
- Jain, M.; Tyagi, A.K.; Khurana, J.P. Genome-wide analysis, evolutionary expansion, and expression of early auxin-responsive SAUR gene family in rice (Oryza sativa). Genomics 2006, 88, 360–371. [Google Scholar] [CrossRef]
- Wang, S.; Bai, Y.; Shen, C.; Wu, Y.; Zhang, S.; Jiang, D.; Guilfoyle, T.; Chen, M.; Qi, Y. Auxin-related gene families in abiotic stress response in Sorghum bicolor. Funct. Integr. Genom. 2010, 10, 533–546. [Google Scholar] [CrossRef]
- Park, J.E.; Kim, Y.S.; Yoon, H.K.; Park, C.M. Functional characterization of a small auxin-up RNA gene in apical hook development in Arabidopsis. Plant Sci. 2007, 172, 150–157. [Google Scholar] [CrossRef]
- Kant, S.; Bi, Y.M.; Zhu, T.; Rothstein, S.J. SAUR39, a small auxin-up RNA gene, acts as a negative regulator of auxin synthesis and transport in rice. Plant Physiol. 2009, 151, 691–701. [Google Scholar] [CrossRef]
- Chen, Y.; Hao, X.; Cao, J. Small auxin upregulated RNA (SAUR) gene family in maize: Identification, evolution, and its phylogenetic comparison with Arabidopsis, rice, and sorghum. J. Integr. Plant Biol. 2014, 56, 133–150. [Google Scholar] [CrossRef] [PubMed]
- Zhang, N.; Huang, X.; Bao, Y.; Wang, B.; Zeng, H.; Cheng, W.; Tang, M.; Li, Y.; Ren, J.; Sun, Y. Genome-wide identification of SAUR genes in watermelon (Citrullus lanatus). Physiol. Mol. Biol. Plants 2017, 23, 619–628. [Google Scholar] [CrossRef] [PubMed]
- Li, X.; Liu, G.; Geng, Y.; Wu, M.; Pei, W.; Zhai, H.; Zang, X.; Li, X.; Zhang, J.; Yu, S.; et al. A genome-wide analysis of the small auxin-up RNA (SAUR) gene family in cotton. BMC Genom. 2017, 18, 815. [Google Scholar] [CrossRef] [PubMed]
- Wu, J.; Liu, S.; He, Y.; Guan, X.; Zhu, X.; Cheng, L.; Wang, J.; Lu, G. Genome-wide analysis of SAUR gene family in Solanaceae species. Gene 2012, 509, 38–50. [Google Scholar] [CrossRef] [PubMed]
- Paponov, I.; Paponov, M.; Teale, W.; Menges, M.; Chakrabortee, S.; Murray, J.; Palme, K. Comprehensive transcriptome analysis of auxin responses in Arabidopsis. Mol. Plant 2008, 1, 321–337. [Google Scholar] [CrossRef] [PubMed]
- Huang, X.; Bao, Y.; Wang, B.; Liu, L.; Chen, J.; Dai, L.; Baloch, S.; Peng, D. Identification of small auxin-up RNA (SAUR) genes in Urticales plants: Mulberry (Morus notabilis), hemp (Cannabis sativa) and ramie (Boehmeria nivea). J. Genet. 2016, 95, 119–129. [Google Scholar] [CrossRef] [PubMed]
- Sozzani, R.; Iyer-Pascuzzi, A. Postembryonic control of root meristem growth and development. Curr. Opin. Plant Biol. 2014, 17, 7–12. [Google Scholar] [CrossRef]
- Lopez, J.; Erickson, J.; Munoz, P.; Saballos, A.; Felderhoff, T.; Vermerris, W. QTLs associated with crown root angle stomatal conductance and maturity in sorghum. Plant Genome 2017, 10. [Google Scholar] [CrossRef]
- Uga, Y.; Kitomi, Y.; Yamamoto, E.; Kanno, N.; Kawai, S.; Mizubayashi, T.; Fukuoka, S. A QTL for root growth angle on rice chromosome 7 is involved in the genetic pathway of DEEPER ROOTING 1. Rice 2015, 8, 8. [Google Scholar] [CrossRef]
- Christopher, J.; Christopher, M.; Jennings, R.; Jones, S.; Fletcher, S.; Borrell, A.; Manschadi, A.; Jordan, D.; Mace, E.; Hammer, G. QTL for root angle and number in a population developed from bread wheats (Triticum aestivum) with contrasting adaptation to water-limited environments. Theor. Appl. Genet. 2013, 126, 1563–1574. [Google Scholar] [CrossRef]
- Xie, R.; Dong, C.; Ma, Y.; Deng, L.; He, S.; Yi, S.; Lv, Q.; Zheng, Y. Comprehensive analysis of SAUR gene family in citrus and its transcriptional correlation with fruitlet drop from abscission zone A. Funct. Integr. Genom. 2015, 15, 729–740. [Google Scholar] [CrossRef] [PubMed]
- Da, L.; Liu, Y.; Yang, J.; Tian, T.; She, J.; Ma, X.; Xu, W.; Su, Z. AppleMDO: A multi-dimensional omics database for apple co-expression networks and chromatin states. Front. Plant Sci. 2019, 10, 1333. [Google Scholar] [CrossRef] [PubMed]
- Szklarczyk, D.; Gable, A.; Nastou, K.; Lyon, D.; Kirsch, R.; Pyysalo, S.; Doncheva, N.; Legeay, M.; Fang, T.; Bork, P.; et al. The STRING database in 2021: Customizable protein-protein networks, and functional characterization of user-uploaded gene/measurement sets. Nucleic Acids Res. 2021, 49, D605–D612. [Google Scholar] [CrossRef]
- Schneider, H.; Lor, V.; Hanlon, M.; Perkins, A.; Kaeppler, S.; Borkar, A.; Bhosale, R.; Zhang, X.; Rodriguez, J.; Bucksch, A.; et al. Root angle in maize influences nitrogen capture and is regulated by calcineurin B-like protein (CBL)-interacting serine/threonine-protein kinase 15 (ZmCIPK15). Plant Cell Environ. 2021, 45, 837–853. [Google Scholar] [CrossRef]
- Kirschner, G.; Rosignoli, S.; Guo, L.; Vardanega, I.; Imani, J.; Altmüller, J.; Milner, S.; Balzano, R.; Nagel, K.; Pflugfelder, D.; et al. ENHANCED GRAVITROPISM 2 encodes a STERILE ALPHA MOTIF-containing protein that controls root growth angle in barley and wheat. Proc. Natl. Acad. Sci. USA 2021, 118, e2101526118. [Google Scholar] [CrossRef]
- Shen, F.; Huang, Z.; Zhang, B.; Wang, Y.; Zhang, X.; Wu, T.; Xu, X.; Zhang, X.; Han, Z. Mapping Gene Markers for Apple Fruit Ring Rot Disease Resistance Using a Multi-omics Approach. G3 Genes Genomes Genet. 2019, 9, 1663–1678. [Google Scholar] [CrossRef] [PubMed]
- Yu, C.S.; Lin, C.J.; Hwang, J.K. Predicting subcellular localization of proteins for Gram-negative bacteria by support vector machines based on n-peptide compositions. Protein Sci. 2004, 13, 1402–1406. [Google Scholar] [CrossRef] [PubMed]
- Tamura, K.; Peterson, D.; Peterson, N.; Stecher, G.; Nei, M.; Kumar, S. MEGA5: Molecular Evolutionary Genetics Analysis Using Maximum Likelihood, Evolutionary Distance, and Maximum Parsimony Methods. Mol. Biol. Evol. 2011, 28, 2731–2739. [Google Scholar] [CrossRef]
- Moser, C.; Gatto, P.; Moser, M.; Pindo, M.; Velasco, R. Isolation of functional RNA from small amounts of different grape and apple tissues. Mol. Biotechnol. 2004, 26, 95–100. [Google Scholar] [CrossRef]
- Zhang, M.; Lv, Y.; Wang, Y.; Rose, J.; Shen, F.; Han, Z.; Zhang, X.; Xu, X.; Wu, T.; Han, Z. TATA box insertion provides a selection mechanism underpinning adaptations to Fe deficiency. Plant Physiol. 2017, 173, 715–727. [Google Scholar] [CrossRef]
- Voorrips, R.E. MapChart: Software for the graphical presentation of linkage maps and QTLs. J. Hered. 2002, 93, 77–78. [Google Scholar] [CrossRef] [PubMed]


| Name | Accession | Chromosome | Start | End | CDS (bp) | Protein Length (aa) | Location |
|---|---|---|---|---|---|---|---|
| MdSAUR1 | MD00G1033700 | Chr00 | 5801113 | 5801541 | 429 | 142 | Cytoplasmic (1.899 *); Extracellular (1.209 *) |
| MdSAUR2 | MD00G1036600 | Chr00 | 6463961 | 6464332 | 372 | 123 | Cytoplasmic (2.936 *) |
| MdSAUR3 | MD00G1067200 | Chr00 | 12921039 | 12921597 | 510 | 169 | Cytoplasmic (2.078 *) |
| MdSAUR4 | MD01G1106100 | Chr01 | 21931954 | 21932349 | 396 | 131 | Cytoplasmic (3.539 *) |
| MdSAUR5 | MD01G1200100 | Chr01 | 29699360 | 29699515 | 156 | 51 | Cytoplasmic (2.608 *) |
| MdSAUR6 | MD01G1227100 | Chr01 | 31700591 | 31700992 | 402 | 133 | Cytoplasmic (2.127 *); Periplasmic (1.436 *) |
| MdSAUR7 | MD02G1100000 | Chr02 | 7936729 | 7938938 | 531 | 176 | Cytoplasmic (3.508 *) |
| MdSAUR8 | MD02G1100200 | Chr02 | 7980868 | 7981233 | 366 | 121 | Cytoplasmic (3.490 *) |
| MdSAUR9 | MD02G1133900 | Chr02 | 10836759 | 10837079 | 321 | 106 | Cytoplasmic (2.433 *) |
| MdSAUR10 | MD02G1205700 | Chr02 | 20662654 | 20663172 | 519 | 172 | Cytoplasmic (1.888 *); Periplasmic (1.531 *) |
| MdSAUR11 | MD04G1082600 | Chr04 | 11472755 | 11473261 | 507 | 168 | Cytoplasmic (2.682 *) |
| MdSAUR12 | MD04G1093700 | Chr04 | 17052592 | 17053047 | 456 | 151 | Cytoplasmic (3.855 *) |
| MdSAUR13 | MD04G1095800 | Chr04 | 17659037 | 17659420 | 384 | 127 | Cytoplasmic (3.689 *) |
| MdSAUR14 | MD05G1051600 | Chr05 | 8897921 | 8898226 | 306 | 101 | Cytoplasmic (2.150 *) |
| MdSAUR15 | MD05G1051700 | Chr05 | 8916962 | 8917267 | 306 | 101 | Cytoplasmic (2.102 *); Periplasmic (1.704 *) |
| MdSAUR16 | MD05G1051800 | Chr05 | 8919337 | 8919642 | 306 | 101 | Cytoplasmic (1.714 *); Periplasmic (1.097 *) |
| MdSAUR17 | MD05G1052000 | Chr05 | 8924583 | 8924888 | 306 | 101 | Cytoplasmic (1.678 *); Periplasmic (1.361 *) |
| MdSAUR18 | MD05G1052100 | Chr05 | 8941633 | 8941938 | 306 | 101 | Cytoplasmic (2.424 *) |
| MdSAUR19 | MD05G1052200 | Chr05 | 8951907 | 8952203 | 297 | 98 | Cytoplasmic (2.081 *) |
| MdSAUR20 | MD05G1052300 | Chr05 | 8953272 | 8953673 | 402 | 133 | Cytoplasmic (1.127 *); OuterMembrane (1.262 *); Periplasmic (1.149 *) |
| MdSAUR21 | MD05G1052400 | Chr05 | 8999398 | 8999700 | 303 | 100 | Cytoplasmic (1.615 *); OuterMembrane (1.235 *); Periplasmic (1.141 *) |
| MdSAUR22 | MD05G1052500 | Chr05 | 9013301 | 9013531 | 231 | 76 | Cytoplasmic (2.429 *) |
| MdSAUR23 | MD05G1052800 | Chr05 | 9024586 | 9024882 | 297 | 98 | Cytoplasmic (1.427 *); OuterMembrane (1.143 *); Periplasmic (1.023 *) |
| MdSAUR24 | MD05G1053200 | Chr05 | 9075063 | 9075681 | 438 | 145 | Cytoplasmic (1.306 *); Periplasmic (1.843 *) |
| MdSAUR25 | MD05G1113200 | Chr05 | 23165138 | 23165296 | 159 | 52 | Cytoplasmic (2.493 *) |
| MdSAUR26 | MD05G1113300 | Chr05 | 23178916 | 23179197 | 282 | 93 | Cytoplasmic (2.159 *) |
| MdSAUR27 | MD05G1113400 | Chr05 | 23191697 | 23191981 | 285 | 94 | Cytoplasmic (1.729 *); Periplasmic (1.323 *) |
| MdSAUR28 | MD05G1113500 | Chr05 | 23236666 | 23236950 | 285 | 94 | Cytoplasmic (2.288 *) |
| MdSAUR29 | MD05G1113600 | Chr05 | 23245653 | 23245961 | 309 | 102 | Cytoplasmic (2.931 *) |
| MdSAUR30 | MD05G1113700 | Chr05 | 23253593 | 23253868 | 276 | 91 | Cytoplasmic (3.139 *) |
| MdSAUR31 | MD05G1219800 | Chr05 | 35019487 | 35019882 | 396 | 131 | Cytoplasmic (2.886 *) |
| MdSAUR32 | MD05G1223400 | Chr05 | 35609400 | 35609819 | 420 | 139 | Cytoplasmic (3.689 *) |
| MdSAUR33 | MD06G1137300 | Chr06 | 28237372 | 28237890 | 519 | 172 | Periplasmic (2.074 *) |
| MdSAUR34 | MD07G1117400 | Chr07 | 14414803 | 14415318 | 516 | 171 | Cytoplasmic (1.078 *); Extracellular (1.091 *); OuterMembrane (1.143 *); Periplasmic (1.413 *) |
| MdSAUR35 | MD07G1151400 | Chr07 | 22071122 | 22071418 | 297 | 98 | Cytoplasmic (1.496 *); Periplasmic (1.048 *) |
| MdSAUR36 | MD07G1156400 | Chr07 | 22734374 | 22734730 | 357 | 118 | Cytoplasmic (3.157 *) |
| MdSAUR37 | MD07G1172500 | Chr07 | 25001027 | 25001422 | 396 | 131 | Cytoplasmic (3.712 *) |
| MdSAUR38 | MD07G1220700 | Chr07 | 29829638 | 29830003 | 366 | 121 | Cytoplasmic (2.399 *) |
| MdSAUR39 | MD07G1297400 | Chr07 | 35727069 | 35727473 | 405 | 134 | Cytoplasmic (2.401 *) |
| MdSAUR40 | MD08G1014900 | Chr08 | 1133020 | 1133337 | 318 | 105 | Cytoplasmic (3.380 *) |
| MdSAUR41 | MD08G1015100 | Chr08 | 1172890 | 1173342 | 453 | 150 | Cytoplasmic (2.966 *) |
| MdSAUR42 | MD08G1124000 | Chr08 | 11654816 | 11655337 | 522 | 173 | Cytoplasmic (2.014 *) |
| MdSAUR43 | MD09G1089100 | Chr09 | 6500577 | 6500903 | 327 | 108 | Cytoplasmic (3.287 *) |
| MdSAUR44 | MD09G1166200 | Chr09 | 13620973 | 13621542 | 570 | 189 | Cytoplasmic (2.487 *) |
| MdSAUR45 | MD09G1166300 | Chr09 | 13625736 | 13626182 | 447 | 148 | Cytoplasmic (2.873 *) |
| MdSAUR46 | MD09G1166400 | Chr09 | 13644321 | 13644788 | 468 | 155 | Cytoplasmic (1.905 *); Periplasmic (1.485 *) |
| MdSAUR47 | MD09G1170600 | Chr09 | 14396726 | 14397252 | 399 | 132 | Cytoplasmic (2.009 *) |
| MdSAUR48 | MD09G1176000 | Chr09 | 15024607 | 15024960 | 354 | 117 | Cytoplasmic (2.704 *) |
| MdSAUR49 | MD09G1176100 | Chr09 | 15030105 | 15030461 | 357 | 118 | Cytoplasmic (2.406 *); Periplasmic (1.898 *) |
| MdSAUR50 | MD10G1058700 | Chr10 | 7939190 | 7939543 | 354 | 117 | Cytoplasmic (4.012 *) |
| MdSAUR51 | MD10G1059000 | Chr10 | 7963586 | 7964688 | 192 | 63 | Cytoplasmic (2.493 *) |
| MdSAUR52 | MD10G1059100 | Chr10 | 7965729 | 7966221 | 219 | 72 | Cytoplasmic (1.404 *); Periplasmic (1.922 *) |
| MdSAUR53 | MD10G1059200 | Chr10 | 7969469 | 7969774 | 306 | 101 | Cytoplasmic (1.674 *); Periplasmic (1.907 *) |
| MdSAUR54 | MD10G1059300 | Chr10 | 7980413 | 7980586 | 174 | 57 | Cytoplasmic (2.033 *) |
| MdSAUR55 | MD10G1059400 | Chr10 | 7982312 | 7982581 | 270 | 89 | Cytoplasmic (1.921 *); OuterMembrane (1.373 *) |
| MdSAUR56 | MD10G1059500 | Chr10 | 7993321 | 7993620 | 300 | 99 | OuterMembrane (1.274 *); Periplasmic (1.751 *) |
| MdSAUR57 | MD10G1059600 | Chr10 | 8008946 | 8009221 | 276 | 91 | Cytoplasmic (1.296 *); Extracellular (1.015 *); Periplasmic (1.233 *) |
| MdSAUR58 | MD10G1059700 | Chr10 | 8021965 | 8022290 | 306 | 101 | Cytoplasmic (2.413 *) |
| MdSAUR59 | MD10G1059800 | Chr10 | 8024227 | 8026563 | 432 | 143 | Cytoplasmic (1.674 *); InnerMembrane (1.774 *) |
| MdSAUR60 | MD10G1060100 | Chr10 | 8086085 | 8086390 | 306 | 101 | Cytoplasmic (2.139 *) |
| MdSAUR61 | MD10G1060200 | Chr10 | 8087982 | 8088257 | 276 | 91 | Cytoplasmic (1.558 *); OuterMembrane (1.341 *) |
| MdSAUR62 | MD10G1060300 | Chr10 | 8120383 | 8120679 | 297 | 98 | Cytoplasmic (2.887 *) |
| MdSAUR63 | MD10G1060400 | Chr10 | 8121964 | 8122149 | 186 | 61 | Cytoplasmic (1.475 *); Periplasmic (1.727 *) |
| MdSAUR64 | MD10G1060500 | Chr10 | 8123002 | 8126545 | 489 | 162 | Cytoplasmic (1.570 *); OuterMembrane (1.282 *); |
| MdSAUR65 | MD10G1060600 | Chr10 | 8150440 | 8150652 | 213 | 70 | Cytoplasmic (1.829 *); Periplasmic (1.462 *) |
| MdSAUR66 | MD10G1060700 | Chr10 | 8164264 | 8164668 | 405 | 134 | Cytoplasmic (1.768 *); Periplasmic (1.637 *) |
| MdSAUR67 | MD10G1060800 | Chr10 | 8165745 | 8166044 | 300 | 99 | Cytoplasmic (1.393 *); OuterMembrane (1.392 *); Periplasmic (1.321 *) |
| MdSAUR68 | MD10G1060900 | Chr10 | 8171485 | 8171760 | 276 | 91 | Cytoplasmic (2.003 *) |
| MdSAUR69 | MD10G1061000 | Chr10 | 8179736 | 8180225 | 324 | 107 | Cytoplasmic (2.279 *) |
| MdSAUR70 | MD10G1061100 | Chr10 | 8207917 | 8208257 | 318 | 105 | Cytoplasmic (2.723 *) |
| MdSAUR71 | MD10G1061300 | Chr10 | 8240210 | 8240869 | 660 | 219 | Periplasmic (2.269 *) |
| MdSAUR72 | MD10G1061400 | Chr10 | 8286787 | 8287227 | 441 | 146 | Cytoplasmic (3.600 *) |
| MdSAUR73 | MD10G1202100 | Chr10 | 29998840 | 29999244 | 405 | 134 | Cytoplasmic (3.237 *) |
| MdSAUR74 | MD10G1204800 | Chr10 | 30376680 | 30377099 | 420 | 139 | Cytoplasmic (3.504 *) |
| MdSAUR75 | MD11G1145300 | Chr11 | 13514349 | 13514926 | 474 | 157 | Cytoplasmic (1.870 *); Extracellular (1.259 *); OuterMembrane (1.527 *) |
| MdSAUR76 | MD12G1027600 | Chr12 | 3084745 | 3085128 | 384 | 127 | Cytoplasmic (2.781 *) |
| MdSAUR77 | MD12G1088000 | Chr12 | 10835118 | 10835579 | 462 | 153 | Cytoplasmic (1.851 *) |
| MdSAUR78 | MD12G1088100 | Chr12 | 10872715 | 10873179 | 465 | 154 | Cytoplasmic (1.361 *); OuterMembrane (1.856 *) |
| MdSAUR79 | MD12G1088200 | Chr12 | 10875190 | 10875582 | 393 | 130 | Cytoplasmic (1.296 *); Extracellular (1.450 *); OuterMembrane (1.699 *) |
| MdSAUR80 | MD12G1097400 | Chr12 | 15303943 | 15304317 | 375 | 124 | Cytoplasmic (2.793 *) |
| MdSAUR81 | MD12G1098500 | Chr12 | 15404672 | 15404980 | 309 | 102 | Cytoplasmic (2.557 *) |
| MdSAUR82 | MD12G1113400 | Chr12 | 18052351 | 18052800 | 450 | 149 | Cytoplasmic (3.389 *) |
| MdSAUR83 | MD12G1115800 | Chr12 | 18457034 | 18457417 | 384 | 127 | Cytoplasmic (3.747 *) |
| MdSAUR84 | MD13G1123500 | Chr13 | 9172512 | 9172973 | 462 | 153 | Cytoplasmic (2.300 *); Periplasmic (2.108 *) |
| MdSAUR85 | MD13G1235900 | Chr13 | 23824202 | 23824513 | 312 | 103 | Cytoplasmic (2.307 *) |
| MdSAUR86 | MD14G1028000 | Chr14 | 2503144 | 2503530 | 387 | 128 | Cytoplasmic (2.861 *) |
| MdSAUR87 | MD14G1152100 | Chr14 | 24578067 | 24578540 | 474 | 157 | Cytoplasmic (1.569 *); Periplasmic (1.974 *) |
| MdSAUR88 | MD15G1014200 | Chr15 | 805247 | 805606 | 318 | 105 | Cytoplasmic (3.406 *) |
| MdSAUR89 | MD15G1014300 | Chr15 | 821989 | 822441 | 453 | 150 | Cytoplasmic (3.047 *) |
| MdSAUR90 | MD15G1102700 | Chr15 | 7267646 | 7268164 | 519 | 172 | Cytoplasmic (2.378 *) |
| MdSAUR91 | MD15G1222900 | Chr15 | 18103292 | 18105613 | 555 | 184 | Cytoplasmic (3.251 *) |
| MdSAUR92 | MD15G1223100 | Chr15 | 18137898 | 18138260 | 363 | 120 | Cytoplasmic (2.878 *) |
| MdSAUR93 | MD15G1246800 | Chr15 | 20468388 | 20468708 | 321 | 106 | Cytoplasmic (3.366 *) |
| MdSAUR94 | MD16G1124300 | Chr16 | 8987819 | 8988280 | 462 | 153 | Cytoplasmic (2.104 *); Periplasmic (2.320 *) |
| MdSAUR95 | MD16G1240600 | Chr16 | 26000543 | 26001037 | 495 | 164 | Cytoplasmic (2.502 *) |
| MdSAUR96 | MD17G1161400 | Chr17 | 15886464 | 15887039 | 576 | 191 | Cytoplasmic (2.238 *) |
Publisher’s Note: MDPI stays neutral with regard to jurisdictional claims in published maps and institutional affiliations. |
© 2022 by the authors. Licensee MDPI, Basel, Switzerland. This article is an open access article distributed under the terms and conditions of the Creative Commons Attribution (CC BY) license (https://creativecommons.org/licenses/by/4.0/).
Share and Cite
Zhou, Y.; Lan, Q.; Yu, W.; Zhou, Y.; Ma, S.; Bao, Z.; Li, X.; Zheng, C. Analysis of the Small Auxin-Up RNA (SAUR) Genes Regulating Root Growth Angle (RGA) in Apple. Genes 2022, 13, 2121. https://doi.org/10.3390/genes13112121
Zhou Y, Lan Q, Yu W, Zhou Y, Ma S, Bao Z, Li X, Zheng C. Analysis of the Small Auxin-Up RNA (SAUR) Genes Regulating Root Growth Angle (RGA) in Apple. Genes. 2022; 13(11):2121. https://doi.org/10.3390/genes13112121
Chicago/Turabian StyleZhou, Yufei, Qingqing Lan, Wenhan Yu, Yuwen Zhou, Shuya Ma, Zeyang Bao, Xu Li, and Caixia Zheng. 2022. "Analysis of the Small Auxin-Up RNA (SAUR) Genes Regulating Root Growth Angle (RGA) in Apple" Genes 13, no. 11: 2121. https://doi.org/10.3390/genes13112121
APA StyleZhou, Y., Lan, Q., Yu, W., Zhou, Y., Ma, S., Bao, Z., Li, X., & Zheng, C. (2022). Analysis of the Small Auxin-Up RNA (SAUR) Genes Regulating Root Growth Angle (RGA) in Apple. Genes, 13(11), 2121. https://doi.org/10.3390/genes13112121