
Gene Expression Profile in the Sandhoff Mouse Brain with Progression of Age
 ,
,
Abstract
1. Introduction
2. Materials and Methods
2.1. Animals
2.2. Brain Sample Collection and RNA Extraction
2.3. qPCR
2.4. Protein Functional Association Network Analysis
2.5. Data Analysis and Statistics
3. Results
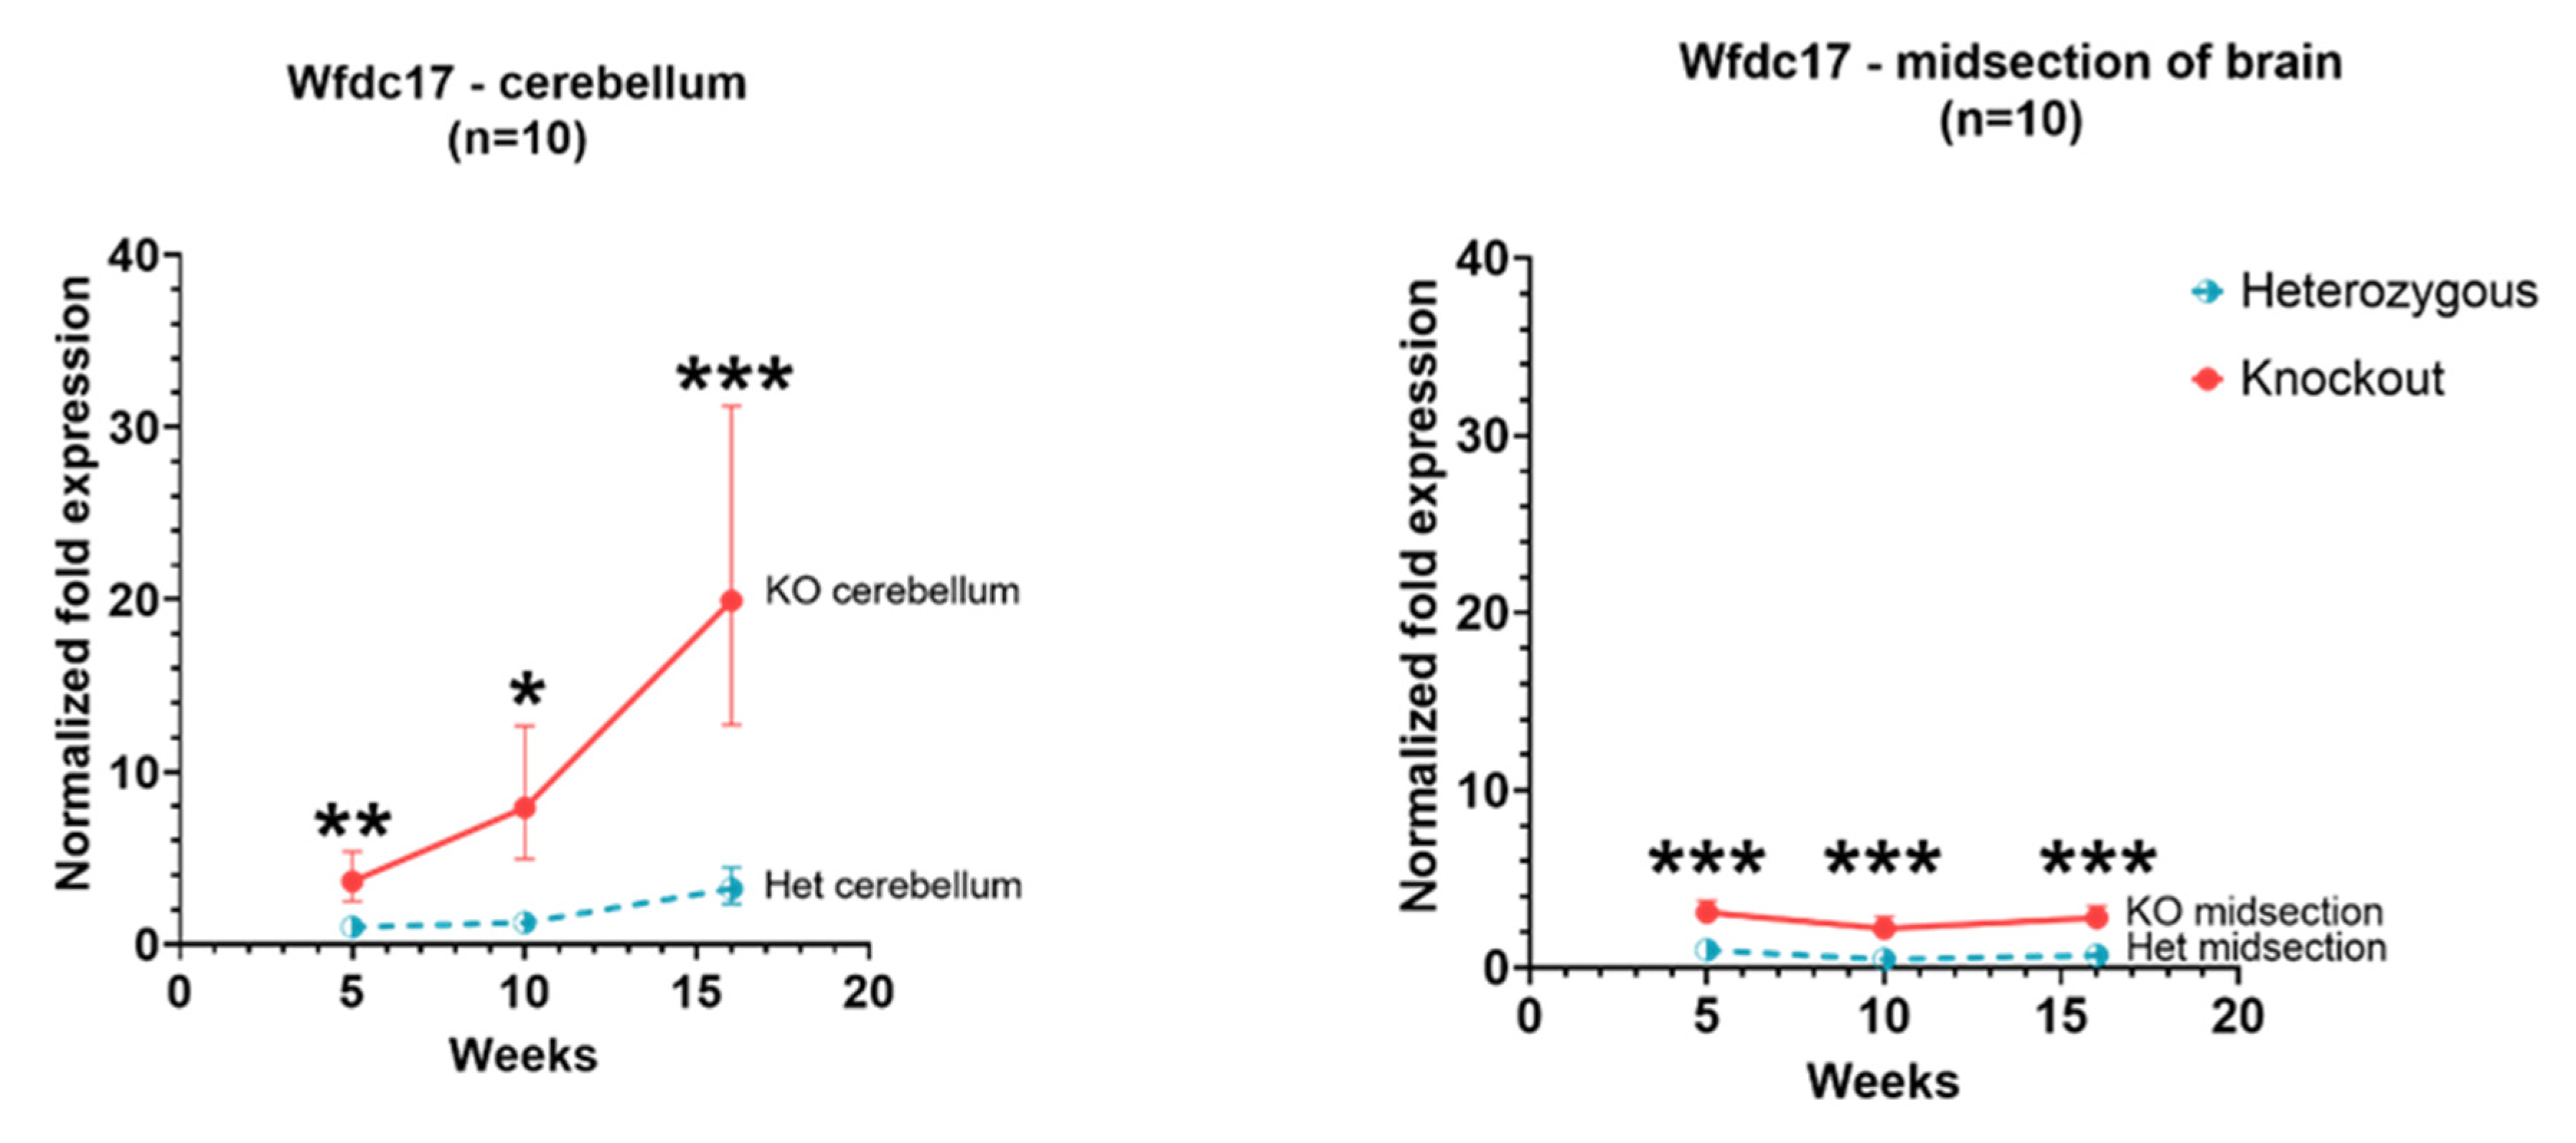
3.1. Wfdc17
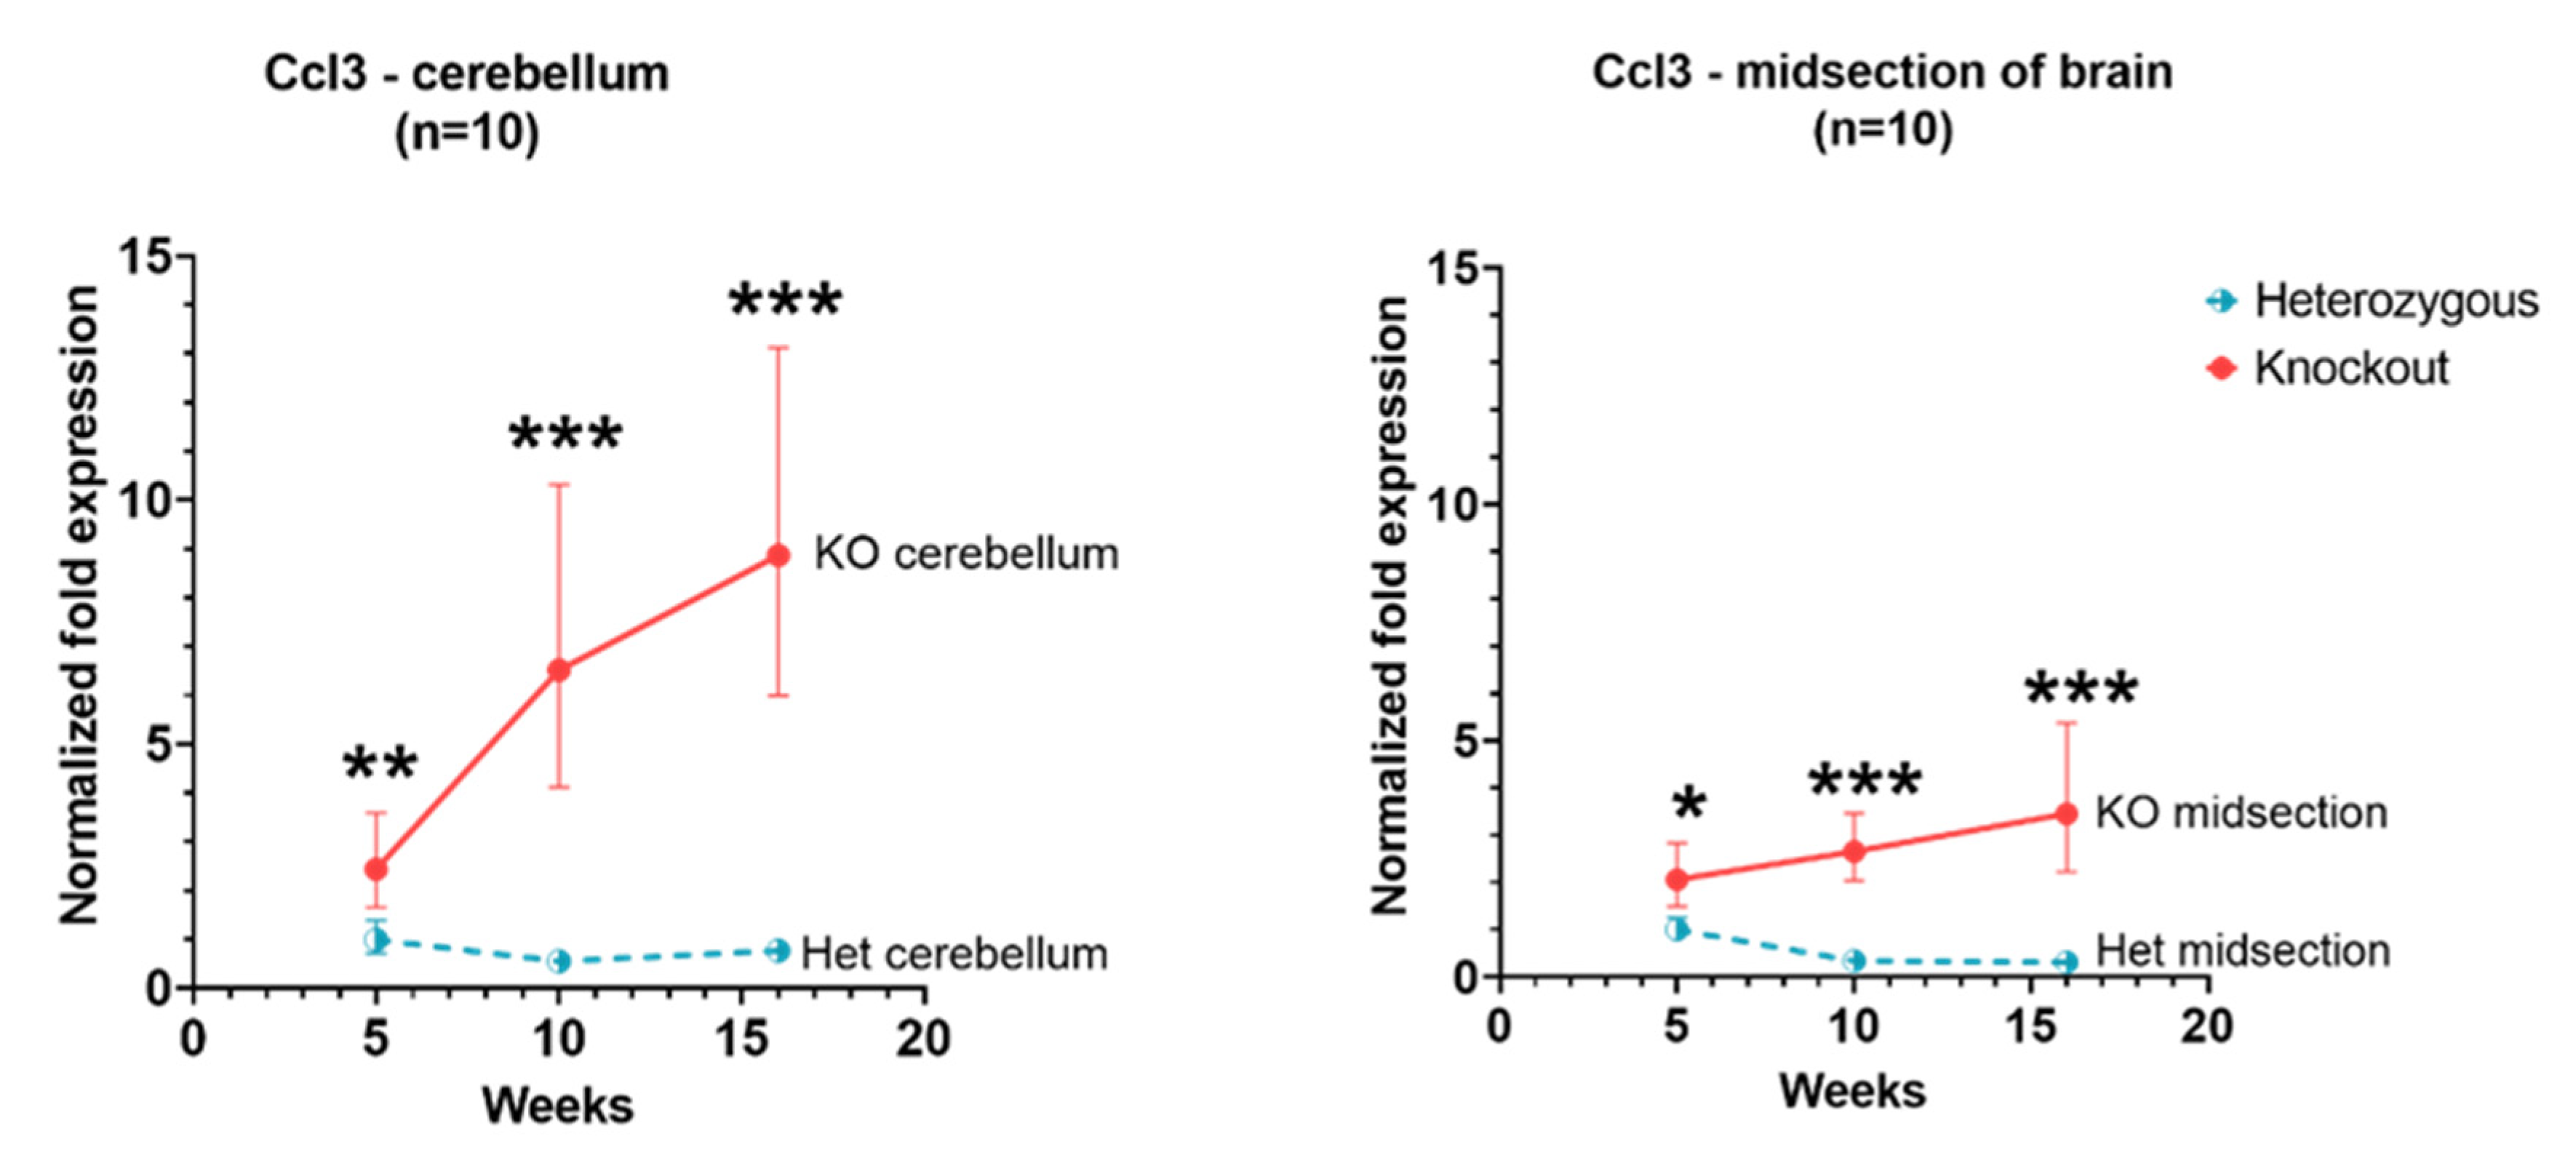
3.2. Ccl3
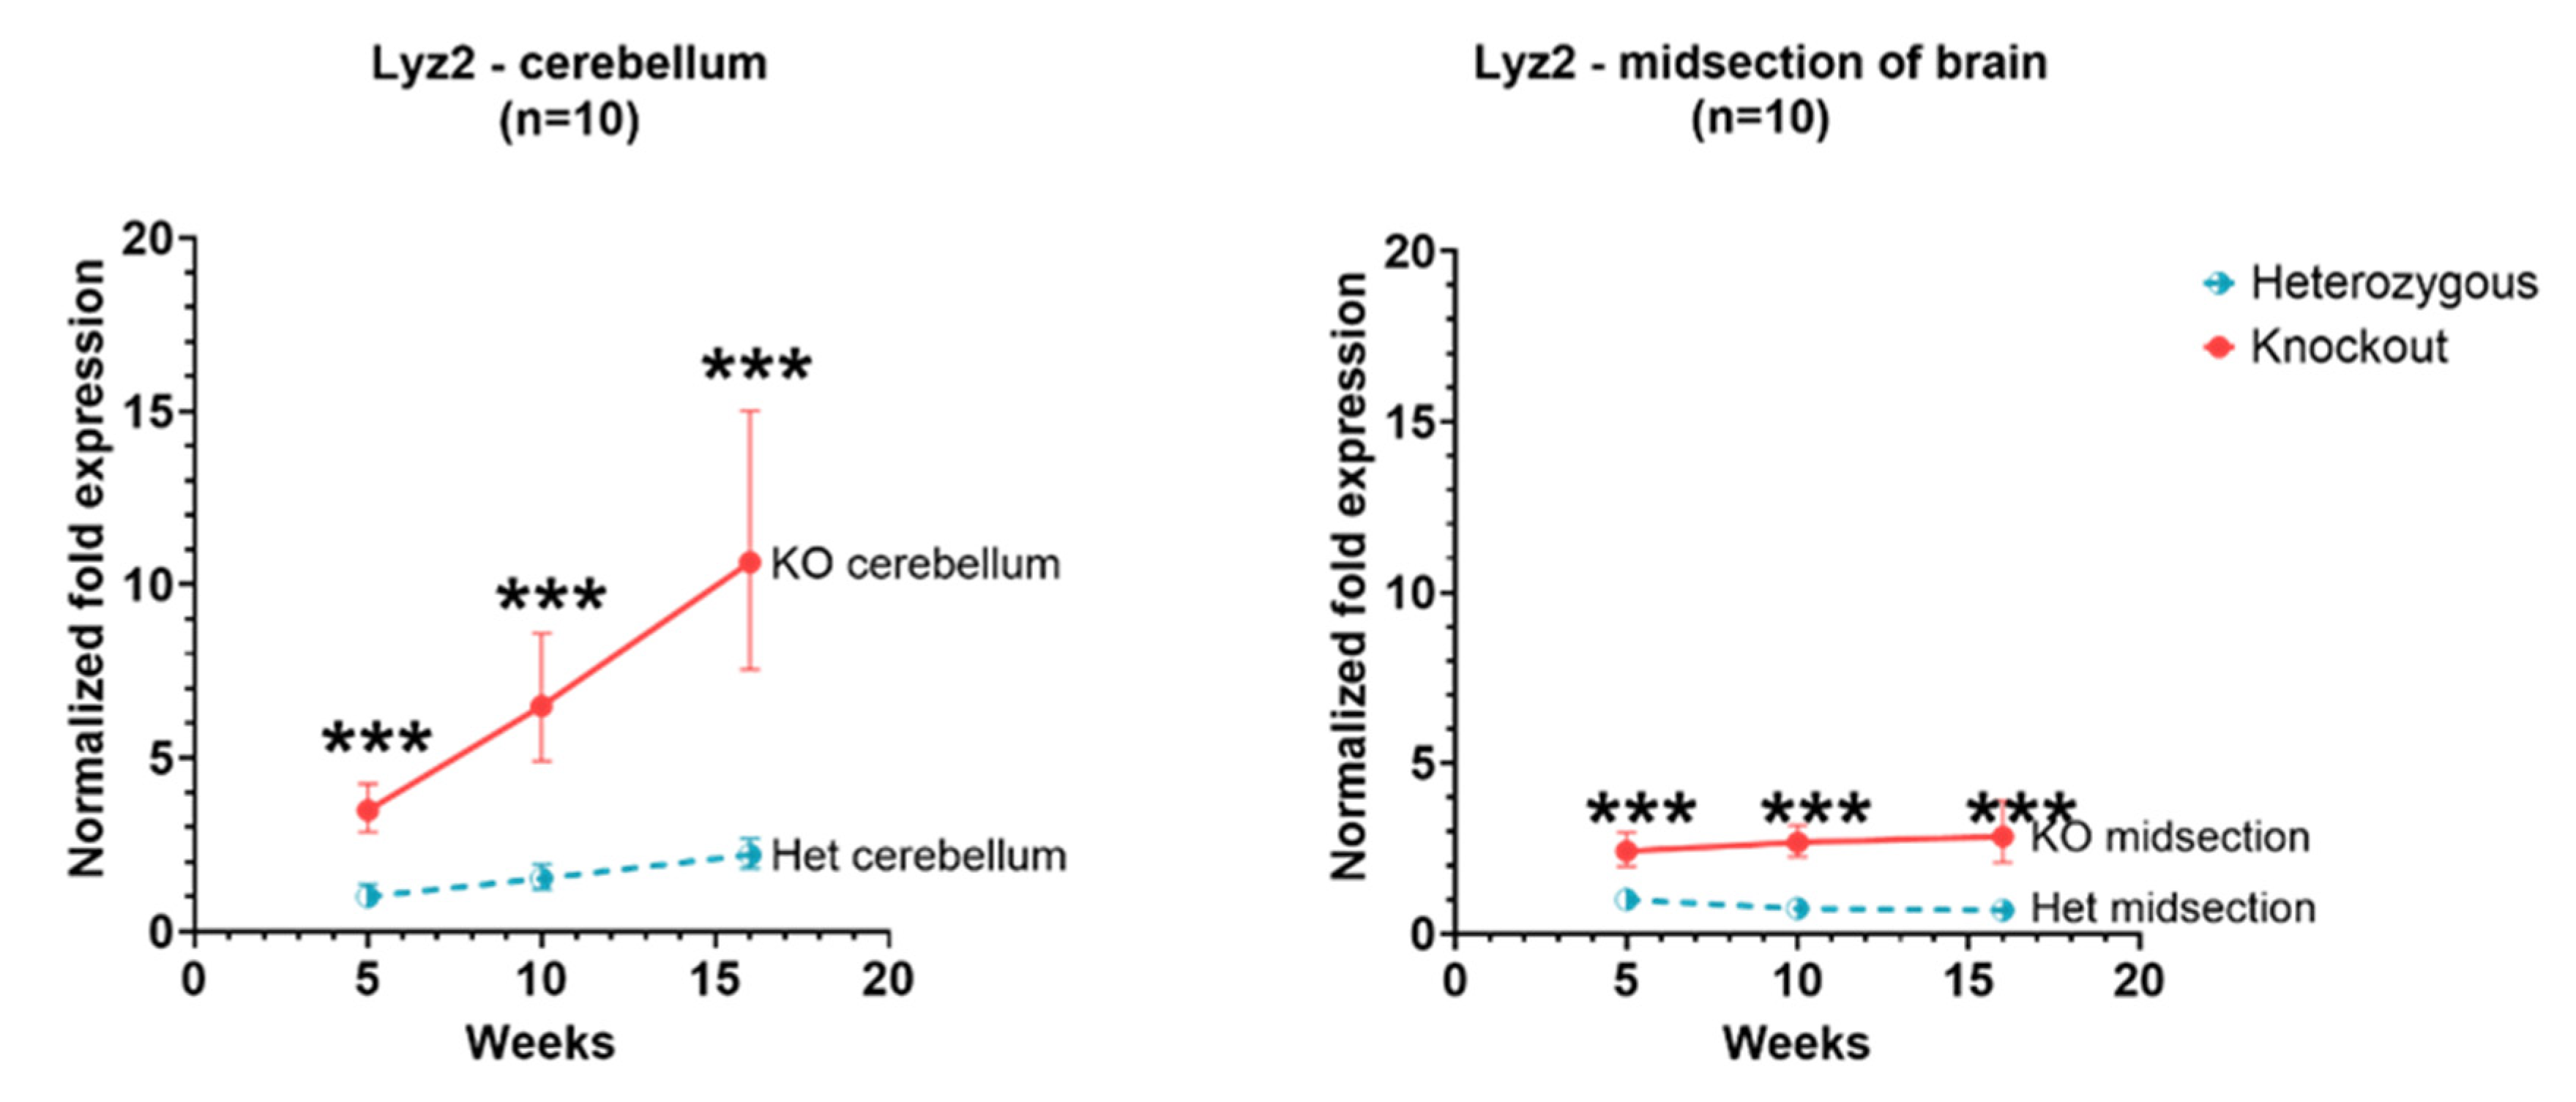
3.3. Lyz2
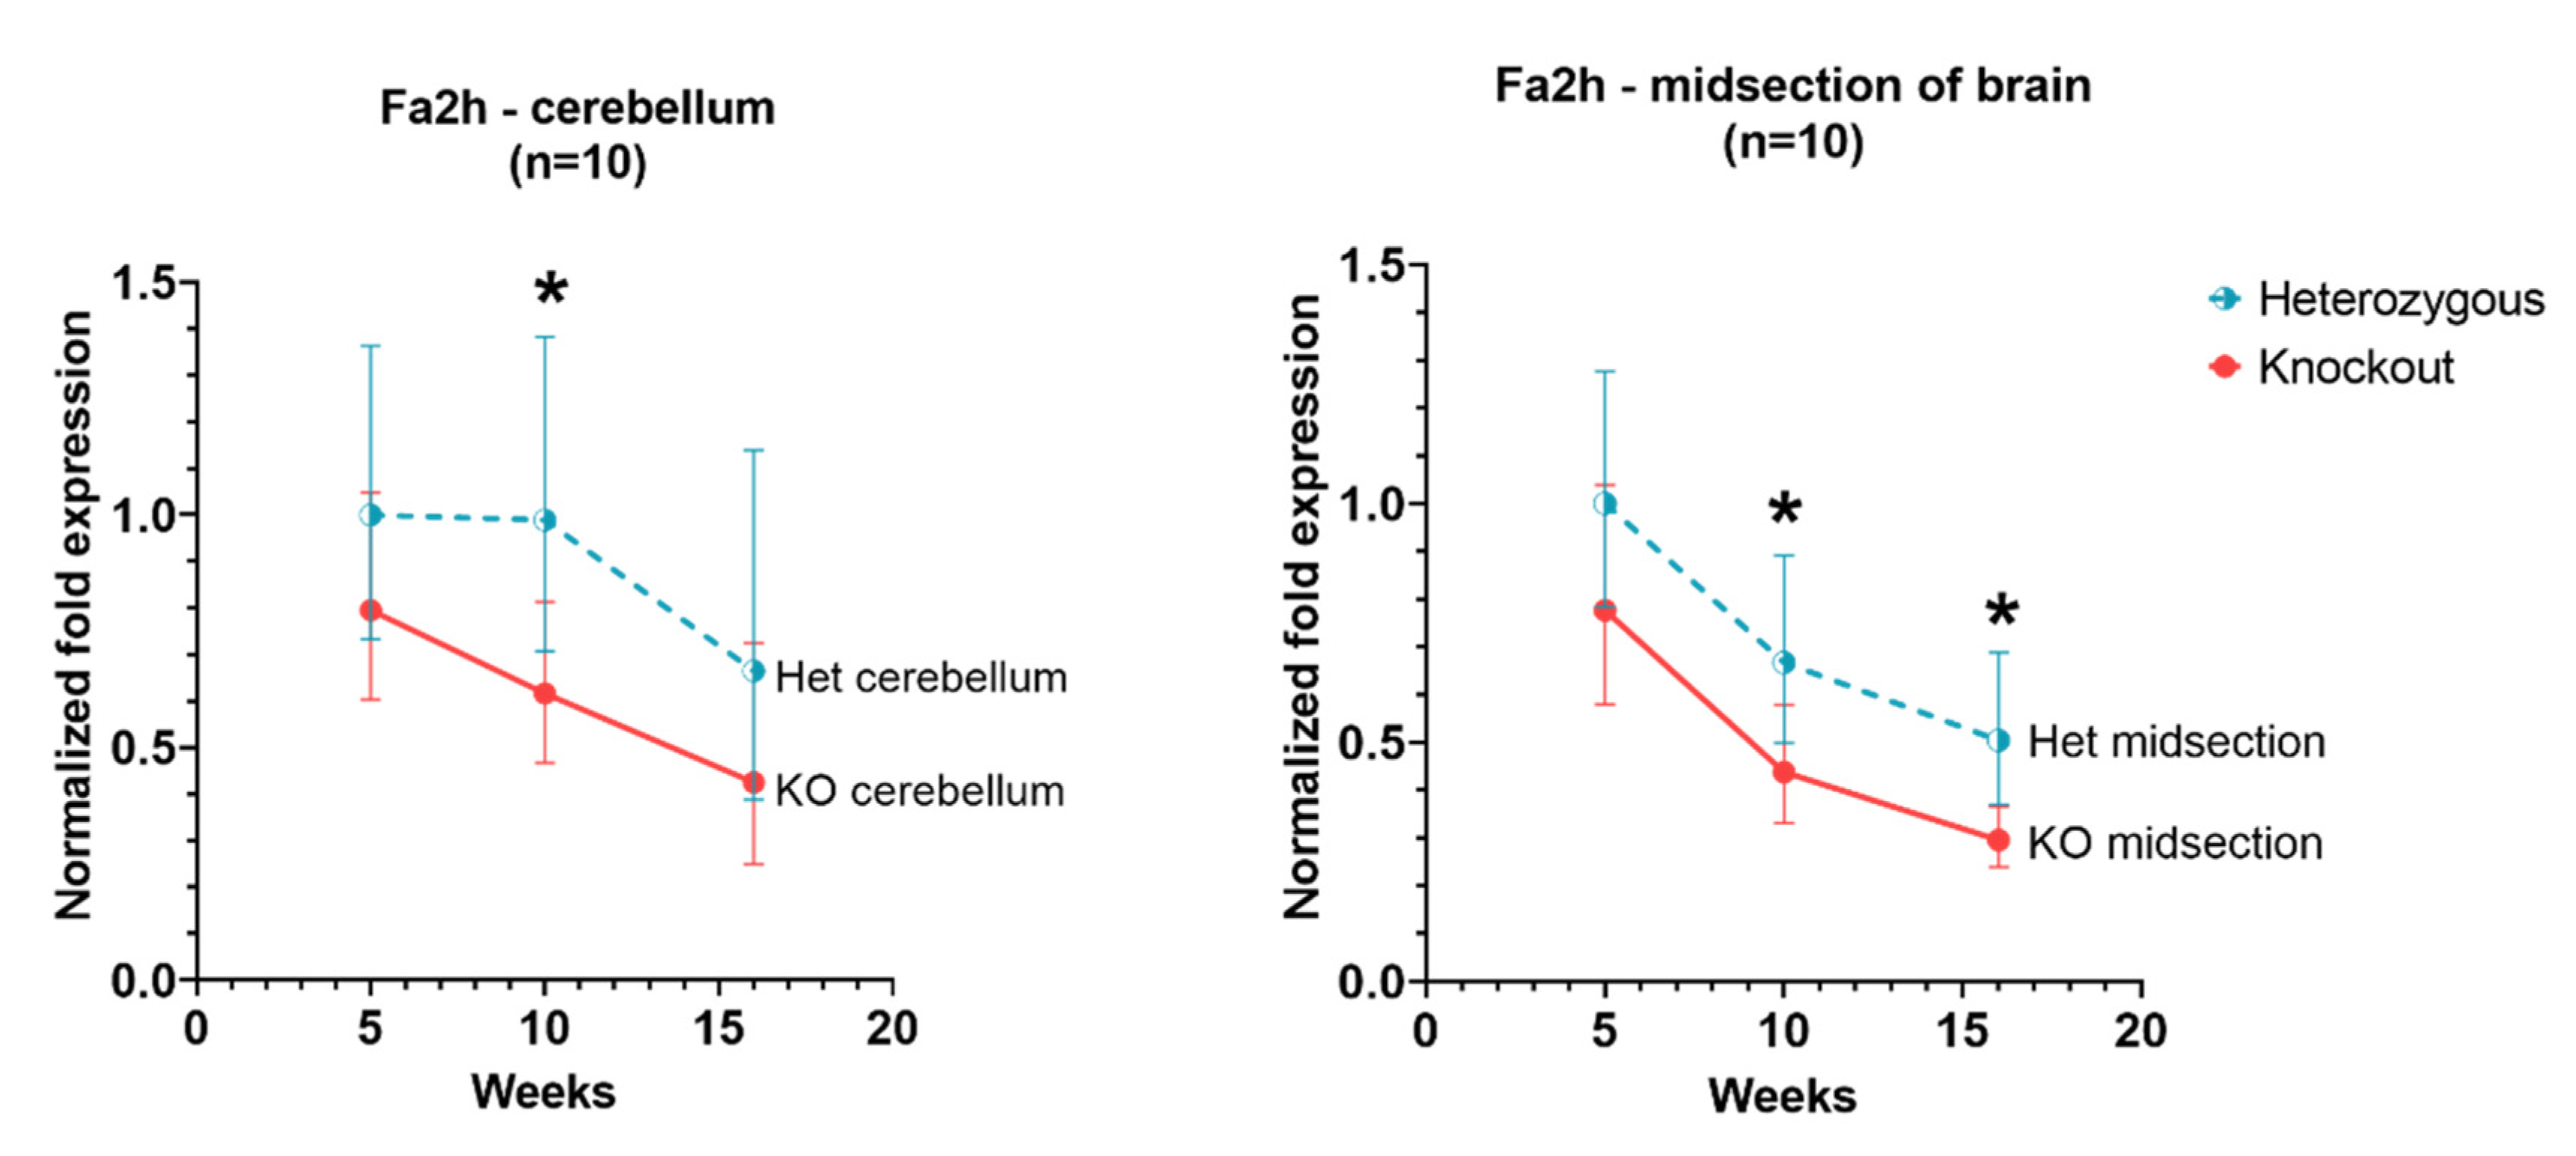
3.4. Fa2h
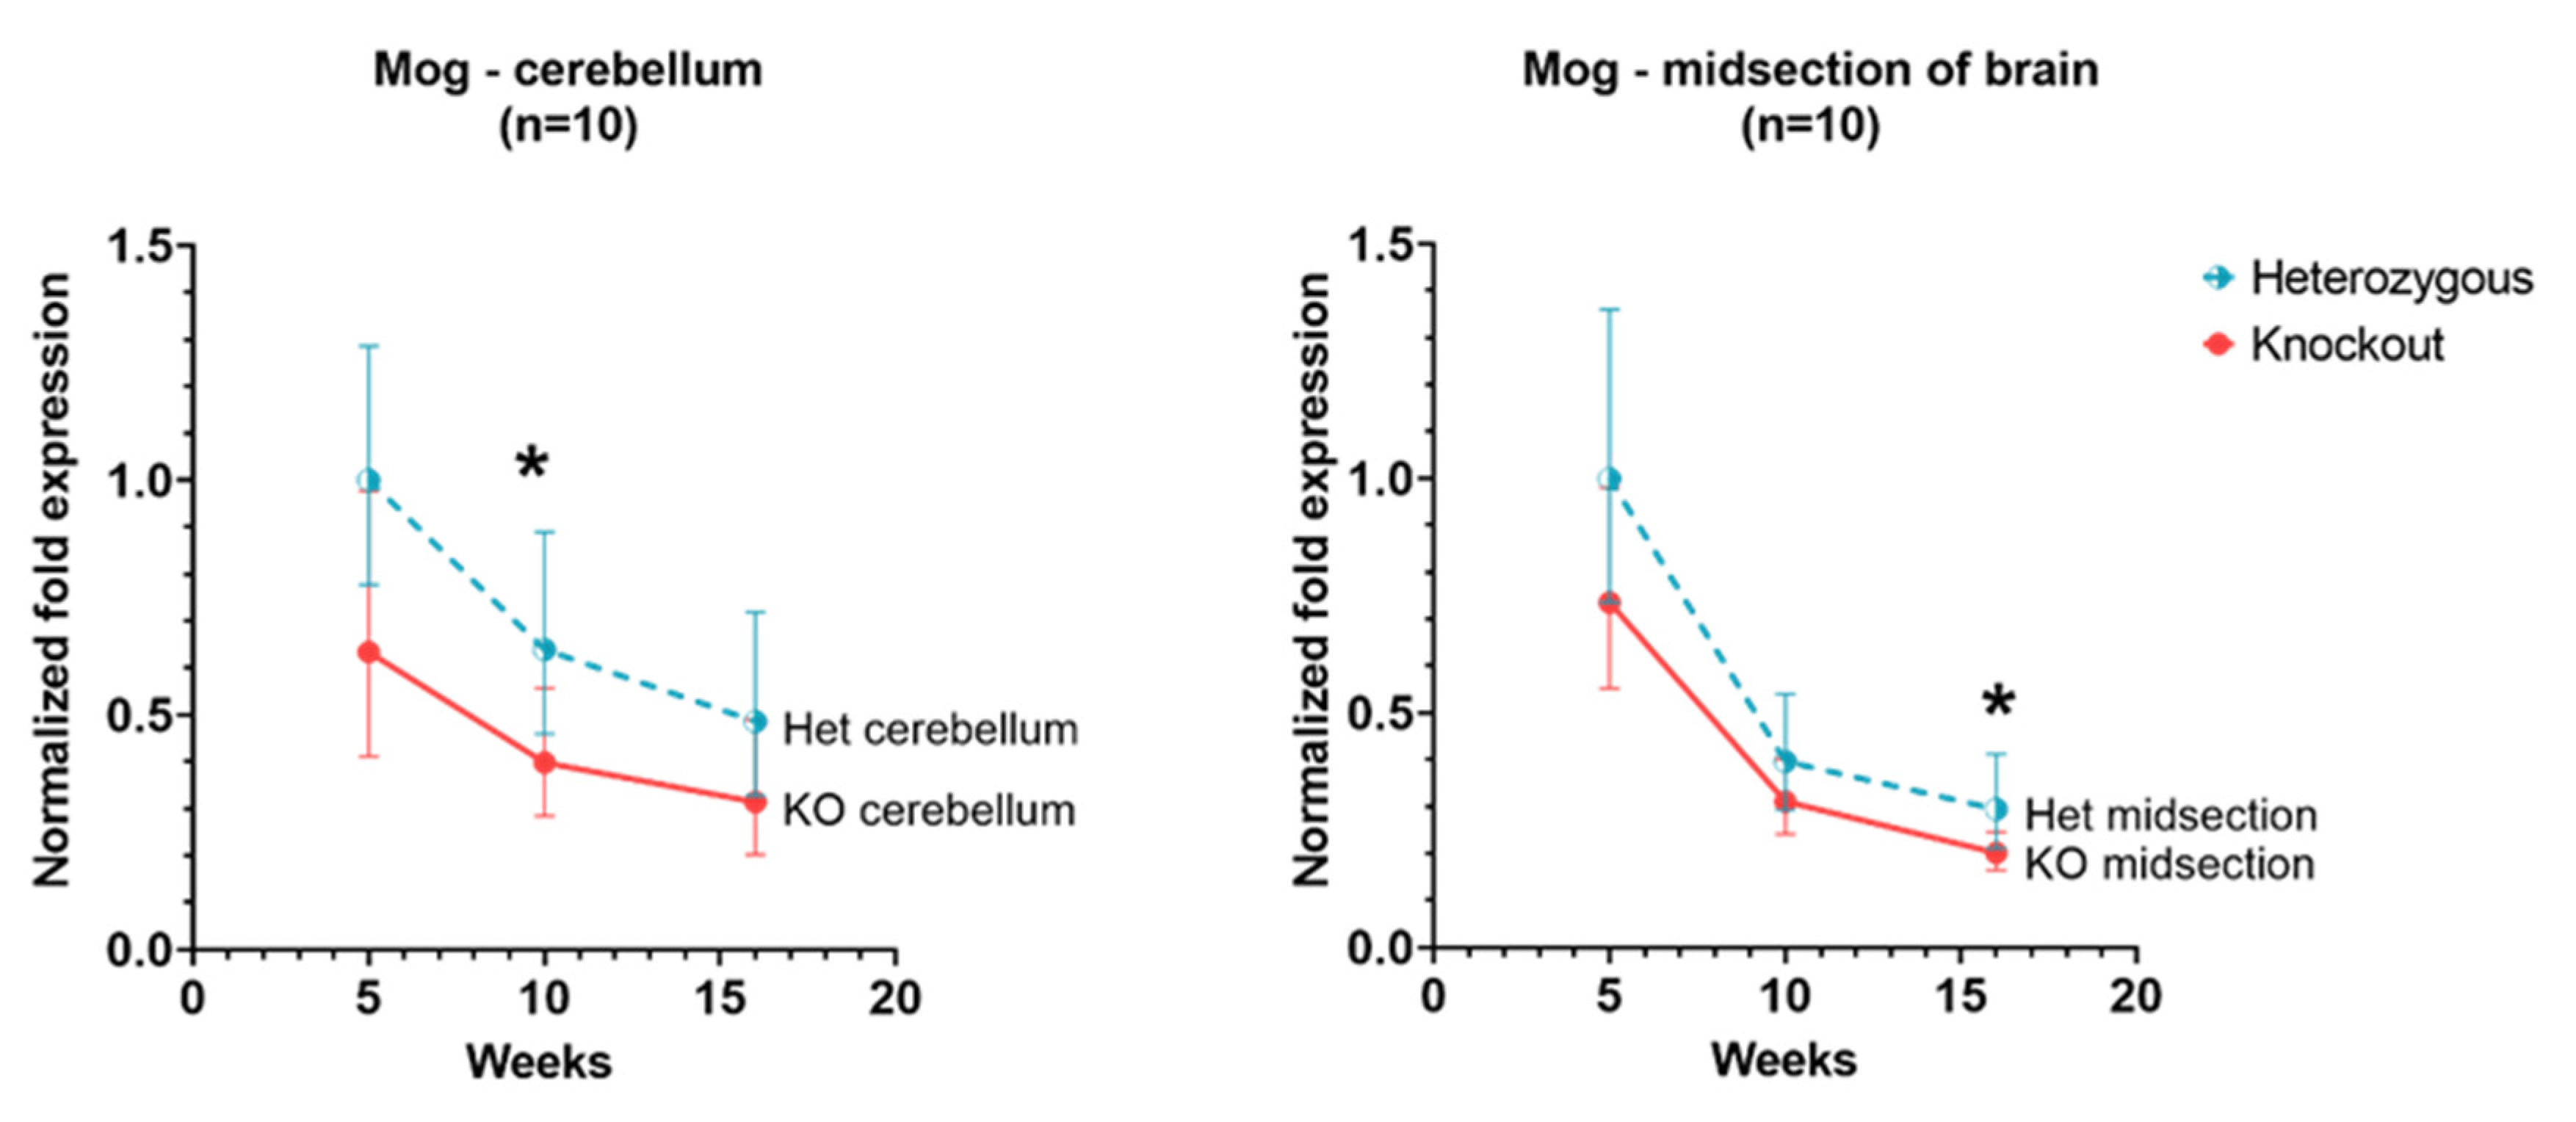
3.5. Mog
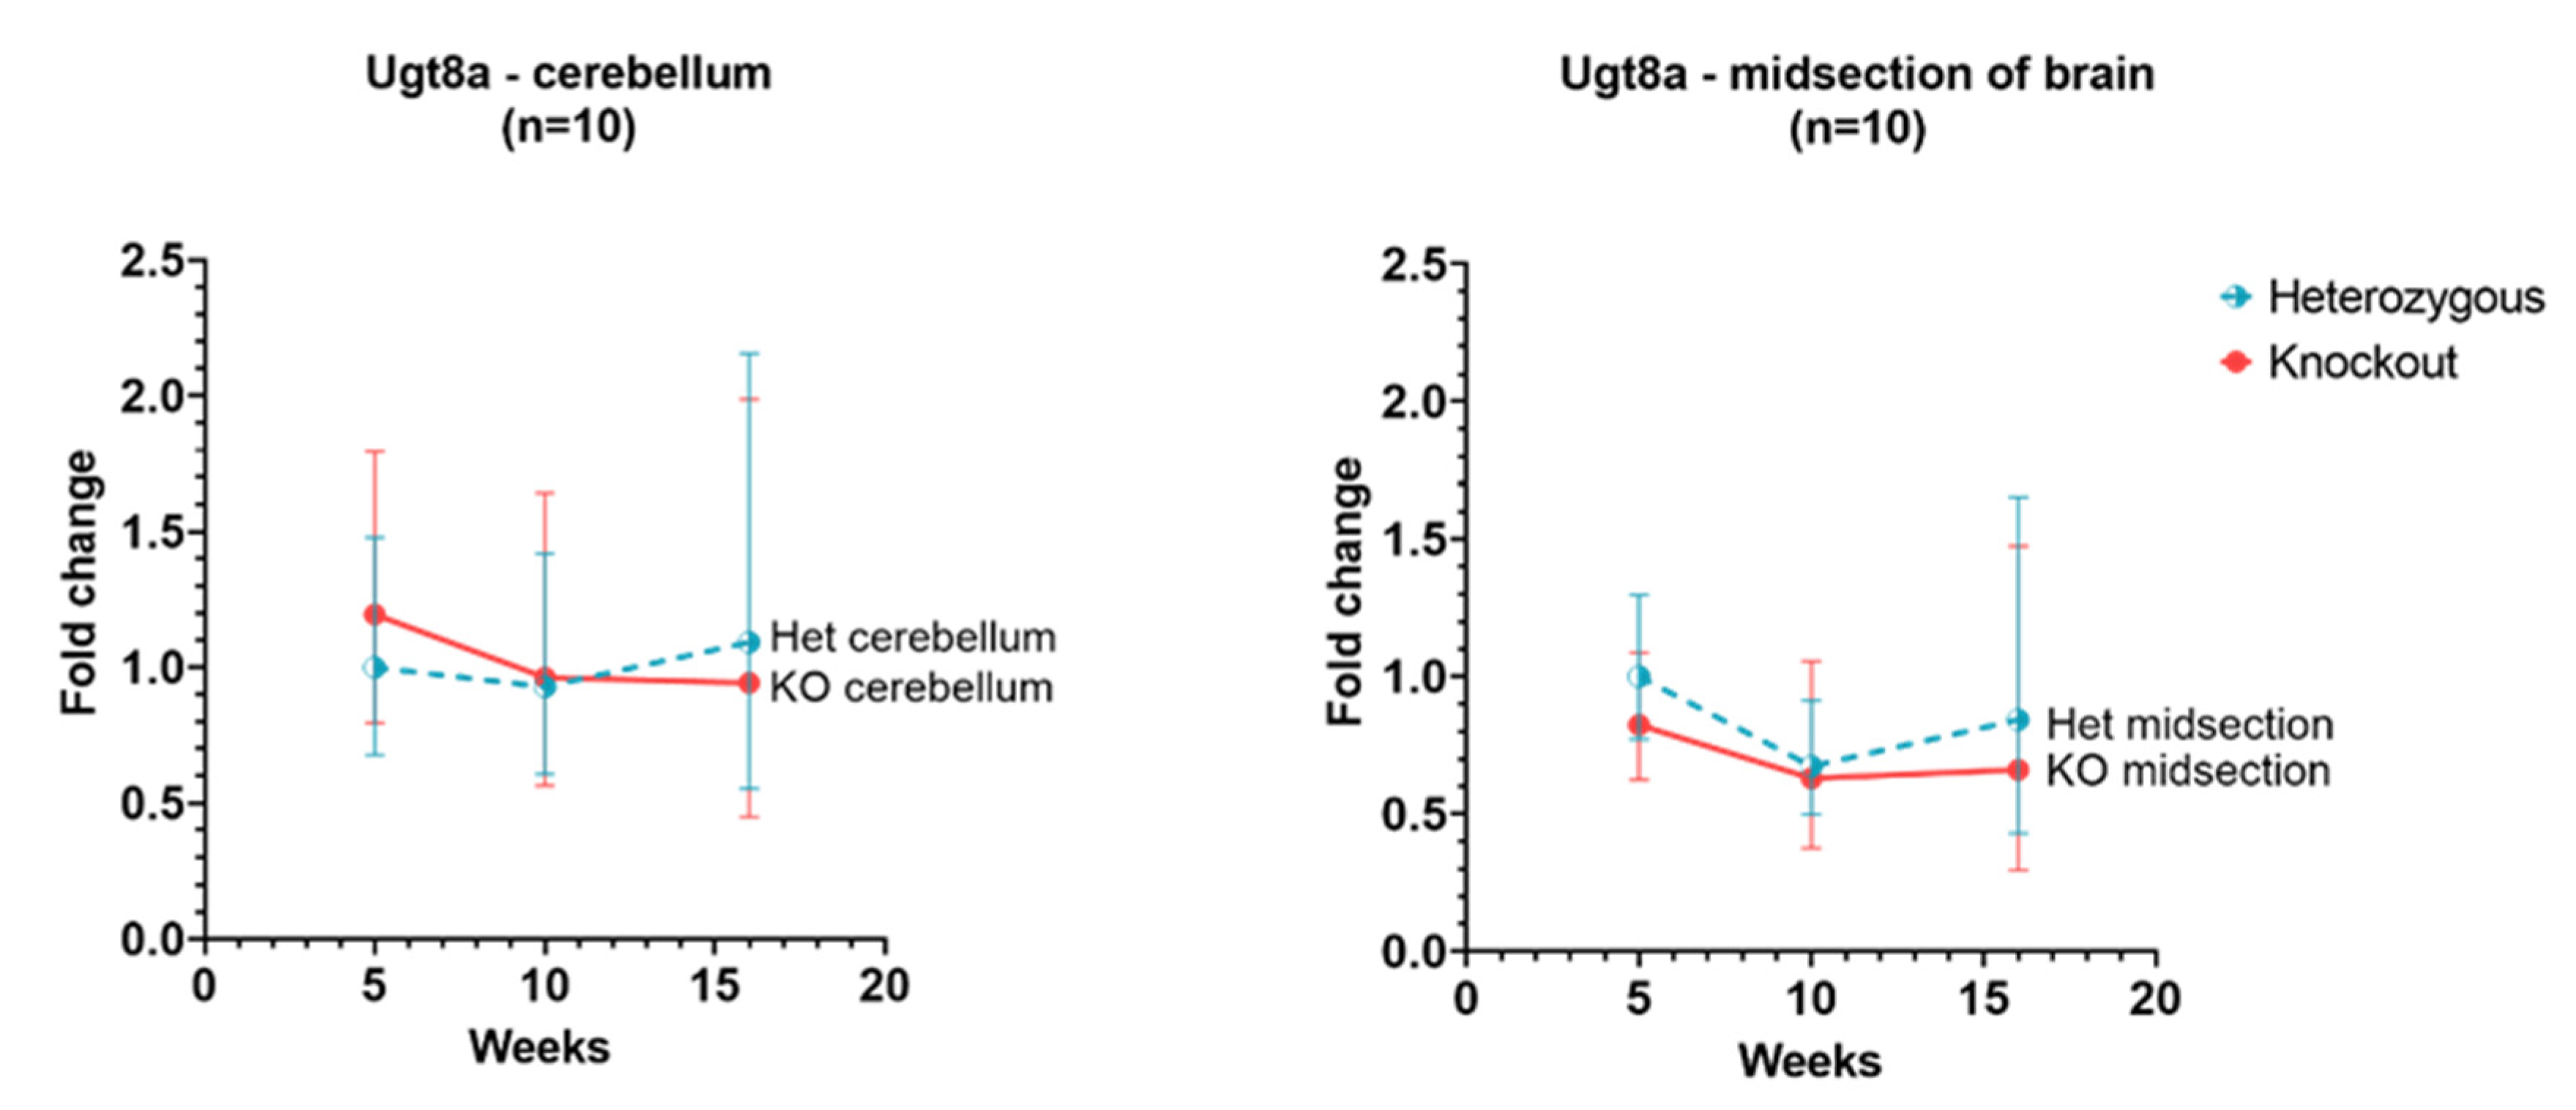
3.6. Ugt8a
3.7. Protein Association Network Analysis
4. Discussion
Supplementary Materials
Author Contributions
Funding
Institutional Review Board Statement
Informed Consent Statement
Data Availability Statement
Acknowledgments
Conflicts of Interest
References
- Sandhoff, K.; Harzer, K. Gangliosides and gangliosidoses: Principles of molecular and metabolic pathogenesis. J. Neurosci. 2013, 33, 10195–10208. [Google Scholar] [CrossRef] [PubMed]
- Sandhoff, K. My Journey into the World of Sphingolipids and Sphingolipidoses. Proc. Jpn. Acad. Ser. B Phys. Biol. Sci. 2012, 88, 554–582. [Google Scholar] [CrossRef] [PubMed]
- Brown, C.A. Characterization of Two HEXB Gene Mutations in Argentinean Patients with Sandhoff Disease. Biochim. Biophys. Acta 1992, 1180, 91–98. [Google Scholar] [CrossRef]
- Lemieux, M.J.; Mark, B.L.; Cherney, M.M.; Withers, S.G.; Mahuran, D.J.; James, M.N.G. Crystallographic Structure of Human β-Hexosaminidase A: Interpretation of Tay-Sachs Mutations and Loss of GM2 Ganglioside Hydrolysis. J. Mol. Biol. 2006, 359, 913–929. [Google Scholar] [CrossRef] [PubMed]
- Gravel, R.A.; Triggs-Raine, B.L.; Mahuran, D.J. Biochemistry and genetics of Tay-Sachs disease. Can. J. Neurol. Sci. 1991, 18, 419–423. [Google Scholar] [CrossRef]
- Jeyakumar, M. Glycosphingolipid Lysosomal Storage Diseases: Therapy and Pathogenesis. Neuropathol. Appl. Neurobiol. 2002, 28, 343–357. [Google Scholar] [CrossRef]
- Cachon-Gonzalez, M.B.; Zaccariotto, E.; Cox, T.M. Genetics and Therapies for GM2 Gangliosidosis. Curr. Gene Ther. 2018, 18, 68–89. [Google Scholar] [CrossRef]
- Tsuji, D.; Akeboshi, H.; Matsuoka, K.; Yasuoka, H.; Miyasaki, E.; Kasahara, Y.; Kawashima, I.; Chiba, Y.; Jigami, Y.; Taki, T.; et al. Highly Phosphomannosylated Enzyme Replacement Therapy for GM2 Gangliosidosis. Ann. Neurol. 2011, 69, 691–701. [Google Scholar] [CrossRef]
- Marshall, J.; Nietupski, J.B.; Park, H.; Cao, J.; Bangari, D.S.; Silvescu, C.; Wilper, T.; Randall, K.; Tietz, D.; Wang, B.; et al. Substrate Reduction Therapy for Sandhoff Disease through Inhibition of Glucosylceramide Synthase Activity. Mol. Ther. 2019, 27, 1495–1506. [Google Scholar] [CrossRef]
- Osmon, K.J.; Thompson, P.; Woodley, E.; Karumuthil-Melethil, S.; Heindel, C.; Keimel, J.G.; Kaemmerer, W.F.; Gray, S.J.; Walia, J.S. Treatment of GM2 Gangliosidosis in Adult Sandhoff Mice Using an Intravenous Self-Complementary Hexosaminidase Vector. Curr. Gene Ther. 2022, 22, 262–276. [Google Scholar] [CrossRef]
- Shaimardanova, A.A.; Chulpanova, D.S.; Solovyeva, V.V.; Aimaletdinov, A.M.; Rizvanov, A.A. Functionality of a Bicistronic Construction Containing HEXA and HEXB Genes Encoding β-Hexosaminidase A for Cell-Mediated Therapy of GM2 Gangliosidoses. Neural Regen. Res. 2021, 17, 122–129. [Google Scholar] [CrossRef]
- Gray-Edwards, H.L.; Randle, A.N.; Maitland, S.A.; Benatti, H.R.; Hubbard, S.M.; Canning, P.F.; Vogel, M.B.; Brunson, B.L.; Hwang, M.; Ellis, L.E.; et al. Adeno-Associated Virus Gene Therapy in a Sheep Model of Tay-Sachs Disease. Hum. Gene Ther. 2018, 29, 312–326. [Google Scholar] [CrossRef] [PubMed]
- Wada, R.; Tifft, C.J.; Proia, R.L. Microglial Activation Precedes Acute Neurodegeneration in Sandhoff Disease and Is Suppressed by Bone Marrow Transplantation. Proc. Natl. Acad. Sci. USA 2000, 97, 10954–10959. [Google Scholar] [CrossRef]
- Myerowitz, R. Molecular Pathophysiology in Tay-Sachs and Sandhoff Diseases as Revealed by Gene Expression Profiling. Hum. Mol. Genet. 2002, 11, 1343–1350. [Google Scholar] [CrossRef] [PubMed]
- Futerman, A.H.; Meer, G. The Cell Biology of Lysosomal Storage Disorders. Nat. Rev. Mol. Cell. Biol. 2004, 5, 554–565. [Google Scholar] [CrossRef]
- Ogawa, Y. Improvement in Dysmyelination by the Inhibition of Microglial Activation in a Mouse Model of Sandhoff Disease. Neuroreport 2018, 29, 962–967. [Google Scholar] [CrossRef]
- Szklarczyk, D.; Gable, A.L.; Nastou, K.C.; Lyon, D.; Kirsch, R.; Pyysalo, S.; Doncheva, N.T.; Legeay, M.; Fang, T.; Bork, P.; et al. The STRING Database in 2021: Customizable Protein-Protein Networks, and Functional Characterization of User-Uploaded Gene/Measurement Sets. Nucleic Acids Res. 2021, 49, D605–D612. [Google Scholar] [CrossRef]
- Taylor, S.C.; Nadeau, K.; Abbasi, M.; Lachance, C.; Nguyen, M.; Fenrich, J. The Ultimate QPCR Experiment: Producing Publication Quality, Reproducible Data the First Time. Trends Biotechnol. 2019, 37, 761–774. [Google Scholar] [CrossRef]
- Ogawa, Y. FcRγ-Dependent Immune Activation Initiates Astrogliosis during the Asymptomatic Phase of Sandhoff Disease Model Mice. Sci. Rep. 2017, 7, 40518. [Google Scholar] [CrossRef]
- Greter, M.; Lelios, I.; Croxford, A.L. Microglia Versus Myeloid Cell Nomenclature during Brain Inflammation. Front. Immunol. 2015, 6, 249. [Google Scholar] [CrossRef]
- Hickman, S. Microglia in neurodegeneration. Nat. Neurosci. 2018, 21, 1359–1369. [Google Scholar] [CrossRef] [PubMed]
- Brown, G.C.; Vilalta, A. How microglia kill neurons. Brain Res. 2015, 1628, 288–297. [Google Scholar] [CrossRef] [PubMed]
- Jeyakumar, M. Central Nervous System Inflammation Is a Hallmark of Pathogenesis in Mouse Models of GM1 and GM2 Gangliosidosis. Brain 2003, 126, 974–987. [Google Scholar] [CrossRef] [PubMed]
- Davatelis, G. Cloning and Characterization of a CDNA for Murine Macrophage Inflammatory Protein (MIP), a Novel Monokine with Inflammatory and Chemokinetic Properties. J. Exp. Med. 1988, 167, 1939–1944. [Google Scholar] [CrossRef]
- Maurer, M.; Stebut, E. Macrophage inflammatory protein-1. Int. J. Biochem. Cell Biol. 2004, 36, 1882–1886. [Google Scholar] [CrossRef] [PubMed]
- Wolpe, S.D.; Cerami, A. Macrophage Inflammatory Proteins 1 and 2: Members of a Novel Superfamily of Cytokines. FASEB J. 1989, 3, 2565–2573. [Google Scholar] [CrossRef] [PubMed]
- Wu, Y.P.; Proia, R.L. Deletion of Macrophage-Inflammatory Protein 1 Alpha Retards Neurodegeneration in Sandhoff Disease Mice. Proc. Natl. Acad. Sci. USA 2004, 101, 8425–8430. [Google Scholar] [CrossRef]
- Ellrichmann, G. Constitutive Activity of NF-Kappa B in Myeloid Cells Drives Pathogenicity of Monocytes and Macrophages during Autoimmune Neuroinflammation. J. Neuroinflamm. 2012, 9, 15. [Google Scholar] [CrossRef]
- Cross, M. Mouse Lysozyme M Gene: Isolation, Characterization, and Expression Studies. Proc. Natl. Acad. Sci. USA 1988, 85, 6232–6236. [Google Scholar] [CrossRef]
- Wieghofer, P.; Prinz, M. Genetic Manipulation of Microglia during Brain Development and Disease. Biochim. Biophys. Acta 2016, 1862, 299–309. [Google Scholar] [CrossRef] [PubMed]
- Caravagna, C. Diversity of innate immune cell subsets across spatial and temporal scales in an EAE mouse model. Sci. Rep. 2018, 8, 5146. [Google Scholar] [CrossRef] [PubMed]
- Ragland, S.A.; Criss, A.K. From Bacterial Killing to Immune Modulation: Recent Insights into the Functions of Lysozyme. PLoS Pathog. 2017, 13, 1006512. [Google Scholar] [CrossRef] [PubMed]
- Paolicelli, R.C. Synaptic Pruning by Microglia Is Necessary for Normal Brain Development. Science 2011, 333, 1456–1458. [Google Scholar] [CrossRef]
- Lenz, K.M.; Nelson, L.H. Microglia and Beyond: Innate Immune Cells As Regulators of Brain Development and Behavioral Function. Front. Immunol. 2018, 9, 698. [Google Scholar] [CrossRef] [PubMed]
- Hanisch, U.K.; Kettenmann, H. Microglia: Active Sensor and Versatile Effector Cells in the Normal and Pathologic Brain. Nat. Neurosci. 2007, 10, 1387–1394. [Google Scholar] [CrossRef]
- Karlstetter, M. The Novel Activated Microglia/Macrophage WAP Domain Protein, AMWAP, Acts as a Counter-Regulator of Proinflammatory Response. J. Immunol. 2010, 185, 3379–3390. [Google Scholar] [CrossRef]
- Aslanidis, A. Activated Microglia/Macrophage Whey Acidic Protein (AMWAP) Inhibits NFκB Signaling and Induces a Neuroprotective Phenotype in Microglia. J. Neuroinflam. 2015, 12, 77. [Google Scholar] [CrossRef]
- Meech, R. The UDP-Glycosyltransferase (UGT) Superfamily: New Members, New Functions, and Novel Paradigms. Physiol. Rev. 2019, 99, 1153–1222. [Google Scholar] [CrossRef]
- Bosio, A.; Binczek, E.; Stoffel, W. Functional Breakdown of the Lipid Bilayer of the Myelin Membrane in Central and Peripheral Nervous System by Disrupted Galactocerebroside Synthesis. Proc. Natl. Acad. Sci. USA 1996, 93, 13280–13285. [Google Scholar] [CrossRef]
- Maldonado, E.N.; Alderson, N.L.; Monje, P.V.; Wood, P.M.; Hama, H. FA2H Is Responsible for the Formation of 2-Hydroxy Galactolipids in Peripheral Nervous System Myelin. J. Lipid. Res. 2008, 49, 153–161. [Google Scholar] [CrossRef]
- Pham-Dinh, D. Myelin/Oligodendrocyte Glycoprotein Is a Member of a Subset of the Immunoglobulin Superfamily Encoded within the Major Histocompatibility Complex. Proc. Natl. Acad. Sci. USA 1993, 90, 7990–7994. [Google Scholar] [CrossRef] [PubMed]
- Linington, C. Augmentation of Demyelination in Rat Acute Allergic Encephalomyelitis by Circulating Mouse Monoclonal Antibodies Directed against a Myelin/Oligodendrocyte Glycoprotein. Am. J. Pathol. 1988, 130, 443–454. [Google Scholar] [PubMed]
- Peschl, P. Myelin Oligodendrocyte Glycoprotein: Deciphering a Target in Inflammatory Demyelinating Diseases. Front. Immunol. 2017, 8, 529. [Google Scholar] [CrossRef] [PubMed]
- Ambrosius, W.; Michalak, S.; Kozubski, W.; Kalinowska, A. Myelin Oligodendrocyte Glycoprotein Antibody-Associated Disease: Current Insights into the Disease Pathophysiology, Diagnosis and Management. Int. J. Mol. Sci. 2020, 22, 100. [Google Scholar] [CrossRef]


| NCBI ID | Gene | Annotation |
|---|---|---|
| 100034251 | Wfdc17 | Activated macrophage/microglia WAP domain protein; WAP four-disulfide core domain 17 |
| 20302 | Ccl3 | C-C motif chemokine 3; Monokine with inflammatory, pyrogenic and chemokinetic properties. Has a potent chemotactic activity for eosinophils. Binding to a high-affinity receptor activates calcium release in neutrophils; Belongs to the intercrine β (chemokine CC) family |
| 17105 | Lyz2 | Lysozyme C-2; Lysozymes have primarily a bacteriolytic function; those in tissues and body fluids are associated with the monocyte- macrophage system and enhance the activity of immunoagents. Lyz2 is active against a range of Gram-positive and Gram-negative bacteria. More effective than Lyz1 in killing Gram-negative bacteria. Lyz1 and Lyz2 are equally effective in killing Gram- positive bacteria; Belongs to the glycosyl hydrolase 22 family |
| 338521 | Fa2h | 4-hydroxysphinganine ceramide fatty acyl 2-hydroxylase; Fatty acid 2-hydroxylase; Required for α-hydroxylation of free fatty acids and the formation of α-hydroxylated sphingolipids |
| 17441 | Mog | Myelin oligodendrocyte glycoprotein; Minor component of the myelin sheath. May be involved in completion and/or maintenance of the myelin sheath and in cell–cell communication. Mediates homophilic cell–cell adhesion |
| 22239 | Ugt8a | 2-hydroxyacylsphingosine 1-β-galactosyltransferase; Catalyzes the transfer of galactose to ceramide, a key enzymatic step in the biosynthesis of galactocerebrosides, which are abundant sphingolipids of the myelin membrane of the central nervous system and peripheral nervous system; Belongs to the UDP-glycosyltransferase family |
| Gene | Annotation |
|---|---|
| Hexb | β-hexosaminidase subunit β; Responsible for the degradation of GM2 gangliosides, and a variety of other molecules containing terminal N-acetyl hexosamines, in the brain and other tissues |
| Hexa | β-hexosaminidase subunit α; Responsible for the degradation of GM2 gangliosides, and a variety of other molecules containing terminal N-acetyl hexosamines, in the brain and other tissues |
| Gla | α-galactosidase a; Galactosidase, α |
| Naga | α-N-acetylgalactosaminidase; Removes terminal α-N-acetylgalactosamine residues from glycolipids and glycopeptides. Required for the breakdown of glycolipids (By similarity); Belongs to the glycosyl hydrolase 27 family |
| Glb1 | Galactosidase, β 1; β-galactosidase; Cleaves β-linked terminal galactosyl residues from gangliosides, glycoproteins, and glycosaminoglycans |
| Gns | N-acetylglucosamine-6-sulfatase; Glucosamine (N-acetyl)-6-sulfatase; Belongs to the sulfatase family |
| Chia1 | Acidic mammalian chitinase; Degrades chitin and chitotriose. May participate in the defense against nematodes, fungi and other pathogens. Plays a role in T-helper cell type 2 (Th2) immune response. Contributes to the response to IL-13 and inflammation in response to IL-13. Stimulates chemokine production by pulmonary epithelial cells. Protects lung epithelial cells against apoptosis and promotes phosphorylation of AKT1. |
| Nagk | N-acetyl-D-glucosamine kinase; Converts endogenous N-acetylglucosamine (GlcNAc), a major component of complex carbohydrates, from lysosomal degradation or nutritional sources into GlcNAc 6-phosphate. Involved in the N-glycolylneuraminic acid (Neu5Gc) degradation pathway. Furthermore, has ManNAc kinase activity |
| Chil5 | Chitinase 3-like 3/4; Belongs to the glycosyl hydrolase 18 family |
| Chit1 | Chitotriosidase-1; Degrades chitin, chitotriose and chitobiose. May participate in the defense against nematodes and other pathogens (By similarity); Belongs to the glycosyl hydrolase 18 family. Chitinase class II subfamily |
| Gene | annotation |
|---|---|
| Wfdc17 | Activated macrophage/microglia WAP domain protein; WAP four-disulfide core domain 17 |
| Gm9733 | Signal-regulatory protein α/beta1/γ; SIRP β 1 like 2 protein; Predicted gene 9733 |
| Gm4841 | Interferon-γ-inducible GTPase Ifgga3 protein; Predicted gene 4841 |
| Gm14548 | Leukocyte immunoglobulin-like receptor; Predicted gene 14548 |
| Tyrobp | TYRO protein tyrosine kinase-binding protein; Non-covalently associates with activating receptors of the CD300 family. Cross-linking of CD300-TYROBP complexes results in cellular activation. Involved for instance in neutrophil activation mediated by integrin |
| Clec4d | C-type lectin domain family 4 member D; Functions as an endocytic receptor. May be involved in antigen uptake at the site of infection, either for clearance of the antigen, or for processing and further presentation to T-cells (By similarity) |
| Cd68 | Macrosialin; Could play a role in phagocytic activities of tissue macrophages, both in intracellular lysosomal metabolism and extracellular cell–cell and cell-pathogen interactions. Binds to tissue- and organ-specific lectins or selectins, allowing homing of macrophage subsets to particular sites. Rapid recirculation of CD68 from endosomes and lysosomes to the plasma membrane may allow macrophages to crawl over selectin-bearing substrates or other cells; Belongs to the LAMP family |
| Plekhs1 | Pleckstrin homology domain containing, family S member 1 |
| Rs1 | Retinoschisis (x-linked, juvenile) 1 (human); Retinoschisin; Binds negatively charged membrane lipids, such as phosphatidylserine and phosphoinositides. May play a role in cell–cell adhesion processes in the retina, via homomeric interaction between octamers present on the surface of two neighboring cells (By similarity). Required for normal structure and function of the retina |
| Wap | Whey acidic protein; Could be a protease inhibitor. May play an important role in mammary gland development and tissue remodeling |
| Hiatl1 | Major facilitator superfamily domain containing 14b; Hippocampus abundant transcript-like 1 |
| Protein | Annotation |
|---|---|
| Ccl3 | C-C motif chemokine 3; Monokine with inflammatory, pyrogenic and chemokinetic properties. Has a potent chemotactic activity for eosinophils. Binding to a high-affinity receptor activates calcium release in neutrophils; Belongs to the intercrine β (chemokine CC) family |
| Ccr1 | Chemokine (c-c motif) receptor 1; C-C chemokine receptor type 1; Receptor for a C-C type chemokine. Binds to MIP-1-α, RANTES, and less efficiently, to MIP-1-β or MCP-1 and subsequently transduces a signal by increasing the intracellular calcium ions level. Responsible for affecting stem cell proliferation |
| Il6 | Interleukin-6; Cytokine with a wide variety of biological functions. It is a potent inducer of the acute phase response. Plays an essential role in the final differentiation of B-cells into Ig- secreting cells Involved in lymphocyte and monocyte differentiation. Acts on B-cells, T-cells, hepatocytes, hematopoietic progenitor cells and cells of the CNS. Required for the generation of T(H)17 cells. Furthermore, acts as a myokine. It is discharged into the bloodstream after muscle contraction and acts to increase the breakdown of fats and to improve insulin resistance. |
| Ccr5 | Chemokine (c-c motif) receptor 5; C-C chemokine receptor type 5; Receptor for a number of inflammatory CC-chemokines including MIP-1-α, MIP-1-β and RANTES and subsequently transduces a signal by increasing the intracellular calcium ion level. May play a role in the control of granulocytic lineage proliferation or differentiation (By similarity) |
| Csf2 | Colony stimulating factor 2 (granulocyte-macrophage); Granulocyte-macrophage colony-stimulating factor; Cytokine that stimulates the growth and differentiation of hematopoietic precursor cells from various lineages, including granulocytes, macrophages, eosinophils and erythrocytes |
| Cxcl10 | C-X-C motif chemokine 10; In addition to its role as a proinflammatory cytokine, may participate in T-cell effector function and perhaps T-cell development; Belongs to the intercrine α (chemokine CxC) family |
| Tab2 | TGF-β-activated kinase 1 and MAP3K7-binding protein 2; Adapter linking MAP3K7/TAK1 and TRAF6. Promotes MAP3K7 activation in the IL1 signaling pathway. The binding of ‘Lys-63’- linked polyubiquitin chains to TAB2 promotes autophosphorylation of MAP3K7 at ‘Thr-187’ (By similarity). Regulates the IL1-mediated translocation of NCOR1 out of the nucleus. Involved in heart development (By similarity) |
| Tnf | Tumor necrosis factor superfamily, member 2; Tumor necrosis factor; Cytokine that binds to TNFRSF1A/TNFR1 and TNFRSF1B/TNFBR. It is mainly secreted by macrophages and can induce cell death of certain tumor cell lines. It is potent pyrogen causing fever by direct action or by stimulation of interleukin-1 secretion and is implicated in the induction of cachexia, Under certain conditions it can stimulate cell proliferation and induce cell differentiation |
| Ccl4 | Chemokine (c-c motif) ligand 4; C-C motif chemokine 4; Monokine with inflammatory and chemokinetic properties |
| Il10 | Interleukin-10; Inhibits the synthesis of a number of cytokines, including IFN-γ, IL-2, IL-3, TNF and GM-CSF produced by activated macrophages and by helper T-cells |
| Il6 | Interleukin-6; Cytokine with a wide variety of biological functions. It is a potent inducer of the acute phase response. Plays an essential role in the final differentiation of B-cells into Ig- secreting cells Involved in lymphocyte and monocyte differentiation. Acts on B-cells, T-cells, hepatocytes, hematopoietic progenitor cells and cells of the CNS. Required for the generation of T(H)17 cells. Furthermore, acts as a myokine. It is discharged into the bloodstream after muscle contraction and acts to increase the breakdown of fats and to improve insulin resistance. |
| Protein | Annotation |
|---|---|
| Lyz2 | Lysozyme C-2; Lysozymes have primarily a bacteriolytic function; those in tissues and body fluids are associated with the monocyte- macrophage system and enhance the activity of immunoagents. Lyz2 is active against a range of Gram-positive and Gram-negative bacteria. More effective than Lyz1 in killing Gram-negative bacteria. Lyz1 and Lyz2 are equally effective in killing Gram- positive bacteria; Belongs to the glycosyl hydrolase 22 family |
| Lyz1 | Lysozyme C-1; Lysozymes have primarily a bacteriolytic function; those in tissues and body fluids are associated with the monocyte- macrophage system and enhance the activity of immunoagents. Lyz1 is active against a range of Gram-positive and Gram-negative bacteria. Less effective than Lyz2 in killing Gram-negative bacteria. Lyz1 and Lyz2 are equally effective in killing Gram- positive bacteria; Belongs to the glycosyl hydrolase 22 family |
| Protein | Annotation |
|---|---|
| Fa2h | 4-hydroxysphinganine ceramide fatty acyl 2-hydroxylase; Fatty acid 2-hydroxylase; Required for α-hydroxylation of free fatty acids and the formation of α-hydroxylated sphingolipids |
| Scd1 | Stearoyl-coa desaturase (delta-9 desaturase); Acyl-CoA desaturase 1; Stearyl-CoA desaturase that utilizes O(2) and electrons from reduced cytochrome b5 to introduce the first double bond into saturated fatty acyl-CoA substrates. Catalyzes the insertion of a cis double bond at the delta-9 position into fatty acyl-CoA substrates including palmitoyl-CoA and stearoyl-CoA. Gives rise to a mixture of 16:1 and 18:1 unsaturated fatty acids. Plays an important role in lipid biosynthesis. Plays an important role in regulating the expression of genes that are involved in lipogenesis. |
| Dync1li2 | Cytoplasmic dynein 1 light intermediate chain 2; Acts as one of several non-catalytic accessory components of the cytoplasmic dynein 1 complex that are thought to be involved in linking dynein to cargos and to adapter proteins that regulate dynein function. Cytoplasmic dynein 1 acts as a motor for the intracellular retrograde motility of vesicles and organelles along microtubules. May play a role in binding dynein to membranous organelles or chromosomes (By similarity) |
| Agmo | Alkylglycerol monooxygenase; Glyceryl-ether monooxygenase that cleaves the O-alkyl bond of ether lipids. Ether lipids are essential components of brain membranes (By similarity); Belongs to the sterol desaturase family. TMEM195 subfamily |
| Aldh3a2 | Aldehyde dehydrogenase family 3, subfamily a2; Fatty aldehyde dehydrogenase; Catalyzes the oxidation of long-chain aliphatic aldehydes to fatty acids. Responsible for conversion of the sphingosine 1-phosphate (S1P) degradation product hexadecenal to hexadecenoic acid (By similarity) |
| Acer3 | Alkaline ceramidase 3; Hydrolyzes only phytoceramide into phytosphingosine and free fatty acid. Does not have reverse activity (By similarity) |
| Asah2 | N-acylsphingosine amidohydrolase 2; Neutral ceramidase; Hydrolyzes the sphingolipid ceramide into sphingosine and free fatty acid at an optimal pH of 6.5–8.5. Acts as a key regulator of sphingolipid signaling metabolites by generating sphingosine at the cell surface. Acts as a repressor of apoptosis both by reducing C16-ceramide, thereby preventing ceramide-induced apoptosis, and generating sphingosine, a precursor of the antiapoptotic factor sphingosine 1-phosphate. Probably involved in the digestion of dietary sphingolipids in intestine. |
| Gba2 | Non-lysosomal glucosylceramidase; Non-lysosomal glucosylceramidase that catalyzes the conversion of glucosylceramide (GlcCer) to free glucose and ceramide. Involved in sphingomyelin generation and prevention of glycolipid accumulation. May also catalyze the hydrolysis of bile acid 3-O-glucosides, however, the relevance of such activity is unclear in vivo. Plays a role in central nevous system development (By similarity). Required for proper formation of motor neuron axons (By similarity) |
| Pla2g6 | 85/88 kDa calcium-independent phospholipase A2; Catalyzes the release of fatty acids from phospholipids. It has been implicated in normal phospholipid remodeling, nitric oxide-induced or vasopressin-induced arachidonic acid release and in leukotriene and prostaglandin production. May participate in fas mediated apoptosis and in regulating transmembrane ion flux in glucose-stimulated B-cells. Has a role in cardiolipin (CL) deacylation. Required for both speed and directionality of monocyte MCP1/CCL2-induced chemotaxis through regulation of F- actin polymerization at the pseudopods. |
| 1600014C10Rik | Protein C19orf12 homolog; RIKEN cDNA 1600014C10 gene |
| Protein | Annotation |
|---|---|
| Mog | Myelin oligodendrocyte glycoprotein; Minor component of the myelin sheath. May be involved in completion and/or maintenance of the myelin sheath and in cell–cell communication. Mediates homophilic cell–cell adhesion |
| Zfp57 | Krab domain-containing zinc finger protein; Zinc finger protein 57; Transcription regulator required to maintain maternal and paternal gene imprinting, a process by which gene expression is restricted in a parent of origin-specific manner by epigenetic modification of genomic DNA and chromatin, including DNA methylation. Acts by controlling DNA methylation during the earliest multicellular stages of development at multiple imprinting control regions. Required for the establishment of maternal methylation imprints at SNRPN locus. Acts as a transcriptional repressor in Schwann cells. |
| Aqp4 | Aquaporin-4; Forms a water-specific channel. Osmoreceptor which regulates body water balance and mediates water flow within the central nervous system |
| Plp1 | Myelin proteolipid protein; This is the major myelin protein from the central nervous system. It plays an important role in the formation or maintenance of the multilamellar structure of myelin; Belongs to the myelin proteolipid protein family |
| Mobp | Myelin-associated oligodendrocytic basic protein; Myelin-associated oligodendrocyte basic protein; May play a role in compacting or stabilizing the myelin sheath possibly by binding the negatively charged acidic phospholipids of the cytoplasmic membrane |
| Mag | Myelin-associated glycoprotein; Adhesion molecule that mediates interactions between myelinating cells and neurons by binding to neuronal sialic acid- containing gangliosides and to the glycoproteins RTN4R and RTN4RL2. Not required for initial myelination, but seems to play a role in the maintenance of normal axon myelination. Protects motoneurons against apoptosis, also after injury; protection against apoptosis is probably mediated via interaction with neuronal RTN4R and RTN4RL2. Required to prevent degeneration of myelinated axons in adults. |
| Mbp | Myelin basic protein; The classic group of MBP isoforms (isoform 4-isoform 13) are with PLP the most abundant protein components of the myelin membrane in the CNS. They have a role in both its formation and stabilization. The non-classic group of MBP isoforms (isoform 1-isoform 3/Golli-MBPs) may preferentially have a role in the early developing brain long before myelination, maybe as components of transcriptional complexes, and may also be involved in signaling pathways in T-cells and neural cells. |
| Gfap | Glial fibrillary acidic protein; GFAP, a class-III intermediate filament, is a cell- specific marker that, during the development of the central nervous system, distinguishes astrocytes from other glial cells |
| Il17a | Interleukin-17A; Ligand for IL17RA. The heterodimer formed by IL17A and IL17F is a ligand for the heterodimeric complex formed by IL17RA and IL17RC (By similarity). Involved in inducing stromal cells to produce proinflammatory and hematopoietic cytokines (By similarity) |
| Cd4 | T-cell surface glycoprotein CD4; Integral membrane glycoprotein that plays an essential role in the immune response and serves multiple functions in responses against both external and internal offenses. In T-cells, functions primarily as a coreceptor for MHC class II molecule:peptide complex. The antigens presented by class II peptides are derived from extracellular proteins while class I peptides are derived from cytosolic proteins. Interacts simultaneously with the T-cell receptor (TCR) and the MHC class II presented by antigen presenting cells (APCs). |
| Cd209d | C-type lectin domain family 4 member m; CD209 antigen-like protein D; Probable pathogen-recognition receptor. May mediate the endocytosis of pathogens which are subsequently degraded in lysosomal compartments. May recognize in a calcium-dependent manner high mannose N-linked oligosaccharides in a variety of pathogen antigens |
| Protein | Annotation |
|---|---|
| Ugt8a | 2-hydroxyacylsphingosine 1-β-galactosyltransferase; Catalyzes the transfer of galactose to ceramide, a key enzymatic step in the biosynthesis of galactocerebrosides, which are abundant sphingolipids of the myelin membrane of the central nervous system and peripheral nervous system; Belongs to the UDP-glycosyltransferase family |
| Cerk | Ceramide kinase; Catalyzes specifically the phosphorylation of ceramide to form ceramide 1-phosphate. Acts efficiently on natural and analog ceramides (C6, C8, C16 ceramides, and C8-dihydroceramide), to a lesser extent on C2-ceramide and C6-dihydroceramide, but not on other lipids, such as various sphingosines (By similarity) |
| Degs2 | Sphingolipid delta(4)-desaturase/C4-monooxygenase DES2; Bifunctional enzyme which acts as both a sphingolipid delta(4)-desaturase and a sphingolipid C4-monooxygenase; Belongs to the fatty acid desaturase type 1 family. DEGS subfamily |
| Cers3 | Ceramide synthetase; Ceramide synthase 3; Has (dihydro)ceramide synthesis activity with relatively broad substrate specificity, but a preference for C18:0 and other middle- to long-chain fatty acyl-CoAs. It is crucial for the synthesis of very long-chain ceramides in the epidermis, to maintain epidermal lipid homeostasis and terminal differentiation (By similarity) |
| Smpd4 | Sphingomyelin phosphodiesterase 4; Catalyzes the hydrolysis of membrane sphingomyelin to form phosphorylcholine and ceramide |
| Sgpp2 | Sphingosine-1-phosphate phosphotase 2; Sphingosine-1-phosphate phosphatase 2; Has specific phosphohydrolase activity towards sphingoid base 1-phosphates. Has high phosphohydrolase activity against dihydrosphingosine-1-phosphate and sphingosine-1-phosphate (S1P) in vitro. May play a role in attenuating intracellular sphingosine 1-phosphate (S1P) signaling. May play a role in pro-inflammatory signaling (By similarity) |
| Ugcg | Udp-glucose ceramide glucosyltransferase; Ceramide glucosyltransferase; Catalyzes the first glycosylation step in glycosphingolipid biosynthesis, the transfer of glucose to ceramide. May also serve as a “flippase” (By similarity) |
| Cers2 | Ceramide synthetase; Ceramide synthase 2; Suppresses the growth of cancer cells. May be involved in sphingolipid synthesis (By similarity) |
| Sgms1 | Phosphatidylcholine:ceramide cholinephosphotransferase 1; Sphingomyelin synthases synthesize the sphingolipid, sphingomyelin, through transfer of the phosphatidyl head group, phosphatidylcholine, on to the primary hydroxyl of ceramide. The reaction is bidirectional depending on the respective levels of the sphingolipid and ceramide. Golgi apparatus SMS1 directly and specifically recognizes the choline head group on the substrate, requiring two fatty chains on the choline-P donor molecule in order to be recognized efficiently as a substrate. Major form in macrophages. |
Publisher’s Note: MDPI stays neutral with regard to jurisdictional claims in published maps and institutional affiliations. |
© 2022 by the authors. Licensee MDPI, Basel, Switzerland. This article is an open access article distributed under the terms and conditions of the Creative Commons Attribution (CC BY) license (https://creativecommons.org/licenses/by/4.0/).
Share and Cite
Singh, K.; Quinville, B.M.; Mitchell, M.; Chen, Z.; Walia, J.S. Gene Expression Profile in the Sandhoff Mouse Brain with Progression of Age. Genes 2022, 13, 2020. https://doi.org/10.3390/genes13112020
Singh K, Quinville BM, Mitchell M, Chen Z, Walia JS. Gene Expression Profile in the Sandhoff Mouse Brain with Progression of Age. Genes. 2022; 13(11):2020. https://doi.org/10.3390/genes13112020
Chicago/Turabian StyleSingh, Kshitiz, Brianna M. Quinville, Melissa Mitchell, Zhilin Chen, and Jagdeep S. Walia. 2022. "Gene Expression Profile in the Sandhoff Mouse Brain with Progression of Age" Genes 13, no. 11: 2020. https://doi.org/10.3390/genes13112020
APA StyleSingh, K., Quinville, B. M., Mitchell, M., Chen, Z., & Walia, J. S. (2022). Gene Expression Profile in the Sandhoff Mouse Brain with Progression of Age. Genes, 13(11), 2020. https://doi.org/10.3390/genes13112020