1. Introduction
Morinda officinalis is a perennial vine mainly distributed in tropical and subtropical regions [
1]. In Vietnam,
M. officinalis is found in the wild in provinces such as Cao Bang, Lao Cai, Ha Giang, Quang Binh, Thua Thien Hue, and Quang Tri [
2,
3,
4].
M. officinalis contains various bioactive components and has been used for decades as a tonic and an antirheumatic medicinal herb in some Asian countries [
2,
5,
6]. The root of
M. officinalis has long been used as a tonic or nutrient supplement for alleviating diseases such as depression, Alzheimer’s disease, impotence, osteoporosis, and rheumatoid arthritis [
6].
In Vietnam, due to the rapid increase in the demand for medicinal herbs, this plant has been over-exploited, leading to the depletion of raw materials. Additionally, because
M. officinalis has slow growth and poor regeneration, its natural population has significantly shrunk and become endangered [
2,
4]. With the natural population reduced by at least 50%, this species has recently been classified as an endangered precious medicinal plant species [
7]. Therefore, it is necessary to study the genetic diversity and structure of the natural population in order to conserve it effectively.
Nowadays, phylogenetic studies are necessary to conserve rare medicinal plants. In addition to representing the relationships among species in the tree of life, phylogenetic studies provide a framework for interdisciplinary investigations in taxonomy, evolutionary biology, biogeography, ecology, and conservation [
8]. More recently, phylogenetic approaches based on molecular data have also proven to be an indispensable tool for genome comparisons. These approaches are used to identify genes and regulatory elements, interpret modern and ancient individual genomes, and reconstruct ancestral genomes [
9], providing conservationists with background information to make conservation policies efficiently.
DNA barcoding is a universally used and reliable method of identifying plant species and has become a major focus in the fields of biodiversity and conservation. This molecular technique is not influenced by external factors or development stage, and DNA can be easily isolated from all tissues, providing an important basis for species identification at the genetic level [
10]. Recently,
rbcL and
matK plastid coding genes were recommended as barcodes for plant species and have become the most used markers in flowering plants, as the rbcL region is highly suitable for amplification and sequencing [
10,
11]. Meanwhile, the nuclear
ITS region includes both the
ITS1 and
ITS2 regions, with relatively strong discrimination power, that serve as complementary barcodes to matK and rbcL in plants. The four markers (
ITS1,
ITS2,
MatK, and
rbcL) used in this study have also proven effective in identifying medicinal species [
12,
13,
14].
Currently, molecular markers help detect variations or polymorphisms that exist among individuals in the population for specific regions of DNA [
15]. Among commonly used molecular markers such as AFLP (amplified fragment length polymorphism), RAPD (random amplified polymorphic), SSR (simple sequence repeat), and ISSR (inter simple sequence repeat), simple sequence repeat (SSR) markers are useful tools for research in plant genetics, breeding, and identification of individuals and species due to the allelic sequence diversity. SSRs are widely spread in the genome and have high codominant inheritance, polymorphism, and multiallelic variation [
16,
17,
18,
19].
Studies on molecular markers have been carried out on
M. officinalis [
5,
20]. Liao et al. in particular developed an SSR marker dataset to serve in further research related to this plant.
The SSR marker has the advantage of using only a tiny amount of DNA. In addition, this method involves a more straightforward, faster, and more cost-effective technique than other methods.
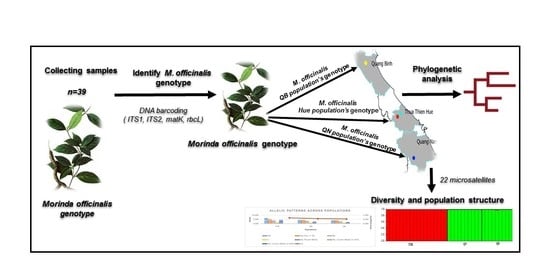
In this study, before evaluating the genetic diversity and population structure of M. officinalis by using SSR markers, we used DNA barcoding to identify this species in three different provinces in central Vietnam (Quang Binh, Thua Thien Hue, and Quang Nam). The current study aimed to pave the way for protecting wild M. officinalis populations.
2. Materials and Methods
2.1. Plant Materials
The leaves of 37
M. officinalis trees were randomly collected from 3 populations in the central provinces of Quang Binh, Thua Thien Hue, and Quang Nam in Vietnam. In the field, the samples were placed in plastic bags containing silica gel. Next, the samples were transferred to the Genetic Laboratory of the Biology Department at Hue University of Education and stored at −20 °C until DNA extraction. Sampling locations were recorded using a global positioning system (GPS) (
Figure 1,
Table S1).
2.2. DNA Extraction
Genomic DNA was extracted from 100 mg of young leaf samples using a Plant Genomic DNA Extraction Kit (Bioteke Corporation, Beijing, China) according to the manufacturer’s protocol. The quality of the extracted DNA was further estimated via 0.8% agarose gel electrophoresis. Safe dye (Phu Sa Biochem, Can Tho, Vietnam) was applied for DNA gel stain. Gel imaging was performed using a UV gel imaging system (Major Science, Saratoga, CA, USA). The isolated DNA was then stored at −20 °C until further analysis.
2.3. DNA Barcoding Amplification and Sequencing
A polymerase chain reaction (PCR) was performed using standard universal plant DNA barcoding primers (
Table 1), with 25 μL of the reaction mixture containing 2.0 μL of template DNA (50 ng), 12.5 µL of 2X Taq Master Mix, 0.5 µL of each primer (10 pmol) (
Table 2), and 9.5 µL of deionized water. PCR amplification was carried out with an Aeris™ PCR Aeris Thermal Cycler (21 Changi South Street 1, Singapore). The PCR conditions followed those laid out in the previous publication [
8].
To check the presence or absence of bands, amplified PCR products were electrophoresed using 0.8% agarose gel (1 × TAE buffer and 5 μL/mL safe dye). Gel imaging was carried out using a UV gel imaging system (Major Science, Saratoga, CA, USA). Band size of amplified products was determined using a Thermo Scientific GeneRuler 100 bp DNA Ladder (Thermo Fisher Scientific, Waltham, MA, USA).
The PCR products were sent to First Base Laboratories Sdn. Bhd (Taman Serdang Perdana, Seri Kembangan, Selangor, Malaysia) for purification and sequencing service, using the same primers as those used for the PCR.
2.4. Microsatellite Amplification
In all, 37 genomic DNA samples were used in this study. A polymerase chain reaction (PCR) was performed in 25 μL of reaction mixture that contained 2.0 μL of template DNA, 12.5 µL of 2X Taq Master Mix, 0.5 µL of each primer, and 9.5 µL of deionized water.
Liao et al. [
20] have described the 22 microsatellite loci used to generate data for the current study (
Table S2).
PCR amplification was carried out with an Aeris™ PCR Aeris Thermal Cycler as follows: Initial denaturation was carried out at 95 °C for 3 min. This was followed by 35 cycles of 45 s each at 94 °C for denaturation, 45 s of alignment at the annealing temperature (50–52 °C) for each primer pair, and 45 s of alignment at 72 °C for extension. Finally, 10 min of alignment at 72 °C for the final cycle completed the extension of any remaining products. The samples were kept at 4 °C until they were analyzed.
The amplification products were separated on 8% polyacrylamide gels in 1 × TAE buffer using the Mini Vertical Gel Electrophoresis Apparatus (Major Science, Saratoga, CA, USA) and visualized with safe dye (Phu Sa company). A UV gel imaging system (Major Science, Saratoga, CA, USA) was used to verify the presence of amplified fragments.
2.5. Data Analysis
2.5.1. DNA Barcoding
To obtain the sequence of each region (
ITS1,
ITS2,
matK, and
rbcL), the forward and reverse sequences were aligned using BioEdit version 7.2.5 software [
21]. In searching for the similarities between those sequences and the sequences deposited in the GenBank database, the sequences of this study were analyzed using the BLAST (Basic Local Alignment Search Tool) program at
http://www.ncbi.nlm.nih.gov/BLAST (accessed on 20 June 2022) [
22] (
Table S3).
The alignment was then exported to Molecular Evolutionary Genetics Analysis (MEGA-X) software for phylogenetic analysis [
23]. The maximum likelihood trees were constructed for
ITS1,
ITS2,
matK, and
rbcL data separately using the Kimura 2-parameter model [
24] with 1000 bootstrap replicates for node supports.
2.5.2. Genetic Diversity
Size of bands was detected by GelAnalyzer 19.1 software (
www.gelanalyzer.com (accessed on 4 January 2022), by Istvan Lazar Jr. and Istvan Lazar Sr).
To determine the level of genetic variation within a population, the following genetic diversity parameters were calculated: mean number of alleles per locus (A), number of unique alleles, the effective number of alleles (Ne), average observed heterozygosity (Ho), average expected heterozygosity (He), and fixation index (F
IS). All calculations were performed in GenAIEx v.6.5 [
25].
A genetic distance matrix of pairwise F
ST values was also used to perform a hierarchical analysis of molecular variance (AMOVA) in GenAIEx v.6.5 [
25]. Significance levels were determined using 999 permutations. AMOVA was used to estimate and partition the total variances at two hierarchy levels: within populations and among populations.
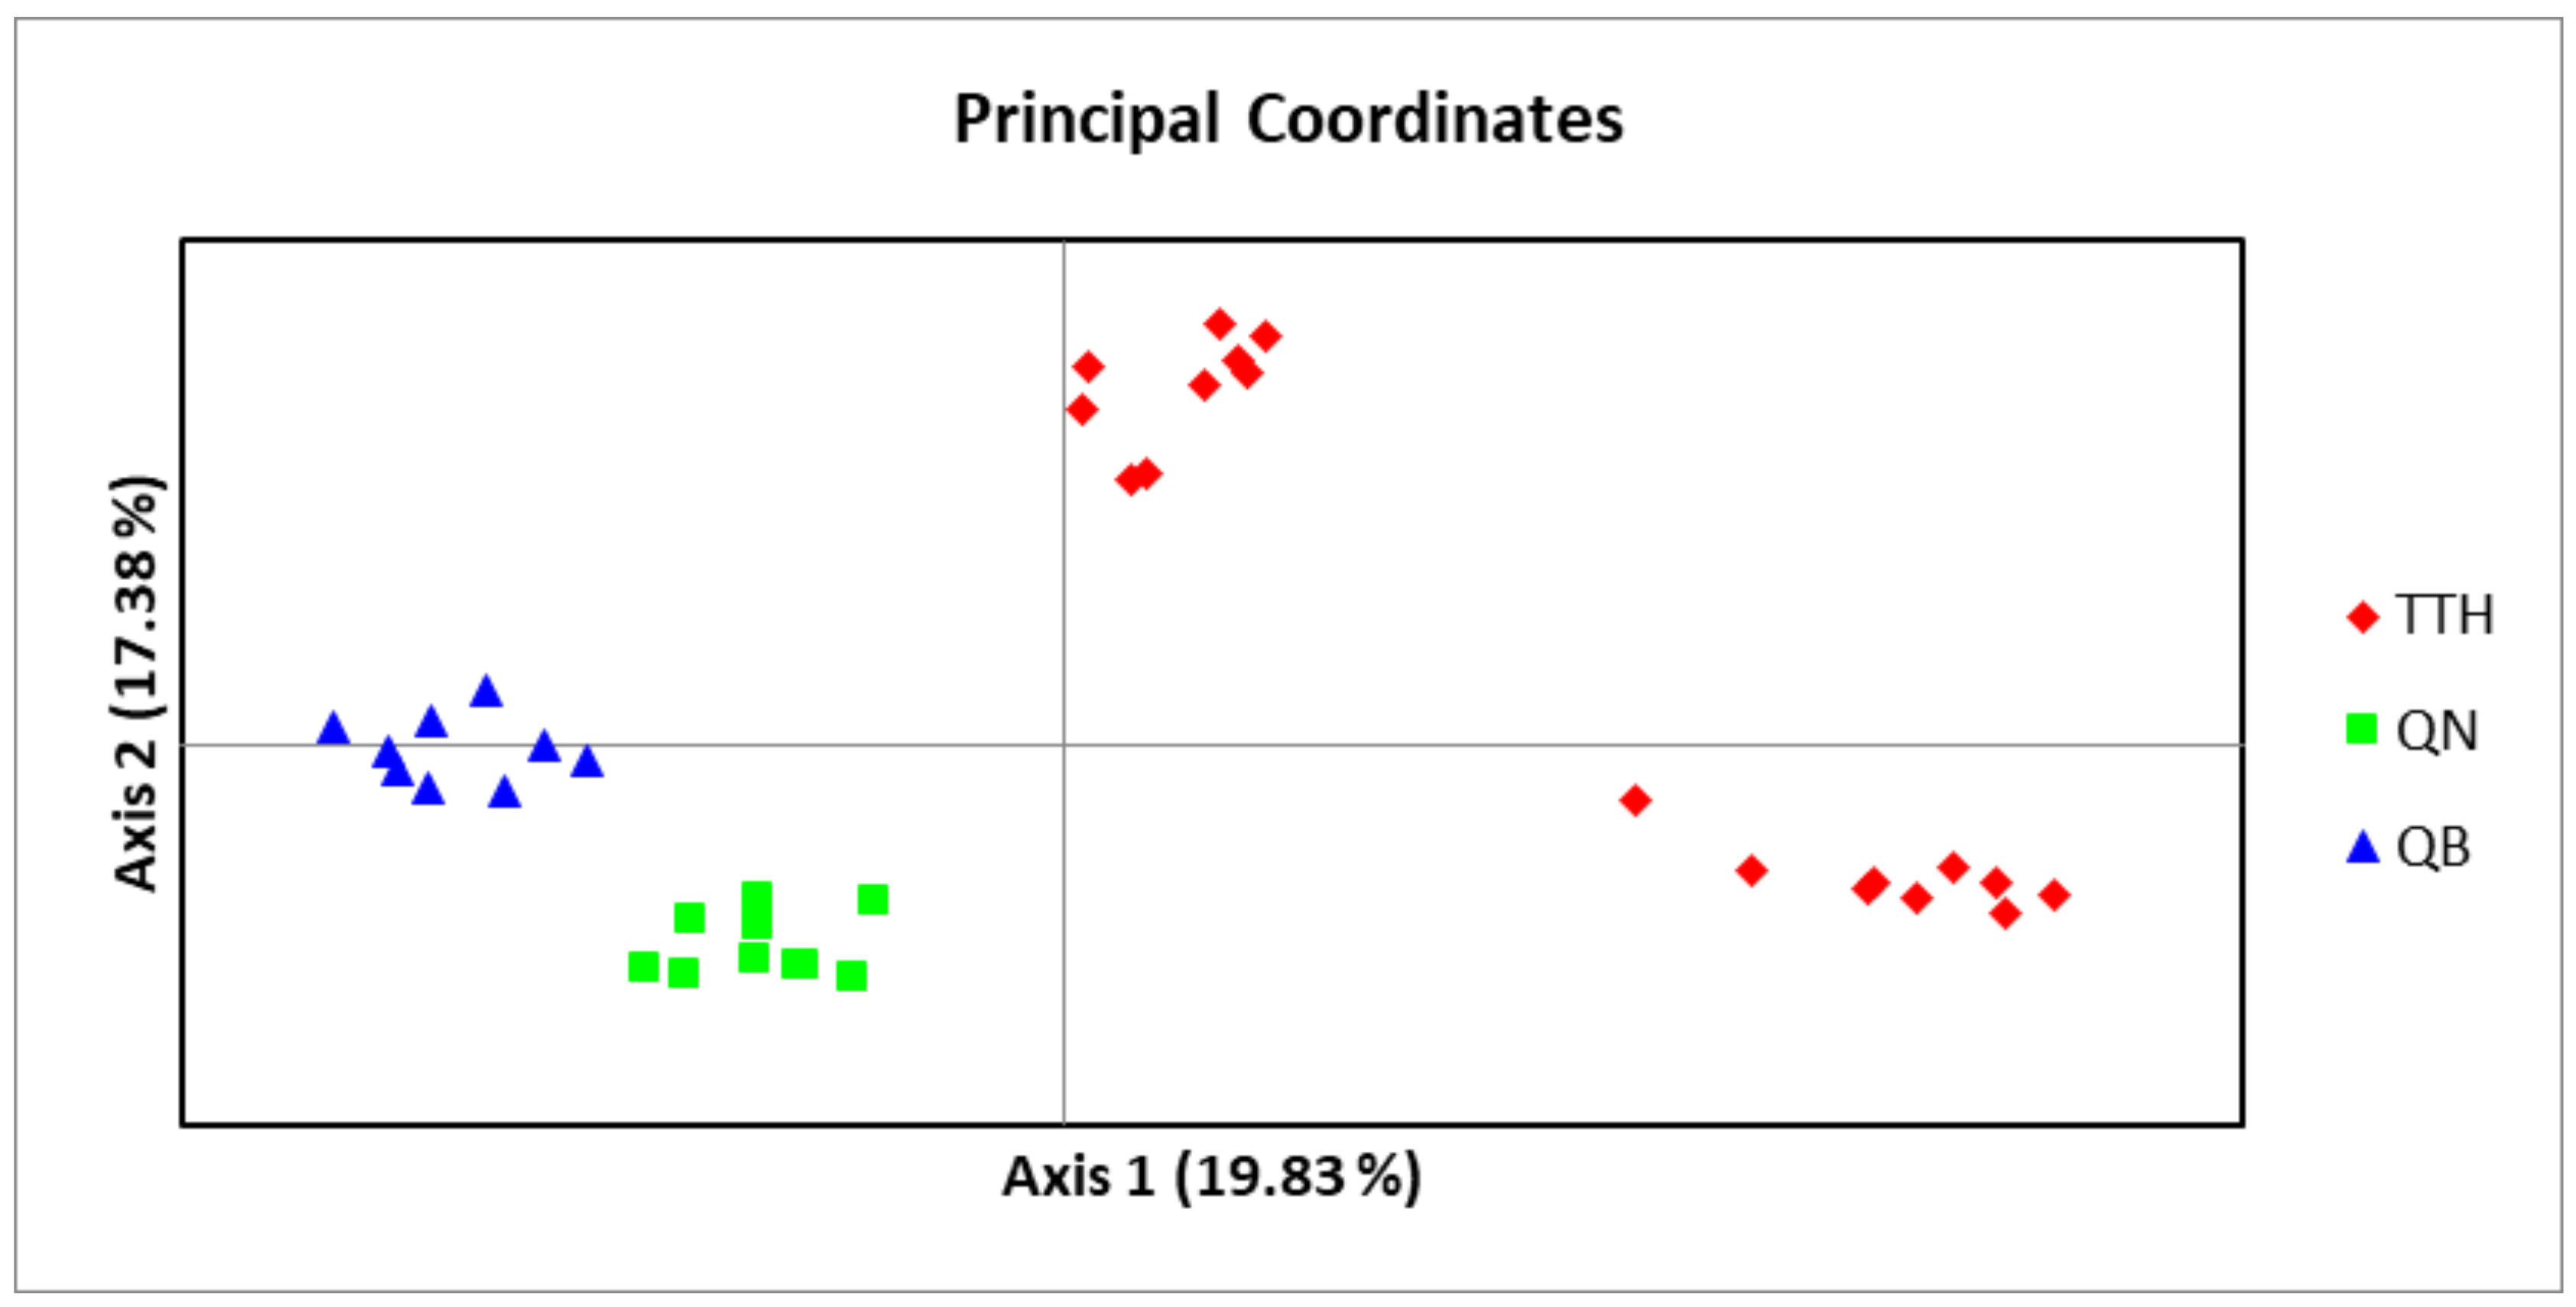
Principal coordinate analysis (PCoA) based on the codominant genotypic distance for 37 studied samples of 3 populations of
M. officinalis was carried out in GenAIEx [
25].
To determine the optimal value of the genetic clusters (K), a Bayesian analysis of the population structure was performed with STRUCTURE v.2.3.4 (
https://web.stanford.edu/group/pritchardlab/structure.html (accessed on 28 July 2022) [
26]. Once the admixture model was set with a correlated allele frequency and ancestry models, 10 separate runs of the number of clusters (K) in the dataset were performed from 1 to 10 for each K value at 500,000 Markov Chain Monte Carlo (MCMC) repetitions and a 100,000 burn-in period. The optimal value of K was detected using Structure Harvester [
27] based on the ΔK value by Evanno et al. [
28].
3. Results
3.1. DNA Barcoding
For this study’s DNA barcoding amplification process, we selected three samples per population, using four different primers to identify species. The results showed that ITS1 and ITS2 markers gave fragments of molecular weight as expected and bands of PCR products were clear for further research in all samples of the three populations, whereas some samples that used matK and rbcL markers for amplification had negative results and therefore their sequences were not determined.
A total of 27 assembled sequences were obtained and deposited in the GenBank: nine assembled sequences of ITS1 amplicon, nine assembled sequences of ITS2 amplicon, four assembled sequences of matK amplicon, and five assembled sequences of rbcL amplicon. The BLAST tool was used to identify the plant for each sequence, and the closest species in the GenBank was obtained. The results showed that all markers used and plants deposited in this study belonged to the genus Morinda. Gynochthodes officinalis (synonym of M. officinalis) was the most closely related species, with a higher extent than other species of the Morinda genus.
In our study,
ITS1 and
ITS2 were the most effective in terms of the amplification process (100%) (
Table 2).
In the case of ITS1 region sequences (~179 bp), through use of the
ITS1 pair of primers (
ITS 5a forward and 4 reverse) and the BLAST tool for identification, the closest species was found to be
M. officinalis, at 98.88% similarity (
Table 3). The phylogenetic tree for those sequences was constructed with the closest species (
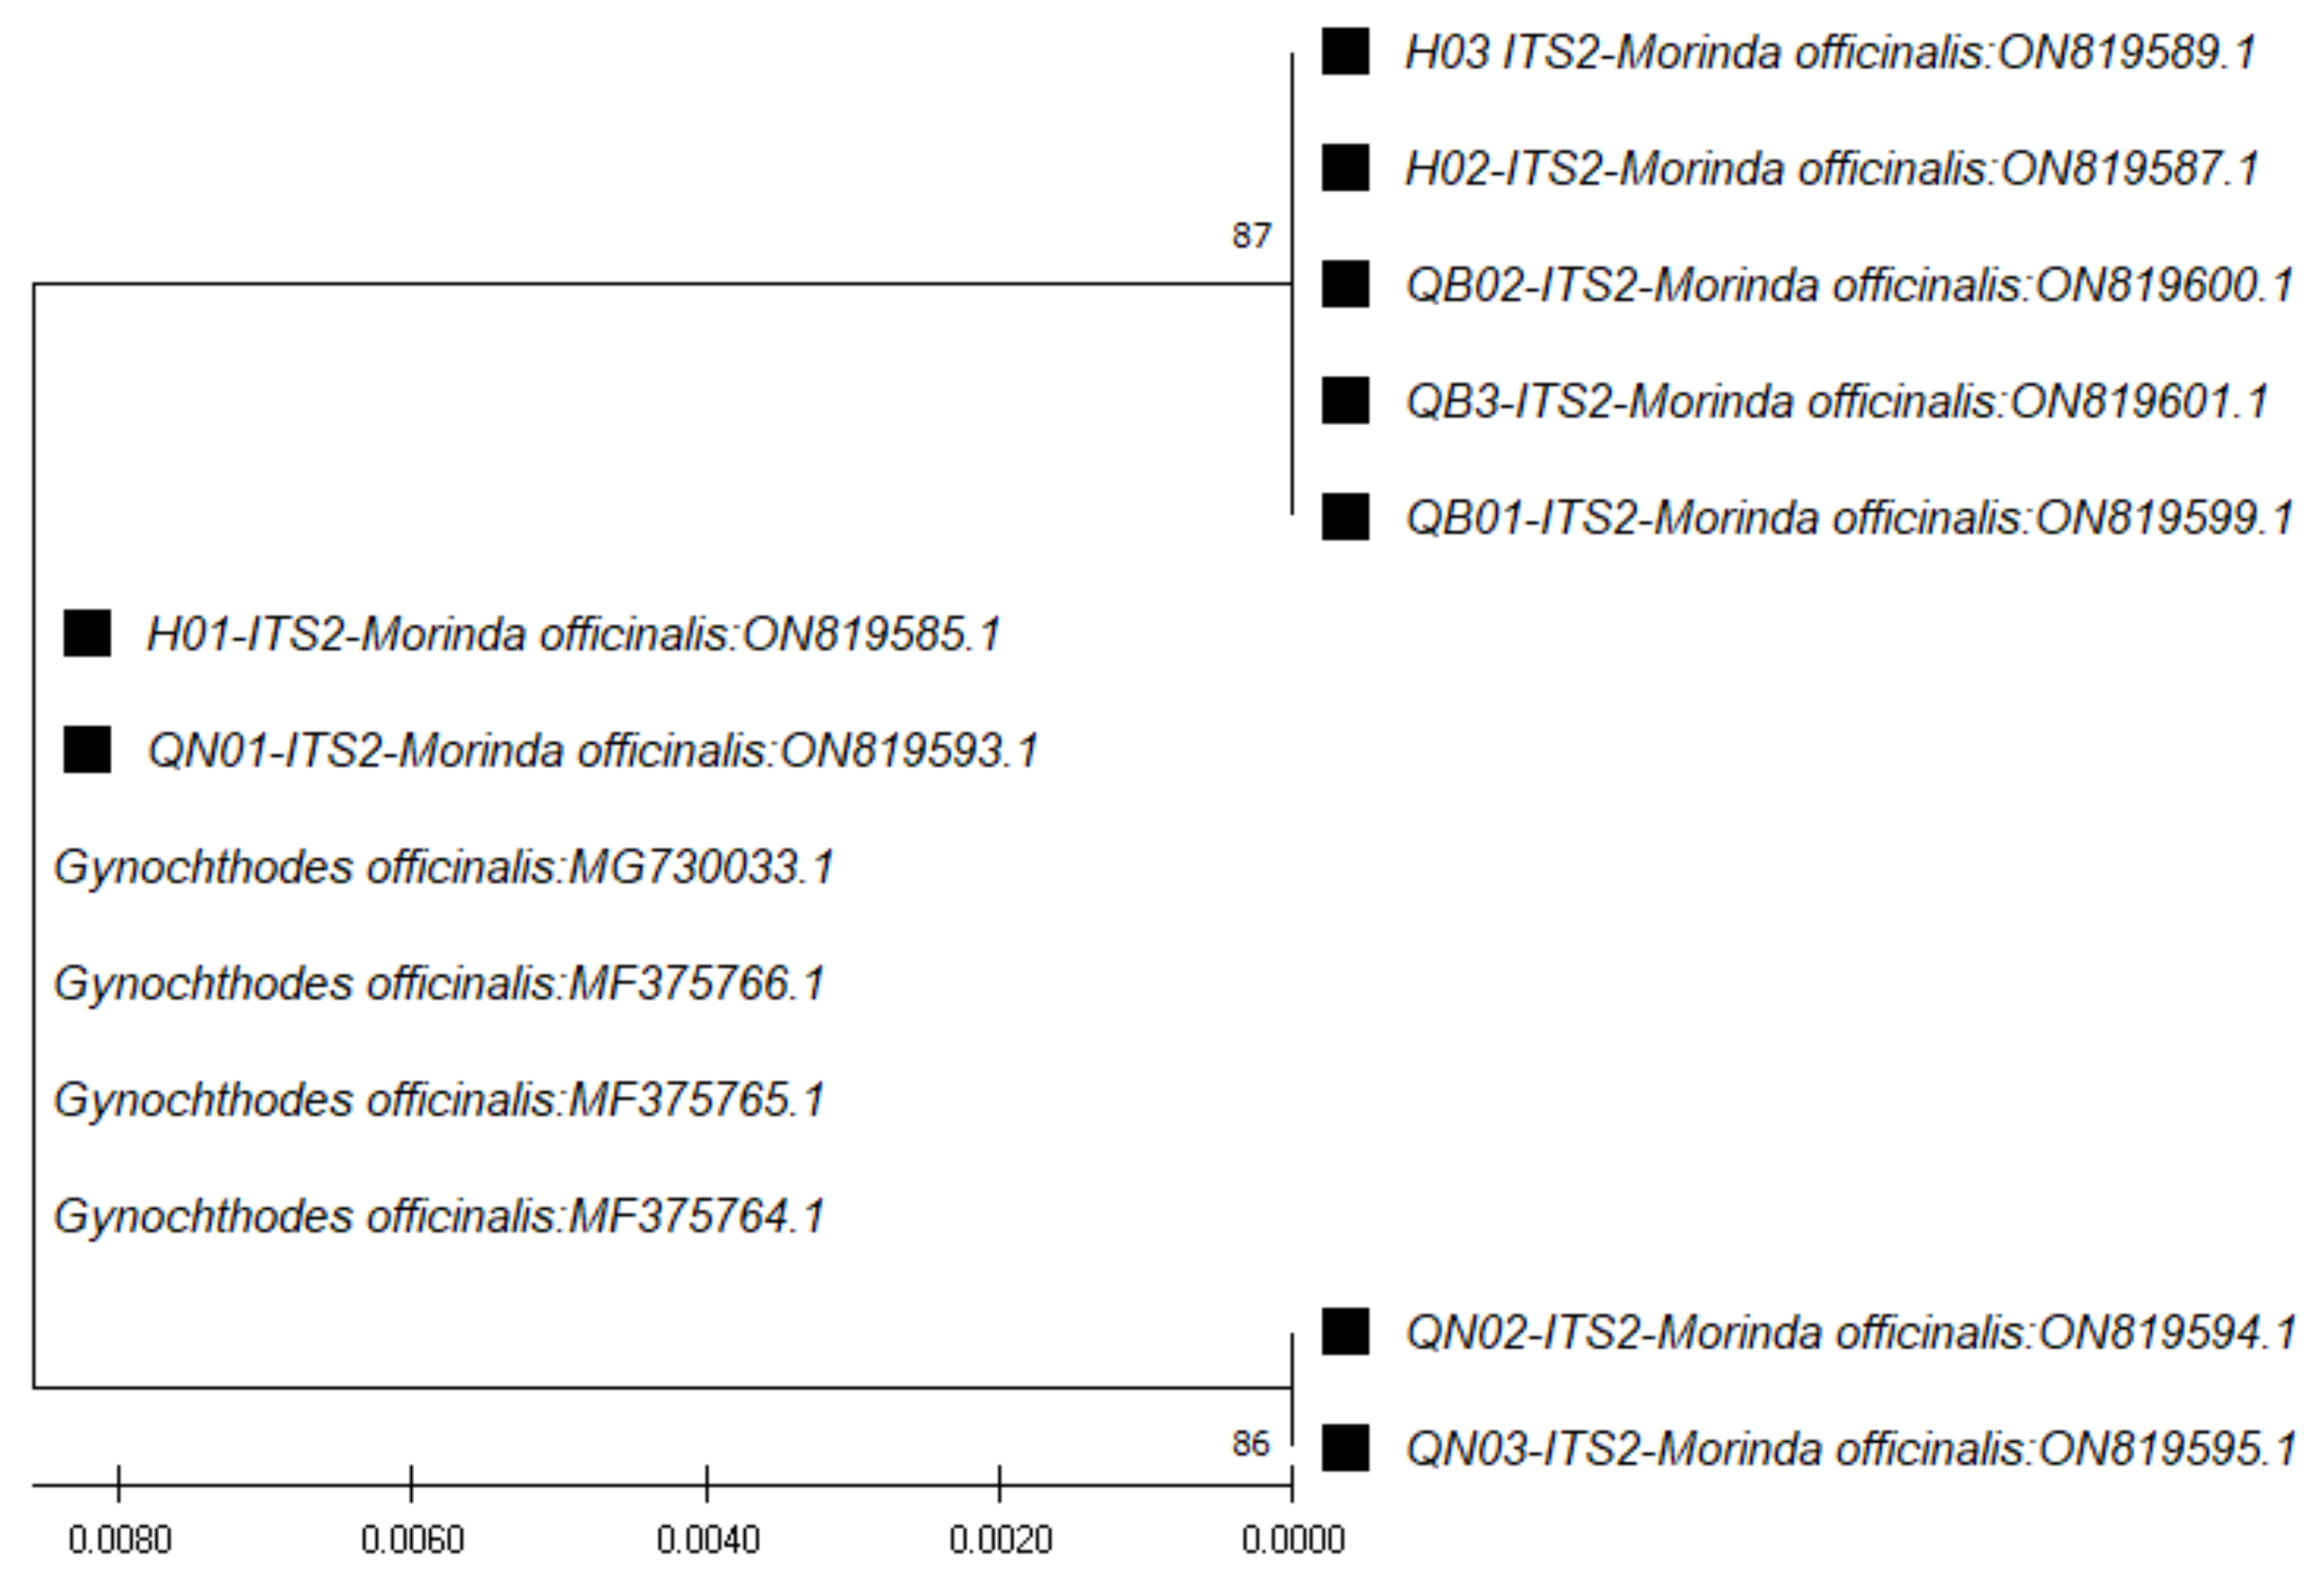
Figure 2). In the case of the
ITS2 region sequences (~235 bp), through use of the
ITS2 pair of primers (
ITS S2F and
ITS S3R), the closest species was found to be
Gynochthodes officinalis (synonym of
M. officinalis), at 100% similarity (
Table 4). The phylogenetic tree for those sequences was constructed with the closest species (
Figure 3).
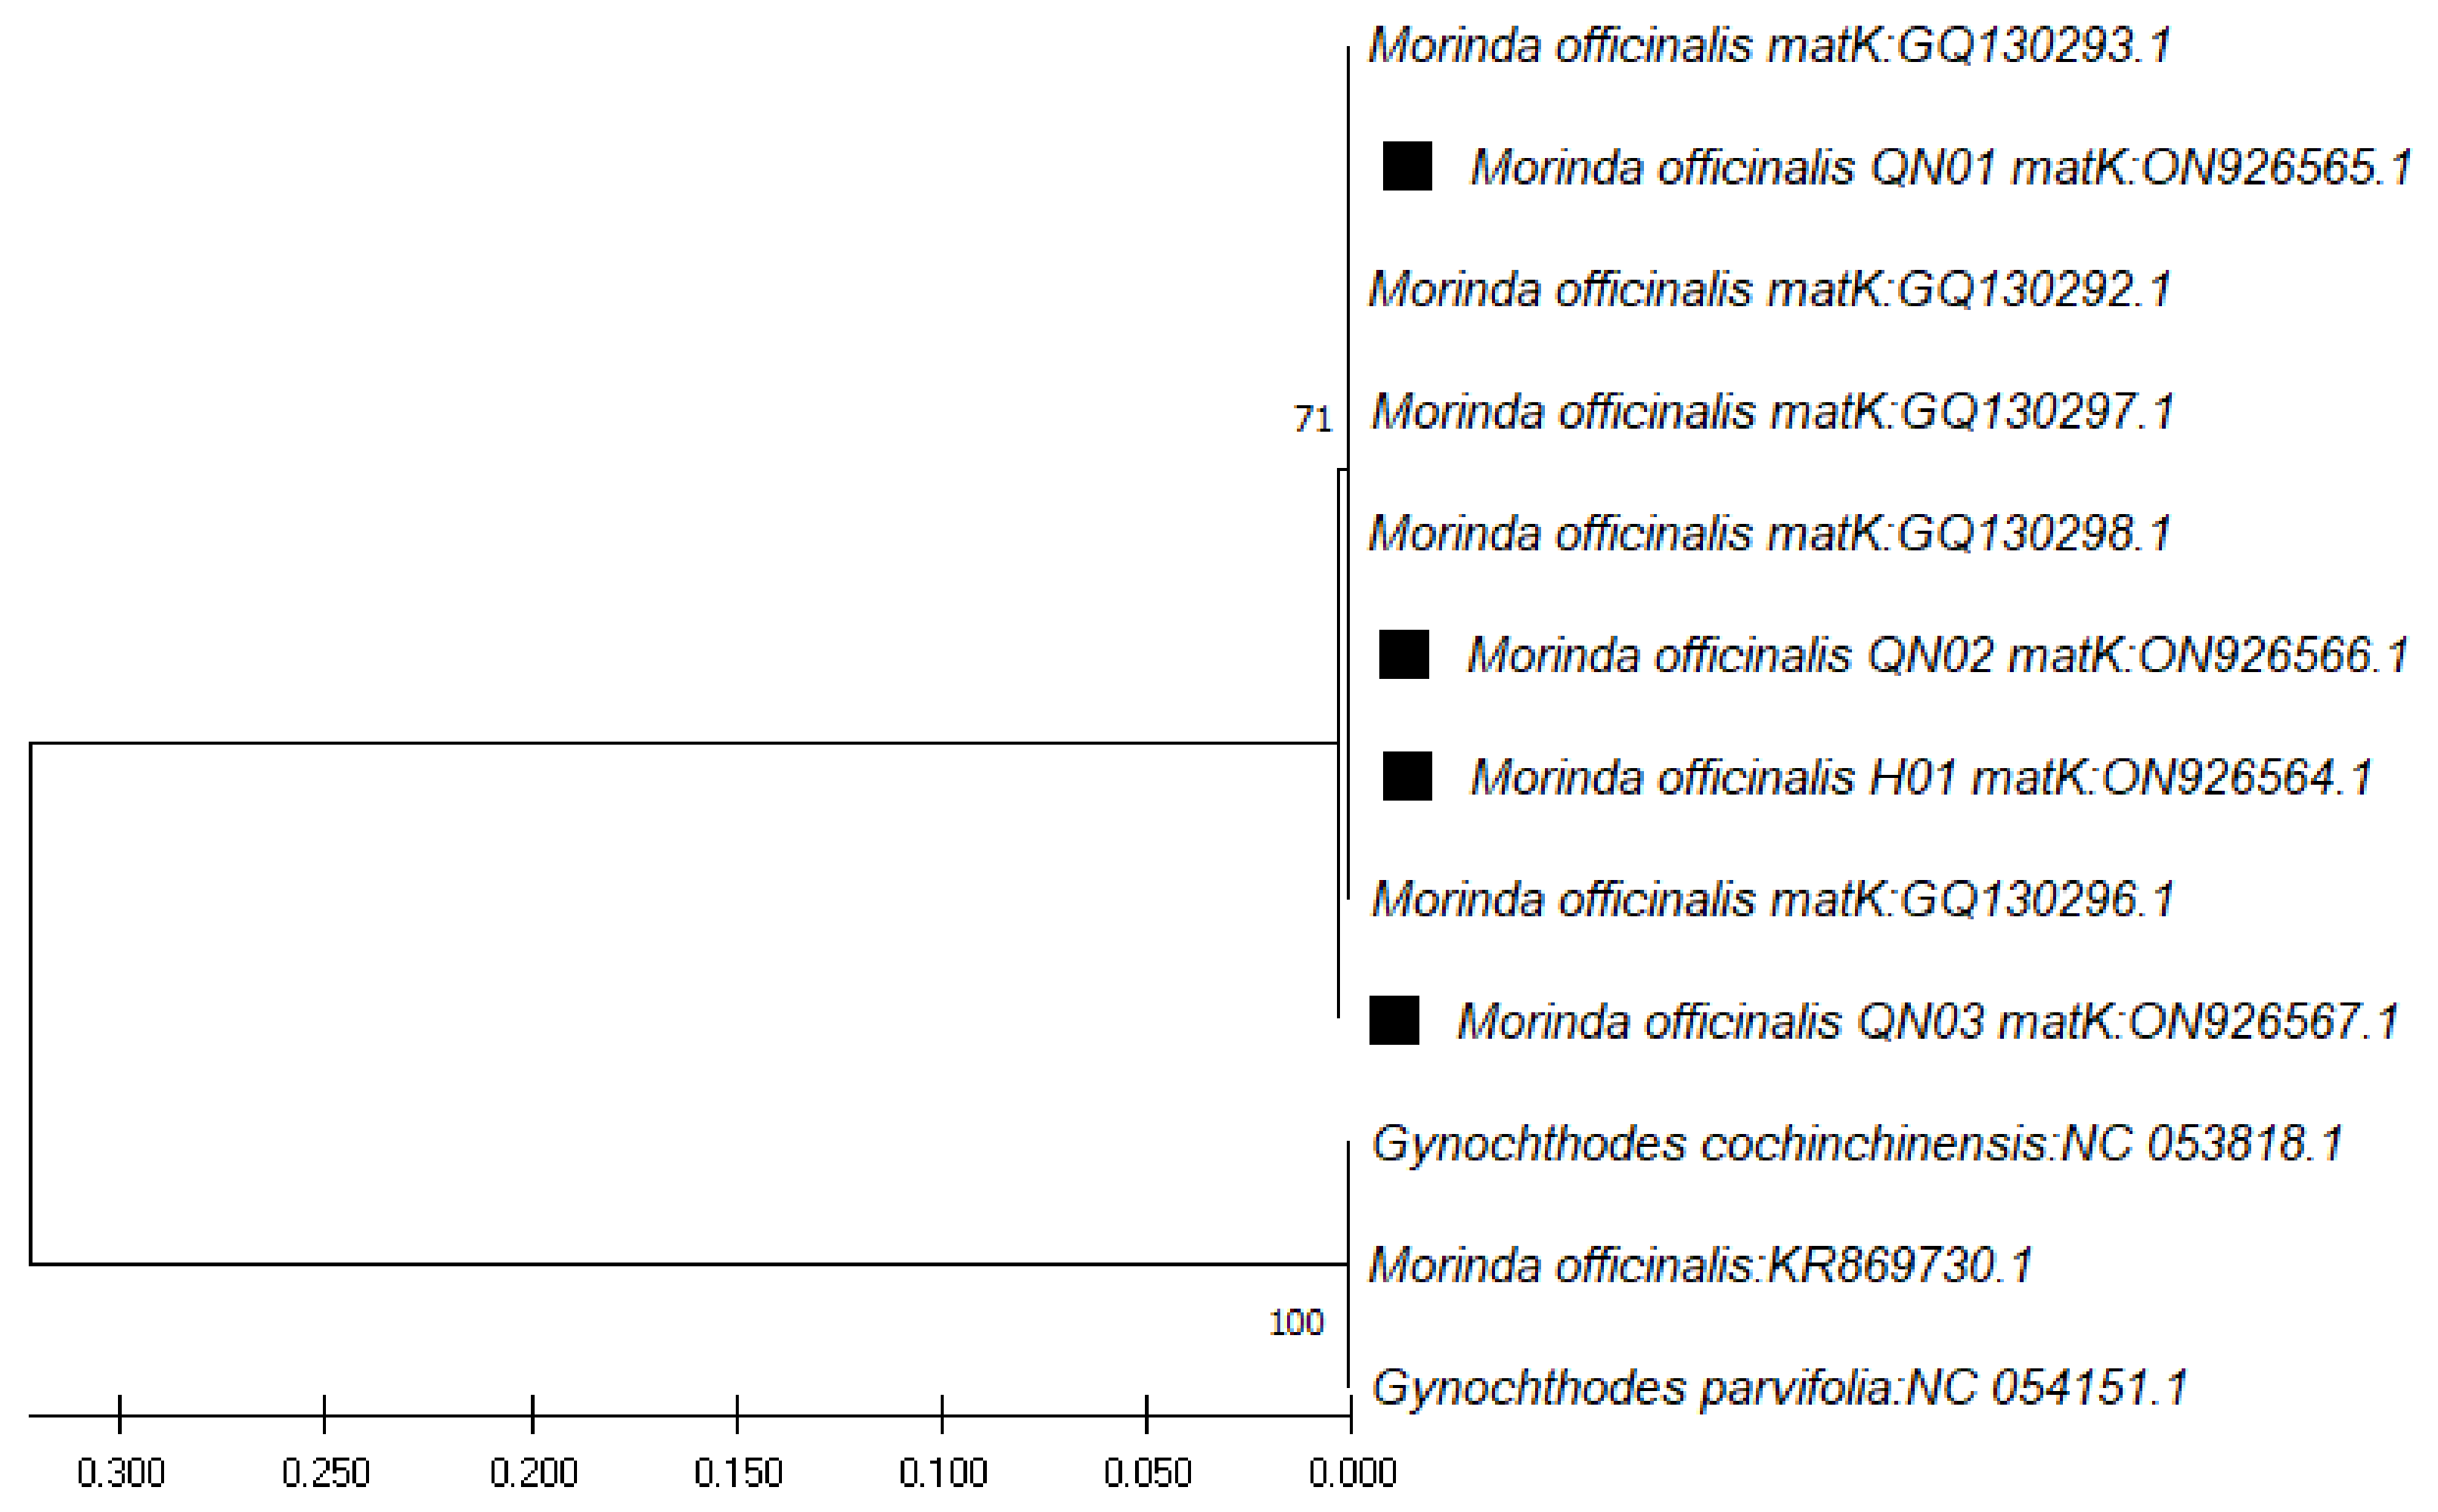
In the case of the
matK region sequences (ranging from 861 bp to 899 bp), through use of the
matK pair of primers (
390F and
1326R), the closest species was found to be
M. officinalis, at 99.89% similarity (
Table 5), followed by
Gynochthodes parvifolia, at 99.78% similarity. The phylogenetic tree for these sequences was constructed with the closest species (
Figure 4).
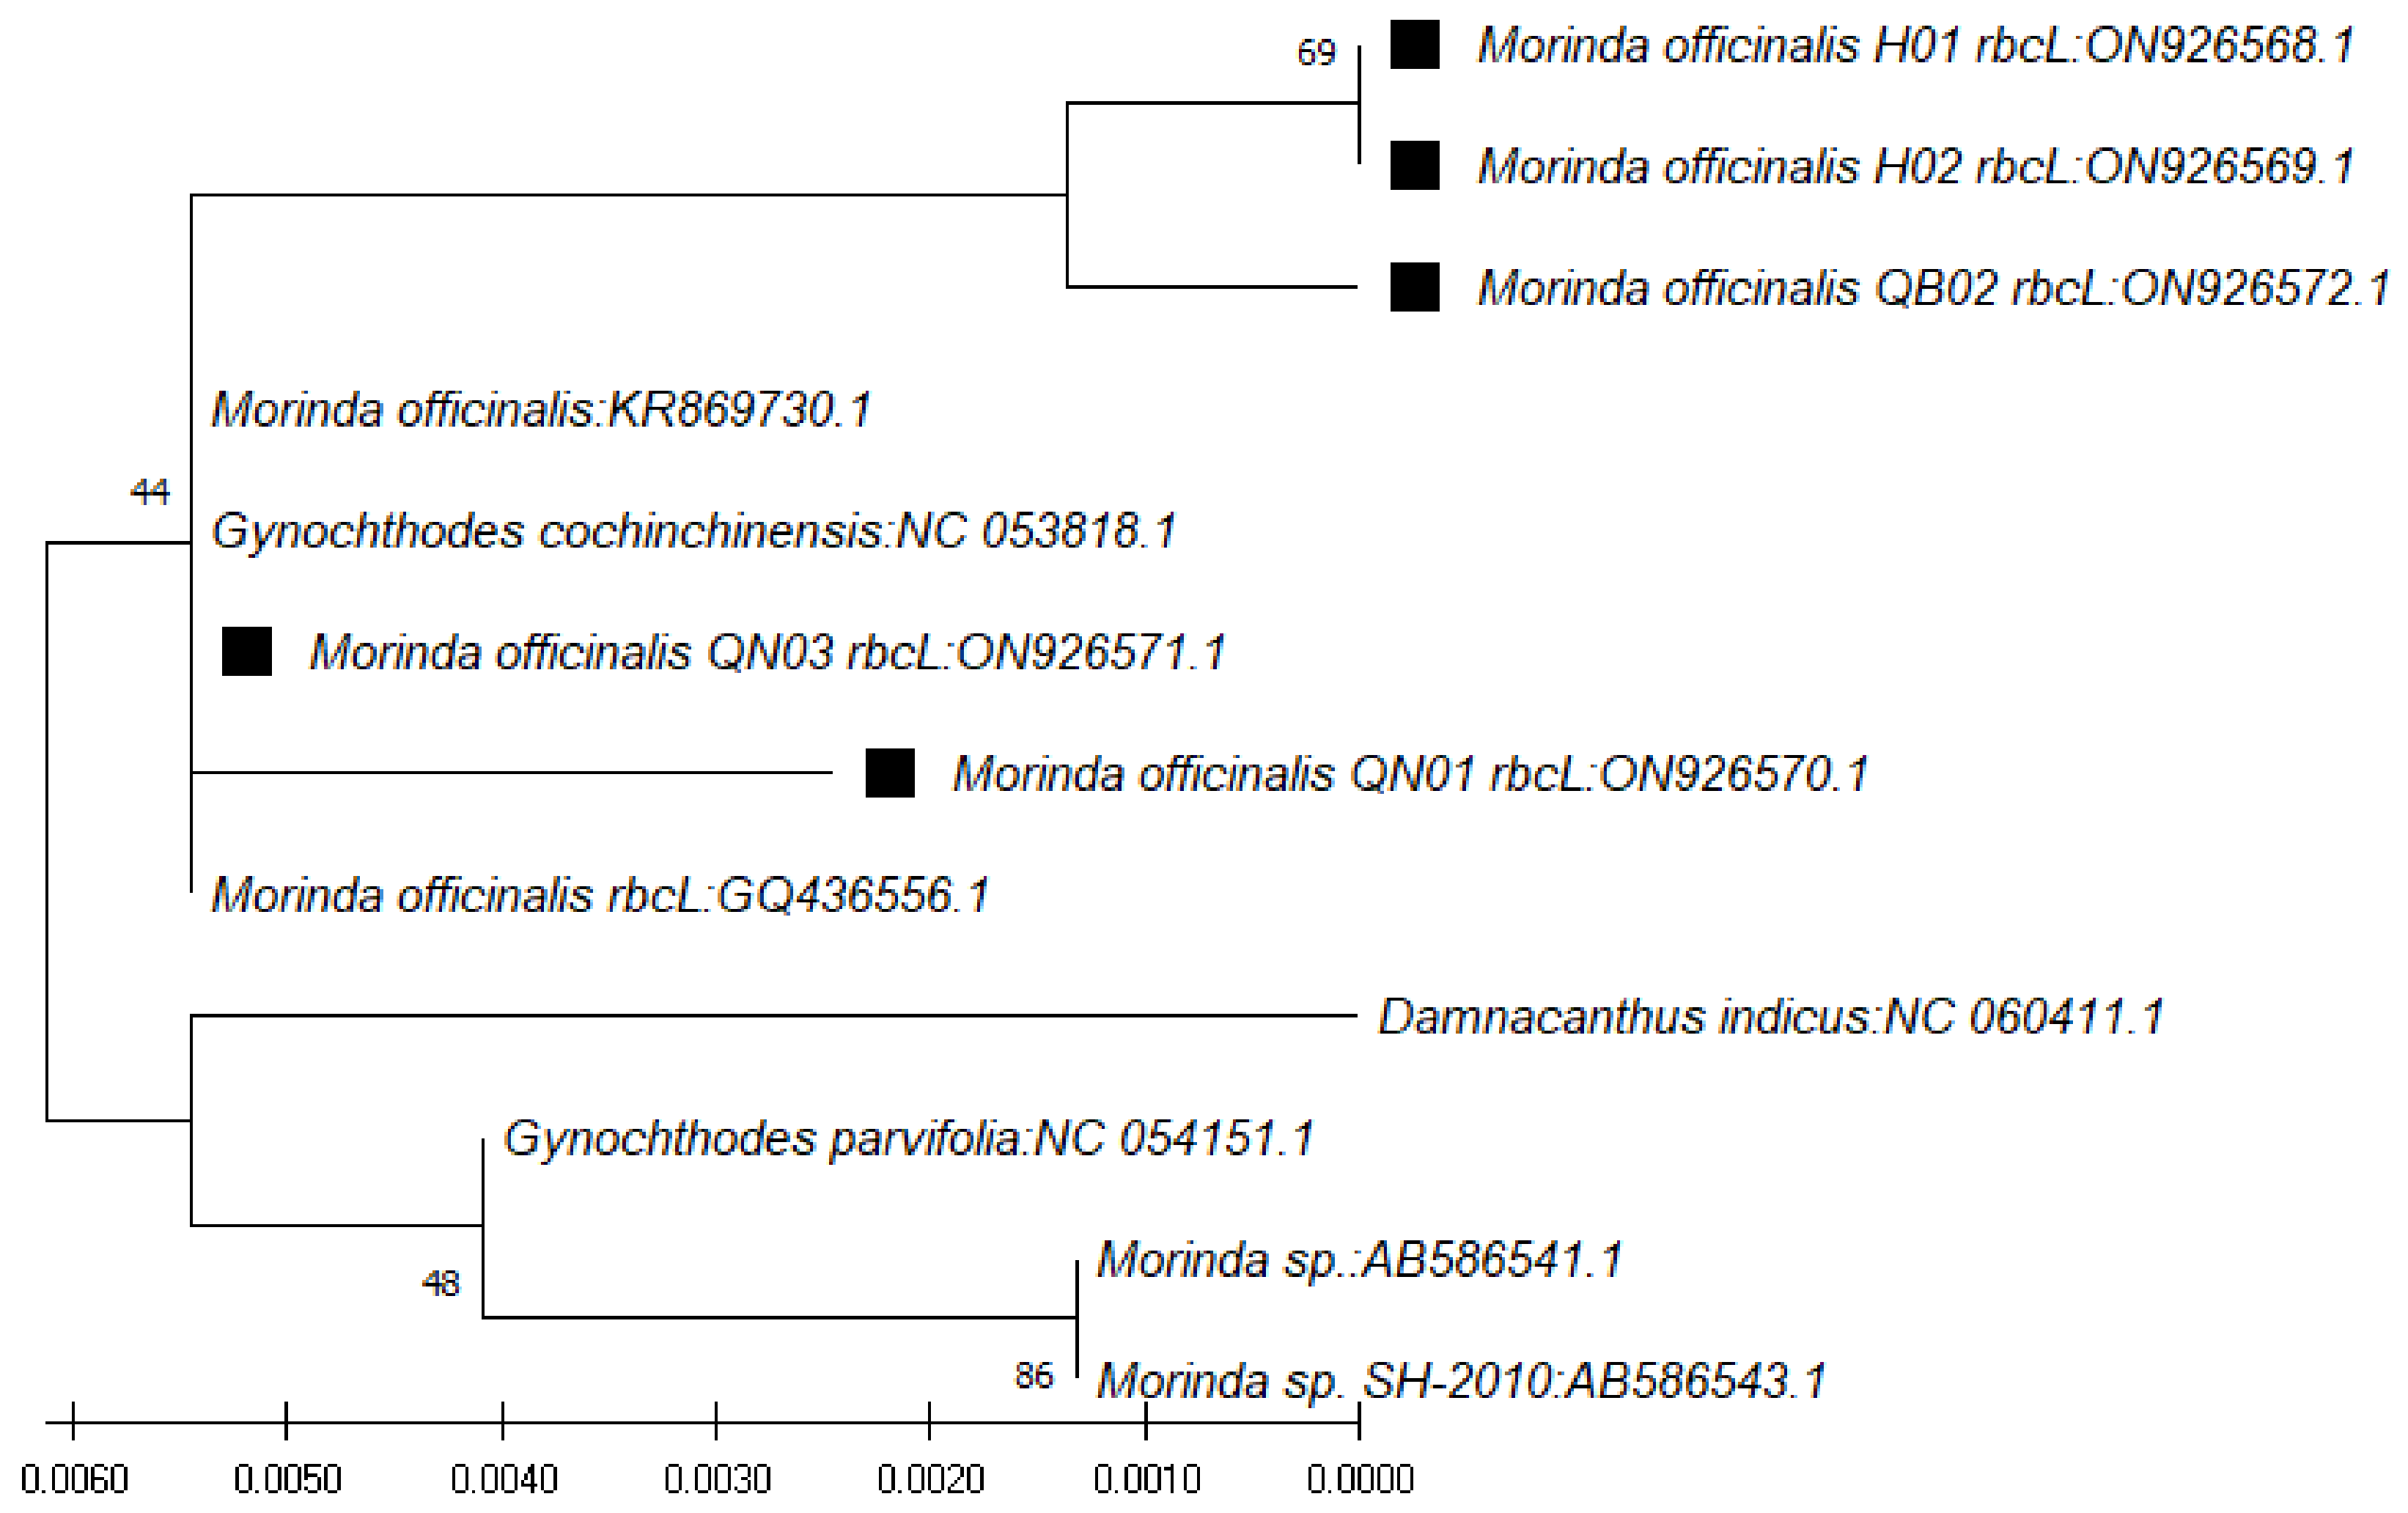
In use of the
rbcL gene, the BLAST result on NCBI showed that the nucleotide sequences obtained were highly similar to those of species of
Morinda officinalis (accession numbers KR869730.1, NC_053818.1, and GQ436556.1),
G. parvifolia (accession number NC_054151.1), and
Morinda sp. SH-2010 (accession numbers AB586541.1 and AB586543.1), with similarity ranging from 99.31% to 100% (
Table 6). The phylogenetic tree for those sequences was constructed with the closest species (
Figure 5).
3.2. Nucleotide Components
In terms of the occurrence of each type of nucleotide in the
ITS1 and
ITS2 gene region, cysteine (C) accounted for the highest proportion, ranging from 35.3% to 38.9%, followed by guanidine (G), which ranged from 31.1% to 34.0%. Timin (uracil) was observed with the lowest percentage (ranging from 10.0% to 14.5%) (
Table 7). For matK and rbcL, however, the percentage of Timin (uracil) was higher than that of the remaining nucleotides (ranging from 28.1% to 36.9%) (
Table 8).
The (G + C) percentage was the highest, with an average of 69.6% in the
ITS2 gene region (
Table 7 and
Table 8).
3.3. Genetic Diversity and Population Structure
A total of 140 different alleles were detected from 22 microsatellite markers in M. officinalis in the three surveyed populations, with sizes ranging from 106 bp to 328 bp.
In this study, of all 22 loci, the locus MO05 showed the highest number of alleles in all populations (Na = 9), while the locus MO90 showed the lowest number of alleles, with Na = 2.333. The F
IS values of the loci ranged between −0.287 and 0.965, with an average of 0.216. Half of the loci (MO02, MO04, MO05, MO12, MO26, MO30, M039, MO41, MO60, MO63, and MO96) showed positive F
IS values (
Table 9). The F
IT values of the loci ranged between −0.086 and 0.978.
All the loci showed positive F
ST values ranging between 0.127 and 0.554, with an average of 0.262. This result indicated a relatively high genetic differentiation at the locus level in all populations (
Table 9).
Table 10 presents the genetic diversity of
M. officinalis populations. The allele numbers (Na) ranged from 2 to 8 in the QB population, from 3 to 12 in the TTH population, and from 0 to 10 in the QN population. Specifically, the TTH population had the highest number of alleles, with an average of 6.455, whereas the population with the lowest number of alleles (3.955) was the QB population (
Table 10). The average percentage of polymorphic loci was 98.48%, of which two populations, QB and TTH, reached the absolute value (100%).
The highest total number of private alleles (Np = 4.364) was observed in the TTH population, followed by the QN population (Np = 2.318) and the QB population (Np = 1.818). Similarly, of the three populations, the effective allele numbers of the TTH population were the highest at 3.786, compared to 3.221 and 2.567 for the QN and QB populations, respectively.
Observed heterozygosity (Ho) and expected heterozygosity (He) averaged 0.513 and 0.612, respectively. The QN population had the highest expected heterozygosity (0.591) of the three populations, whereas the value of the observed heterozygosity of that population was 0.601. The fixation index (FST) was positive for all populations (FST = 0.206).
The results of the AMOVA pointed to higher levels of variation within populations (70%) than between populations (30%) (
Table 11), indicating a relatively low genetic divergence among the three studied populations (TTH, QB, QN). However, within populations, individuals were found to have high genetic differentiation.
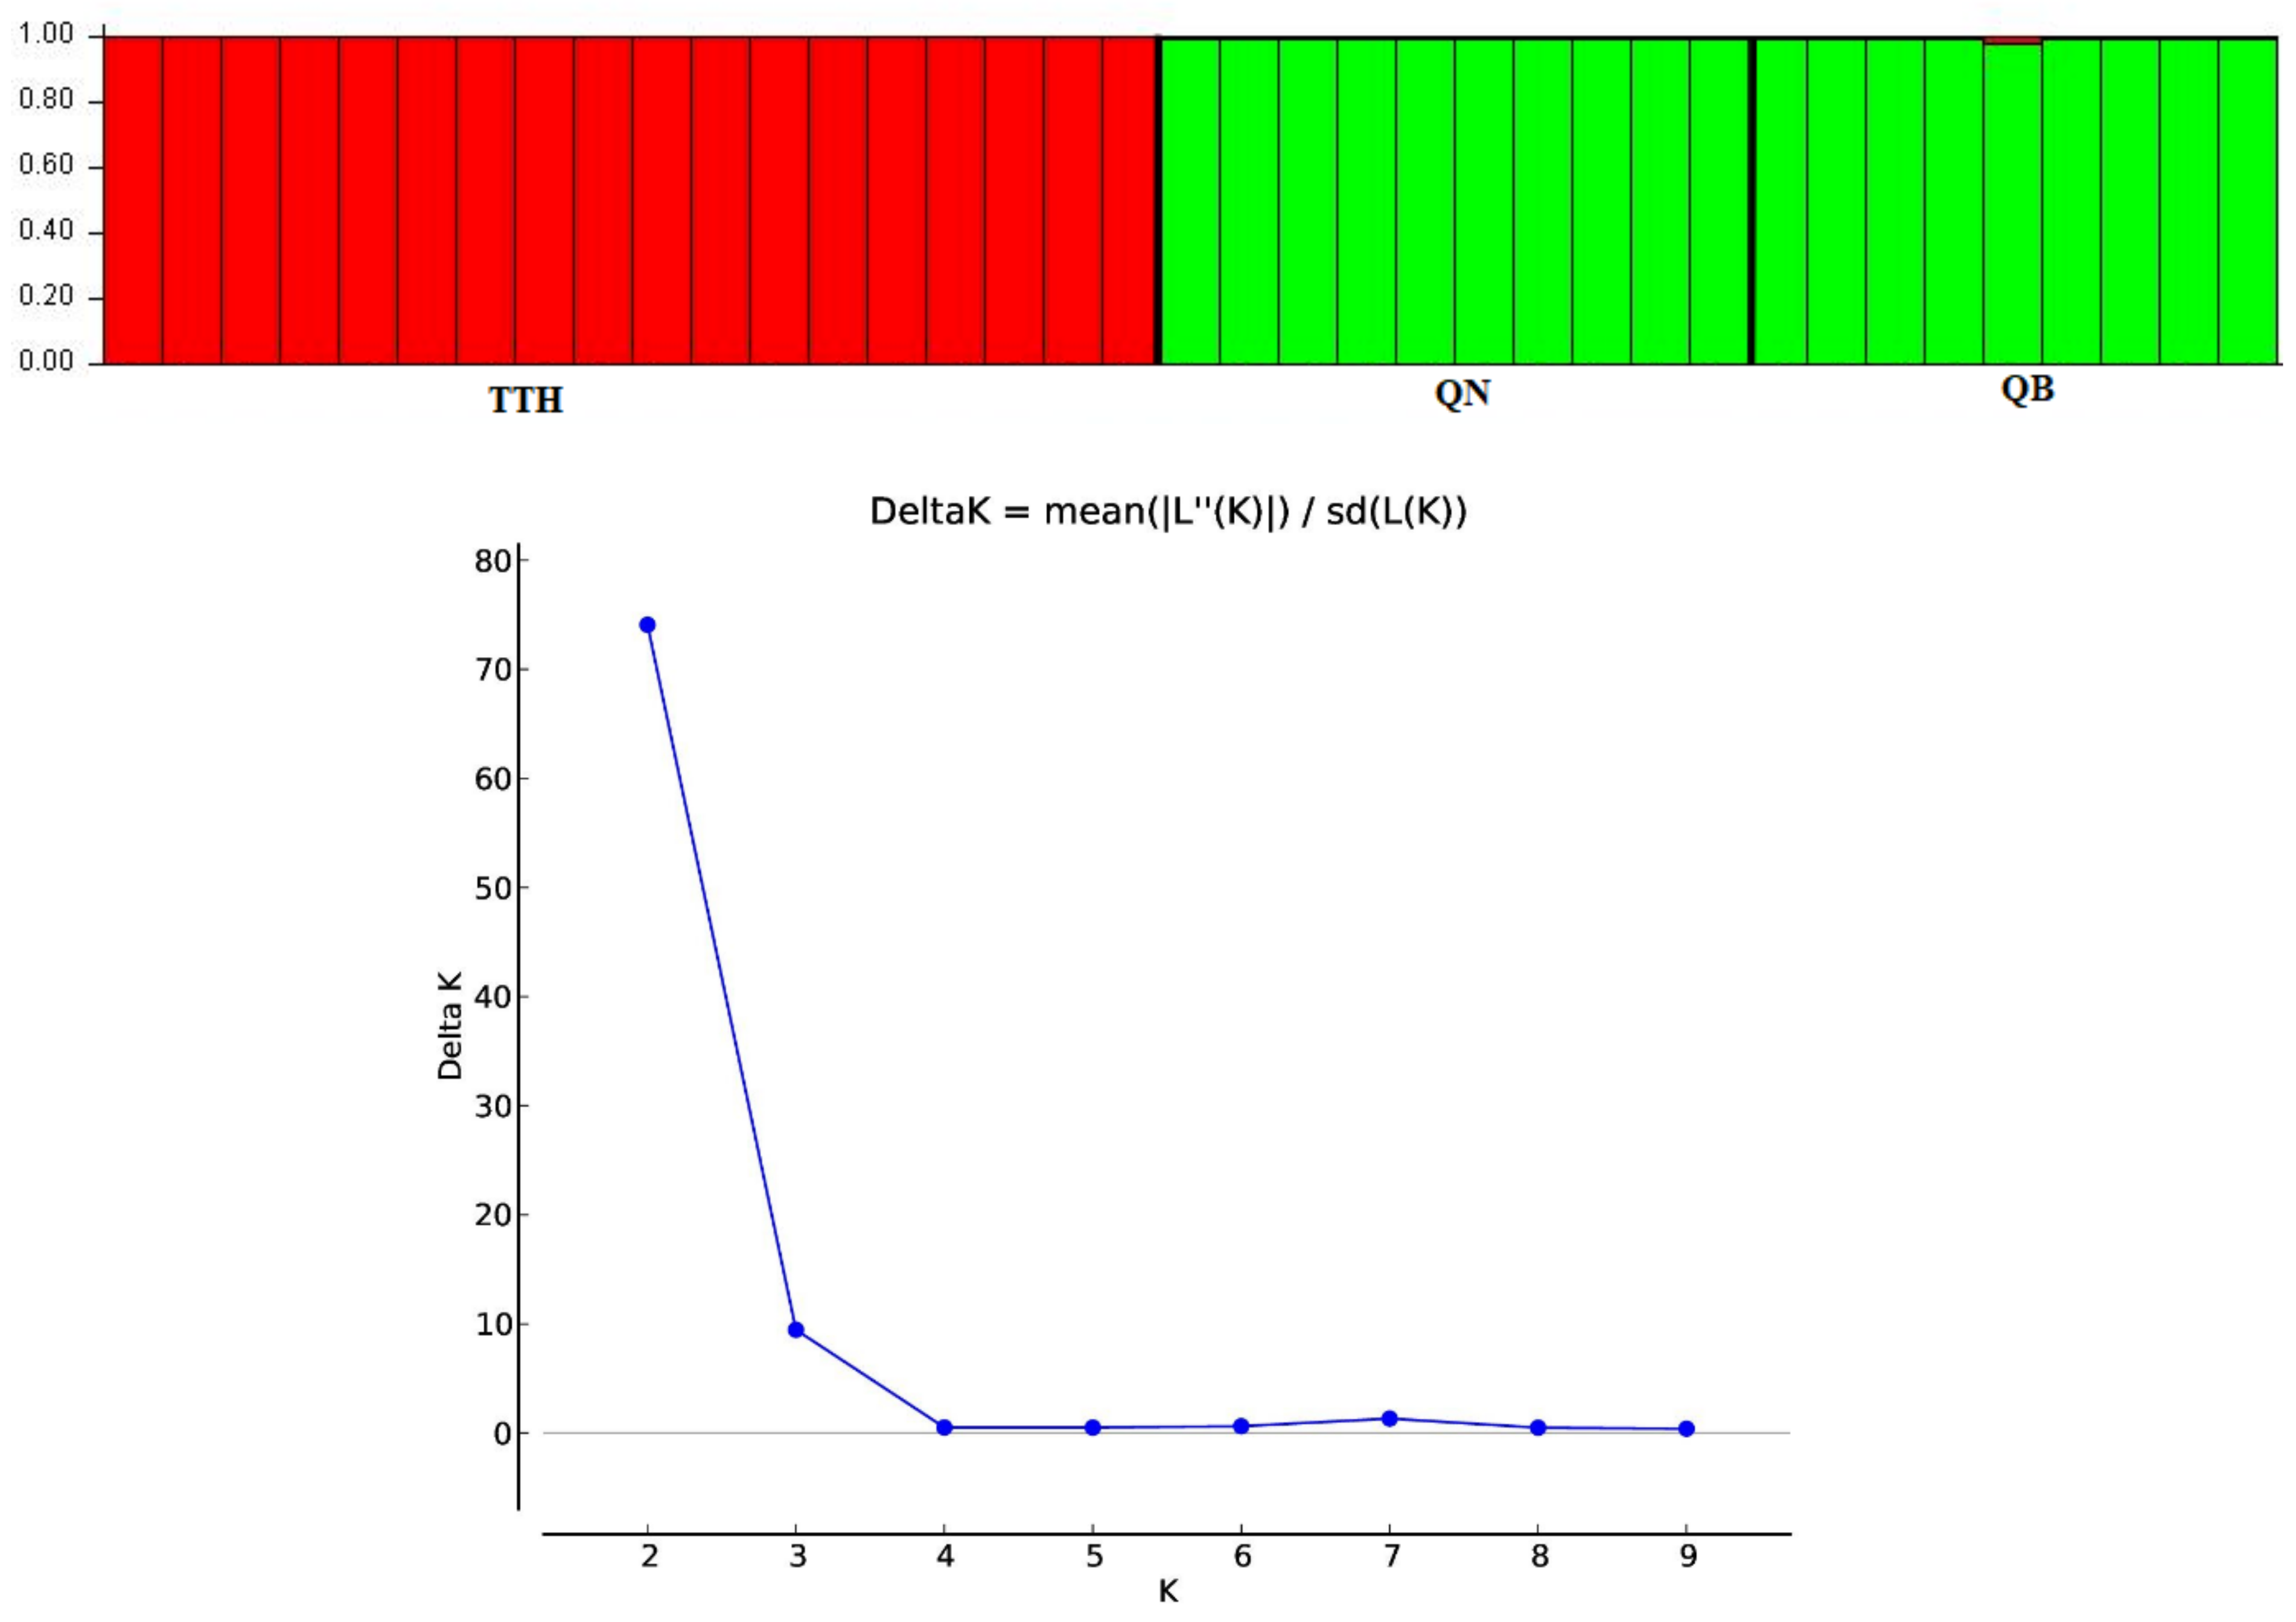
An admixture model was performed to determine the group population of the 37 individuals of
M. officinalis based on Bayesian analysis using the STRUCTURE program. The population structure of
M. officinalis inferred in STRUCTURE revealed that the optimum number of genetic groups for the admixture model was K = 2, with a delta K value of 74.084117. After a PCA analysis, the three populations were classified into two distinct clusters. K = 2, thus, can be considered to be the most suitable number of clusters for the structure of the populations in this study (
Figure 6 and
Figure 7). The QB and QN populations were in one cluster (green cluster), whereas the TTH population was in the remaining cluster (red cluster) (
Figure 7).
4. Discussion
DNA barcoding is a novel approach for identifying and classifying species based on the nucleotide diversity of conserved sequences. Recently, many studies have indicated that DNA markers ITS1, ITS2, matK, and rbcL are highly effective in identifying medicinal plants at species and genus levels. Therefore, this study was conducted to investigate the efficiency of those markers in barcoding M. officinalis plant species for the first time to identify the best marker for this valuable plant.
In previous studies, the
matK gene and (
ITS) region genetic markers have been proven highly efficient in distinguishing plant species and therefore identified as potential candidates for barcoding plants [
29]. This study demonstrated that the
ITS1 and
ITS2 regions of
M. officinalis were amplified more effectively compared to the other two markers (
matK and
rbcL).
Sequence analysis using the above four primers showed that the samples studied in this experiment belonged to the genus
Morinda and the most closely related species was
Gynochthodes officinalis (synonym of
M. officinalis). In the present study, the
ITS2 marker showed the highest efficiency in terms of amplification and species identification. The higher capacity of
ITS2 in terms of phylogenetic reconstruction has been proven in previous studies [
12,
13,
29].
The origin and ecology of a species are often expressed through its genetic diversity [
30]. Many previous studies have proven a positive correlation between population genetic diversity, population size, and geographic distribution range [
30,
31]. Species with broad distribution and a large population size generally maintain high genetic diversity in comparison to species with narrow distribution and small population size.
Heterozygosity can reflect the genetic variation in natural populations and is considered a measure of genetic diversity. The higher the heterozygosity in a population is, the more the genetic variability in it is.
M. officinalis had high genetic diversity (Ho = 0.513 and He = 0.612) in this study compared to in Luo’s publication for the same species (Ho = 0.3436 and He = 0.2881) [
5].
F
ST is considered one of the measures of genetic variation in populations. An F
ST value of higher than 0.15 can indicate significant differentiation in a population [
32]. Therefore, remarkable diversity was observed in the three populations in this study (
Table 10). The F
ST value ranged from 0.076 (QN population) to 0.451 (TTH population), with an average F
ST value of 0.206. This result was higher than that in the study of
P. vietnamensis (F
ST = 0.13) [
19] and lower than those in the studies of
Cinnamomum balansae (F
ST = 0.601) [
26] and
Pulsatilla patens (L.) (F
ST = 0.22) [
33] and (F
ST = 0.13) using microsatellite markers.
The results of the AMOVA also revealed that 30% of the total variation was found among subpopulations, while the rest (70%) was within subpopulations. These results indicated a relatively low genetic differentiation among the three populations and a high genetic divergence within those populations. Genetic variation among populations was highly influenced by gene flow, selection, genetic drift, and other factors.
A Bayesian analysis in STRUCTURE showed two different groups of genetically mixed individuals of M. officinalis. Even though the populations were separated by large geographical distances, the majority of individuals from the QB and QN populations shared the same ancestral origin.


 ,
, 


