Article

Genetic Polymorphism and Natural Selection of Apical Membrane Antigen-1 in Plasmodium falciparum Isolates from Vietnam

1
Department of Parasitology and Tropical Medicine, Institute of Health Sciences, Gyeongsang National University College of Medicine, Jinju 52727, Korea
2
Department of Convergence Medical Science, Gyeongsang National University, Jinju 52727, Korea
3
Tropical Diseases Clinical and Treatment Research Department, Institute of Malariology, Parasitology and Entomology Quy Nhon, MoH, 611B Nguyen Thai Hoc Street, Quy Nhon 611B, Vietnam
*
Author to whom correspondence should be addressed.
Genes 2021, 12(12), 1903; https://doi.org/10.3390/genes12121903
Submission received: 8 October 2021 / Revised: 22 November 2021 / Accepted: 26 November 2021 / Published: 27 November 2021
(This article belongs to the Special Issue Parasite Omics: Applications, Tools and Databases)

Abstract

:
Apical membrane antigen-1 of Plasmodium falciparum (PfAMA-1) is a leading malaria vaccine candidate antigen. However, the genetic diversity of pfama-1 and associated antigenic variation in global P. falciparum field isolates are major hurdles to the design of an efficacious vaccine formulated with this antigen. Here, we analyzed the genetic structure and the natural selection of pfama-1 in the P. falciparum population of Vietnam. A total of 37 distinct haplotypes were found in 131 P. falciparum Vietnamese isolates. Most amino acid changes detected in Vietnamese pfama-1 were localized in the ectodomain, domains I, II, and III. Overall patterns of major amino acid changes in Vietnamese pfama-1 were similar to those of global pfama-1, but the frequencies of the amino acid changes slightly differed by country. Novel amino acid changes were also identified in Vietnamese pfama-1. Vietnamese pfama-1 revealed relatively lower genetic diversity than currently analyzed pfama-1 in other geographical regions, and suggested a distinct genetic differentiation pattern. Evidence for natural selection was detected in Vietnamese pfama-1, but it showed purifying selection unlike the global pfama-1 analyzed so far. Recombination events were also found in Vietnamese pfama-1. Major amino acid changes that were commonly identified in global pfama-1 were mainly localized to predicted B-cell epitopes, RBC-binding sites, and IUR regions. These results provide important information for understanding the genetic nature of the Vietnamese pfama-1 population, and have significant implications for the design of a vaccine based on PfAMA-1.

1. Introduction

Despite remarkable reduction in global mortality and morbidity of malaria in recent years, the disease is still a global public health concern. Approximately 229 million clinical cases of malaria, with an estimated 409,000 deaths, have been reported in 2019 [1]. Development of an efficacious vaccine is highly imperative, considering the huge socio-economic impact of global malaria. However, no effective malaria vaccine is commercially available despite extensive global efforts. The emergence and spread of parasites with antimalarial drug resistance are also a great hindrance for the effective control and elimination of malaria [2].
Apical membrane antigen-1 (AMA-1) of the Plasmodium species is a membrane protein consisting of a signal sequence, a cysteine-rich ectodomain, a conserved cytoplasmic region, and a transmembrane region [3]. The ectodomain is further segmented into three distinct domains, domains I, II, and III [3]. This protein is mainly expressed in the electron-dense neck of rhoptries of sporozoites and merozoites, and plays an important function in the invasion of hepatocytes and erythrocytes by contributing attachment of the target cells at the posterior end of Plasmodium parasites [4,5,6,7,8]. AMA-1 is a highly immunogenic protein, and evokes a natural immune response in patients infected with either P. falciparum or P. vivax [9,10,11,12]. Immunization with recombinant AMA-1 elicits antibodies to hinder erythrocyte invasion by the malaria parasite, and confers a protective immune response [11,12]. Therefore, AMA-1 has been recognized as a leading malaria vaccine candidate [13,14]. However, the antibodies induced by AMA-1 recognize either conserved or allele-specific epitopes of AMA-1, resulting in limited protection against distinct alleles [15,16,17]. Despite the less variable genetic diversity of AMA-1 compared to other vaccine candidate antigens, such as circumsporozoite protein (CSP), Duffy-binding protein (DBP), and merozoite surface protein-1 (MSP-1), in the global population, it manifests irrefutable polymorphism [18,19,20,21,22,23,24,25,26,27]. Genetic polymorphism of AMA-1 in global Plasmodium field isolates, and the resulting variants in different geographic areas, are major hurdles in the development of a global malaria vaccine based on this antigen. Therefore, it is important to monitor genetic variations in the vaccine candidate antigen in the global Plasmodium isolates, since accumulated or newly emerging mutations can change the structure of the antigen, making it difficult to design optimized malaria vaccines.
Malaria was one of the most prominent infectious diseases affecting high mortality in Vietnam until the early 1990s, but the malaria burden in the country has been dramatically reduced over the past few decades [1]. Between 2012 and 2018, the cases and deaths of malaria were reduced by 74% and 95%, respectively, in Vietnam. The National Malaria Control and Elimination Program (NMCEP) of Vietnam has aimed for malaria elimination in the country by 2030 [28]. However, the Central Highlands of Vietnam, which are forests or forest edges, is still a high malaria risk area [29], and P. falciparum is a dominant species circulating in the Central Highlands [30,31]. Concerns for the emergence and spread of antimalarial drug-resistant parasites also have increased [32,33,34,35]. In the present study, we analyzed the genetic structure and natural selection of P. falciparum AMA-1 (pfama-1) in P. falciparum isolates from Vietnam to expand our knowledge on genetic variations in the global pfama-1 applicable to the development of a vaccine targeting PfAMA-1.

2. Materials and Methods

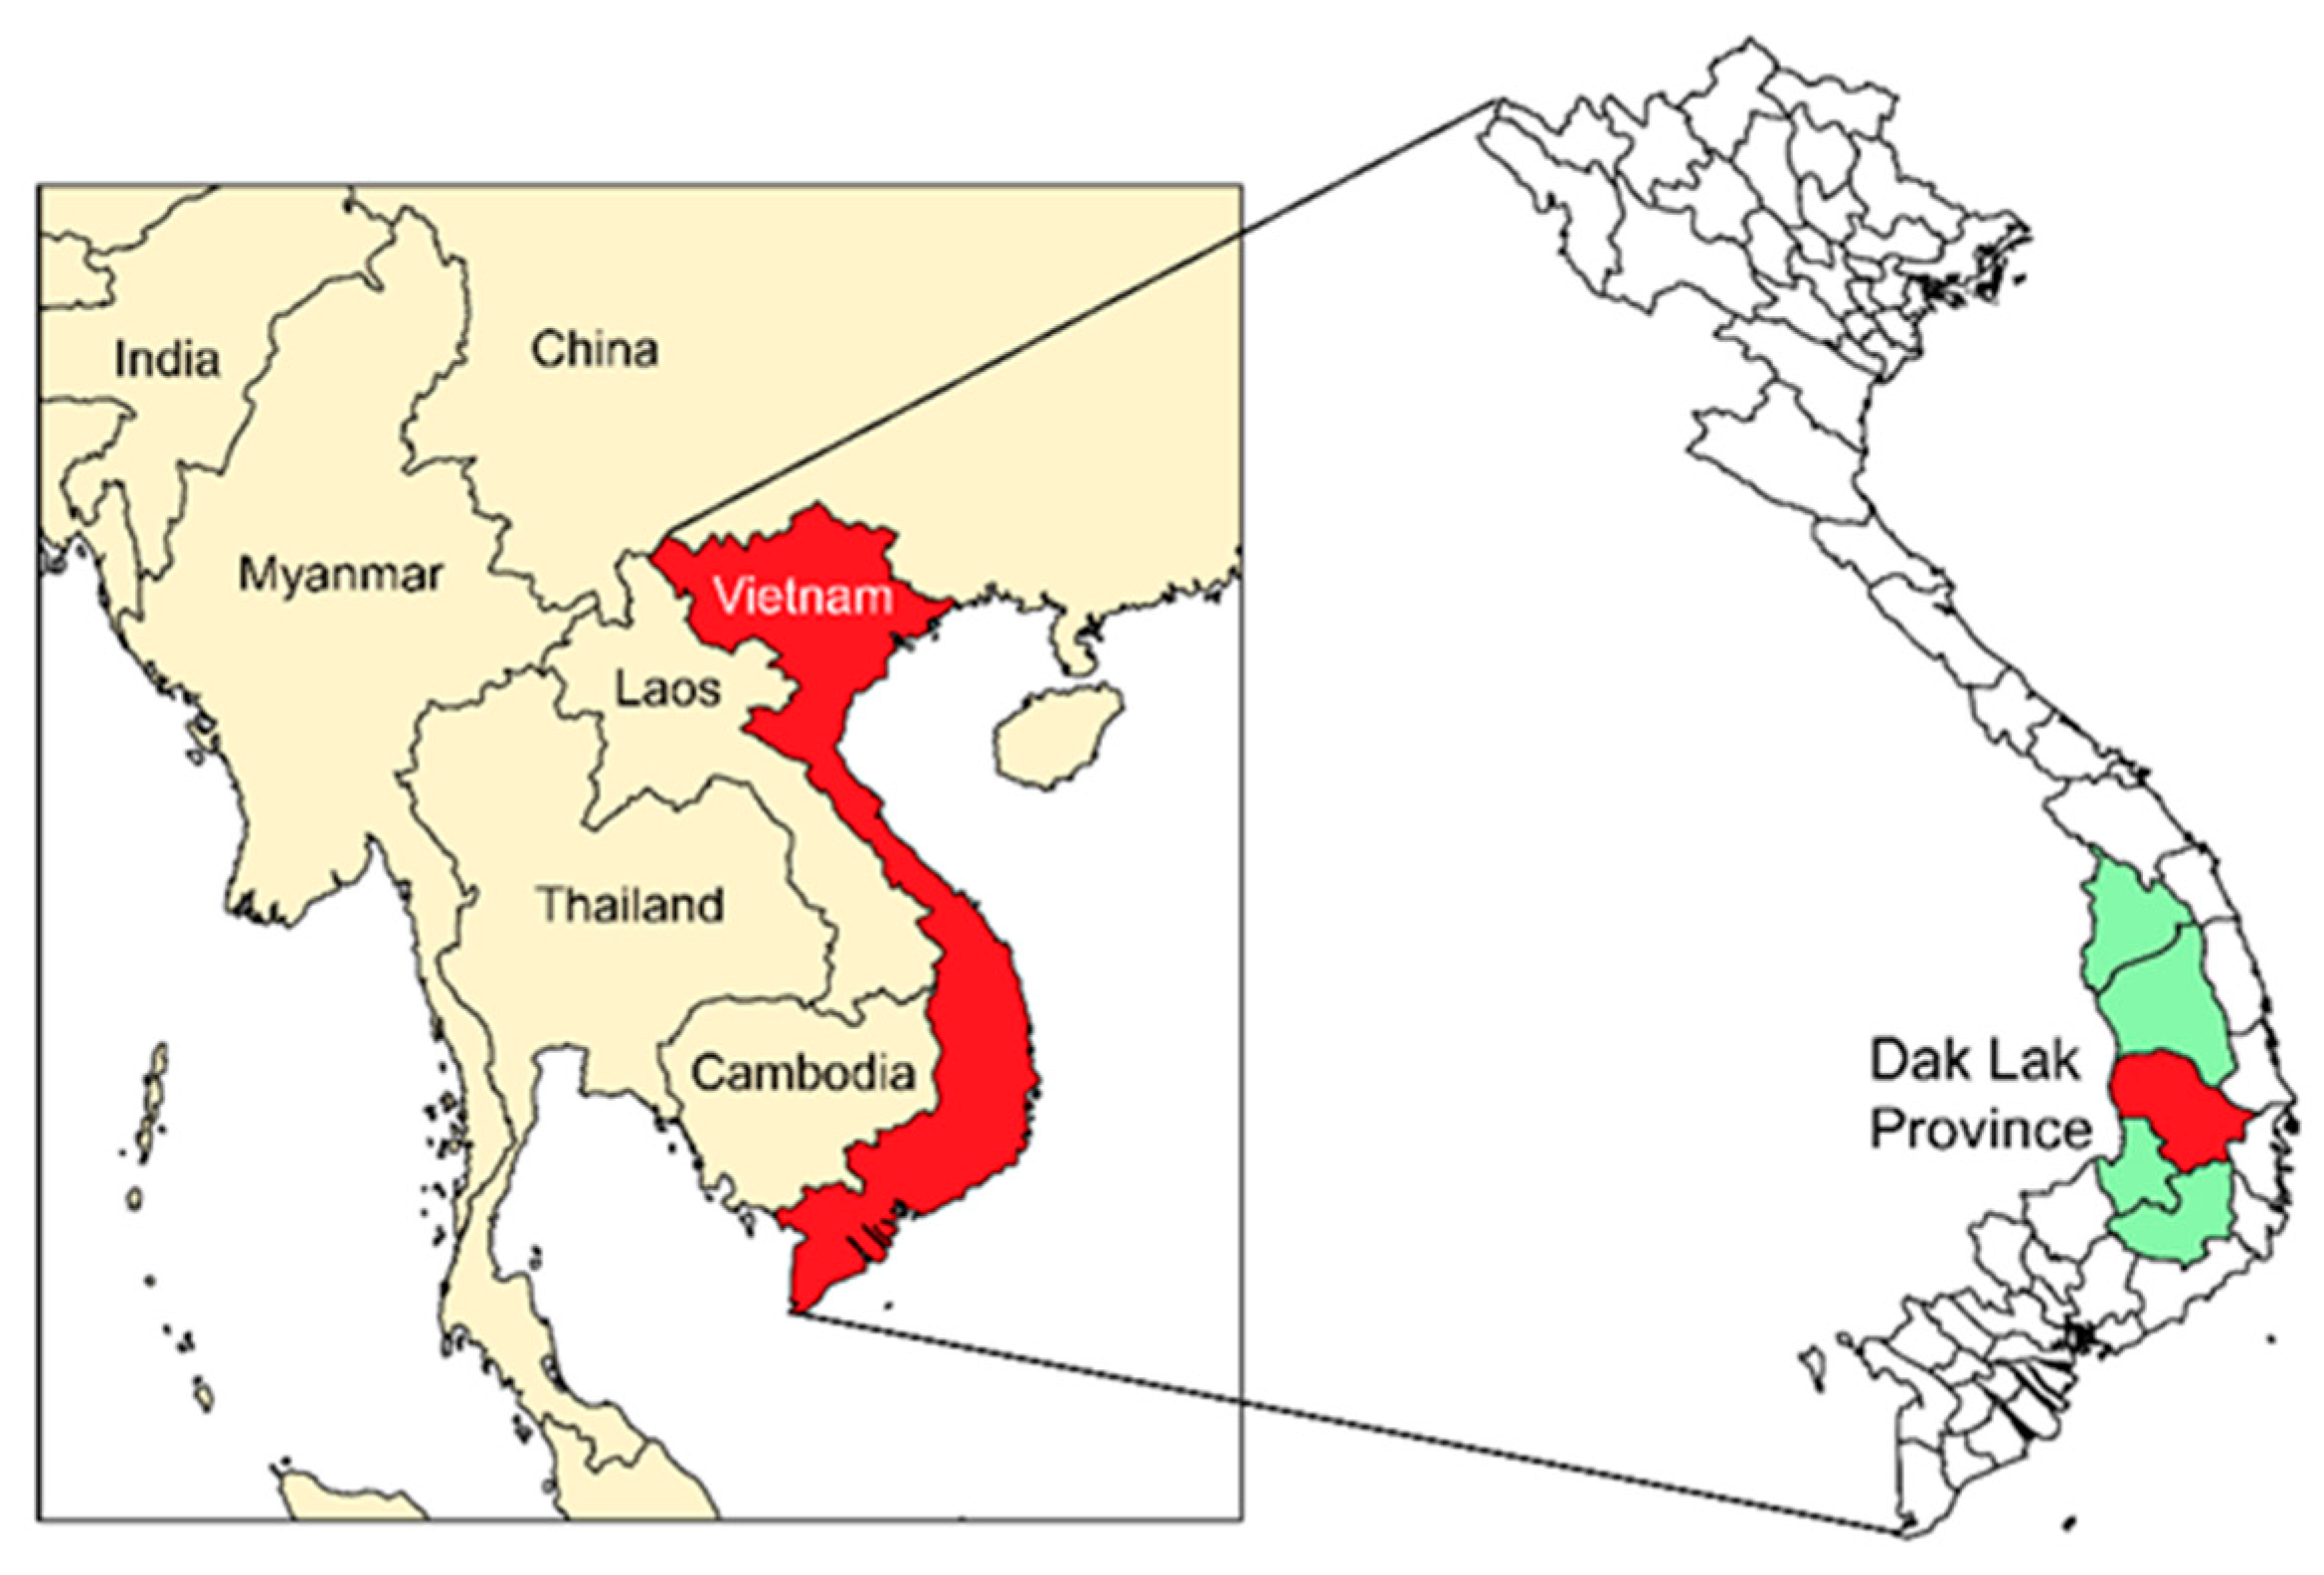
2.1. Blood Samples and Ethics

Blood samples were collected from malaria patients who were infected with Plasmodium falciparum in Dak Lak Province, Central Highlands, Vietnam, in 2019 [31] (Figure 1). Malaria infection was initially diagnosed using microscopic examinations for thick and thin blood smears. Finger prick blood samples from the patients were spotted on filter papers (Whatman 3 mm, GE Healthcare, Pittsburg, PA, USA), air-dried, and kept in individual sealed plastic bags at ambient temperature until use. Prior to blood collection, written informed consent was obtained from all the patients. P. falciparum infections were further validated by polymerase chain reaction (PCR) targeting the 18S ribosomal RNA (rRNA) gene [36,37]. The study protocols were reviewed and approved by the Ethics Committee of the Ministry of Health, Institute of Malariology, Parasitology, and Entomology (IMPE), Quy Nhon, Vietnam (No. 368/VSR-LSDT).

2.2. Amplification and Sequence Analysis of pfama-1

Parasite genomic DNA was isolated from the blood spots using QIAamp DNA Blood Kit (Qiagen, Hilden, Germany) according to the manufacturer’s protocol. Full-length pfama-1 was amplified from the genomic DNA by nested PCR using primer sets and thermal cycles, as described previously [25]. To minimize nucleotide misincorporation into sequences during amplification steps, Ex Taq DNA polymerase (Takara, Otsu, Japan) with proofreading activity was used in all PCR procedures. Each PCR product was analyzed by electrophoresis on 1% agarose gel, purified from the gel, and cloned into a T&A cloning vector (Real Biotech Corporation, Banqiao City, Taiwan). Each ligation mixture was transformed into Escherichia coli DH5α competent cells, and positive clones were selected by colony PCR with the nested PCR primers [25]. Nucleotide sequences of cloned genes were analyzed by DNA sequencing using M13 forward and M13 reverse primers. Sequencing was also performed with two internal primers (5′-CAGGGAAATGTCCAGTATTTGGTA-3′ and 5′-TTCCATCGACCCATAATCCG-3′) to get confidential sequences corresponding to the central region of full-length pfama-1 [25]. To ensure sequencing accuracy, at least three clones from each isolate were sequenced. Some isolates underwent four- or five-fold sequence coverage to confirm the rare polymorphisms. The nucleotide sequences of Vietnamese pfama-1 were deposited at GenBank (accession numbers MW938322–MW938452).

2.3. Nucleotide Sequence Polymorphism and Neutrality Test

Nucleotide and deduced amino acid sequences of pfama-1 were analyzed using EditSeq and SeqMan programs in the DNASTAR package (DNASTAR, Madison, WI, USA). Nucleotide sequence polymorphism of Vietnamese pfama-1 sequences was analyzed. The numbers of segregating sites (S), average number of pair-wise nucleotide differences within a population (K), haplotypes (H), haplotype diversity (Hd), and nucleotide diversity (π) were analyzed using DnaSP ver. 5.10.00 [38]. The π value was calculated to estimate step-wise diversity throughout the full-length pfama-1 based on a sliding window of 100 bp with a step size of 25 bp. Non-synonymous (dN) and synonymous (dS) substitutions were estimated and were compared with Z-test (p < 0.05 was considered significant) in the MEGA4 program [39] using the Nei and Gojobori method [40] with Jukes and Cantor correction. Tajima’s D value [41], and Fu and Li’s D and F values [42] were analyzed using DnaSP ver. 5.10.00 to test the neutral theory of evolution [38]. The recombination parameter (R), which included the effective population size and probability of recombination between adjacent nucleotides per generation, and the minimum number of recombination events (Rm) were analyzed with DnaSP ver. 5.10.00 [38]. Linkage disequilibrium (LD) between different polymorphic sites was analyzed based on the R2 index using DnaSP ver. 5.10.00 [38].

2.4. Population Diversity of pfama-1 among Global P. falciparum Isolates

The genetic diversity of pfama-1 in global P. falciparum isolates was analyzed. The full-length pfama-1 sequences available in public databases were included: Ghana (n = 37, AB715698–AB715734); Myanmar (n = 58, KU893276–KU893333); Papua New Guinea (PNG: n = 90, AB715870–AB715959); Philippines (n = 55, AB715815–AB715869); Solomon Islands (n = 50, AB715960–AB716009); Tanzania (n = 62, AB715636–AB715679); Thailand (n = 80, AB715735–AB715814); and Vanuatu (n = 85, AB716010–AB716094). Nucleotide sequence polymorphism and a neutrality test for each population were analyzed using the DnaSP ver. 5.10.00 [38] and MEGA4 [39] programs as described above. Genetic differentiation of parasite populations was calculated based on fixation index (FST) to estimate pair-wise DNA sequence diversity between and within populations using DnaSP ver. 5.10.00 [38]. To determine the relationships between global pfama-1 haplotypes, the haplotype network of 648 pfama-1 sequences, including 131 from Vietnam and the 517 from Ghana, Myanmar, PNG, Philippines, Solomon Islands, Tanzania, Thailand, and Vanuatu, was constructed using the program PopART version 1.7 (http://popart.otago.ac.nz; accessed on 13 September 2021) with the Median Joining algorithm [43]. To evaluate the association between genetic diversity of pfama-1 within P. falciparum isolates and host immune pressure, genetic diversity in predicted B-cell epitopes, intrinsically unstructured/disordered regions (IUR), and red blood cell (RBC) binding regions in global pfama-1 were analyzed [25,44,45]. The nucleotide diversity and natural selection of each region were analyzed using DnaSP ver. 5.10.00 [38].

3. Results

3.1. Sequence Polymorphism of Vietnamese pfama-1

Nested PCR of pfama-1 from 135 P. falciparum samples from Vietnam resulted in successful amplification of pfama-1 in 131 samples. No amplicon was detected in four P. falciparum isolates. The size of the amplified products was approximately 1.9 kbp, and no size variation was detected between and among the amplified products. Nucleotide sequence analysis of the 131 Vietnamese pfama-1 sequences based on pfama-1 from 3D7 reference strain (GenBank accession number: U65407) revealed 116 single nucleotide polymorphisms (SNPs), including 52 synonymous and 64 non-synonymous SNPs. The non-synonymous SNPs induced amino acid substitutions at 52 positions in Vietnamese pfama-1 sequences, resulting in 37 distinct haplotypes of pfama-1 in the amino acid levels (Figure 2). These amino acid changes were scattered throughout each haplotype of Vietnamese pfama-1, but most of the amino acid changes were detected in domain I (22 positions), domain II (12 positions), and domain III (6 positions). Most amino acid changes were di-morphic (48 positions), but tri-morphic amino acid changes at three positions (H200L/D, E267P/Q, and C320G/W), and a penta-morphic amino acid change at one position (E197D/G/Q/V) were also detected. One amino acid change (D584H) was commonly detected in all Vietnamese pfama-1 sequences (Figure 2). Of the amino acid changes found in Vietnamese pfama-1, amino acid changes at 41 positions were previously identified in pfama-1 of P. falciparum isolates from other geographical areas. However, the other 12 changes at 11 positions (N26D, V37M, Y51C, L55S, C320G/W, N338S, Q352P, Y360F, M374T, K459N, and I504S) were novel and never reported previously in global pfama-1, despite their low frequencies, ranging from 1.5 to 3.8%. Haplotype 23 was the most prevalent haplotype, accounting for 56.5% (74/131), followed by haplotype 34 (6.9%; 9/131), haplotype 12 (4.6%; 6/131), and haplotype 20 (3.1%; 4/131). Other haplotypes were detected in only one or two sequences resulting in low frequencies, respectively.

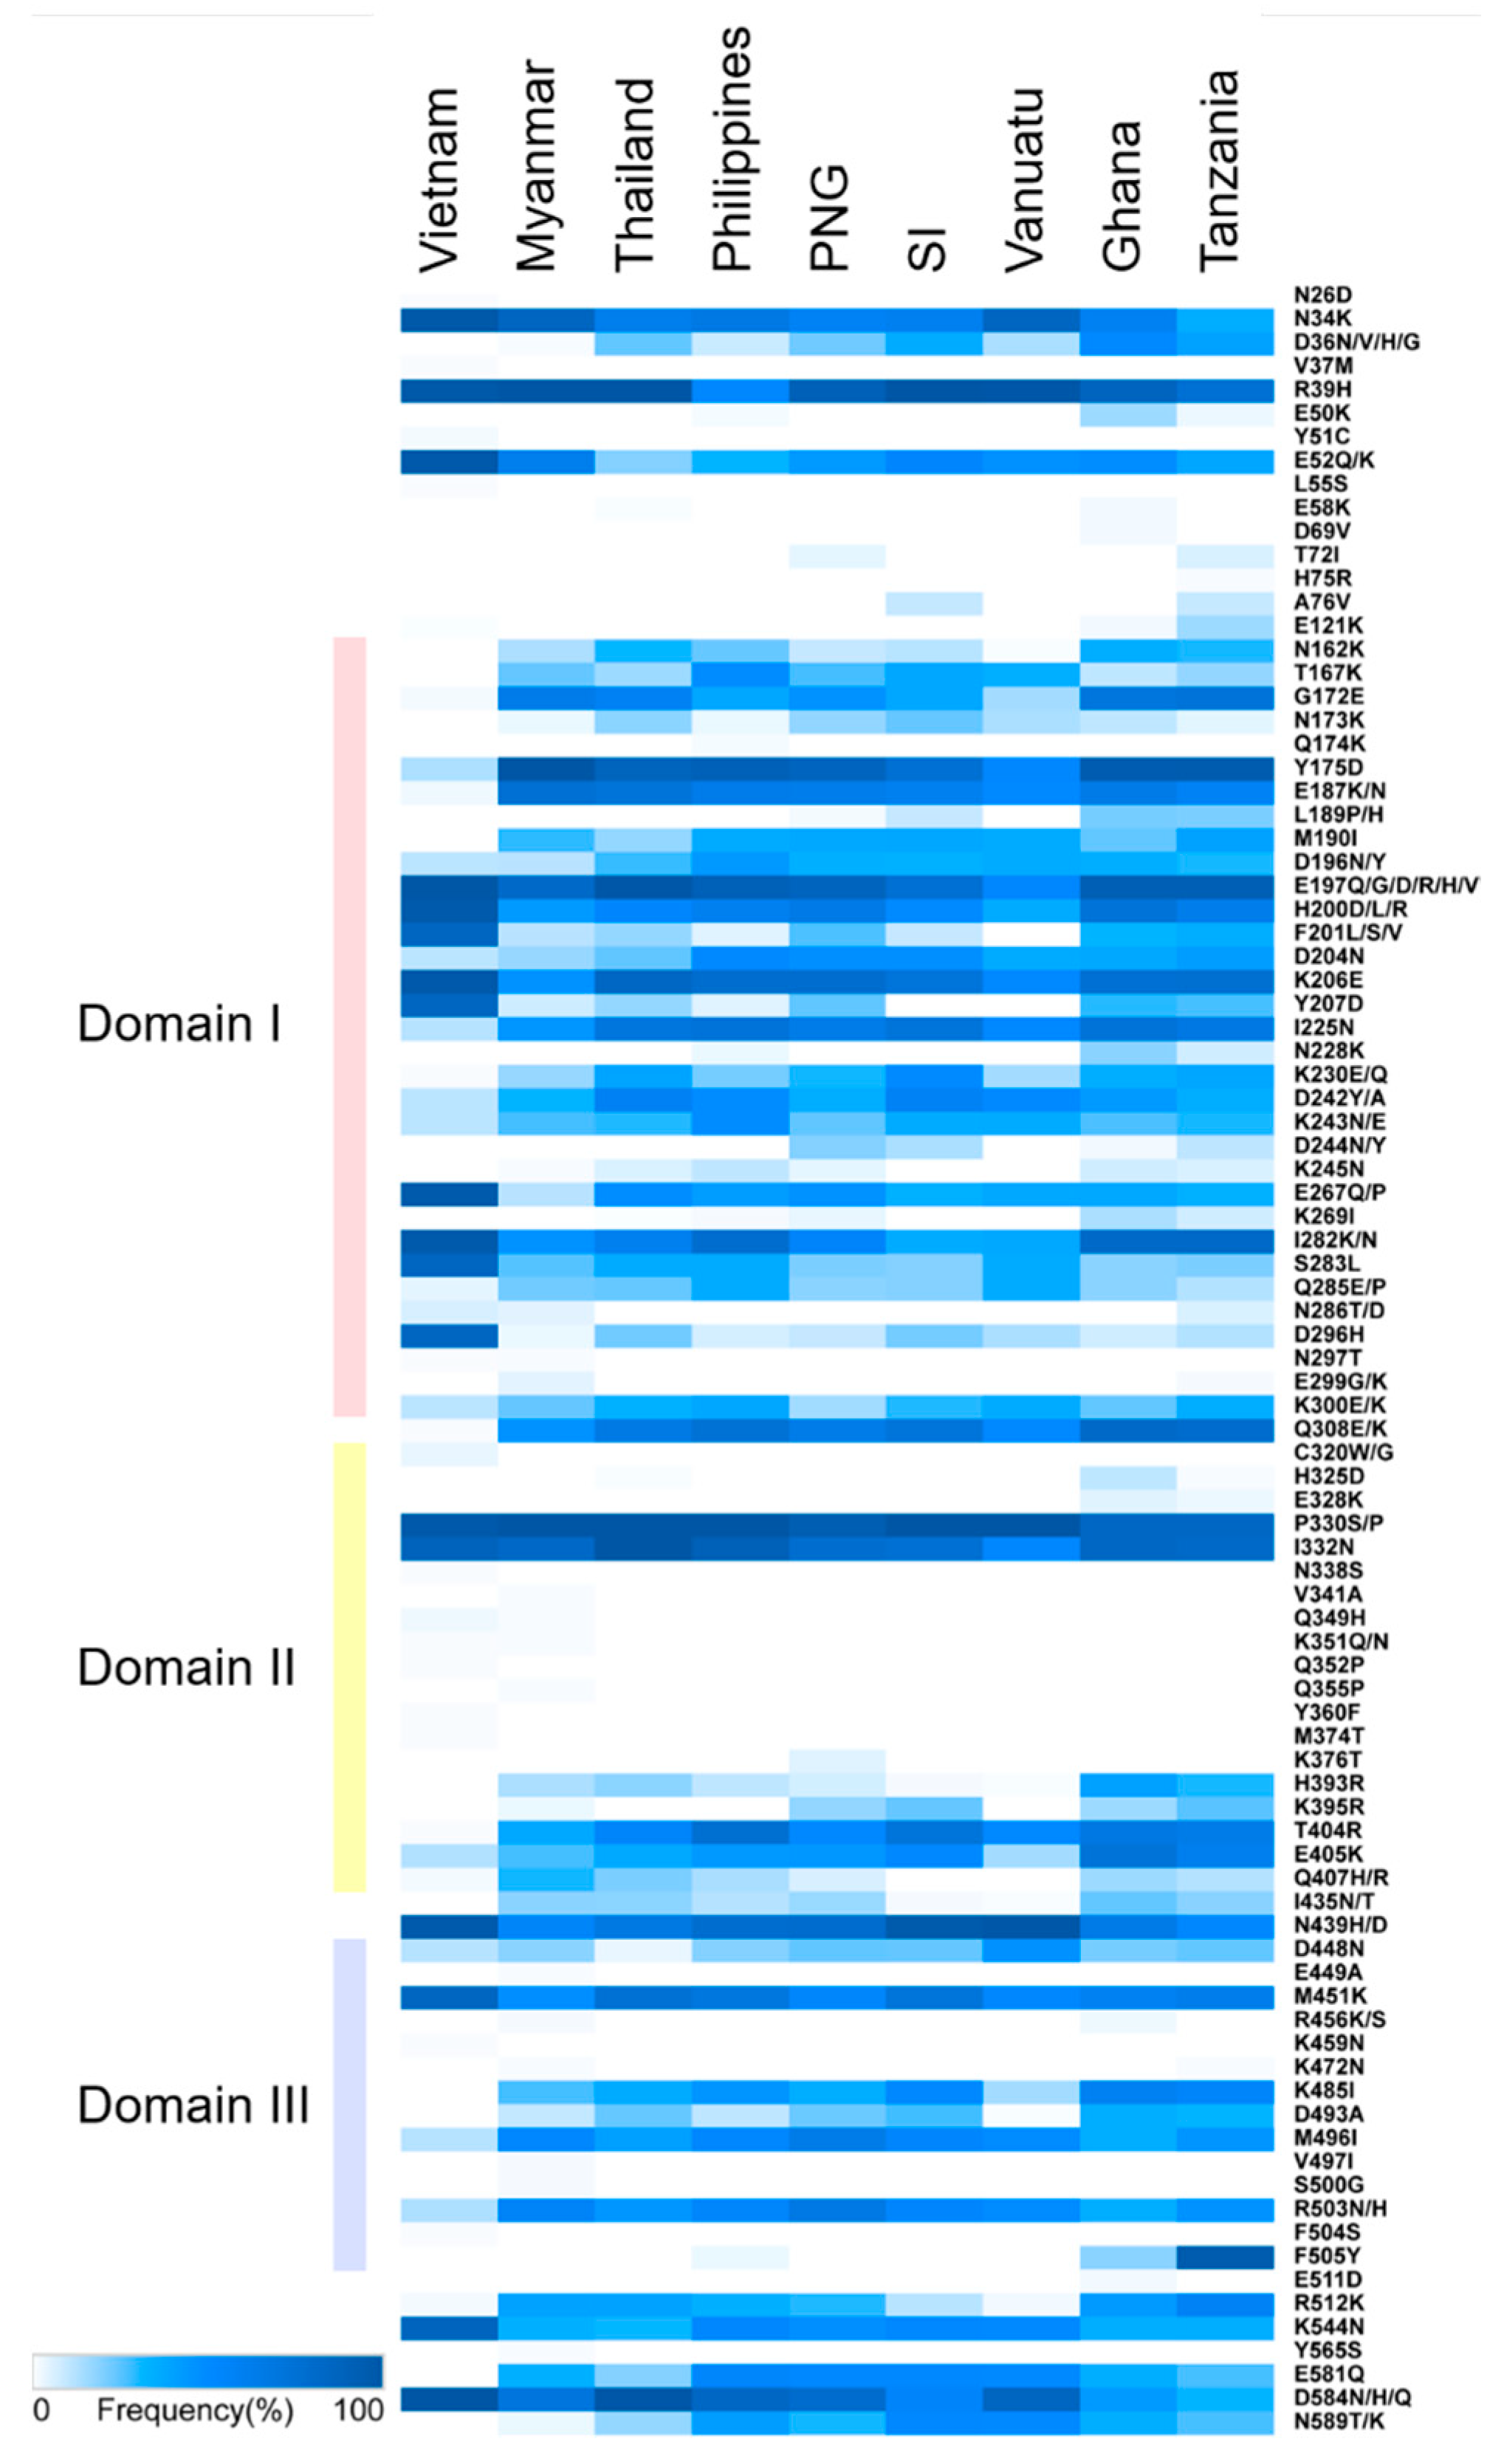
3.2. Amino Acid Polymorphisms in Vietnamese pfama-1 Compared with Global pfama-1

Vietnamese pfama-1 shared similar, but not identical, patterns of amino acid polymorphism with global pfama-1. Amino acid changes at 91 positions were identified in global pfama-1. Most amino acid changes were detected in domains I (33 positions), II (19 positions), and III (16 positions), but also at 5′-terminal (5′-T) and 3′-terminal (3′-T) regions (Figure 3). Although global pfama-1 showed similar patterns of amino acid changes, the frequency of each amino acid change differed by country. Amino acid changes at 11 positions in Vietnamese pfama-1 showed higher frequencies than pfama-1 from other countries: N34K (Vietnam, 98.5%; others, 35.5–86.2%); E52Q/K (Vietnam, 97.7%; others, 20.0–62.1%); H200D/L/R (Vietnam, 96.9%; others, 36.5–73.0%); F201L/S/V (Vietnam, 85.5%; others, 0.0–35.5%); K206E (Vietnam, 97.7%; others, 51.8–83.8%); Y207D (Vietnam, 85.5%; others, 0.0–29.7%); E267Q/P (Vietnam, 96.9%; others, 12.1–48.8%); I282K/N (Vietnam 96.9%; others 36.0–82.3%); S283L (Vietnam, 84.7%; others, 20.0–36.5%); D296H (Vietnam, 84.7%; others, 3.4–22.5%); and K544N (Vietnam, 86.3%; others, 31.3–52.7%). Amino acid changes at 12 positions were detected with lower frequencies in Vietnamese pfama-1 compared with pfama-1 sequences from other countries: G172E (Vietnam, 2.3%; others, 15.3–72.6%); Y175D (Vietnam, 13.7%; others, 52.9–100%); E187K/N (Vietnam, 3.1%; others, 50.6–75.9%); I225N (Vietnam, 12.2%; others, 51.8–73.0%); K230E/Q (Vietnam, 1.5%; others, 15.3–38.8%); D242Y/A (Vietnam, 11.5%; others, 32.8–58.8%); K243N/E (Vietnam, 11.5%; others, 24.4–49.1%); Q285E/P (Vietnam 4.6%; others 12.9–36.5%); Q308E/K (Vietnam, 1.5%; others, 46.6–81.1%); T404R (Vietnam, 1.5%; others, 37.9–76.4%); M496I (Vietnam, 12.2%; others, 35.1–64.4%); and R503N/H (Vietnam, 13.7%; others, 35.1–66.7%). Amino acid changes at 11 positions (D36N/V/H/G, N162K, T167K, N173K, M190I, H393R, I435N/T, K483I, D493A, E581Q, and N589T/K), which were commonly identified in other countries, were not detected in Vietnamese pfama-1. Meanwhile, 12 amino acid changes at 11 positions (N26D, V37M, Y51C, L55S, C320G/W, N338S, Q352P, Y360F, M374T, K459N, and F504S) were unique to Vietnamese pfama-1, and not detected in global pfama-1 [25]. Substitution rates of amino acid changes at five positions (R39H, E197Q/G/D/R/H/V, P330S/P, I332N, and N439H/D) were relatively high (at least up to 50%) in all global pfama-1 analyzed.

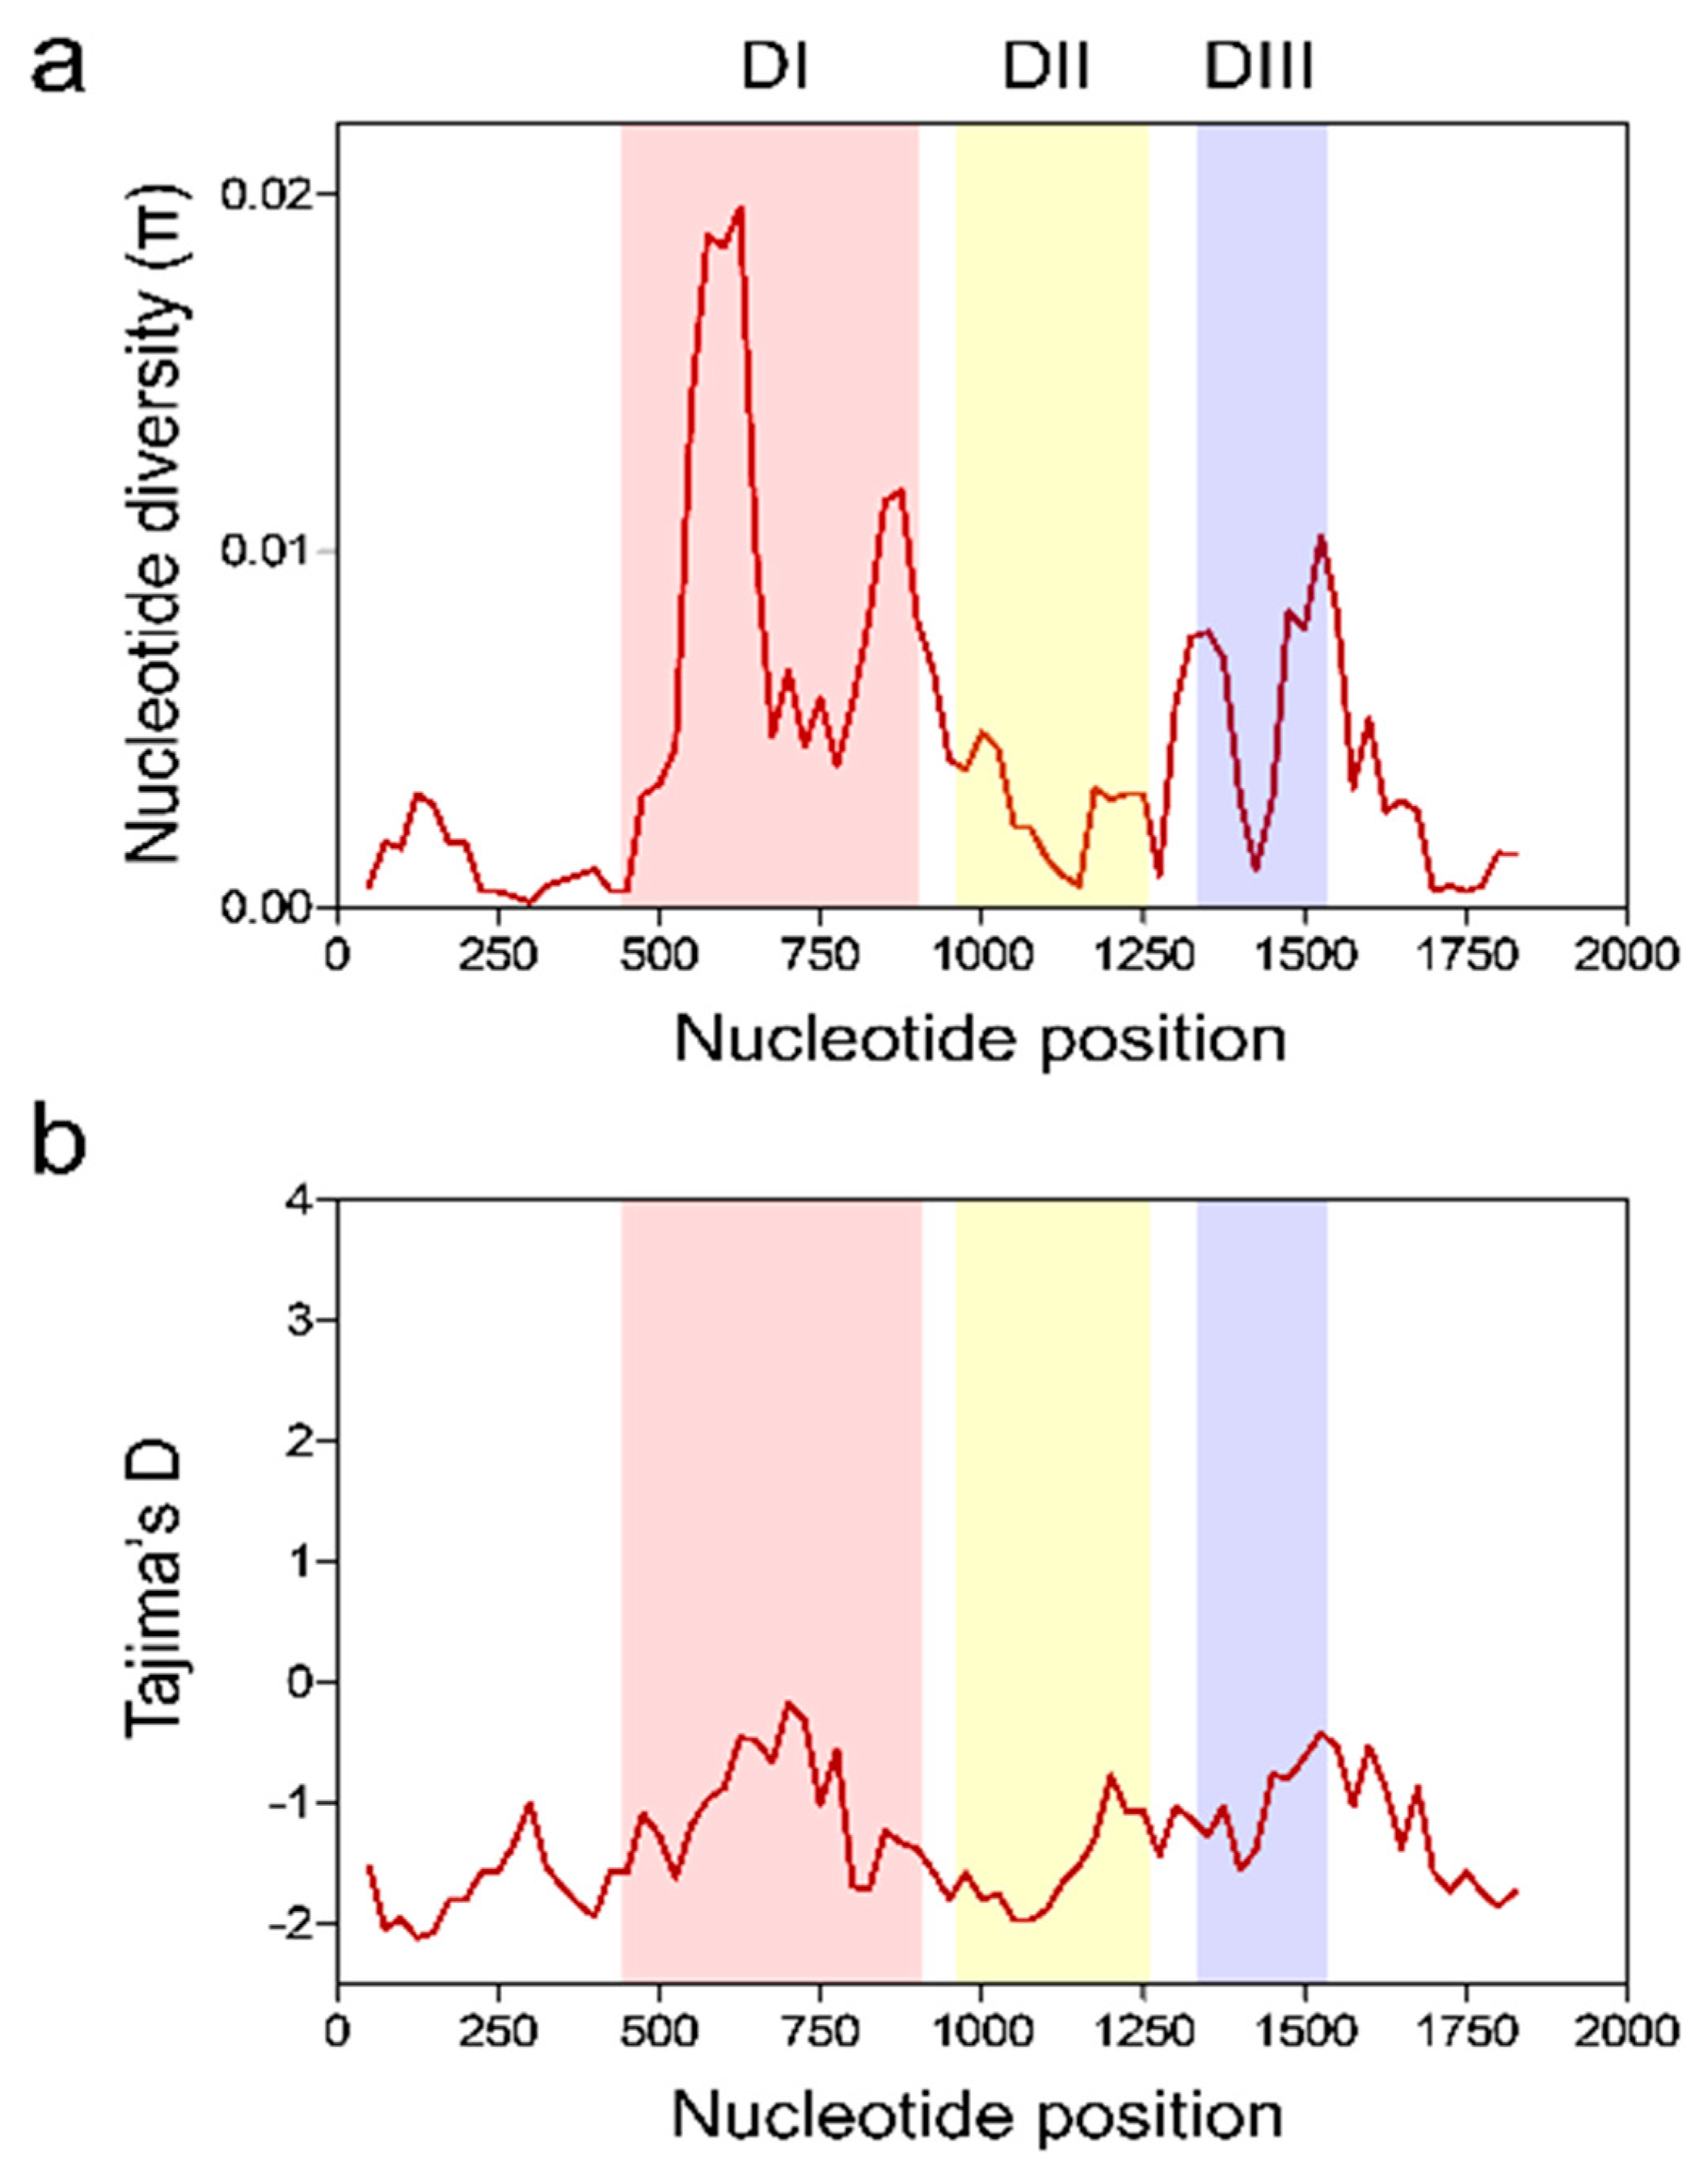
3.3. Nucleotide Diversity and Natural Selection of Vietnamese pfama-1

The nucleotide difference (K) of full-length pfama-1 of Vietnam isolates was 8.062 (Table 1). The highest K was identified at domain I (K = 4.198), whereas the lowest was detected at 5′-T (K = 0.485). Haplotype diversity (Hd) for 131 full-length Vietnamese pfama-1 was 0.837 ± 0.034. This value was higher at domain I (0.575 ± 0.052) than at 5′-T (0.358 ± 0.055), domains II (0.465 ± 0.053), domain III (0.455 ± 0.053), and 3′-T (0.432 ± 0.053). The nucleotide diversity (π) of each fragment was 0.0011 ± 0.0002 (5′-T), 0.0091 ± 0.0014 (domain I), 0.0031 ± 0.0004 (domain II), 0.0076 ± 0.0012 (domain III), and 0.0023 ± 0.0003 (3′-T), respectively (Table 1). Analysis of π across the Vietnamese pfama-1 also revealed two major peaks at domains I and III (Figure 4a). To determine whether natural selection affected the diversity of Vietnamese pfama-1, the dN − dS value was calculated using Nei and Gojobori’s method [40]. The dN − dS value for full-length Vietnamese pfama-1 was 0.0009, implying that no or mild natural selection might have acted in the Vietnamese pfama-1. However, slightly higher dN − dS values were identified at domain I (0.0084) and domain II (0.0020), implying the impact of mild natural selection. Tajima’s D value for full-length Vietnamese pfama-1 was −2.0046 (p < 0.05) (Table 1). When Tajima’s D value was analyzed for each fragment, all fragments showed negative, suggesting selective sweep or purifying selection. A sliding window plot of Tajima’s D values across the Vietnamese pfama-1 also showed that the values were below zero in all the domains (Figure 4b).

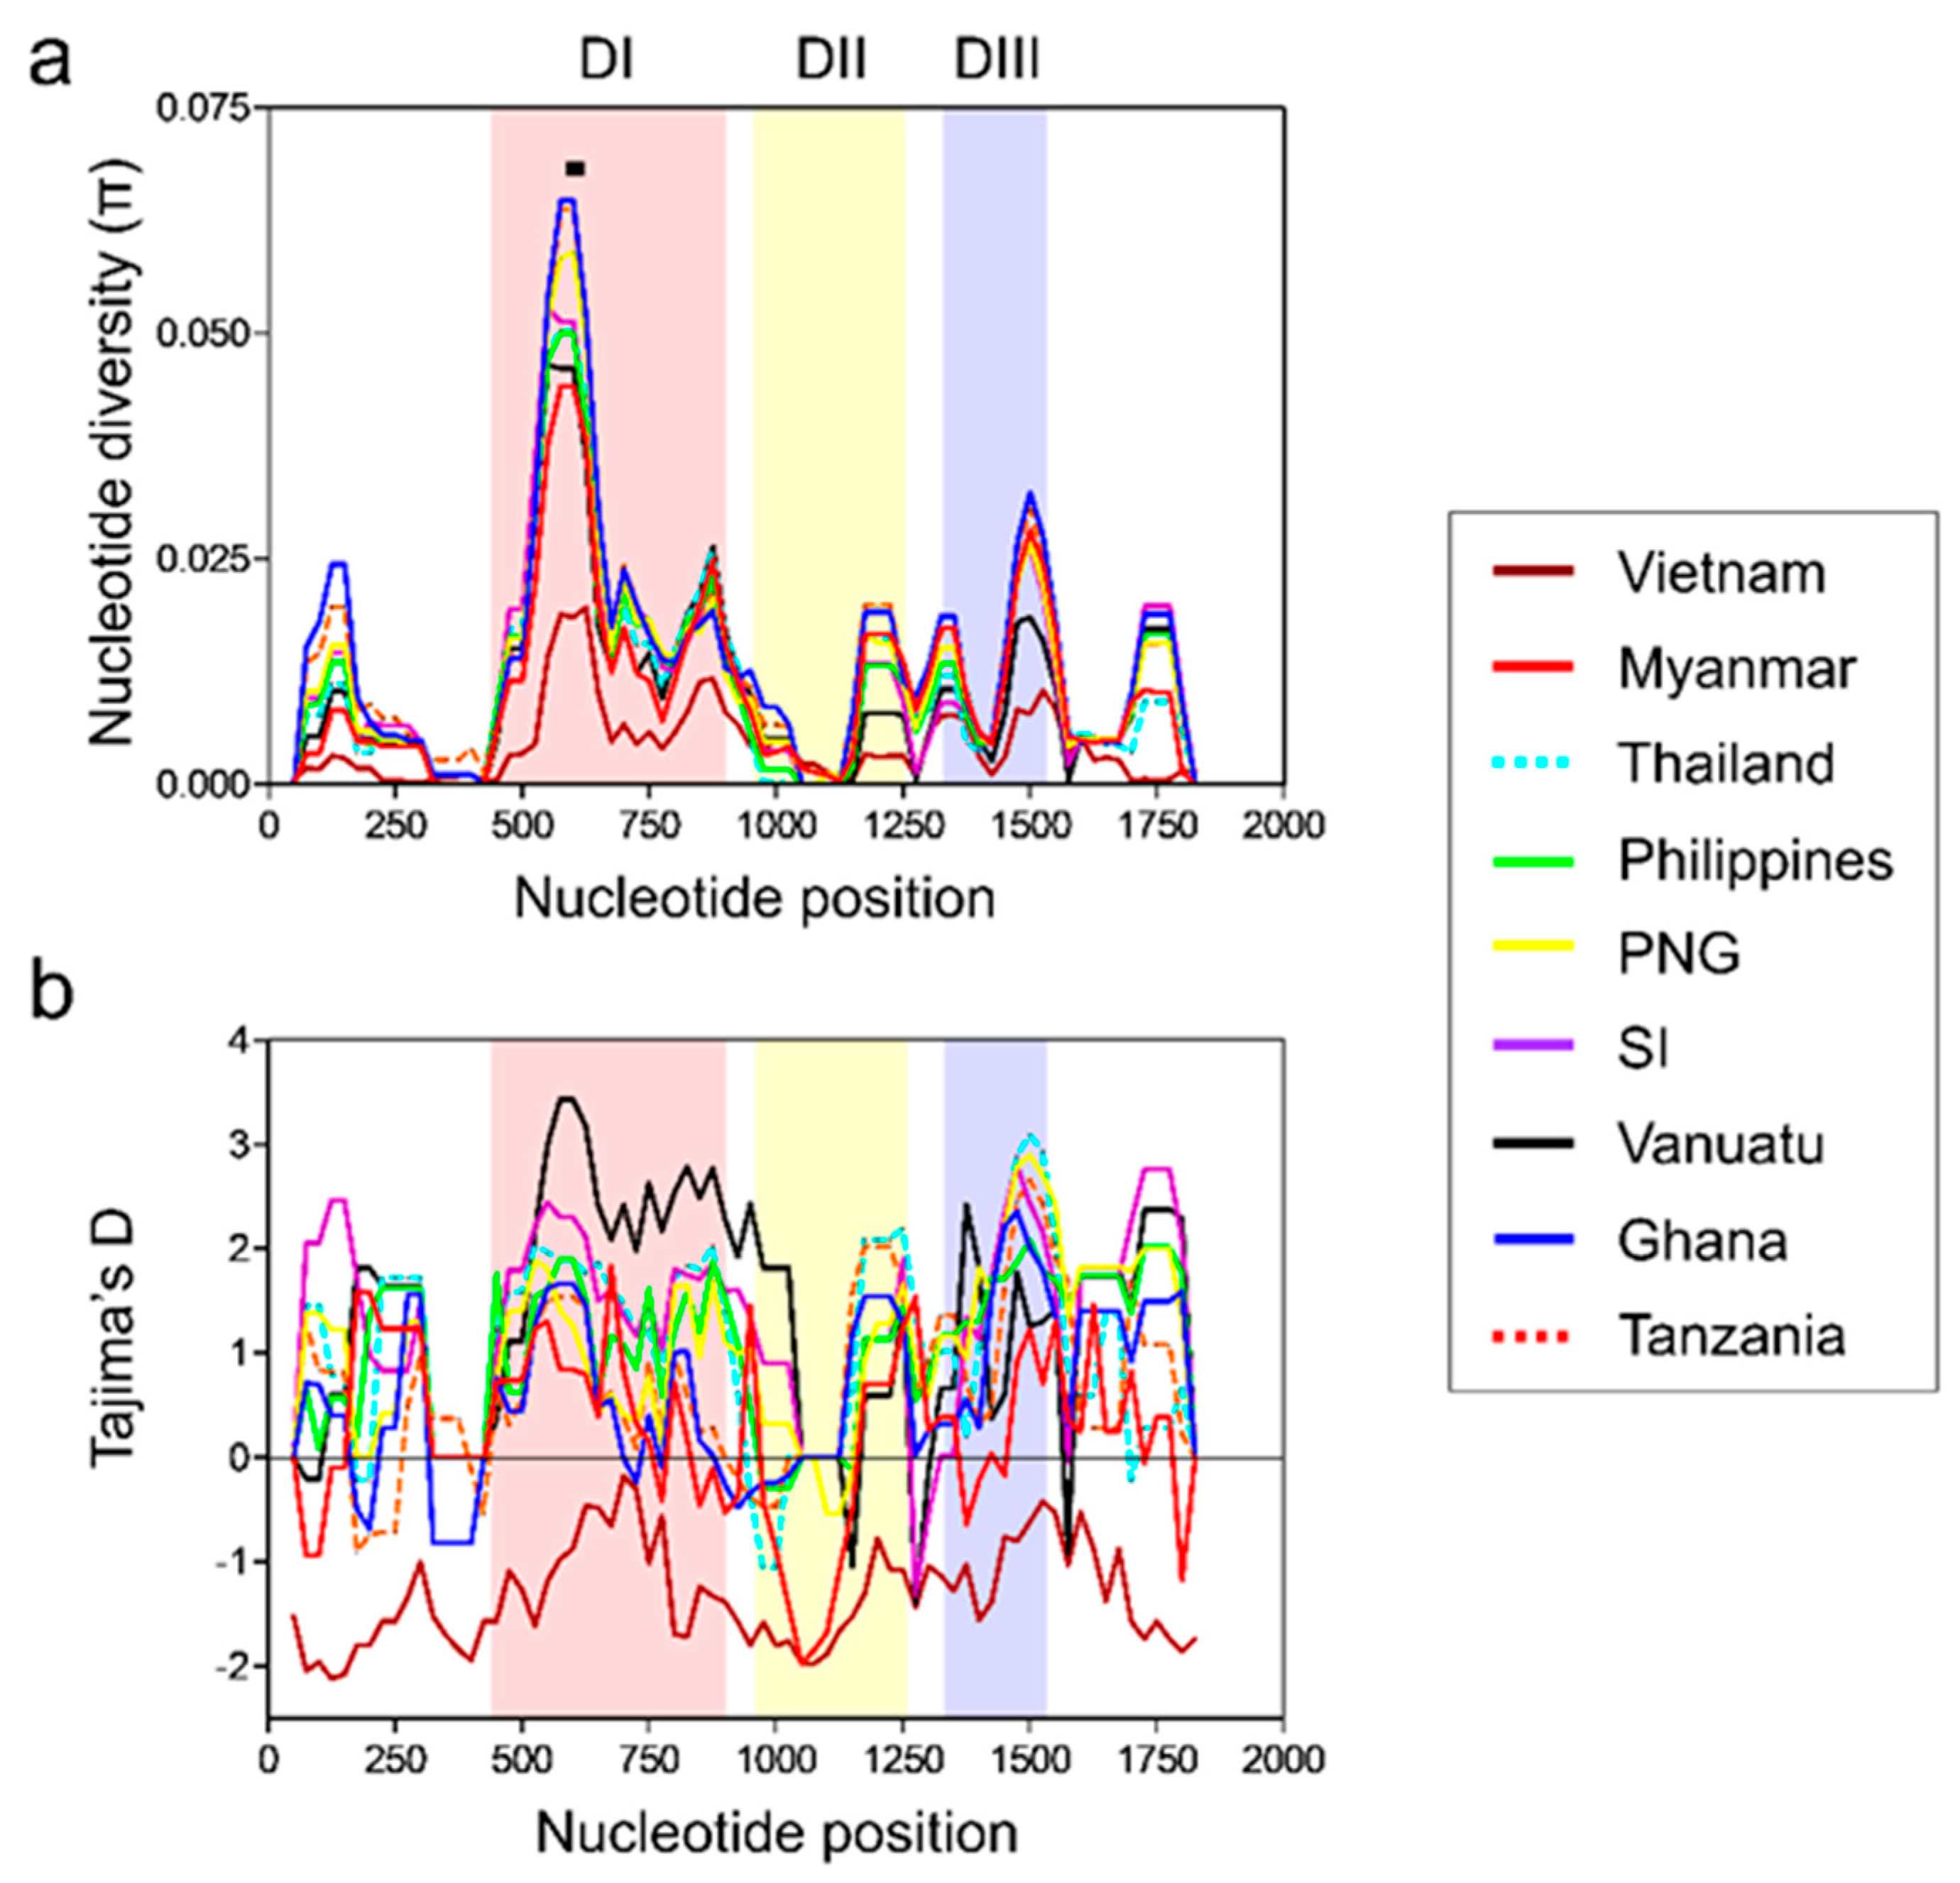
3.4. Nucleotide Diversity and Natural Selection of Global pfama-1

The Vietnamese pfama-1 showed a substantially lower K value compared with the global pfama-1 including the Southeast Asian countries, Myanmar and Thailand (Table 2). The K values of African pfama-1 were higher than those of Asian and Pacific pfama-1. The Hd values of African pfama-1 were also higher than those of pfama-1 derived from other geographic areas. In contrast to other global pfama-1, the Vietnamese pfama-1 showed substantially low-level selective pressure, with a dN/dS ratio of 1.250, suggesting minimal positive selection. The π value of pfama-1 from each country differed by country, whereas African pfama-1 showed higher π values than those of Asian and Pacific pfama-1 (Table 2). Vietnamese pfama-1 showed the lowest π value among the global pfama-1 analyzed. To determine the occurrence and significance of any deviation from neutral evolution, Tajima’s D, and Fu and Li’s D and F values were calculated. All pfama-1 sequences except Vietnamese pfama-1 showed positive Tajima’s D values, indicating balancing selection in global pfama-1 (Table 2). Both Fu and Li’s D and F values also suggested evidence for balancing selection acting primarily on the global pfama-1. However, interestingly, the Vietnamese pfama-1 revealed a negative Tajima’s D value, implying selective sweep or purifying selection. A sliding window plot of π revealed that global pfama-1 shared highly similar patterns of π across the sequences (Figure 5a). The highest peak of π was commonly identified at domain I of all global isolates. The cluster 1 of the loop I (C1-L) region was located on the π peak of domain I. A sliding window plot of Tajima’s D also revealed that global pfama-1 exhibited a similar pattern of Tajima’s D across the gene, with positive values at domains I and III, despite a few differences among global pfama-1 (Figure 5b). However, the Vietnamese pfama-1 showed a different pattern of Tajima’ D, with negative values across the gene, even though Vietnam pfama-1 showed comparable patterns of two peaks at domains I and III consistent with global pfama-1.

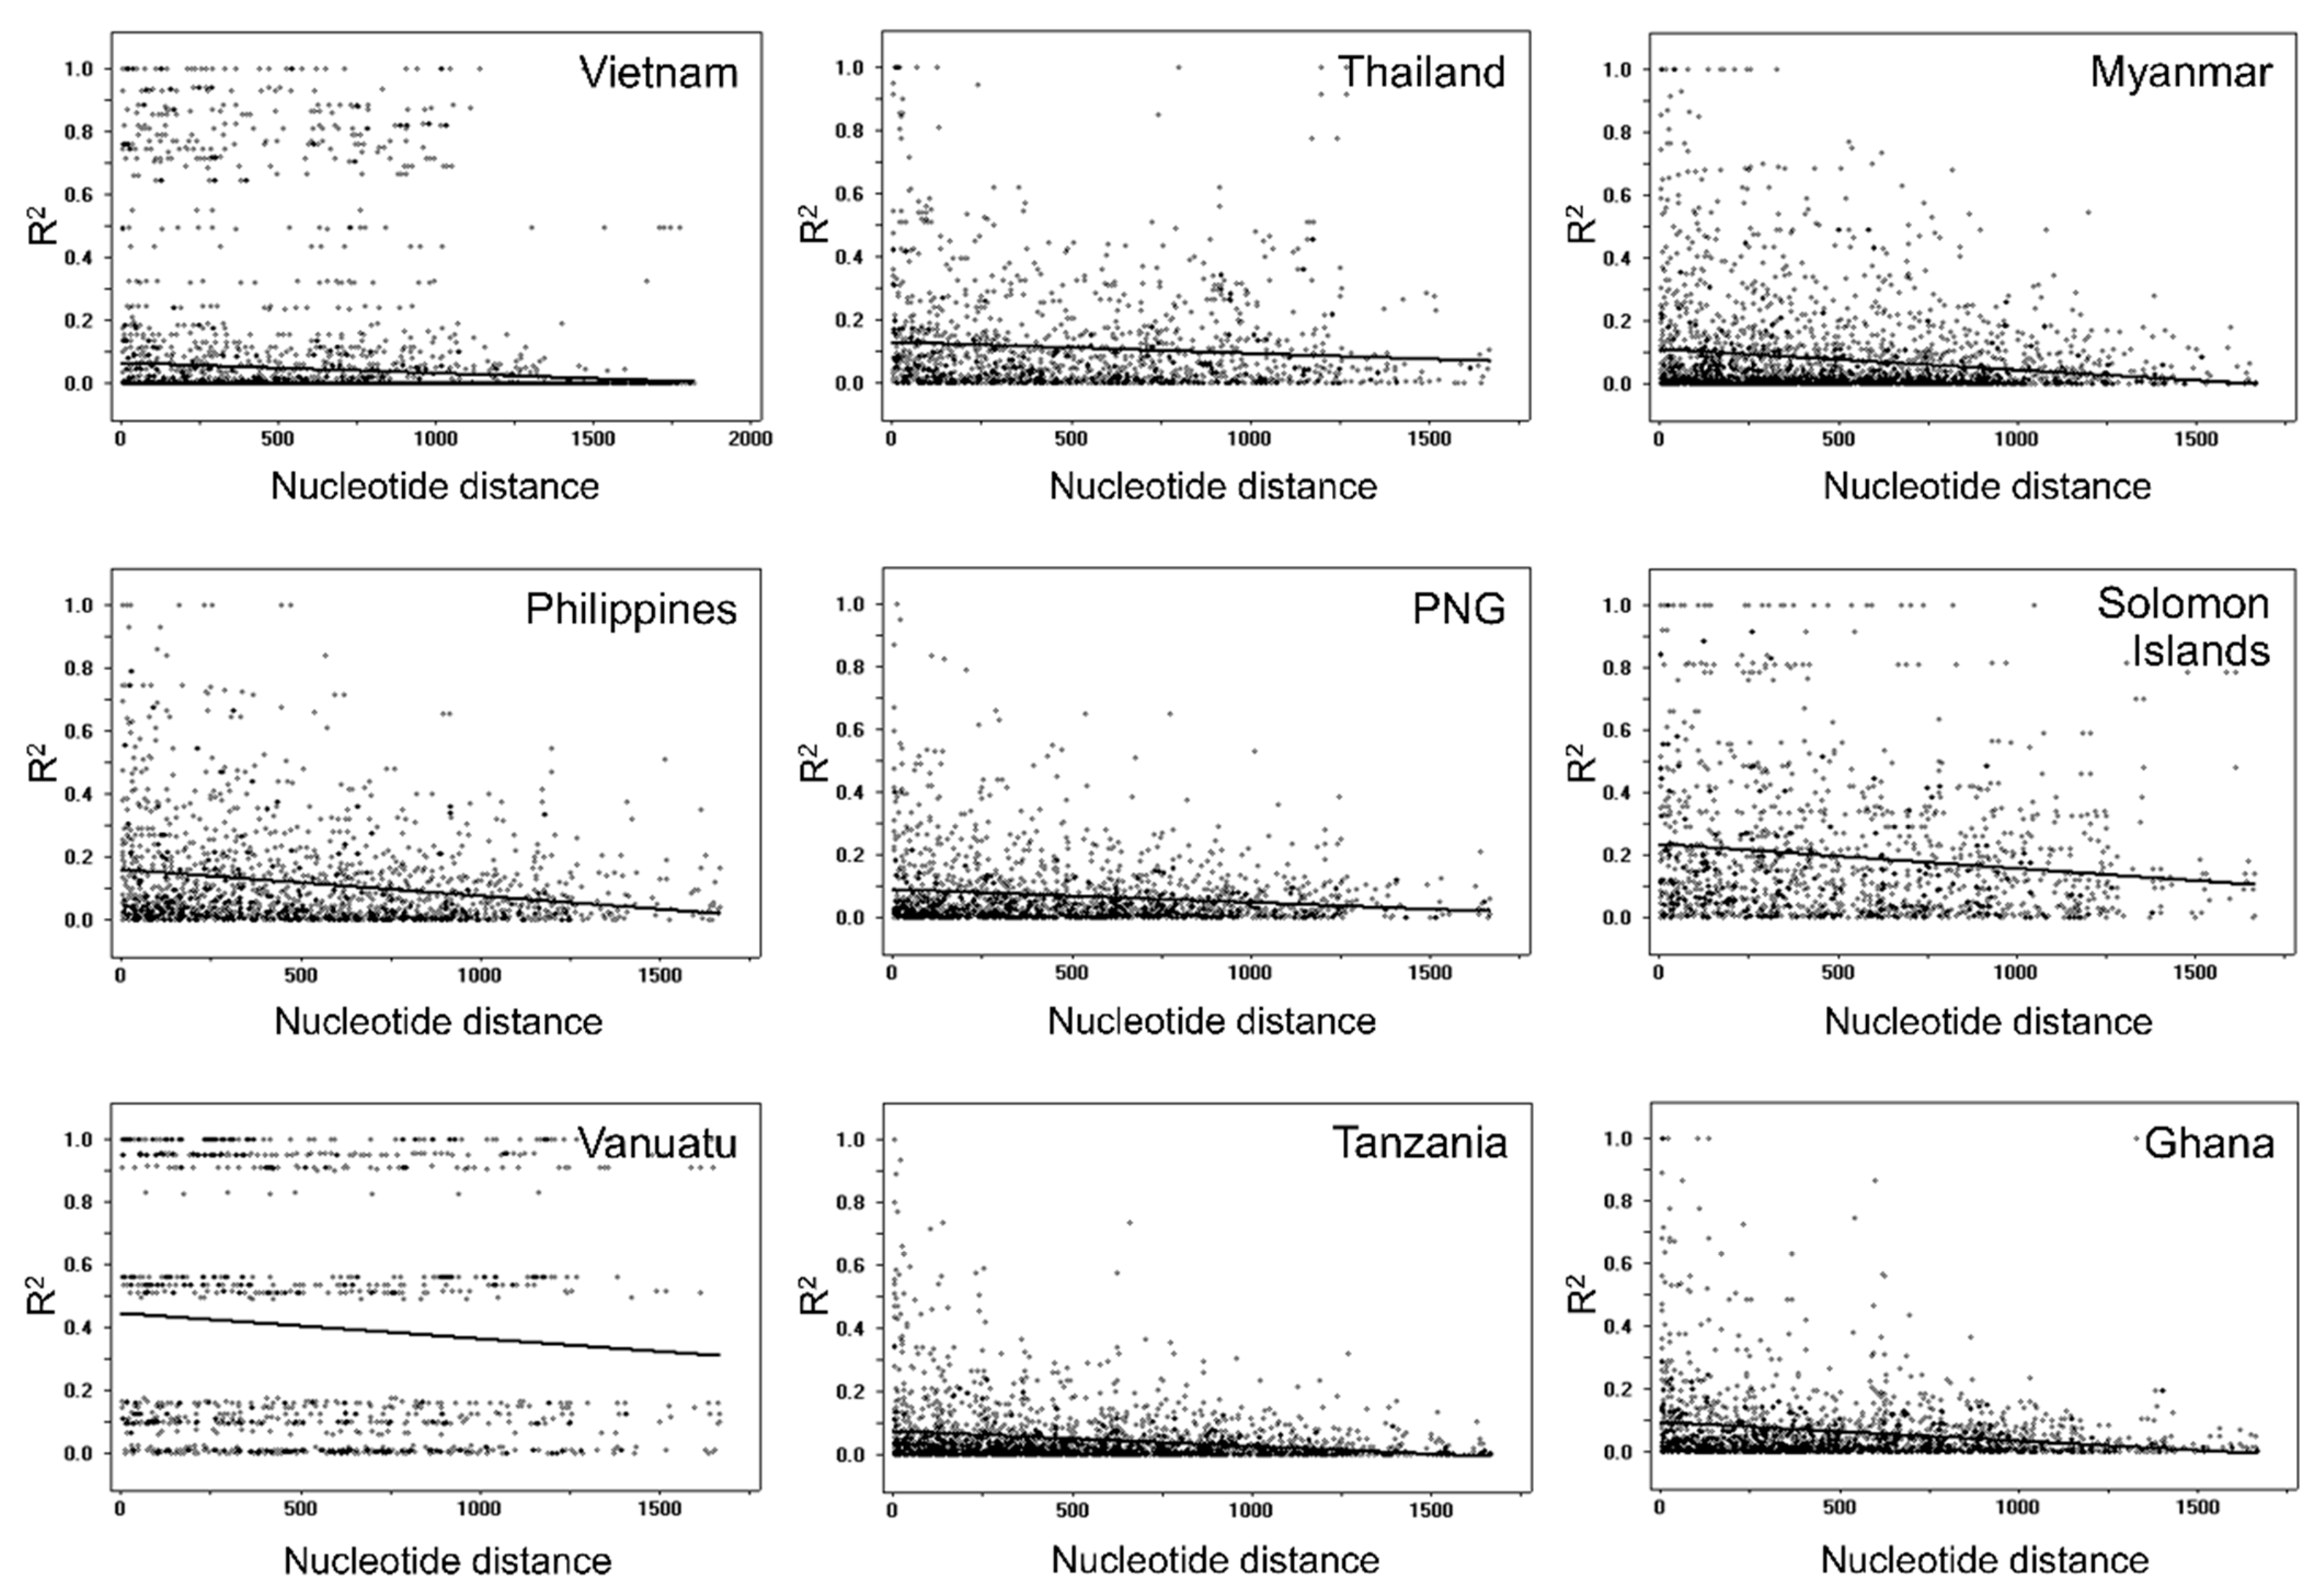
3.5. Recombination and Linkage Disequilibrium

The estimated minimum number of recombination events between adjacent polymorphic sites (Rm) for Vietnamese pfama-1 was 20 (Table 3). The predicted location of plausible recombination sites were domains I and III, suggesting that meiotic recombination between the sites may have contributed to the genetic diversity of Vietnamese pfama-1. Possible recombination events were also predicted in global pfama-1. The highest R values were detected in African pfama-1 (Ghana and Tanzania), whereas Asian and Pacific pfama-1, except PNG, showed relatively lower R values (Table 3). The LD index (R2) for global pfama-1 also declined with increasing distance across the gene, suggesting the role of intragenic recombination in the genetic diversity of global pfama-1 (Figure 6).

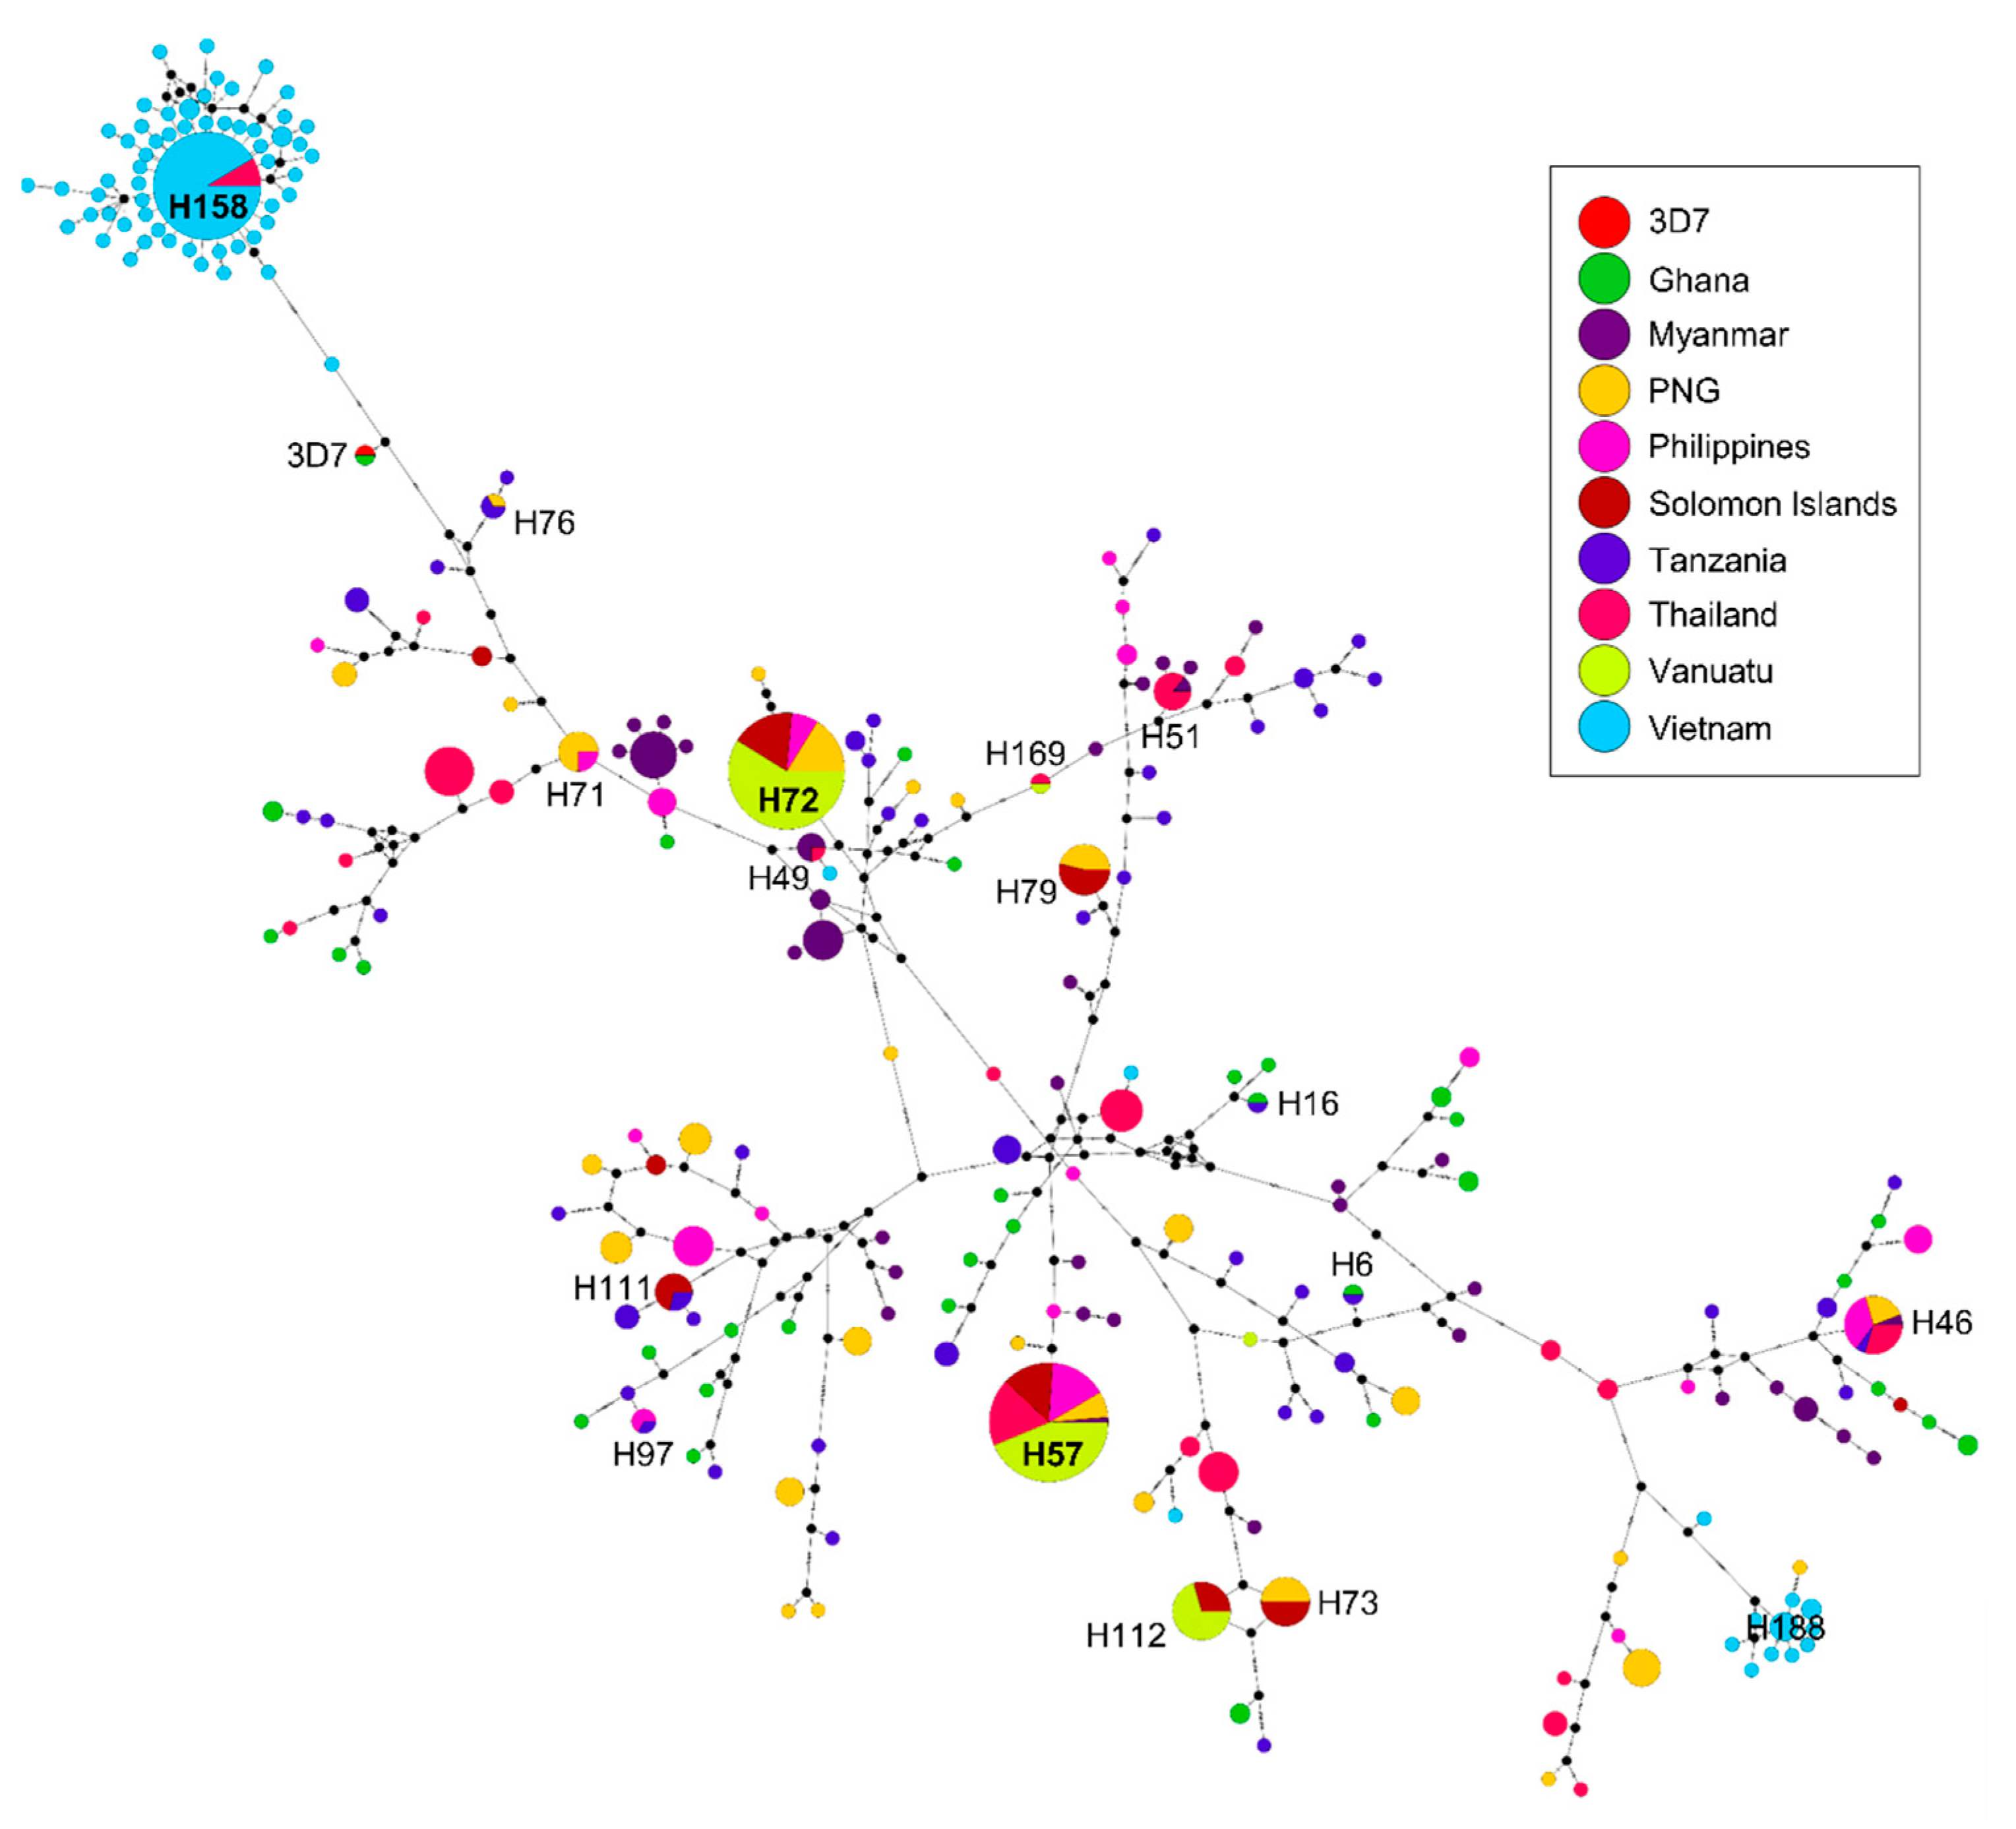
3.6. Haplotype Network Analysis

In order to analyze the relationships between and among the global pfama-1, a haplotype network was constructed. A dense network with 245 individual haplotypes with complicated relationships was established using 648 global pfama-1 sequences (Figure 7). Haplotype 57 was a predominant haplotype shared by isolates from six Asian and Pacific countries, including Myanmar, Thailand, Philippines, PNG, Solomon Islands, and Vanuatu. Haplotype 72 (H72) was also a major haplotype, with a prevalence of 10.5%, and shared by Pacific populations. Four haplotypes (H71, H73, H79, and H112) were admixed with Pacific populations. H6 and H16 comprised solely African populations. Five haplotypes (H46, H51, H76, H97, and H111) were shared by African populations and Asian or Pacific populations. Interestingly, most Vietnamese pfama-1 haplotypes did not cluster with Asian and Pacific populations, and instead clustered into two separated haplotype groups, which branched from H158 and H188.

3.7. Nucleotide Differentiation among Global pfama-1

To further analyze the genetic differentiation and gene flow in global pfama-1, FST values were analyzed (Table 4). The FST values between different geographical pfama-1 populations ranged from 0.00019 (between Ghana and Tanzania) to 0.42009 (between Vietnam and Solomon Islands). Interestingly, the Vietnamese pfama-1 exhibited large genetic differentiation from other global pfama-1.

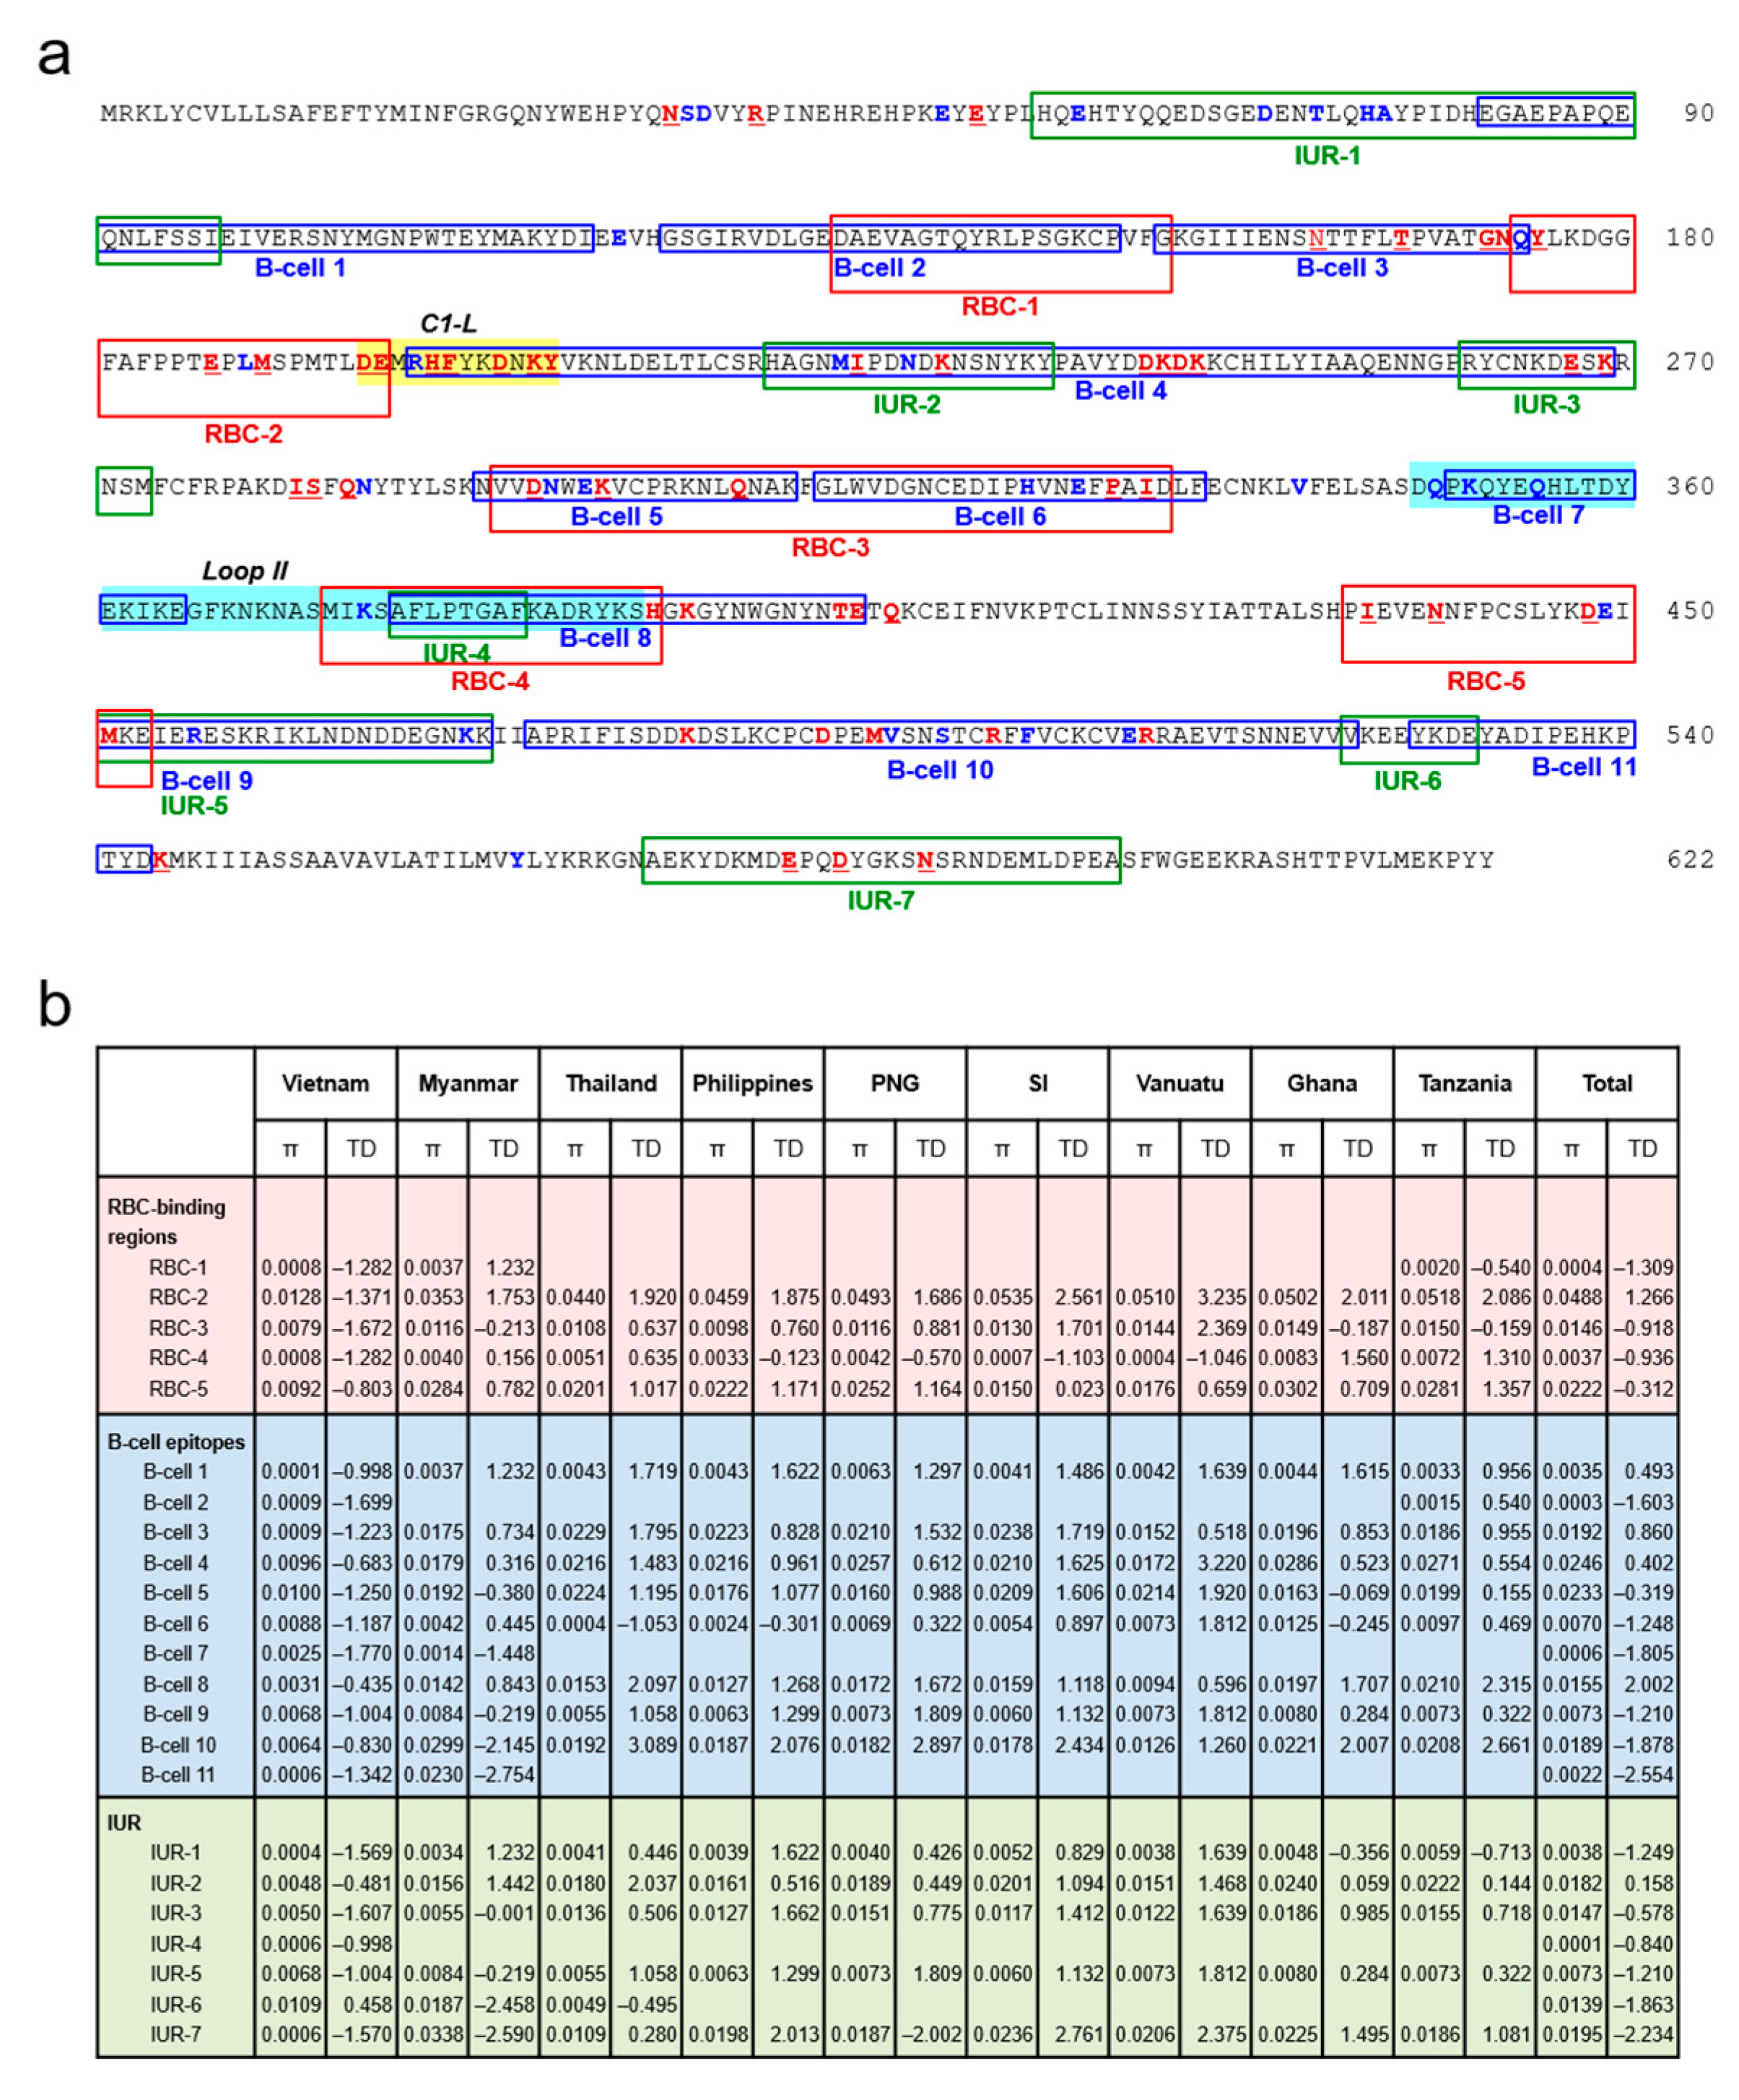
3.8. Association between Natural Selection and Host Immune Pressure

To evaluate selective pressure of host immunity on pfama-1, the genetic polymorphisms in the predicted B-cell epitopes, RBC-binding sites, and IUR regions of pfama-1 were analyzed. Most major amino acid changes were detected in the predicted B-cell epitopes, RBC-binding sites, or IUR regions of pfama-1 (Figure 8a). Of 91 amino acid changes identified in global pfama-1 compared with the 3D7 sequence (GenBank accession No.: U65407), 72 were found at the predicted B-cell epitopes, RBC-binding sites, or IUR regions. Among 51 amino acid changes detected commonly in global pfama-1, 42 were located in the predicted B-cell epitopes, RBC-binding sites, or IUR regions. Twenty-nine less common amino acid changes in global pfama-1 were also detected in the predicted B-cell epitopes, RBC-binding sites, or IUR regions. Eight of eleven predicted B-cell epitopes were polymorphic. Particularly, B-cell epitopes 3, 4, 5, 8, and 10 had major polymorphic amino acid residues with high levels of π (Figure 8b). Tajima’s D values for the predicted B-cell epitopes 3, 4, and 8 were positive, whereas the values for the predicted B-cell epitopes 5 and 10 were negative (Figure 8b). Amino acid changes commonly identified in global pfama-1 were mainly detected at the C1-L region, which is localized near the hydrophobic pocket of PfAMA-1 [46], and corresponded to the π peak in domain I. A few less frequently observed amino acid changes in global pfama-1 were detected in the loop II region.

4. Discussion

In the present study, we analyzed the genetic polymorphisms and natural selection of Vietnamese pfama-1 in order to understand the genetic nature of Vietnamese pfama-1. Diverse amino acid changes resulted by SNPs were detected in Vietnamese pfama-1, similar to global pfama-1 reported from other countries [25,45,47,48,49,50]. The 51 major amino acid changes that are commonly detected in global pfama-1 were also observed in Vietnamese pfama-1, but their patterns and frequencies differed with global populations. The majority of the common amino acid changes were localized in domains I, II, and III, supporting that these domains are major regions contributing to pfama-1 polymorphism [25]. Some amino acid changes were unique to pfama-1 of specific countries or continents. In particular, Vietnamese pfama-1 showed different patterns of amino acid changes from global pfama-1. Twelve amino acid changes at 11 positions (N26D, V37M, Y51C, L55S, C320G/W, N338S, Q352P, Y360F, M374T, K459N, and I504S) were unique to Vietnamese pfama-1, but not detected in global pfama-1. By contrast, 11 amino acid changes (D36N/V/H/G, N162K, T167K, N173K, M190I, H393R, I435N/T, K485I, D493A, E581Q, and N589T/K), which were commonly identified in global pfama-1 with varying frequencies, were not detected in Vietnamese pfama-1. Haplotype network analysis also revealed that Vietnamese pfama-1 formed distinct clusters, which were clearly distinguished from other global populations, including pfama-1 from the neighboring Southeast Asian countries of Myanmar and Thailand. These findings suggest that the Vietnamese pfama-1 exhibited distinct patterns of polymorphism and genetic differentiation compared with other global isolates. The FST value, a measure of population substructure based on an analysis of the overall genetic differentiation among populations [51], also suggested genetic differentiation of Vietnamese pfama-1 from other global populations. Due to the limitations of currently available full-length pfama-1 sequences from diverse geographical origins, the implications of substantial differentiation of Vietnamese pfama-1 from global pfama-1 is currently unclear. Further analysis of genetic polymorphisms of pfama-1 in a larger number of global P. falciparum populations is necessary to appreciate the polymorphic nature and evolutionary linkage of global pfama-1.
The π value of global pfama-1 differed depending on the origin of the isolates. The nucleotide diversity in Vietnam pfama-1 (π = 0.0043) was relatively lower than in isolates from different geographical areas. Lower malaria transmission in restricted areas of Vietnam compared with other endemic countries may contribute to the low-level genetic diversity in Vietnamese pfama-1. However, it is also necessary to consider the global pfama-1 sequences analyzed in this study were obtained from parasites collected at different time points in each country, which do not reflect the π value of the pfama-1 populations in the same period. In fact, the genetic structure of Plasmodium populations in endemic areas or countries changes dynamically over time due to various factors [52,53,54,55,56]. Different sizes of isolates from each country may also affect the π value of pfama-1 in each country. Therefore, a systematic analysis of the global P. falciparum isolates collected in the same period, especially current, may be necessary to delineate the genetic variations and evolutionary trends of global pfama-1. Although the π value of global pfama-1 differed by country, synchronized patterns of π across pfama-1 were recognized in global pfama-1, including Vietnamese pfama-1. A sliding window plot suggested that the nucleotide diversity was unevenly distributed across pfama-1, and high levels of π were similarly observed in domains I and III of global pfama-1, supporting that the domains are the main regions contributing to the genetic heterogeneity of pfama-1.
Natural selection probably affected by the host–immune response and recombination between genetically distinct alleles during meiotic replication in the mosquito midgut have been understood as the two main mechanisms underlying pfama-1 genetic diversity [25,57,58]. Interestingly, the Vietnamese pfama-1 showed different patterns of natural selection compared with pfama-1 from other countries. In contrasts to global pfama-1, which showed positive values of Tajima’s D, the Vietnamese pfama-1 revealed a negative Tajima’s D value, implying purifying selection. The dN/dS ratios of global pfama-1 were relatively high in all isolates, but the value was much lower in Vietnamese pfama-1, suggesting the absence of strong positive selection. These findings suggested that Vietnamese pfama-1 underwent different natural selection compared with pfama-1 from other countries, probably due to selective sweep or a bottleneck effect. However, regardless of these differences, the sliding window plot revealed that domains I and III exhibited high values of π and Tajima’s D across global pfama-1, implying that these regions represent possible dominant targets for natural selection by host immune response. Indeed, most common amino acid changes identified in global pfama-1 were mainly scattered in domains I and III, corresponding to B-cell epitopes 3, 4, 5, 9, and 10. The C1-L cluster, which is located near the hydrophobic pocket of domain I in PfAMA-1 [46], is known to affect the binding capacity of inhibitory antibodies, and thereby mediates escape from PfAMA-1 antibodies induced by P. falciparum infection or vaccine trials [16,45,59,60,61]. The clusters of amino acid polymorphisms including tri- and hepta-morphic changes scattered in the C1-L region of global pfama-1 suggest strong natural selection, which further contributes to host immune escape [17,61,62]. Meanwhile, loop II, the target of the 4G2 inhibitory antibody [63], was highly conserved in global pfama-1, suggesting that this region might be a vaccine candidate based on PfAMA-1 [25]. Meiotic recombination is also one of the main forces driving allelic diversity of pfama-1 [25,50,57]. Substantial levels of recombination events in pfama-1 derived from other geographical isolates have been reported [25]. Although the Vietnamese pfama-1 revealed a lower level of genetic diversity than the other global pfama-1, a comparable level of recombination events and decline of the LD index R2 were also detected in Vietnamese pfama-1. These findings suggest that interallelic recombination is another force generating genetic diversity of the Vietnamese pfama-1, and consistent with findings from other geographical areas.

5. Conclusions

Overall patterns of nucleotide diversity and major amino acid changes in Vietnamese pfama-1 were similar to those seen in global pfama-1. However, the Vietnamese pfama-1 revealed relatively lower genetic diversity than pfama-1 populations from other geographical regions, and showed a distinct genetic differentiation profile. Although evidence for natural selection and recombination, which may contribute to the generation and maintenance of genetic diversity of pfama-1, were also found in Vietnamese pfama-1, it revealed a distinct trend of natural selection compared with other global pfama-1. These results have significant implications for understanding the genetic nature of the Vietnamese P. falciparum population, warranting continuous monitoring of the genetic diversity of global pfama-1 to elucidate the polymorphic nature and evolutionary aspects of pfama-1, and design an effective vaccine targeting P. falciparum populations globally.

Author Contributions

J.-M.K. carried out genetic analysis of pfama-1; N.T.M.T. and H.-H.Q. contributed to blood sample collection; J.-M.K., H.G.L., T.C.V., H.N., W.G.Y., W.-M.S. and B.-K.N. analyzed and interpreted the data; J.-M.K. and B.-K.N. designed and supervised the experiments; J.-M.K. and B.-K.N. wrote the draft of the manuscript; H.G.L., T.C.V., W.G.Y., W.-M.S., N.T.M.T., H.-H.Q. and B.-K.N. reviewed the manuscript. All authors have read and agreed to the published version of the manuscript.

Funding

This work was supported by the National Research Foundation of Korea (NRF) grant (NRF-2021R1I1A1A01048499).

Institutional Review Board Statement

This study protocol was reviewed and approved by the Ethics Committee of the Ministry of Health, Institute of Malariology, Parasitology, and Entomology (IMPE), Quy Nhon, Vietnam (No. 368/VSR-LSDT).

Informed Consent Statement

Not applicable.

Data Availability Statement

The data supporting the conclusions of this article are provided within the article. The original datasets analyzed in this study are available from the corresponding author upon request. The nucleotide sequences reported in this study have been deposited in the GenBank database under the accession numbers MW938322–MW938452.

Acknowledgments

We thank the staff in the Tropical Diseases Clinical and Treatment Research Department, Institute of Malariology, Parasitology, and Entomology, Quy Nhon, and the health professionals for their contribution and technical support in field study.

Conflicts of Interest

The authors declare no conflict of interest.

References

  1. World Malaria Report: 20 Years of Global Progress and Challenges; World Health Organization: Geneva, Switzerland, 2020.
  2. Menard, D.; Dondorp, A. Antimalarial drug resistance: A threat to malaria elimination. Cold Spring Harb. Perspect. Med. 2017, 7, a025619. [Google Scholar] [CrossRef] [PubMed] [Green Version]
  3. Hodder, A.N.; Crewther, P.E.; Matthew, M.L.S.M.; Reid, G.E.; Moritz, R.L.; Simpson, R.J.; Anders, R.F. The disulfide bond structure of Plasmodium apical membrane antigen-1. J. Biol. Chem. 1996, 271, 29446–29452. [Google Scholar] [CrossRef] [Green Version]
  4. Peterson, M.G.; Marshall, V.M.; Smythe, J.A.; Crewther, P.E.; Lew, A.; Silva, A.; Anders, R.F.; Kemp, D.J. Integral membrane protein located in the apical complex of Plasmodium falciparum. Mol. Cell. Biol. 1989, 9, 3151–3154. [Google Scholar] [CrossRef] [PubMed] [Green Version]
  5. Healer, J.; Crawford, S.; Ralph, S.; McFadden, G.; Cowman, A.F. Independent translocation of two micronemal proteins in developing Plasmodium falciparum merozoites. Infect. Immun. 2002, 70, 5751–5758. [Google Scholar] [CrossRef] [PubMed] [Green Version]
  6. Mitchell, G.H.; Thomas, A.W.; Margos, G.; Dluzewski, A.R.; Bannister, L.H. Apical membrane antigen 1, a major malaria vaccine candidate, mediates the close attachment of invasive merozoites to host red blood cells. Infect. Immun. 2004, 72, 154–158. [Google Scholar] [CrossRef] [Green Version]
  7. Silvie, O.; Franetich, J.-F.; Charrin, S.; Mueller, M.S.; Siau, A.; Bodescot, M.; Rubinstein, E.; Hannoun, L.; Charoenvit, Y.; Kocken, C.; et al. A role for apical membrane antigen 1 during invasion of hepatocytes by Plasmodium falciparum sporozoites. J. Biol. Chem. 2004, 279, 9490–9496. [Google Scholar] [CrossRef] [Green Version]
  8. Yap, A.; Azevedo, M.; Gilson, P.R.; Weiss, G.E.; O’Neill, M.T.; Wilson, D.W.; Crabb, B.S.; Cowman, A.F. Conditional expression of apical membrane antigen 1 in Plasmodium falciparum shows it is required for erythrocyte invasion by merozoites. Cell. Microbiol. 2014, 16, 642–656. [Google Scholar] [CrossRef] [Green Version]
  9. Udhayakumar, V.; Kariuki, S.; Nahlen, B.L.; Kolczack, M.; A Lal, A.; Roberts, J.M.; Oloo, A.J.; Girma, M. Longitudinal study of natural immune responses to the Plasmodium falciparum apical membrane antigen (AMA-1) in a holoendemic region of malaria in western Kenya: Asembo Bay Cohort Project VIII. Am. J. Trop. Med. Hyg. 2001, 65, 100–107. [Google Scholar] [CrossRef] [Green Version]
  10. Cortés, A.; Mellombo, M.; Masciantonio, R.; Murphy, V.J.; Reeder, J.C.; Anders, R.F. Allele specificity of naturally acquired antibody responses against Plasmodium falciparum apical membrane antigen 1. Infect. Immun. 2005, 73, 422–430. [Google Scholar] [CrossRef] [Green Version]
  11. Rodrigues, M.H.C.; Rodrigues, K.M.; Oliveira, T.R.; Cômodo, A.N.; Rodrigues, M.M.; Kocken, C.H.M.; Thomas, A.W.; Soares, I.S. Antibody response of naturally infected individuals to recombinant Plasmodium vivax apical membrane antigen-1. Int. J. Parasitol. 2005, 35, 185–192. [Google Scholar] [CrossRef]
  12. Moncunill, G.; Mayor, A.; Jiménez, A.; Nhabomba, A.; Vila, N.C.; Puyol, L.; Campo, J.J.; Manaca, M.N.; Aguilar, R.; Pinazo, M.-J.; et al. High antibody responses against Plasmodium falciparum in immigrants after extended periods of interrupted exposure to malaria. PLoS ONE 2013, 8, e73624. [Google Scholar] [CrossRef] [Green Version]
  13. Remarque, E.J.; Faber, B.W.; Kocken, C.H.M.; Thomas, A.W. Apical membrane antigen 1: A malaria vaccine candidate in review. Trends Parasitol. 2008, 24, 74–84. [Google Scholar] [CrossRef] [PubMed]
  14. Thera, M.A.; Coulibaly, D.; Kone, A.K.; Guindo, A.B.; Traoré, K.; Sall, A.H.; Diarra, I.; Daou, M.; Traore, I.M.; Tolo, Y.; et al. Phase 1 randomized controlled trial to evaluate the safety and immunogenicity of recombinant Pichia pastoris-expressed Plasmodium falciparum apical membrane antigen 1 (PfAMA1-FVO [25-545]) in healthy Malian adults in Bandiagara. Malar. J. 2016, 15, 442. [Google Scholar] [CrossRef] [PubMed] [Green Version]
  15. Polley, S.D.; Mwangi, T.; Kocken, C.H.M.; Thomas, A.W.; Dutta, S.; Lanar, D.E.; Remarque, E.; Ross, A.; Williams, T.N.; Mwambingu, G.; et al. Human antibodies to recombinant protein constructs of Plasmodium falciparum apical membrane antigen 1 (AMA1) and their associations with protection from malaria. Vaccine 2004, 23, 718–728. [Google Scholar] [CrossRef] [PubMed]
  16. Takala, S.L.; Coulibaly, D.; Thera, M.A.; Batchelor, A.H.; Cummings, M.P.; Escalante, A.A.; Ouattara, A.; Traoré, K.; Niangaly, A.; Djimdé, A.A.; et al. Extreme polymorphism in a vaccine antigen and risk of clinical malaria: Implications for vaccine development. Sci. Transl. Med. 2009, 1, 2ra5. [Google Scholar] [CrossRef] [Green Version]
  17. Mugyenyi, C.K.; Elliott, S.R.; McCallum, F.J.; Anders, R.F.; Marsh, K.; Beeson, J.G. Antibodies to polymorphic invasion-inhibitory and non-inhibitory epitopes of Plasmodium falciparum apical membrane antigen 1 in human malaria. PLoS ONE 2013, 8, e68304. [Google Scholar] [CrossRef] [PubMed] [Green Version]
  18. Escalante, A.A.; Grebert, H.M.; Chaiyaroj, S.C.; Magris, M.; Biswas, S.; Nahlen, B.L.; Lal, A.A. Polymorphism in the gene encoding the apical membrane antigen-1 (AMA-1) of Plasmodium falciparum. X. Asembo Bay Cohort Project. Mol. Biochem. Parasitol. 2001, 113, 279–287. [Google Scholar] [CrossRef]
  19. Polley, S.D.; Conway, D.J. Strong diversifying selection on domains of the Plasmodium falciparum apical membrane antigen 1 gene. Genetics 2001, 158, 1505–1512. [Google Scholar] [CrossRef]
  20. Moon, S.-U.; Na, B.-K.; Kang, J.-M.; Kim, J.-Y.; Cho, S.-H.; Park, Y.-K.; Sohn, W.-M.; Lin, K.; Kim, T.-S. Genetic polymorphism and effect of natural selection at domain I of apical membrane antigen-1 (AMA-1) in Plasmodium vivax isolates from Myanmar. Acta Trop. 2010, 114, 71–75. [Google Scholar] [CrossRef]
  21. Arnott, A.; Mueller, I.; Ramsland, P.A.; Siba, P.M.; Reeder, J.C.; Barry, A.E. Global population structure of the genes encoding the malaria vaccine candidate, Plasmodium vivax apical membrane antigen 1 (PvAMA1). PLoS Negl. Trop. Dis. 2013, 7, e2506. [Google Scholar] [CrossRef] [Green Version]
  22. Terheggen, U.; Drew, D.R.; Hodder, A.N.; Cross, N.J.; Mugyenyi, C.K.; Barry, A.E.; Anders, R.F.; Dutta, S.; Osier, F.H.A.; Elliott, S.R.; et al. Limited antigenic diversity of Plasmodium falciparumapical membrane antigen 1 supports the development of effective multi-allele vaccines. BMC Med. 2014, 12, 1–20. [Google Scholar] [CrossRef] [Green Version]
  23. Kang, J.-M.; Lee, J.; Cho, P.-Y.; Moon, S.-U.; Ju, H.-L.; Ahn, S.K.; Sohn, W.-M.; Lee, H.-W.; Kim, T.-S.; Na, B.-K. Population genetic structure and natural selection of apical membrane antigen-1 in Plasmodium vivax Korean isolates. Malar. J. 2015, 14, 455. [Google Scholar] [CrossRef] [PubMed] [Green Version]
  24. Zhu, X.; Zhao, P.; Wang, S.; Liu, F.; Liu, J.; Wang, J.; Yang, Z.; Yan, G.; Fan, Q.; Cao, Y.; et al. Analysis of Pvama1 genes from China-Myanmar border reveals little regional genetic differentiation of Plasmodium vivax populations. Parasites Vectors 2016, 9, 1–12. [Google Scholar] [CrossRef] [PubMed] [Green Version]
  25. Kang, J.-M.; Lee, J.-Y.; Moe, M.; Jun, H.; Lê, H.G.; Kim, T.I.; Thái, T.L.; Sohn, W.-M.; Myint, M.K.; Lin, K.; et al. Population genetic structure and natural selection of Plasmodium falciparum apical membrane antigen-1 in Myanmar isolates. Malar. J. 2018, 17, 1–17. [Google Scholar] [CrossRef]
  26. Afridi, S.G.; Irfan, M.; Ahmad, H.; Aslam, M.; Nawaz, M.; Ilyas, M.; Khan, A. Population genetic structure of domain I of apical membrane antigen-1 in Plasmodium falciparum isolates from Hazara division of Pakistan. Malar. J. 2018, 17, 389. [Google Scholar] [CrossRef] [PubMed]
  27. Wang, Y.-N.; Lin, M.; Liang, X.-Y.; Chen, J.-T.; Xie, D.-D.; Wang, Y.-L.; Ehapo, C.S.; Eyi, U.M.; Huang, H.-Y.; Wu, J.-L.; et al. Natural selection and genetic diversity of domain I of Plasmodium falciparum apical membrane antigen-1 on Bioko Island. Malar. J. 2019, 18, 1–16. [Google Scholar] [CrossRef] [PubMed]
  28. Ministry of Health; National Malaria Control and Elimination Programme. National Strategy for Malaria Control and Elimination for the Period of 2012–2015; National Institute of Malariology Parasitology and Entomology: Hanoi, Vietnam, 2012. [Google Scholar]
  29. Goldlust, S.M.; Thuan, P.D.; Giang, D.D.H.; Thang, N.D.; Thwaites, G.E.; Farrar, J.; Thanh, N.V.; Nguyen, T.D.; Grenfell, B.T.; Boni, M.F.; et al. The decline of malaria in Vietnam, 1991–2014. Malar. J. 2018, 17, 226. [Google Scholar] [CrossRef] [PubMed] [Green Version]
  30. Van Long, B.; Allen, G.; Brauny, M.; Linh, L.T.K.; Pallerla, S.R.; Huyen, T.T.T.; van Tong, H.; Toan, N.L.; Quyet, D.; Son, H.A.; et al. Molecular surveillance and temporal monitoring of malaria parasites in focal Vietnamese provinces. Malar. J. 2020, 19, 1–7. [Google Scholar] [CrossRef]
  31. Võ, T.C.; Lê, H.G.; Kang, J.-M.; Naw, H.; Fan, C.-K.; Trinh, N.T.M.; Quang, H.H.; Na, B.-K. Molecular surveillance of malaria in the Central Highlands, Vietnam. Parasitol. Int. 2021, 83, 102374. [Google Scholar] [CrossRef]
  32. Phan, G.T.; de Vries, P.J.; Tran, B.Q.; Le, H.Q.; Nguyen, N.V.; Nguyen, T.V.; Heisterkamp, S.H.; Kager, P.A. Artemisinin or chloroquine for blood stage Plasmodium vivax malaria in Vietnam. Trop. Med. Int. Health 2002, 7, 858–864. [Google Scholar] [CrossRef]
  33. Phuc, B.Q.; Rasmussen, C.; Duong, T.T.; Dong, L.T.; Loi, M.A.; Menard, D.; Tarning, J.; Bustos, D.; Ringwald, P.; Galappaththy, G.L.; et al. Treatment failure of dihydroartemisinin/piperaquine for Plasmodium falciparum malaria, Vietnam. Emerg. Infect. Dis. 2017, 23, 715–717. [Google Scholar] [CrossRef] [Green Version]
  34. Ménard, D.; Fidock, D. Accelerated evolution and spread of multidrug-resistant Plasmodium falciparum takes down the latest first-line antimalarial drug in southeast Asia. Lancet Infect. Dis. 2019, 19, 916–917. [Google Scholar] [CrossRef] [Green Version]
  35. Hamilton, W.; Amato, R.; van der Pluijm, R.W.; Jacob, C.G.; Quang, H.H.; Thuy-Nhien, N.T.; Hien, T.T.; Hongvanthong, B.; Chindavongsa, K.; Mayxay, M.; et al. Evolution and expansion of multidrug-resistant malaria in southeast Asia: A genomic epidemiology study. Lancet Infect. Dis. 2019, 19, 943–951. [Google Scholar] [CrossRef]
  36. Snounou, G.; Singh, B. Nested PCR analysis of Plasmodium parasites. Malar. Methods Protoc. 2002, 72, 189–204. [Google Scholar] [CrossRef]
  37. Kang, J.-M.; Cho, P.-Y.; Moe, M.; Lee, J.; Jun, H.; Lee, H.-W.; Ahn, S.K.; Kim, T.I.; Pak, J.H.; Myint, M.K.; et al. Comparison of the diagnostic performance of microscopic examination with nested polymerase chain reaction for optimum malaria diagnosis in Upper Myanmar. Malar. J. 2017, 16, 1–8. [Google Scholar] [CrossRef] [Green Version]
  38. Librado, P.; Rozas, J. DnaSP v5: A software for comprehensive analysis of DNA polymorphism data. Bioinformatics 2009, 25, 1451–1452. [Google Scholar] [CrossRef] [Green Version]
  39. Tamura, K.; Dudley, J.; Nei, M.; Kumar, S. MEGA4: Molecular Evolutionary Genetics Analysis (MEGA) software version 4.0. Mol. Biol. Evol. 2007, 24, 1596–1599. [Google Scholar] [CrossRef]
  40. Nei, M.; Gojobori, T. Simple methods for estimating the numbers of synonymous and nonsynonymous nucleotide substitutions. Mol. Biol. Evol. 1986, 3, 418–426. [Google Scholar] [CrossRef]
  41. Tajima, F. Statistical method for testing the neutral mutation hypothesis by DNA polymorphism. Genetics 1989, 123, 585–595. [Google Scholar] [CrossRef]
  42. Fu, Y.X.; Li, W.-H. Statistical tests of neutrality of mutations. Genetics 1993, 133, 693–709. [Google Scholar] [CrossRef]
  43. Bandelt, H.J.; Forster, P.; Rohl, A. Median-joining networks for inferring intraspecific phylogenies. Mol. Biol. Evol. 1999, 16, 37–48. [Google Scholar] [CrossRef] [PubMed]
  44. Urquiza, M.; Suarez, J.E.; Cardenas, C.; Lopez, R.; Puentes, A.; Chavez, F.; Calvo, J.C.; Patarroyo, M.E. Plasmodium falciparum AMA-1 erythrocyte binding peptides implicate AMA-1 as erythrocyte binding protein. Vaccine 2000, 19, 508–513. [Google Scholar] [CrossRef]
  45. Mehrizi, A.A.; Sepehri, M.; Karimi, F.; Djadid, N.D.; Zakeri, S. Population genetics, sequence diversity and selection in the gene encoding the Plasmodium falciparum apical membrane antigen 1 in clinical isolates from the south-east of Iran. Infect. Genet. Evol. 2013, 17, 51–61. [Google Scholar] [CrossRef] [PubMed]
  46. Bai, T.; Becker, M.; Gupta, A.; Strike, P.; Murphy, V.J.; Anders, R.F.; Batchelor, A.H. Structure of AMA1 from Plasmodium falciparum reveals a clustering of polymorphisms that surround a conserved hydrophobic pocket. Proc. Natl. Acad. Sci. USA 2005, 102, 12736–12741. [Google Scholar] [CrossRef] [Green Version]
  47. Cortés, A.; Mellombo, M.; Mueller, I.; Benet, A.; Reeder, J.C.; Anders, R.F. Geographical structure of diversity and differences between symptomatic and asymptomatic infections for Plasmodium falciparum vaccine candidate AMA1. Infect. Immun. 2003, 71, 1416–1426. [Google Scholar] [CrossRef] [Green Version]
  48. Basu, M.; Maji, A.K.; Mitra, M.; Sengupta, S. Natural selection and population genetic structure of domain-I of Plasmodium falciparum apical membrane antigen-1 in India. Infect. Genet. Evol. 2013, 18, 247–256. [Google Scholar] [CrossRef]
  49. Al-Qahtani, A.A.; Abdel-Muhsin, A.-M.A.; Dajem, S.M.B.; AlSheikh, A.A.H.; Bohol, M.F.F.; Al-Ahdal, M.N.; Putaporntip, C.; Jongwutiwes, S. Comparative sequence analysis of domain I of Plasmodium falciparum apical membrane antigen 1 from Saudi Arabia and worldwide isolates. Infect. Genet. Evol. 2016, 39, 381–388. [Google Scholar] [CrossRef]
  50. Zhu, X.; Zhao, Z.; Feng, Y.; Li, P.; Liu, F.; Liu, J.; Yang, Z.; Yan, G.; Fan, Q.; Cao, Y.; et al. Genetic diversity of the Plasmodium falciparum apical membrane antigen I gene in parasite population from the China–Myanmar border area. Infect. Genet. Evol. 2016, 39, 155–162. [Google Scholar] [CrossRef] [Green Version]
  51. Balloux, F.; Lugon-Moulin, N. The estimation of population differentiation with microsatellite markers. Mol. Ecol. 2002, 11, 155–165. [Google Scholar] [CrossRef] [Green Version]
  52. Kang, J.-M.; Lee, J.-Y.; Cho, P.-Y.; Kim, T.I.; Sohn, W.-M.; Park, J.-W.; Kim, T.-S.; Na, B.-K. Dynamic changes of Plasmodium vivax population structure in South Korea. Infect. Genet. Evol. 2016, 45, 90–94. [Google Scholar] [CrossRef]
  53. Maneerattanasak, S.; Gosi, P.; Krudsood, S.; Tongshoob, J.; Lanteri, C.A.; Snounou, G.; Khusmith, S. Genetic diversity among Plasmodium vivax isolates along the Thai–Myanmar border of Thailand. Malar. J. 2016, 15, 1–8. [Google Scholar] [CrossRef] [Green Version]
  54. Huang, B.; Tuo, F.; Liang, Y.; Wu, W.; Wu, G.; Huang, S.; Zhong, Q.; Su, X.Z.; Zhang, H.; Li, M.; et al. Temporal changes in genetic diversity of msp-1, msp-2, and msp-3 in Plasmodium falciparum isolates from Grande Comore Island after introduction of ACT. Malar. J. 2018, 17, 1–14. [Google Scholar] [CrossRef]
  55. Ngomo, J.N.; M’Bondoukwe, N.P.; Yavo, W.; Mavoungou, L.B.; Bouyou-Akotet, M.K.; Mawili-Mboumba, D.P. Spatial and temporal distribution of Pfmsp1 and Pfmsp2 alleles and genetic profile change of Plasmodium falciparum populations in Gabon. Acta Trop. 2018, 178, 27–33. [Google Scholar] [CrossRef]
  56. Lê, H.G.; Kang, J.-M.; Jun, H.; Lee, J.-Y.; Thái, T.L.; Myint, M.K.; Aye, K.S.; Sohn, W.-M.; Shin, H.-J.; Kim, T.-S.; et al. Changing pattern of the genetic diversities of Plasmodium falciparum merozoite surface protein-1 and merozoite surface protein-2 in Myanmar isolates. Malar. J. 2019, 18, 1–13. [Google Scholar] [CrossRef] [PubMed]
  57. Eisen, D.P.; Marshall, V.M.; Billman-Jacobe, H.; Coppel, R.L. A Plasmodium falciparum apical membrane antigen-1 (AMA-1) gene apparently generated by intragenic recombination. Mol. Biochem. Parasitol. 1999, 100, 243–246. [Google Scholar] [CrossRef]
  58. Garg, S.; Alam, M.T.; Das, M.K.; Dev, V.; Kumar, A.; Dash, A.P.; Sharma, Y.D. Sequence diversity and natural selection at domain I of the apical membrane antigen 1 among Indian Plasmodium falciparum populations. Malar. J. 2007, 6, 154. [Google Scholar] [CrossRef] [Green Version]
  59. Coley, A.M.; Parisi, K.; Masciantonio, R.; Hoeck, J.; Casey, J.L.; Murphy, V.J.; Harris, K.S.; Batchelor, A.H.; Anders, R.F.; Foley, M. The most polymorphic residue on Plasmodium falciparum apical membrane antigen 1 determines binding of an invasion-inhibitory antibody. Infect. Immun. 2006, 74, 2628–2636. [Google Scholar] [CrossRef] [PubMed] [Green Version]
  60. Coley, A.M.; Gupta, A.; Murphy, V.J.; Bai, T.; Kim, H.; Anders, R.F.; Foley, M.; Batchelor, A.H. Structure of the malaria antigen AMA1 in complex with a growth-inhibitory antibody. PLoS Pathog. 2007, 3, e138-19. [Google Scholar] [CrossRef] [PubMed] [Green Version]
  61. Dutta, S.; Lee, S.Y.; Batchelor, A.H.; Lanar, D.E. Structural basis of antigenic escape of a malaria vaccine candidate. Proc. Natl. Acad. Sci. USA 2007, 104, 12488–12493. [Google Scholar] [CrossRef] [Green Version]
  62. Harris, K.S.; Adda, C.G.; Khore, M.; Drew, D.R.; Valentini-Gatt, A.; Fowkes, F.J.I.; Beeson, J.G.; Dutta, S.; Anders, R.F.; Foley, M. Use of immunodampening to overcome diversity in the malarial vaccine candidate apical membrane antigen 1. Infect. Immun. 2014, 82, 4707–4717. [Google Scholar] [CrossRef] [Green Version]
  63. Collins, C.R.; Withers-Martinez, C.; Bentley, G.A.; Batchelor, A.H.; Thomas, A.W.; Blackman, M.J. Fine mapping of an epitope recognized by an invasion-inhibitory monoclonal antibody on the malaria vaccine candidate apical membrane antigen 1. J. Biol. Chem. 2007, 282, 7431–7441. [Google Scholar] [CrossRef] [PubMed] [Green Version]
Figure 1. Map of the blood collection sites. Blood samples were collected from P. falciparum-infected patients who resided in Dak Lak Province of the Central Highlands, Vietnam in 2019. The Central Highlands region and Dak Lak Province are colored with green and red, respectively.
Genes 12 01903 g001
Figure 2. Amino acid sequence polymorphisms in the Vietnamese pfama-1. A total of 131 pfama-1 sequences were obtained from 135 Vietnamese P. falciparum isolates. Sequence analysis of the sequences revealed that 64 non-synonymous SNPs were detected in Vietnamese pfama-1; resulting amino acid changes at 52 positions compared to pfama-1 of 3D7 (GenBank Accession No: U65407). Most amino acid changes were identified in domains I, II, and III. Identical amino acid residues with 3D7 sequences were indicated by dots. Based on these amino acid polymorphisms, Vietnamese pfama-1 classified into 37 distinct haplotypes. These amino acid changes were unevenly scattered in each Vietnamese pfama-1 haplotype. However, few amino acid changes were commonly identified in Vietnamese pfama-1 with high frequencies. Conserved amino acid change identified in all Vietnamese pfama-1 are marked as red. Tri-morphic amino acid changes (H200D/L, E267P/Q, and C320G/W) are presented as green. Penta-morphic amino acid changes (E197D/G/Q/V) are marked as blue. Domains I, II, and III are highlighted as shading with different colors, red, yellow, and blue, respectively.
Genes 12 01903 g002
Figure 3. Summary of amino acid polymorphisms of pfama-1 observed in global P. falciparum isolates. Positions and frequencies of amino acid changes detected in global pfama-1 were compared. Each domain is highligthed by distinct colors: domain I (red); domain II (yellow); and domain III (blue). Overall patterns of amino acid changes detected in global pfama-1 were similar, but frequencies of each amino acid change differed by country. Some amino acid changes were characterized by country or continent. PNG, Papua New Guinea; SI, Solomon Islands. Heatmap was generated using Morpheus (https://software.broadinstitute.org/morpheus/; accessed on 16 November 2021). The global patterns except Vietnamese pfama-1 have been analyzed previously [25], and the previous data were applied to analyze overall patterns.
Genes 12 01903 g003
Figure 4. Nucleotide diversity and natural selection of Vietnamese pfama-1. (a) Nucleotide diversity. Sliding window plot showed nucleotide diversity (π) values across Vietnamese pfama-1 sequences. A window size of 100 bp and a step size of 25 bp were applied. (b) Natural selection. Sliding window plot of Tajima’s D was analyzed for Vietnamese pfama-1. A window size of 100 and a step size of 25 were applied. DI, domain I; DII, domain II; DIII, domain III.
Genes 12 01903 g004
Figure 5. Nucleotide diversity and natural selection of global pfama-1. (a) Nucleotide diversity. Sliding window plot showed nucleotide diversity (π) values across global pfama-1 sequences. A window size of 100 bp and a step size of 25 bp were applied. The cluster 1 of loop I (C1-L) region, which is located on the π peak of domain I, is marked with a black line. (b) Natural selection. Sliding window of Tajima’s D was analyzed for global pfama-1. A window size of 100 and a step size of 25 were applied. The patterns of π and Tajima’s D of pfama-1 from each county are represented with different colors. DI, domain I; DII, domain II; DIII, domain III. PNG, Papua New Guinea; SI, Solomon Islands. The global patterns except Vietnamese pfama-1 have been analyzed previously [25], and the previous data were applied to analyze overall patterns.
Genes 12 01903 g005
Figure 6. Recombination event in global pfama-1. Linkage disequilibrium (LD) plot suggested non-random associations between nucleotide variations in pfama-1 at different polymorphic sites. R2 values were plotted against nucleotide distance using a two-tailed Fisher’s exact test for statistical significance. PNG, Papua New Guinea. The global patterns except Vietnamese pfama-1 have been analyzed previously [25], and the previous data were applied to analyze overall patterns.
Genes 12 01903 g006
Figure 7. Network analysis of global pfama-1 haplotypes. Haplotype network was constructed using the program PopART version 1.7 with the Median Joining algorithm. A total of 648 global pfama-1 sequences were analyzed. The size of each node indicates the frequency of a particular haplotype. The lengths of the lines connecting the nodes are in proportion to the number of base pair substitutions separating the haplotypes. Color of each node indicates each country.
Genes 12 01903 g007
Figure 8. Association between natural selection and host immune pressure. (a) Positions of amino acid changes detected in global pfama-1 and predicted B-cell epitopes, RBC-binding regions, and IUR regions. Predicted B-cell epitopes, RBC-binding regions [44], and IUR regions [45] are represented by blue boxes, red boxes, and green boxes, respectively. Polymorphic amino acid residues commonly detected in global pfama-1 are marked as bold red. The less commonly detected amino acid changes are shown as bold blue. The C1-L (cluster 1 of loop I, aa: 196–207) in DI, and the loop II (aa: 348–392) in DII are marked with yellow and sky-blue squares, respectively. (b) Nucleotide diversity and natural selection analysis. Nucleotide diversity (π) and Tajima’s D (TD) values for each B-cell epitope region, RBC-binding region, and IUR region in global pfama-1 were analyzed using DnaSP program. PNG, Papua New Guinea; SI, Solomon Islands. The global patterns except Vietnamese pfama-1 have been analyzed previously [25], and the previous data were applied to analyze overall patterns.
Genes 12 01903 g008
Table 1. Estimates of DNA sequence polymorphism, and tests of neutrality at pfama-1 among P. falciparum Vietnam isolates.
FragmentSegregating Sites (S)Singleton Variable
Sites
Parsimony
Informative Sites
Total No.
of
Mutations
KHHd ± SDπ ± SDdN−dSTajima’s D
5′-Terminal21129210.485200.358 ± 0.0550.0011 ± 0.0002−0.0018−2.4673
(p < 0.01)
Domain I411229424.198300.575 ± 0.0520.0091 ± 0.00140.0084−1.3889
(p > 0.1)
Domain II17413180.915210.465 ± 0.0530.0031 ± 0.00040.0020−1.9940
(p < 0.05)
Domain III1459141.526160.455 ± 0.0530.0076 ± 0.0012−0.0003−1.0724
(p > 0.1)
3′-Terminal1495140.772170.432 ± 0.0530.0023 ± 0.0003−0.0052−1.8470
(p < 0.05)
Full11447671168.062730.837 ± 0.0340.0043 ± 0.00060.0009−2.0046
(p < 0.05)
S, positions which show differences (polymorphisms) between related genes; singleton variable sites, sites contain at least two types of nucleotides and occur multiple times; parsimony informative sites, sites contain at least two types of nucleotides but only two of them occur with a minimum frequency of two; K, average number of pair-wise nucleotide differences; H, number of haplotypes; Hd, haplotype diversity; π, observed average pair-wise nucleotide diversity; dN, rate of non-synonymous mutations; dS, rate of synonymous mutations.
Table 2. Estimates of DNA sequence polymorphism and tests of neutrality at pfama-1 among global P. falciparum.
IsolatesSegregating Sites (S)Singleton Variable SitesParsimony
Informative Sites
Total No.
of
Mutations
KHHd ± SDπ ± SDdN/dSTajima’s DFu and Li’s
D
Fu and Li’s
F
Vietnam
(n = 131)
11447671168.062730.837 ± 0.0340.0043 ± 0.00061.250−2.0046
(p < 0.05)
−3.1913
(p < 0.05)
−3.1959
(p < 0.02)
Myanmar #
(n = 58)
7816627919.886370.948 ± 0.0190.0106 ± 0.00056.5240.5719
(p > 0.1)
0.1677
(p > 0.1)
0.3851
(p > 0.1)
Thailand #
(n = 80)
585536120.621210.920 ± 0.0130.0110 ± 0.00026.6982.2222
(p < 0.05)
0.9572
(p > 0.1)
1.7516
(p < 0.05)
Philippines #
(n = 55)
613586221.232190.916 ± 0.0190.0114 ± 0.00037.2001.9545
(0.1 > p > 0.05)
1.6123
(p < 0.05)
2.07960
(p < 0.02)
PNG #
(n = 90)
682667522.923280.954 ± 0.0070.0123 ± 0.00027.4971.8082
(0.1 > p > 0.05)
1.6759
(p < 0.05)
2.0760
(p < 0.02)
Solomon
Islands #
(n = 50)
563535722.04490.862 ± 0.0210.0118 ± 0.00037.0232.5455
(p < 0.05)
1.5447
(p < 0.05)
2.2804
(p < 0.02)
Vanuatu #
(n = 85)
506445018.90550.633 ± 0.0280.0101 ± 0.00036.4712.8973
(p < 0.01)
0.8642
(p > 0.1)
2.0039
(p < 0.05)
Ghana #
(n = 37)
757688526.261320.992 ± 0.0080.0141 ± 0.00037.4231.0674
(p > 0.1)
1.2179
(p > 0.1)
1.38500
(p > 0.1)
Tanzania #
(n = 62)
818738925.444470.989 ± 0.0050.0136 ± 0.00028.1351.1819
(p > 0.1)
1.1635
(p > 0.1)
1.4020
(p > 0.1)
K, average number of pair-wise nucleotide differences; H, number of haplotypes; Hd, haplotype diversity; π, observed average pair-wise nucleotide diversity; dN, rate of non-synonymous mutations; dS, rate of synonymous mutations. # Cited from [25].
Table 3. Comparison of recombination events between global pfama-1.
nRaRbRm
Vietnam1310.00000.00120
Myanmar #780.014126.324
Thailand #380.024345.320
Philippines #610.021840.817
PNG #680.050093.428
Solomon Islands #560.012022.514
Vanuatu #500.00101.89
Ghana #750.092117227
Tanzania #810.091517128
The R and Rm were estimated excluding the sites containing alignment gaps or those segregating for three nucleotides. The R was computed using R = 4Nr, where N is the population size, and r is the recombination rate per sequence (per gene). n, number of sequences analyzed; Ra, recombination parameter between adjacent sites; Rb, recombination parameter for entire gene; Rm, minimum number of recombination events between adjacent sites. # Cited from [25].
Table 4. Pair-wise FST estimates for global pfama-1.
VietnamMyanmar #Thailand #Philippines #PNG #SI #Vanuatu #Ghana #Tanzania #
Vietnam 11.5676712.8240811.9567914.1141111.9248012.3293412.0705413.64608
Myanmar #0.40780 20.1579820.3529521.5887820.6880519.1542522.1449720.15798
Thailand #0.378810.06073 20.8701821.8395921.1684619.7372622.4048122.72679
Philippines #0.413820.083900.03818 22.2814621.6188819.8195023.2548323.46398
PNG #0.373430.052810.038180.02319 22.6088420.9713523.8952825.95093
SI #0.420090.096050.066360.035290.03529 20.0678323.8375923.92600
Vanuatu #0.405510.097400.105350.066890.066890.04933 21.1362221.66300
Ghana #0.379550.078020.041400.041670.036400.049530.12425 25.74924
Tanzania #0.399340.081390.058650.057870.036620.057820.141410.00019
FST values are represented in the lower left quadrant, and average number of pair-wise nucleotide differences between populations (K) are shown in the upper right quadrant. FST, a measure of genetic differentiation between populations (range from 0 to +1). PNG, Papua New Guinea; SI, Solomon Islands. # Cited from [25].
Publisher’s Note: MDPI stays neutral with regard to jurisdictional claims in published maps and institutional affiliations.

