Article

Transcriptomics Analysis of Lens from Patients with Posterior Subcapsular Congenital Cataract

Department of Ophthalmology, Eye & ENT Hospital, Shanghai Medical College, Fudan University, Shanghai 200031, China
*
Author to whom correspondence should be addressed.
Genes 2021, 12(12), 1904; https://doi.org/10.3390/genes12121904
Submission received: 20 October 2021 / Revised: 19 November 2021 / Accepted: 26 November 2021 / Published: 27 November 2021
(This article belongs to the Section Human Genomics and Genetic Diseases)

Abstract

:
To gain insight into the aetiology of posterior subcapsular congenital cataract from the perspective of transcriptional changes, we conducted an mRNA sequencing analysis of the lenses in posterior subcapsular congenital cataract patients and in normal children. There were 1533 differentially expressed genes from 19,072 genes in the lens epithelial cells of the posterior subcapsular congenital cataract patients compared to in the normal controls at a cut-off criteria of |log2 fold change| of >1 and a p-value of <0.05, including 847 downregulated genes and 686 upregulated genes. To further narrow down the DEGs, we utilised the stricter criteria of |log2 fold change| of >1 and an FDR value of <0.05, and we identified 551 DEGs, including 97 upregulated genes and 454 downregulated genes. This study also identified 1263 differentially expressed genes of the 18,755 genes in lens cortex and nuclear fibres, including 646 downregulated genes and 617 upregulated genes. The downregulated genes in epithelial cells were significantly enriched in the structural constituent of lenses, lens development and lens fibre cell differentiation. After filtering the DEGs using the databases iSyTE and Cat-Map, several high-priority candidate genes related to posterior subcapsular congenital cataract such as GRIFIN, HTRA1 and DAPL1 were identified. The findings of our study may provide a deeper understanding of the mechanisms of posterior subcapsular congenital cataract and help in the prevention and treatment of this disease.

1. Introduction

Congenital cataract is the crystalline lens opacification that is present at birth or early childhood [1]. It is derived from changes during embryonic development and leads to significant visual impairment [2]. Congenital cataract is responsible for 5–20% of preventable blindness in children, and the prevalence of congenital cataract is the highest in Asia (7.43/10,000) compared with in other regions of the world [3]. Preventing and treating congenital cataract without delay is paramount in alleviating the sufferings of patients and their families and societies.
Previous studies have found that congenital cataracts can be caused by inherited gene mutations or intrauterine diseases, such as infectious, metabolic or drug-induced complications during pregnancy. However, as the pathogenic mechanisms of congenital cataract remain unclear, about 50% of bilateral congenital cataracts and almost all unilateral congenital cataracts have no identified cause and are diagnosed as idiopathic congenital cataract [3,4]. The prevention and early treatment of these idiopathic congenital cataracts are difficult.
The gene expression information of the specific tissue is critical to detect candidate genes associated with developmental defects [5,6,7]. High-throughput mRNA sequencing analysis can represent transcripts of all the transcribed genes of a given tissue, which is crucial to study the mechanisms of congenital cataract. Comparing the expression levels of genes in different congenital cataract patients with normal controls helps in the detection of transcriptional changes and clarifies the pathogenesis of congenital cataract. However, research on the transcripts of crystalline lens in congenital cataract patients is rarely addressed.
Previous studies have suggested that the morphology of cataract may be a predictor of visual prognosis [8]. There is great variability in visual outcomes in different congenital cataract patients after surgery. Patients with a greater density of cataract in the central visual axis at a younger age often have more severe stimulus deprivation amblyopia, which results in poorer vision [8]. While the pathogenesis of different types of congenital cataracts is still uncertain, the posterior subcapsular congenital cataract is one of the most common types and has a great effect on visual acuity [3].
In this study, we attempt to explain the pathogenesis of posterior subcapsular congenital cataract from the perspective of transcriptional changes. The transcriptome approach is used in the present study to compare the mRNA expression in patients having posterior subcapsular congenital cataract with that in normal children. The findings of our study may provide researchers with a deeper understanding of the mechanisms of posterior subcapsular congenital cataract and help in the prevention and treatment of this disease.

2. Materials and Methods

2.1. Subjects

This study was conducted adhering to the tenets of the Helsinki Declaration and was approved by the Investigational Review Board of the Eye and ENT Hospital of Fudan University (protocol code: 2020076; date of approval: August 2020), Shanghai, China. Informed consent was obtained from the guardians of participants. Patients with bilateral or unilateral posterior subcapsular congenital cataracts under 10 years of age were included in the study. For children with posterior subcapsular congenital cataract, the exclusion criteria were as follows: ocular inflammation, persistent fetal vasculature (PFV), persistent hyperplastic primary vitreous (PHPV), pre-existing posterior capsule defect, combined other developmental disorder or a history of ocular surgery or trauma. The normal controls included transparent lenses from children younger than 10 years of age.
Anterior lens capsules and the cortical and nuclear fibres of 6 congenital cataract patients were obtained during their cataract surgery by manual continuous curvilinear capsulorhexis and cataract aspiration by the same surgeon (Y.L.). The materials of 8 normal controls were obtained from the Eye Bank of the Eye and ENT Hospital of Fudan University within 24 h post-mortem. The anterior lens capsules were gently torn using micro-forceps after being cut with a blunt-tipped Vannas scissors; the cortical and nuclear fibres of lenses were also collected.
To further verify the results of RNA sequencing (RNA-seq), another 24 posterior subcapsular congenital cataract patients (age: 4–110 months) and 17 normal controls (age: 19 days–84 months) were enrolled in the study, and the materials were obtained using the same method described above.

2.2. RNA Extracting, Library Construction and RNA-seq

Total RNA was extracted from the anterior lens capsules using the Quick-RNA™ Microprep Kit (Zymo Research, Orange, CA, USA), in accordance with the manufacturer’s protocol. The concentration of total RNA was measured with Qubit 4.0 (Thermo Fisher Scientific, Waltham, MA, USA). The RNA quality was analysed using agarose gel electrophoresis. The amplification products of full-length complementary DNA (cDNA) were obtained using the Single Cell Full Length mRNA-Amplification Kit (N712-01, Vazyme, Nanjing, China). The mRNA was purified using Oligo (dT) VN Primer (Vazyme, Nanjing, China). Complementary DNA was produced via reverse transcription. The full-length cDNA was amplified by PCR under the following conditions: 98 °C for 1 min, 14–24 cycles of 98 °C for 10 s, 65 °C for 15 s and 72 °C for 6 min; followed by 72 °C for 5 min; 4 °C hold. The cDNA quality was analysed using the Agilent 2100 Bioanalyzer (Agilent Technologies, Santa Clara, CA, USA).
The TruePrep® DNA Library Prep Kit v2 for Illumina (TD502, Vazyme, Nanjing, China) was used to construct the cDNA libraries. In brief, 5 μL TTE (Vazyme, Nanjing, China) mix V50, 4 μL 5 × TTBL, 15 ng cDNA, and ddH2O up to 20 ul were mixed and blended. The cDNA was fragmented following PCR conditions: 55 °C for 10 min; 10 °C hold. The reaction was stopped by incubating with 5 μL 5 × TS for 5 min at room temperature. PCR was performed after adding 25 μL cDNA, 5 μL 5 × TAB, 5 μL N5XX primer, 5 μL N7XX primer, 4 μL ddH2O (Vazyme, Nanjing, China), and 1 μL TAE (Vazyme, Nanjing, China) under the following conditions: 72 °C for 3 min; 98 °C for 30 s; and 14 cycles of 98 °C for 15 s, 60 °C for 30 s and 72 °C for 3 min; followed by 72 °C 5 min; 4 °C hold. The quality of the PCR products was analysed using 2% agarose gel electrophoresis (Thermo Fisher Scientific, Waltham, MA, USA), and the libraries were purified using DNA Clean Beads (Vazyme, Nanjing, China) and were sequenced using the Illumina Nova6000 platform (Illumina, San Diego, CA, USA).

2.3. Gene Expression Data Analysis

All reads were mapped to GRCh38 using the STAR software (version 2.5.3a). For all samples, String Tie software (version 1.3.1c) was used to count the original sequence counts of known genes, and the expression levels of known genes were quantile-normalised using the fragments per kilobase of transcript per million fragments mapped (FPKM) value for further analysis. Differentially expressed genes (DEG) between different sample groups were screened using the DESeq2 software (version 1.16.1).
Functional annotation and clustering analysis were performed on all DEGs by gene ontology (GO) and Kyoto Encyclopaedia of Genes and Genomes (KEGG) analysis. The GO enrichment analysis was used to identify the main biological functions of DEGs via the TopGO software (version 2.42.0), and the KEGG pathway database helped to confirm the information on how molecules or genes are networked (http://www.genome.jp, accessed on 23 January 2021). Dynamic RNA expression data for DEGs in mouse lens during embryonic development were obtained from the iSyTE database as described previously [5,6].
Protein–protein interaction (PPI) networks for differentially expressed proteins were also analysed using the Search Tool for the Retrieval of Interacting Genes (STRING) database (http://string-db.org, accessed on 21 January 2021) [9].

2.4. Real-time Quantitative PCR (RT-qPCR)

The expression of DEGs identified by RNA-seq analysis was validated using quantitative reverse transcription PCR (RT-qPCR). Total RNA was isolated from the anterior lens capsules and cortex using TRIzol reagent (Invitrogen, Waltham, MA, USA). It was then used to synthesise cDNA using PrimeScript™ RT reagent Kit with gDNA Eraser (TaKaRa, Tokyo, Japan), followed by RT-PCR using SYBR® Green Premix Pro Taq HS qPCR Kit (AG11705, Accurate Biotechnology, Changsha, China) on Bio-Rad CFX96 Touch Real-Time PCR Detection System and software v4.1 (Bio-Rad, Hercules, CA, USA). The gene-specific primers for RT-qPCR are shown in Table 1. The results were analysed using the 2−ΔΔCt method as described previously [10].

2.5. Immunohistochemical Staining

After fixation overnight, the whole lens of the normal controls from the Eye Bank were embedded in paraffin and then cut into 3 μm-thick sections. The sections were deparaffinised and rehydrated; subsequently, the sections were treated with sodium citrate buffer (pH 6.0) for antigen retrieval and incubated in 3% hydrogen peroxide for 15 min at room temperature to block endogenous peroxidase. After blocking, the sections were incubated in HTRA1 primary antibodies (1:200) at 4 °C overnight. Immunodetection was performed using DAB substrate liquid (Thermo Fisher Scientific, Waltham, MA, USA). Then, the sections were counterstained with haematoxylin and observed with the same microscope (Leica, Wetzlar, Germany).

2.6. Statistical Analysis

Differential expression statistics were assessed using DESeq2, and the adjusted p-values which were the false discovery rates (FDRs) were obtained using the Benjamini–Hochberg multiple test correction method. The genes with |log2 fold change|of >1 and a p-value of <0.05 were defined as a DEG between the two groups. The GO terms and the KEGG pathway with p-values less than 0.05 were considered to be significantly enriched. Statistical analyses for age and RT-qPCR results were performed using SPSS 22.0 (IBM, Armonk, NY, USA). The Kolmogorov–Smirnov test was used for normality distribution. An independent sample t test or Mann–Whitney U test was performed to analyse the difference between the posterior subcapsular congenital cataract patients and the normal control group. p-values less than 0.05 were considered statistically significant.

3. Results

A total of 14 children were included in the study for RNA-seq, of which 6 patients had posterior subcapsular congenital cataracts (4 bilateral and 2 unilateral; age: 51–108 months) and 8 normal controls (age: 2–96 months). All the congenital cataract patients were non-syndromic and had a negative family history. An average of 110,375,304 (79,150,688–167,149,114) raw reads was yielded per sample. After the data were filtered, each sample generated an average of 53,416,765 (23,475,256–113,734,102) reads (Table 2). The percentage of the aligned reads to GRCh38 ranged from 79.1% to 97.9%. The results showed good sequence quality.

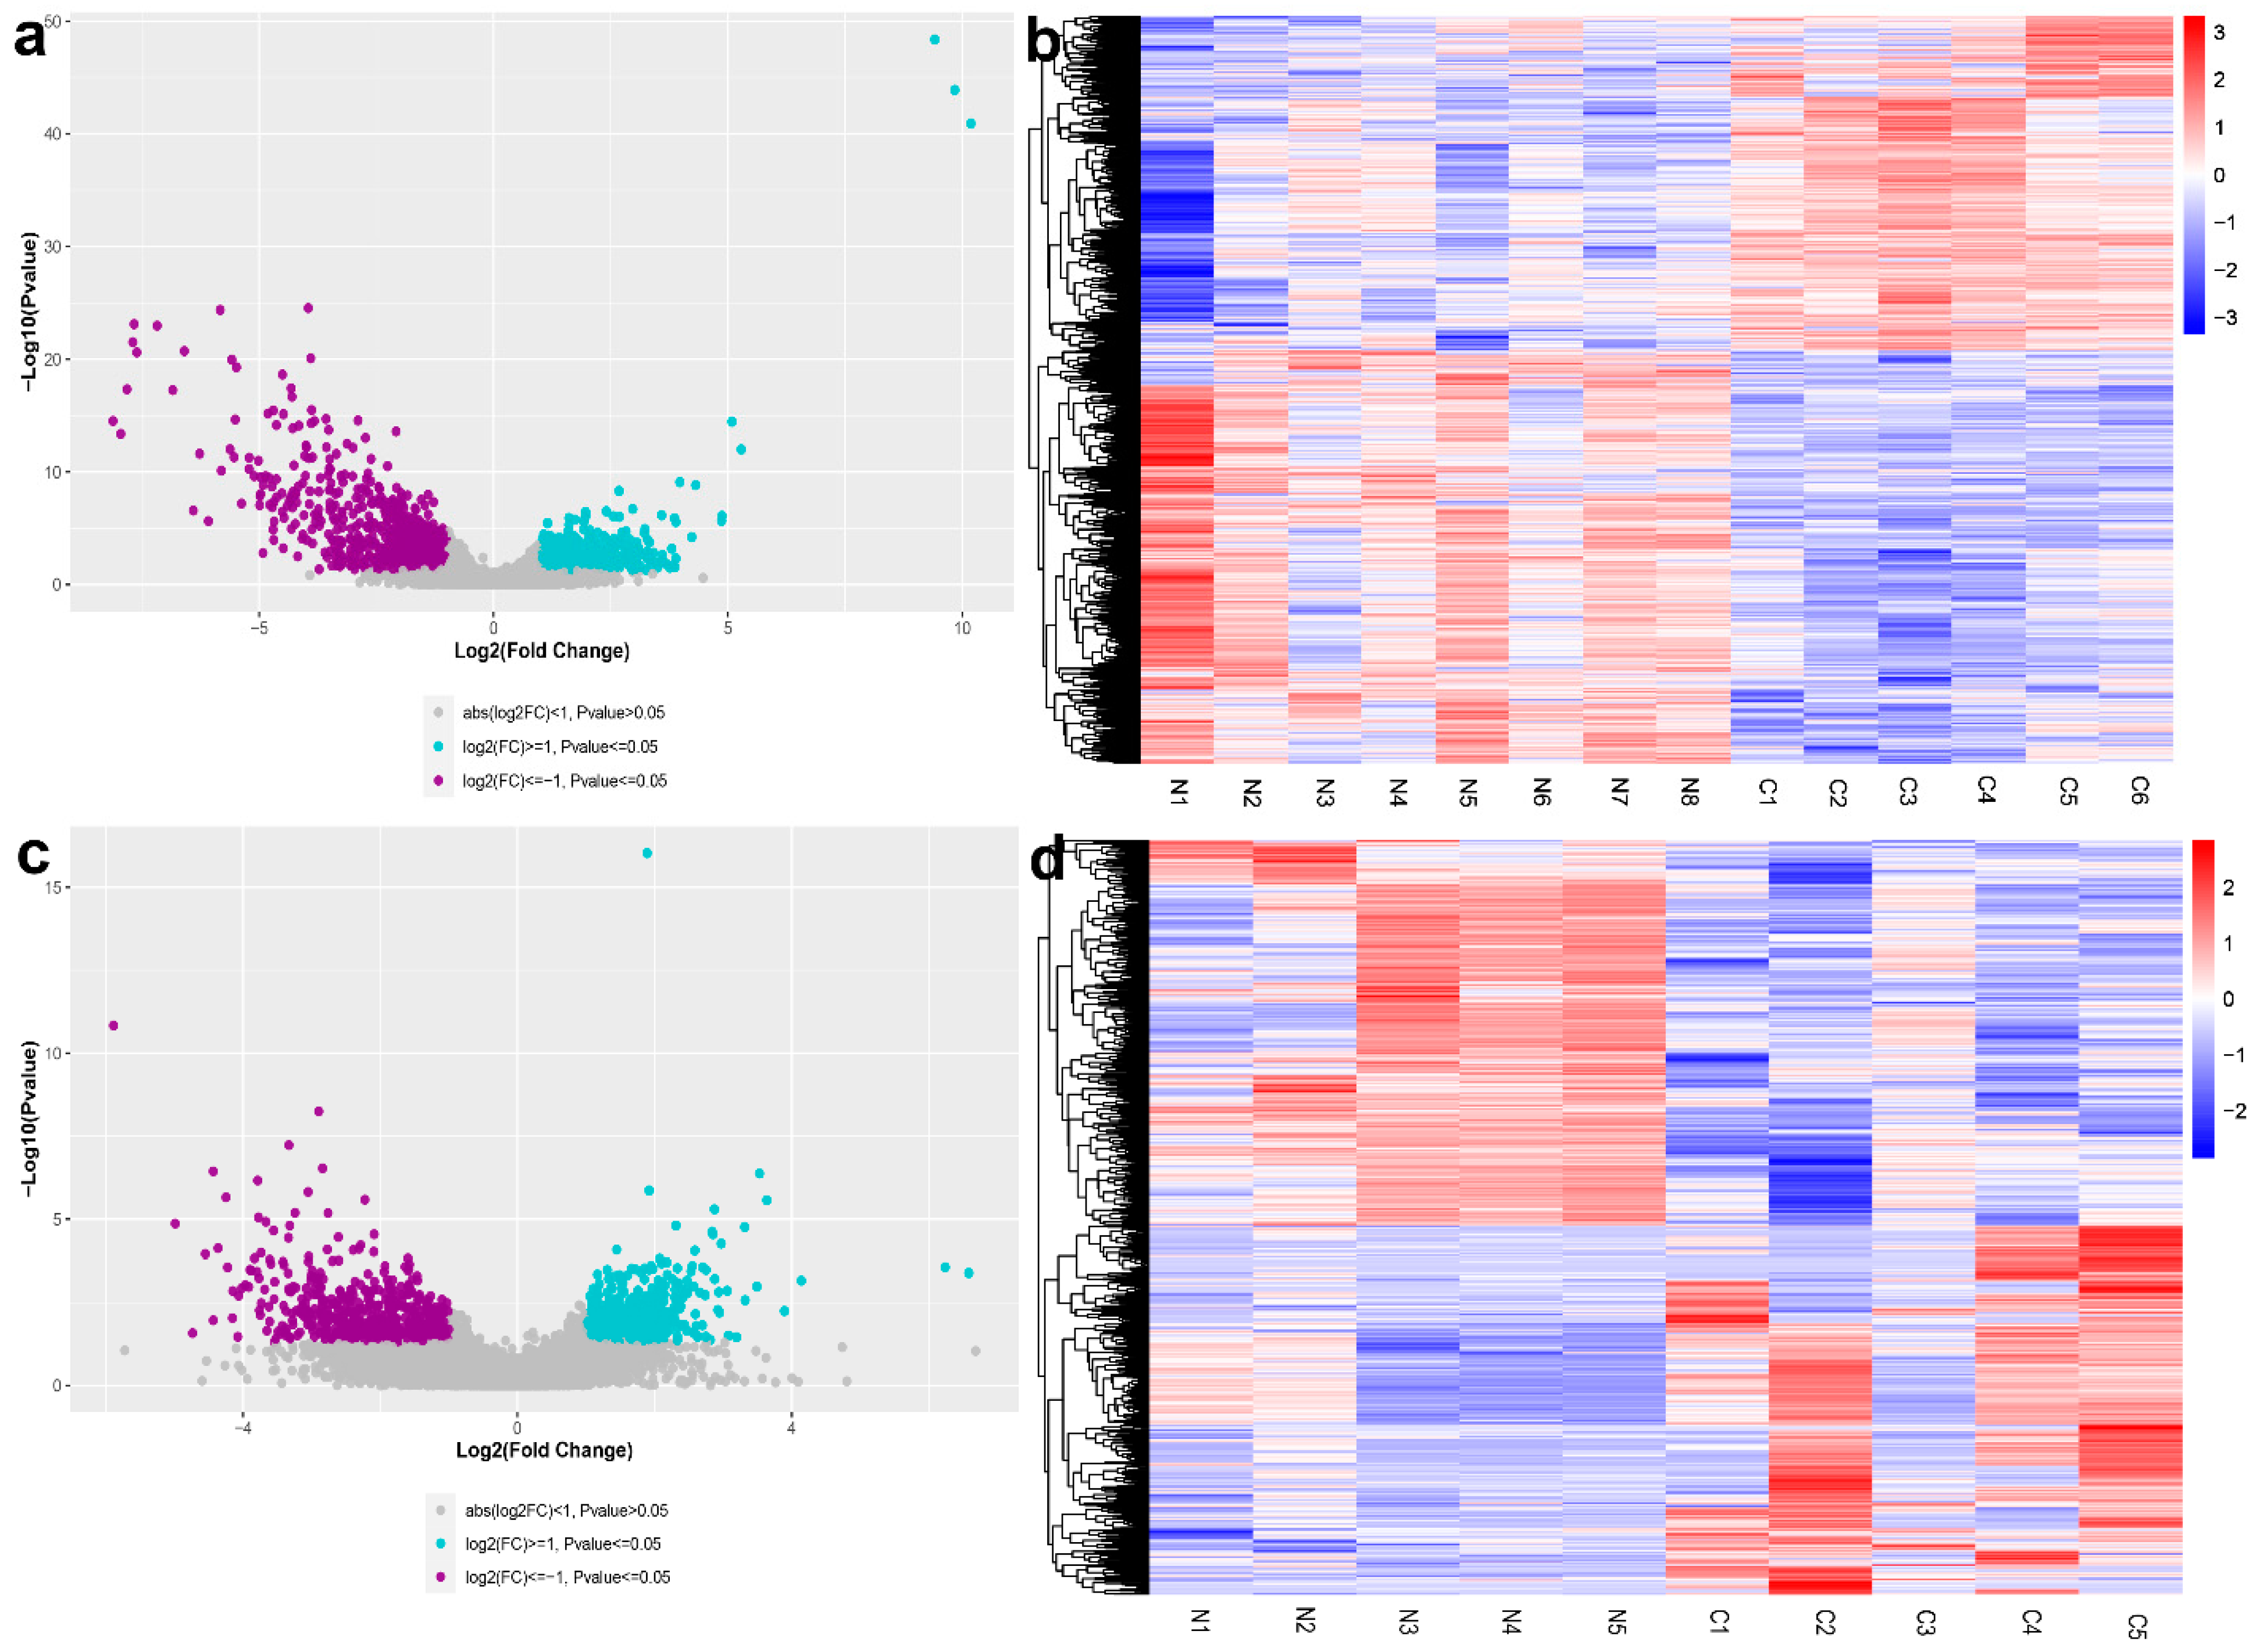
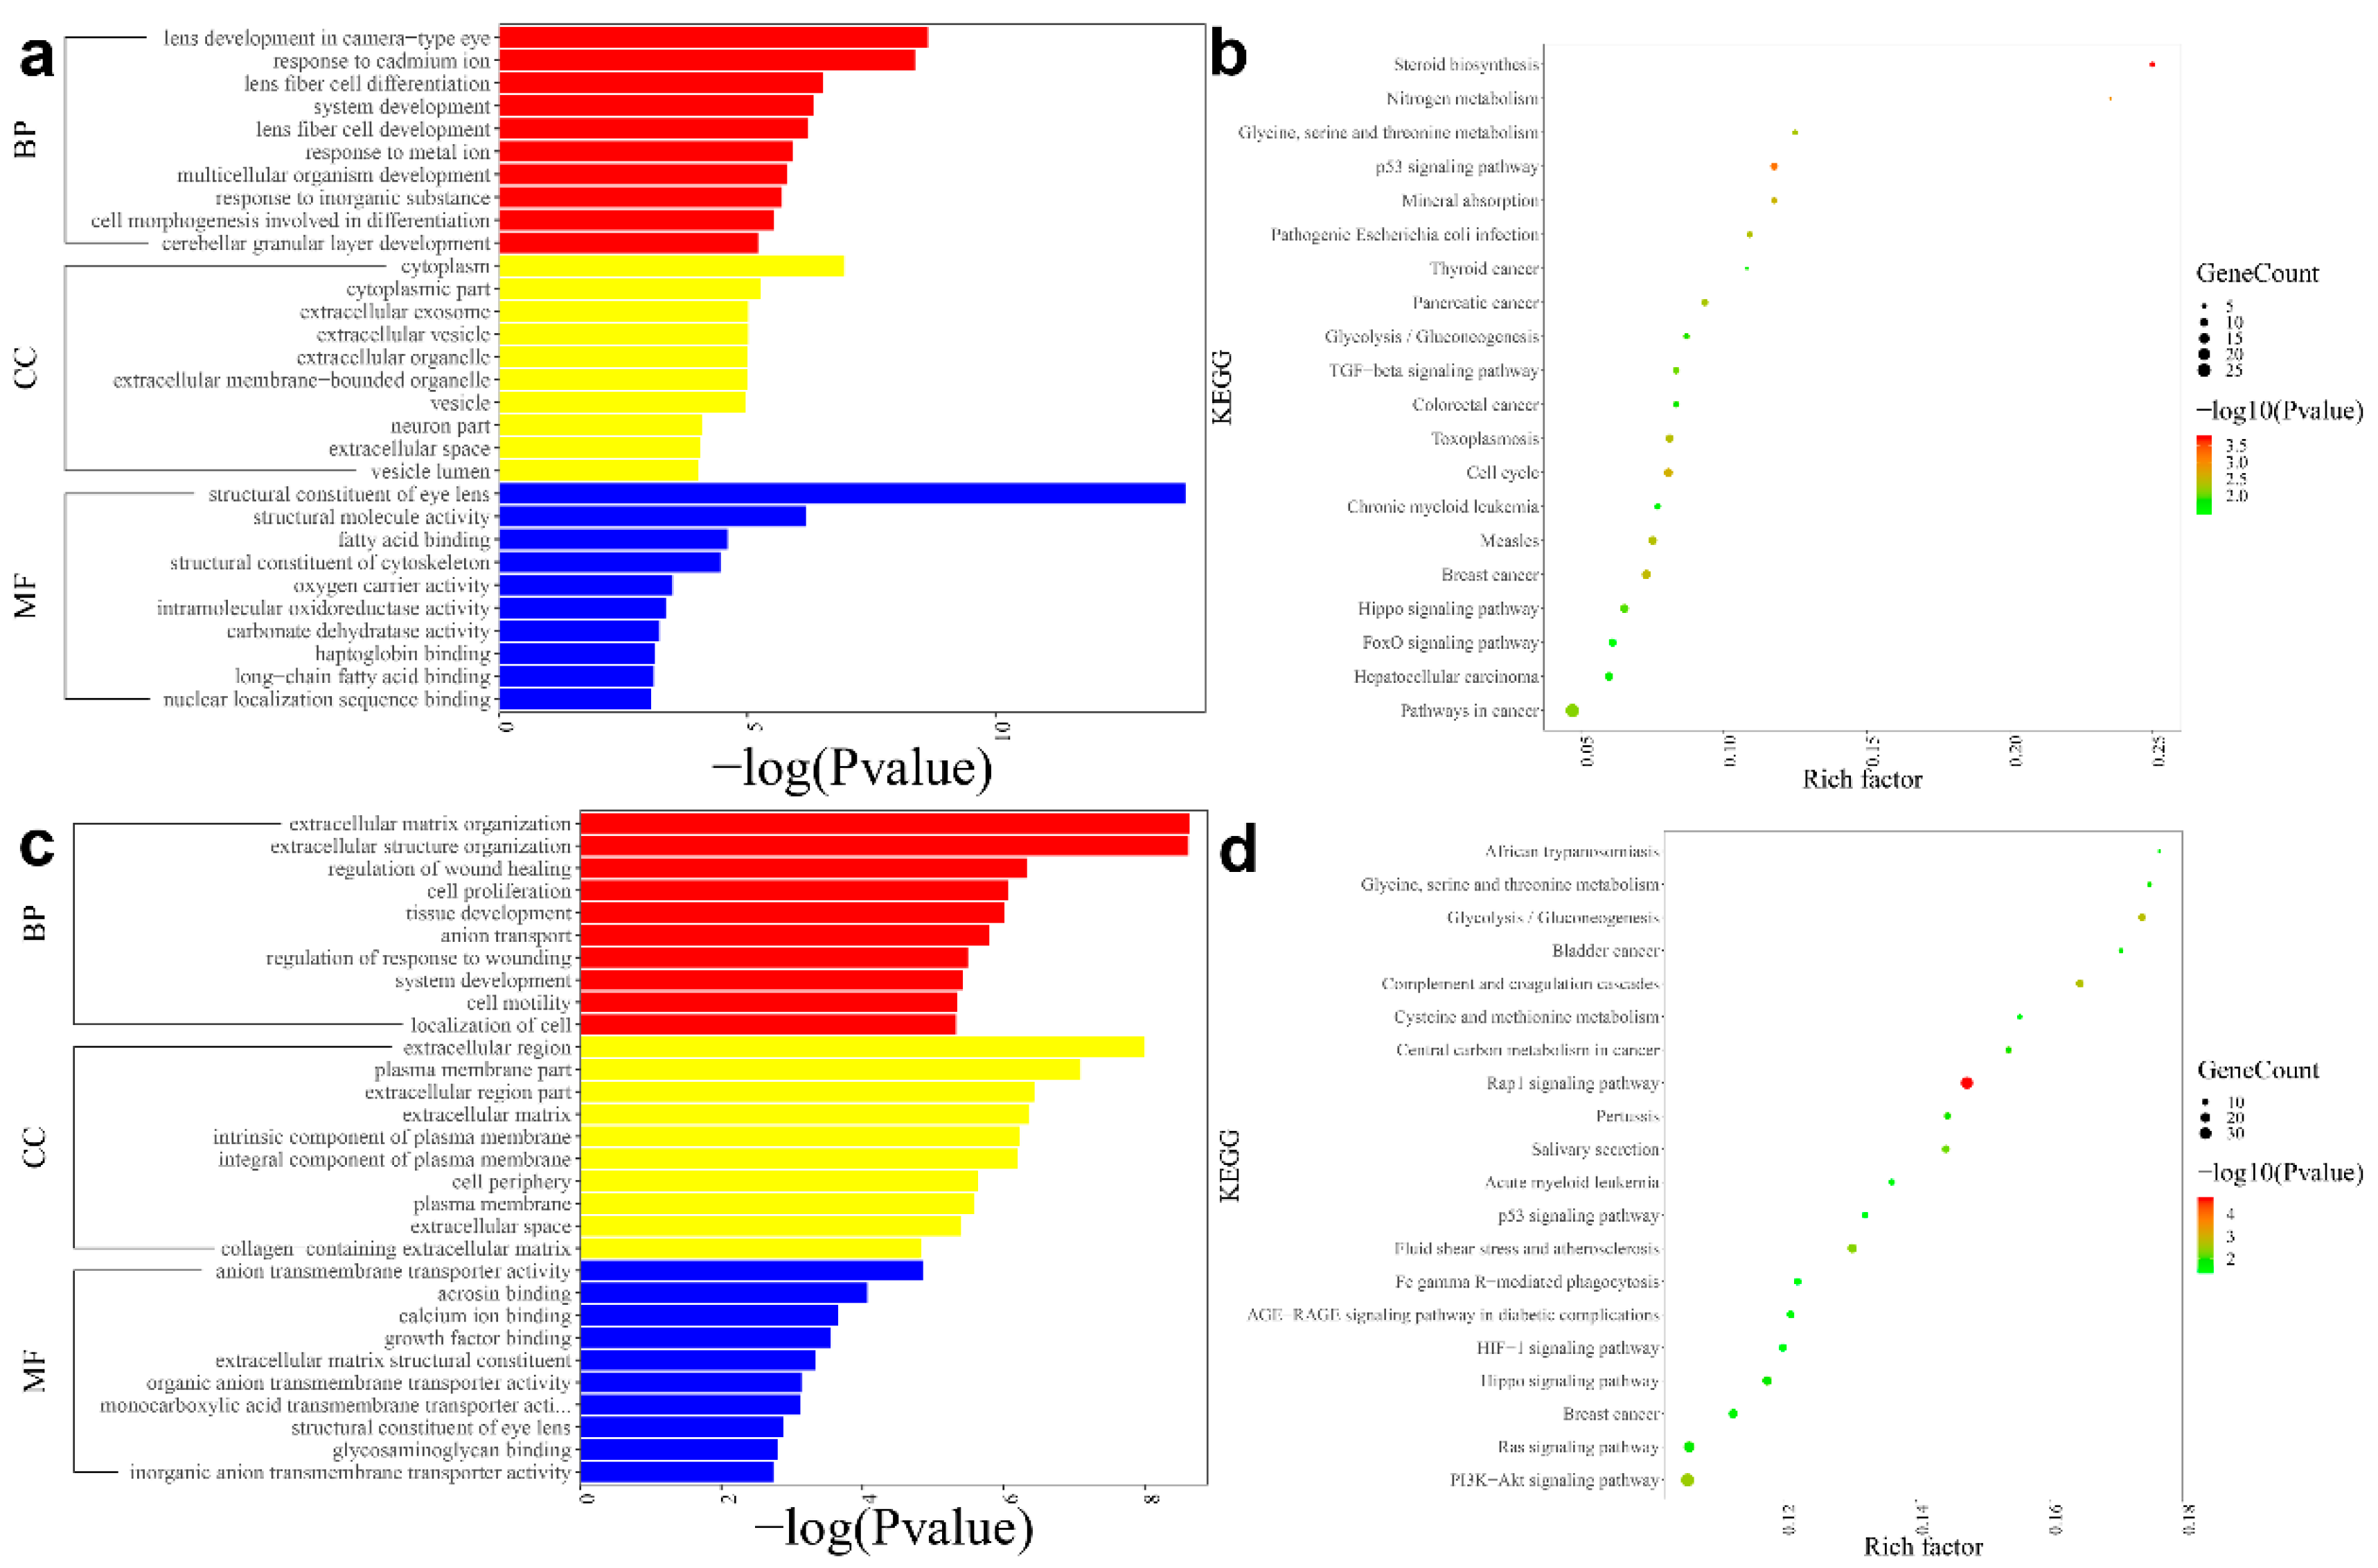
3.1. Differential Expression and Functional Enrichment Analysis in the Anterior Lens Epithelial Cells

In total, 19,072 genes were identified in the anterior lens capsule samples. The results showed 1533 DEGs at the cut-off criteria of |log2 fold change| of >1 and a p-value of <0.05. Using the cut-off criteria of |log2 fold change| of >1 and an FDR value of <0.05, we identified 551 DEGs, including 97 upregulated genes and 454 downregulated genes. The volcano plots and the heat map of DEGs are shown in Figure 1a,b. The top five most upregulated and downregulated DEGs are presented in Table 3.
The identified DEGs were significantly associated with the structural constituents of eye lens (such as BFSP1, CRYBA1 and CRYBA2), lens development in the camera-type eye (such as MIP, PROX1 and WNT7A), response to cadmium ion (such as SORD, FOS and GPI), cytoplasm (such as ABRAXAS2, ACAD11 and ACTA1), structural molecule activity (such as MIP, JAG1 and LIM2) and lens fibre cell differentiation (such as WNT7B, TDRD7 and TMOD1) (Figure 2a). In addition, KEGG pathways were enriched for these DEGs, including steroid biosynthesis (such as FDFT1, CYP51A1 and SQLE), p53 signalling pathways (such as CCNG1, CDKN1A and CCND2), nitrogen metabolisms (such as CA2, CA4 and CA14), mineral absorption (such as MT1F, MT1H and HMOX1) and glycine, serine and threonine metabolisms (such as PHGDH, MAOA and BPGM) (Figure 2b).

3.2. Differential Expression and Functional Enrichment Analysis in the Fibre Cells

The fibre cells expressed a total of 18,755 genes. Using the threshold of a p-value of ≤0.05 and |log2 fold change| of >1, 1263 DEGs were identified from the cortical and nuclear fibres, including 646 downregulated genes and 617 upregulated genes. The volcano plots and the heat map were shown in Figure 1c,d.
The GO annotation indicated that the DEGs were significantly related to the regulation of wound healing (such as APOE and CCL2), the regulation of response to wounding (such as GJA1, WNT4 and APOE), extracellular matrix (ECM) organisations (such as COL11A2, SULF1 and SFRP2), extracellular structure organisations (such as APOE, COL11A2 and SFRP2) and ECMs (such as BMP7, COL11A1 and COL11A2) (Figure 2c). Meanwhile, the KEGG pathway enrichment analysis showed that the DEGs were enriched in Rap1 signalling pathways (such as EFNA3, MAPK12 and GRIN2B), glycolysis/gluconeogenesis (such as FBP1, PGAM2 and ALDH3A1) and glycine, serine and threonine metabolisms (such as PSAT1, CBSL and BPGM) (Figure 2d).

3.3. PPI Network/Strings Network

The top 50 PPI networks for DEGs were constructed (Supplementary Figure S1). In the PPI network, more nodes indicate higher connectivity.

3.4. RT-qPCR Validates the Results of RNA-seq

The top five most upregulated and downregulated DEGs in the anterior lens epithelial cells were selected to validate the results of RNA-seq. The results showed that the RNA expression of these genes obtained by RT-qPCR was in concordance with the results of RNA-seq (Table 3; Figure 3a).
Nine DEGs in the fibre cells were also selected for validation via RT-qPCR. The changes of five downregulated genes including APOE, TSPAN12, PRSS35, ASS1 and SULF1 and three upregulated genes including PRAP1, RAMP1 and TMEM54 were consistent with the data obtained from RNA-seq (Table 4; Figure 3b).

3.5. Lens-Associated Differential Gene Expression to Identify High-Priority Candidate Genes

To identify the candidate genes from the DEGs obtained via RNA-seq analysis that may be associated with the pathology of posterior congenital cataract, we next analysed the DEGs using the database resource of iSyTE2.0 [5], which represented the gene expression and lens enrichment data during the normal lens development. Previous studies have suggested that the database iSyTE could be a cataract gene prioritization resource [10] and 95% of known genes associated with cataract or lens defects are lens-enriched at one or more key embryonic stages [6].
Amongst the microarray database on the Affymetrix 430 2.0 platform in iSyTE, 62 of the DEGs of the anterior lens epithelial cells were ranked within the 528 top lens-enriched genes from all lens stages. From the 62 DEGs, 21 were known genes associated with cataract according to the Cat-Map database [11]. The other 41 genes were candidate cataract-associated genes. After ranking the 41 genes in iSyTE2.0 according to the expression from E10.5 through P56, GRIFIN, DAPL1, LGALS3, GPR160, MBOAT1, HTRA1, SLC7A2, PIP5KL1, CAPRIN2 and ARSI were suggested as the top 10 high-priority candidate genes. In these genes, HTRA1 was the most downregulated DEG in the result of RNA-seq, which was selected for further validation.
According to the data obtained through the transcriptomics profile of mouse embryonic lens development based on RNA-seq [6], 52 DEGs in the anterior lens epithelial cells were found to be highly enriched in the lens at one or more stages. These genes included 52 genes enriched in E10.5, 42 genes enriched in E12.5, 37 genes enriched in E14.5 and 38 genes enriched in E16.5. Amongst the 52 DEGs, 16 were known genes associated with cataract according to the database Cat-Map [11], including ADAMTSL4, APOE, BFSP1, CRYBA1, CRYBA2, CRYBA4, CRYBB1, CRYBB3, CRYGA, CRYGB, CRYGC, CRYGD, EFNA5, GJA3, MIP and PROX1. The other 36 genes were candidate cataract-associated genes. After ranking the 36 genes in iSyTE2.0 according to the expression from E10.5 through E16.5, MBOAT1, NGEF, MED12L, DAPL1 and JAG1 were suggested as the top 5 high-priority candidate genes.
The same method was used to analyse the DEGs in the fibre cells. A total of 49 DEGs of the lens fibre cells were ranked within the 528 top lens-enriched genes from all lens stages. After filtering the known genes associated with cataract, 39 genes were identified as candidate cataract-associated genes. After ranking the transcriptomics profile based on RNA-seq [6], 209 DEGs in the lens fibre cells were found to be highly enriched in the lens at one or more stages. Amongst these genes, 18 were known cataract-associated genes. The other 191 genes were candidate cataract-associated genes. According to the results of the 2 filtering methods, XIST, GRIFIN, HTRA3 and CLU were all high-priority candidate genes.

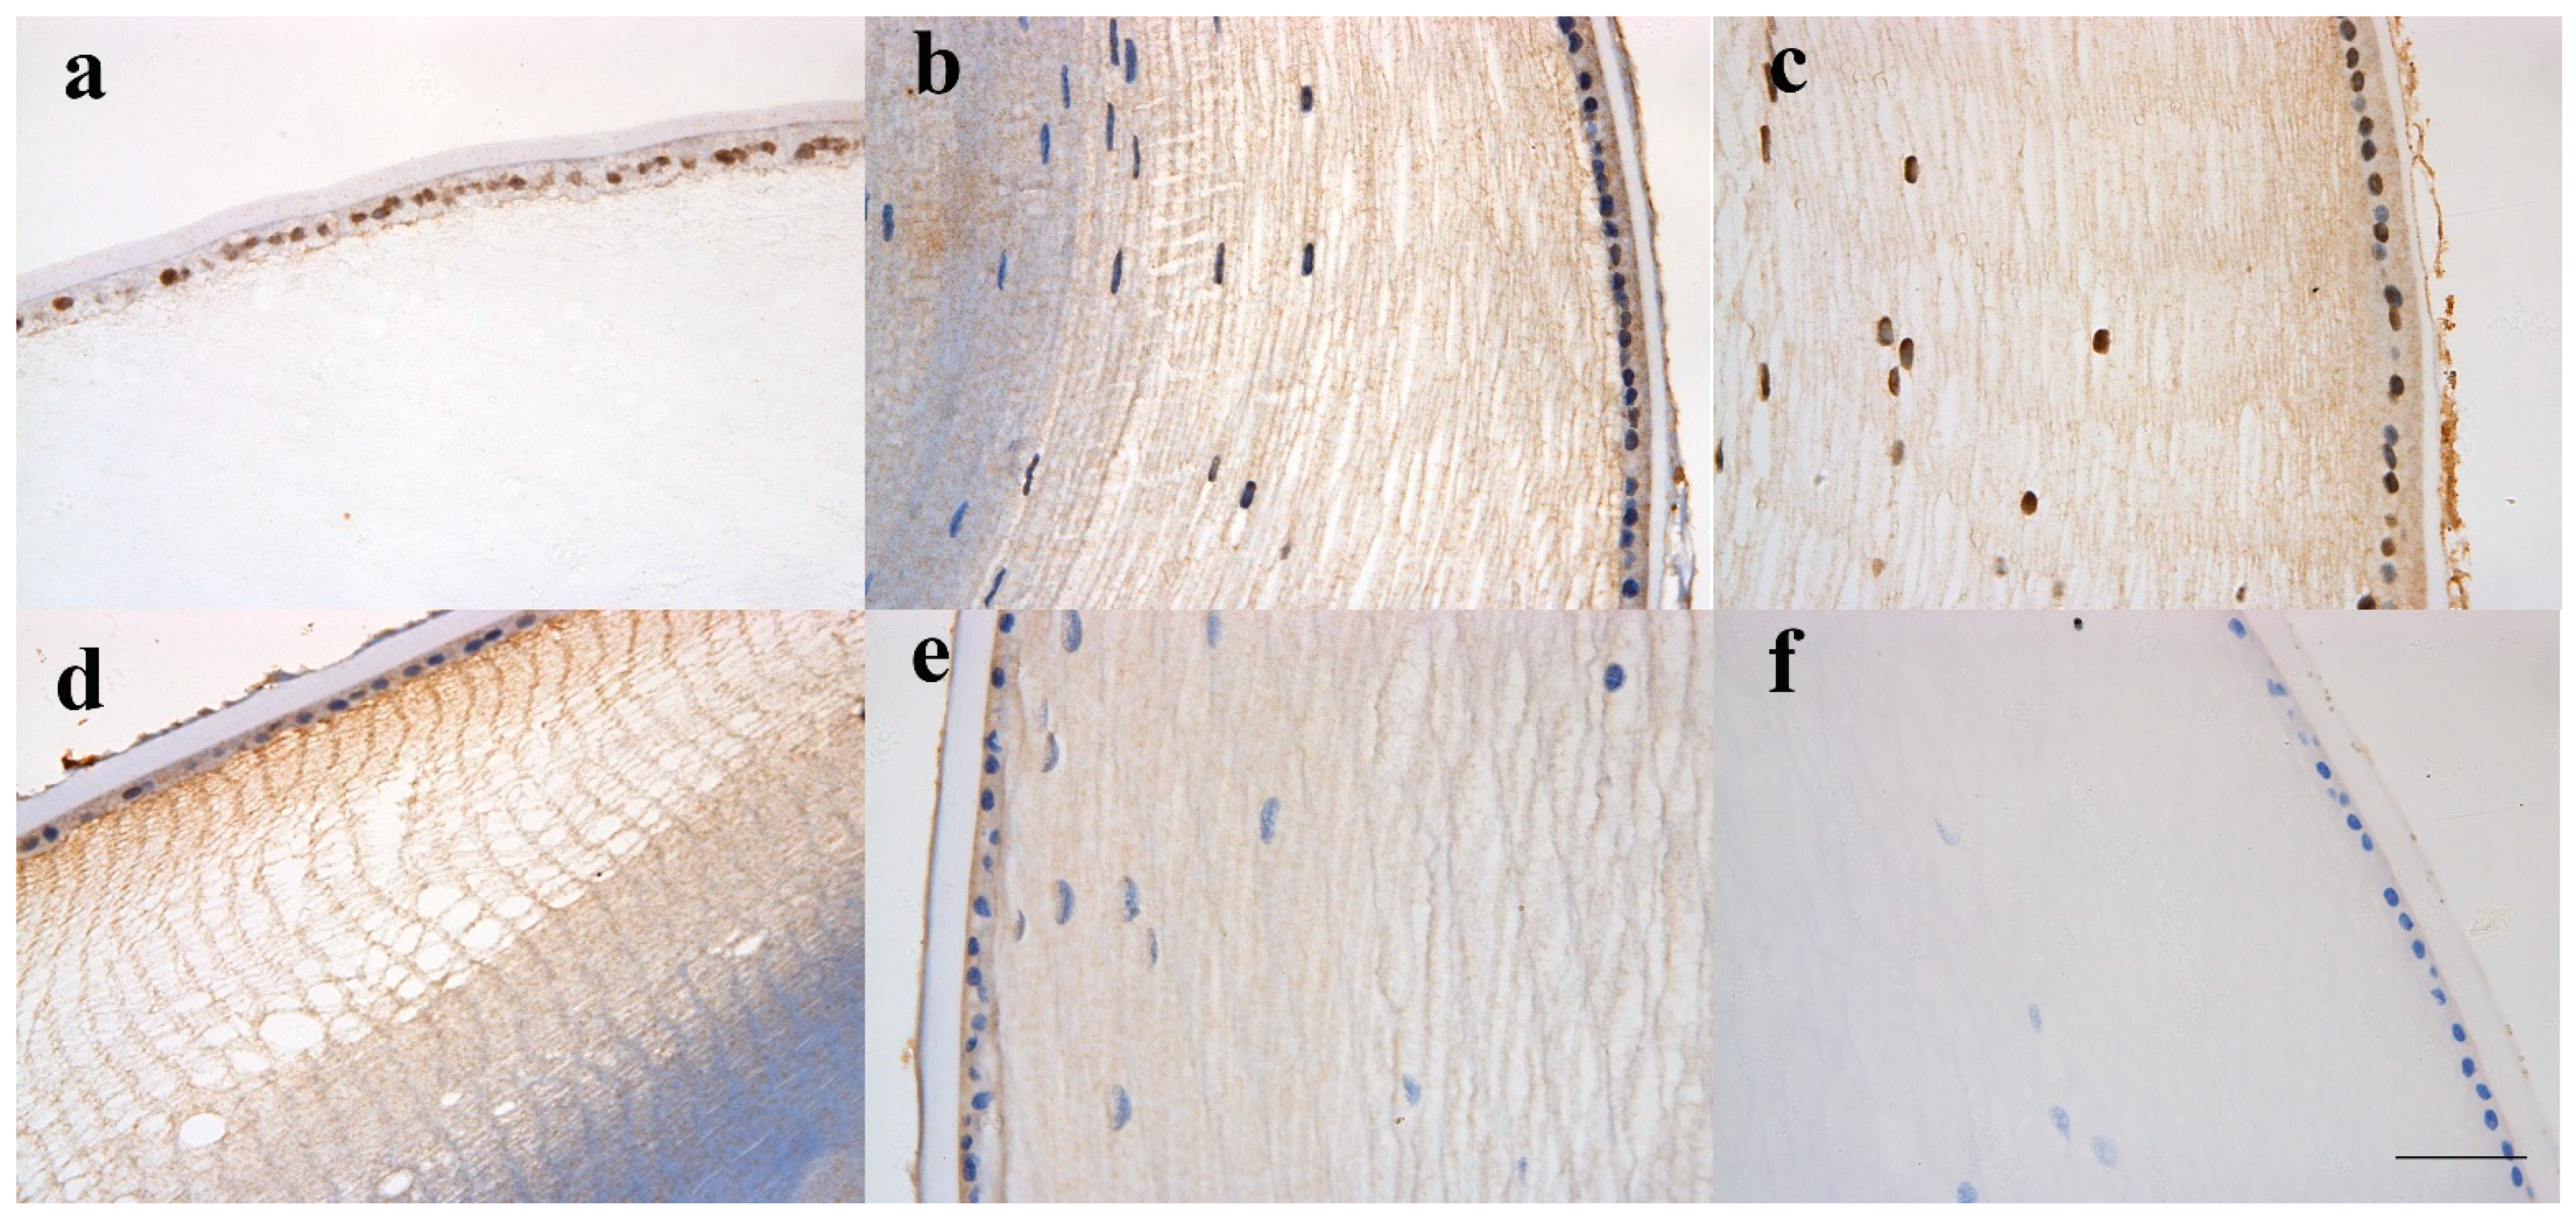
3.6. A Protein Marker of Cell Growth and Epithelial Cell Proliferation Confirms RNA-seq Transcriptome Findings

To confirm the observations from the RNA-seq analysis, the expression of HTRA1 was verified at the RNA level and the protein level. Anterior lens capsules from another 24 posterior subcapsular congenital cataract patients and 12 normal controls were used for RT-qPCR (Supplementary Figure S2). The age did not differ significantly between the congenital cataract patients and normal controls (p-value > 0.05). The results showed that the mRNA expression of HTRA1 was significantly downregulated in posterior congenital cataract patients compared with in normal controls, and the mean fold change was 158.62 (p-value < 0.001). Immunohistochemistry indicated that the HTRA1 protein was located in the epithelial cells and outer fibre cells (Figure 4). In addition, the protein expression of HTRA1 seemed to be reduced with age (Figure 4a–e).

4. Discussion

Congenital cataract is a crucial and preventable cause of childhood blindness. The prevalence of posterior subcapsular congenital cataract is 26.8% worldwide, and it is one of the most common types of congenital cataracts [3]. The pathogenesis of posterior subcapsular congenital cataract is still largely unknown. The RNA-seq can acquire the total number and type of transcripts and identify different transcripts within different tissues. To analyse type-specific gene expression patterns, the anterior lens capsules, cortex and nuclear fibres in posterior subcapsular congenital cataract patients and normal controls were collected for RNA-seq. The results of this study can provide some important insights into the molecular pathology of posterior subcapsular congenital cataracts.
The analysis workflow in this study was conducted as follows: data standardisation and quality control to identify DEGs, functional annotation and clustering analysis followed by filtering of the DEGs using the databases iSyTE and Cat-Map [12]. The database iSyTE allows the visualisation and analysis of dynamic gene expression in lens development and disease, helps to identify new cataract-linked genes [5] and provides an estimate of the expression of lens enrichment. Previous studies have used the database to identify new genes associated with cataracts [5,12,13,14].
We found that the expression levels of more than 1533 of the 19,072 genes in the lens epithelial cells of the posterior subcapsular congenital cataract patients differed more than twofold compared to those of the normal controls. Of these, 686 genes were upregulated, and 847 genes were downregulated in the posterior subcapsular congenital cataract patients using the cut-off criteria of |log2 fold change| of >1 and an FDR value of <0.05. The functional cluster analysis of the identified genes showed that a variety of biological pathways changed significantly after posterior subcapsular congenital cataract formation, including lens cell development, cell differentiation and growth and cadmium ion. Choudhary et al. found that six weeks of CdCl2 administration results in a considerable progress of cataract formation, and the antioxidants for lenses, such as CAT, SOD, GPx and GSH, are significantly reduced [15]. Heavy metal ions might play a potential role in cataract pathology [15,16,17]. It is quite different from the results of age-related cataract research, suggesting that the mechanism of congenital cataract is different from that of age-related cataract, which is in accordance with previous studies [18]. Oligonucleotide microarrays were used in the study of Hawse et al. to compare the global gene expression profiles of epithelial cells between age-related cataracts and clear lenses [19]. Their results showed that functional clustering is significantly altered in oxidative stress, protein synthesis and ion transport pathways [19]. After analysing the upregulated and downregulated DEGs separately, we found that the downregulated genes were significantly enriched in the structural constituent of lens, lens development and lens fibre cell differentiation. In the top 10 downregulated genes, 9 of them were gene-encoding lens crystalline. The results indicated that the biological process of posterior subcapsular congenital cataract formation may be caused by damaging the lens structural proteins, affecting the cell development and differentiation. Interestingly, the results showed that there were five significantly upregulated genes, including HBA2, HBA1, HBB, HBG1 and HBG2, which encoded different haemoglobin chains and were enriched in haemoglobin complex, oxygen carrier activity and oxygen transport. The reason for these results cannot exclude the probability of residual red blood cells during the surgery. Although we have used phosphate-buffered saline (PBS) to clean the samples for at least three times to avoid the remaining reticulocytes after the samples were taken out from the incision, a small number of red blood cells might remain in the sample. More samples should be enrolled to verify the function and mechanism of high-priority candidate genes in further studies.
This study also identified 1263 DEGs of the 18,755 genes in lens cortex and nuclear fibres, including 646 downregulated genes and 617 upregulated genes. The functional cluster analysis suggested that the downregulated genes are significantly enriched in wound healing, organic acid metabolic processes, oxoacid metabolic processes and carboxylic acid metabolic processes, which are mostly related to acid metabolism, whereas the upregulated genes are significantly enriched in the component of plasma membrane and signalling receptor activity. We can assume that with the acid metabolic process in the lens altered, the oxygen uptake is changed and some signalling pathways are activated.
The DEGs in lens epithelial cells showed that gene-encoding crystalline lenses are the most downregulated genes, including CRYGC, CRYGB, CRYGA, CRYBB1, CRYBA1, CRYBA4, CRYGD and CRYBA2. Crystallin genes are the main constitutive proteins of lenses that play a crucial role in maintaining the refractive properties and transparency of the lenses. Previous studies have found that about 50% of non-syndromic, inherited, congenital cataracts are caused by mutations in the gene-encoding crystalline lenses [20,21]. These results further confirmed the pivotal role of crystallin genes.
The results also found that galectin-related inter-fibre protein (GRIFIN) was a DEG in both lens epithelial cells and fibre cells. The GRIFIN is a member of the family of adhesion/growth-regulatory galectins [22,23] and is usually expressed in lens fibre cells of zebrafish, rat and chicken [24,25], and the chicken galectin-related interfibre protein (C-GRIFIN) has been identified as a lens-specific protein and acts as a lens-specific galectin [24]. The study by Barton et al. also found that GRIFIN is bound with α-crystallin in calf lens [26]. Previous studies have indicated that GRIFIN may participate in the regulation of the development of lenses, and as a novel candidate gene in our study, the functions of GRIFIN in the development of subcapsular congenital cataract need further study.
The results of the RNA-seq also showed that HTRA1 is one of the most significant DEGs in epithelial cells. The RT-qPCR result confirmed that HTRA1 was significantly downregulated in the posterior subcapsular congenital cataract patients compared with in the normal controls. HTRA1 is a secreted serine-proteases and widely expressed in various types of cells and tissues. It is a lens-enriched gene (significantly highly expressed in the lenses compared to in other tissues) from E16.5 to P28Epi, according to the data from the database iSyTE. Posterior subcapsular congenital cataract is one of the fibrotic cataracts [27]. Transforming growth factor-β (TGF-β) has been suggested as the most important factor in inducing fibrotic cataracts, such as anterior and posterior subcapsular congenital cataracts and posterior capsule opacity. The posterior migration of the lens cells and abnormal terminal differentiation of lens fibre cells have been considered key pathological features of posterior subcapsular congenital cataract. Previous studies have shown that TGF-β1 could induce the rapid lens cell elongation and abnormal accumulation of the ECM, the deposition of α-smooth muscle actin (α-SMA) and cell death due to apoptosis [28,29]. TGF-β signalling also suggests a key event during fibre terminal differentiation [30]. The lens-specific transgenic TGF-β1 mice showed subcapsular plaque formation and posterior subcapsular nucleation and vacuole formation, which resembled the pathological characteristics of posterior subcapsular congenital cataract. It is reported that HTRA1 interacts with members of the TGF-β family and regulates their signalling pathways [31]. The GST pull-down analysis showed that HTRA1 protein was bound to all tested TGF-β family proteins and inhibited their functions [32]. The interaction between HTRA1 and the TGF-β family has been verified in various diseases, including brain development [31], age-related macular degeneration [33,34] and tumours [35]. As a serine protease, HTRA1 plays a key role in regulating various cellular processes and participates in cell proliferation, migration and apoptosis. Previous studies have found that HTRA1 has a clear proteolytic capability and a recognised effect in cartilage degeneration, skeletal disorders and cancers [35], and HTRA1 can bind to TGF-β1 and degrade and regulate the amount of TGF-β1 in vivo and in vitro [31,36]. Some recent studies have shown that HTRA1 is implicated in ER stress-induced unfolded protein response that plays a key role in the pathogenesis of congenital cataract [13,14,16]. Therefore, we assume that HTRA1 may modulate progression of posterior subcapsular congenital cataract by interfering with TGF-β signalling which need further validation.
However, the results also have some limitations. The sample size was small, and could not fully represent the expression profiles of all patients. In future studies, we will recruit more patients with congenital cataracts and will recruit various cataract phenotypes to determine the expression differences between them. In addition, the function and the mechanism of high-priority candidate genes should also be verified by further studies.

5. Conclusions

The present study provides an evidence of broad differences in gene expression between the lenses in children with posterior subcapsular congenital cataract and the lenses in normal children and identifies novel candidate genes. The gene functional enrichment analysis might deepen our understanding of posterior subcapsular congenital cataract formation and mechanisms. Furthermore, this study provides promising evidence that can inform future research on the pathological mechanisms of posterior subcapsular congenital cataracts and the screening of clinical candidate drugs. These investigations could help prevent and treat this idiopathic cataract.

Supplementary Materials

The following are available online at https://www.mdpi.com/article/10.3390/genes12121904/s1, Figure S1: The top 50 PPI networks for differentially expressed proteins in lens epiehelial cells (a) and lens fiber cells (b); Figure S2. Relative mRNA expression in anterior lens capsules from posterior subcapsular congenital cataract patients and normal controls. The results showed that the mRNA expression of HTRA1 was significantly downregulated in posterior congenital cataract patients compared with normal controls, and the mean fold change was 158.62 (p < 0.0001).

Author Contributions

Conceptualization, Y.L. and X.L. (Xiaolei Lin); methodology, X.L. (Xiaolei Lin) and F.F.; software, H.L.; validation, X.L. (Xiaolei Lin) and T.Y.; resources, Y.L.; data curation, H.L. and X.Z.; writing—original draft preparation, X.L. (Xiaolei Lin); writing—review and editing, X.L. (Xiaolei Lin) and Y.L.; funding acquisition, Y.L. and X.L. (Xin Liu). All authors have read and agreed to the published version of the manuscript.

Funding

This research was supported by grants from the National Natural Science Foundation of China under grant No. 81870645 and the National Natural Youth Fund of China under grant No. 81900839.

Institutional Review Board Statement

This study was conducted adhering to the tenets of the Helsinki Declaration and was approved by the Investigational Review Board of the Eye and ENT Hospital of Fudan University (protocol code: 2020076, date of approval: August 2020), Shanghai, China. Informed consent was obtained from the guardians of the participants.

Informed Consent Statement

Informed consent was obtained from the guardians of all the participants involved in the study.

Data Availability Statement

The data that support the findings of this study are available from the corresponding author, Y.L., upon reasonable request.

Conflicts of Interest

The authors declare no conflict of interest.

Abbreviations

The following abbreviations were used in this manuscript:
cDNAcomplementary DNA
GOgene ontology
KEGGKyoto Encyclopaedia of Genes and Genomes
FPKMper million fragments mapped
DEGdifferentially expressed genes
PPIprotein–protein interaction
RT-qPCRreal-time quantitative PCR
RIPAradio-immunoprecipitation assay
SDS-PAGEsodium dodecylsulphate-polyacrylamide gel electrophoresis
PVDFtransferred to a polyvinylidene difluoride
GRIFINgalectin-related inter-fibre protein
TGF-βtransforming growth factor-β
ECMextracellular matrix
α-SMAdeposition of α-smooth muscle actin
FDRfalse discovery rate
PBSphosphate-buffered saline
RNA-seqRNA sequencing

References

  1. Mohammadpour, M.; Shaabani, A.; Sahraian, A.; Momenaei, B.; Tayebi, F.; Bayat, R.; Mirshahi, R. Updates on managements of pediatric cataract. J. Curr. Ophthalmol. 2019, 31, 118–126. [Google Scholar] [CrossRef]
  2. Churchill, A.; Graw, J. Clinical and experimental advances in congenital and paediatric cataracts. Philos. Trans. R. Soc. B Biol. Sci. 2011, 366, 1234–1249. [Google Scholar] [CrossRef] [Green Version]
  3. Wu, X.; Long, E.; Lin, H.; Liu, Y. Prevalence and epidemiological characteristics of congenital cataract: A systematic review and meta-analysis. Sci. Rep. 2016, 6, 28564. [Google Scholar] [CrossRef]
  4. Haargaard, B.; Wohlfahrt, J.; Fledelius, H.C.; Rosenberg, T.; Melbye, M. A nationwide Danish study of 1027 cases of congenital/infantile cataracts. Ophthalmology 2004, 111, 2292–2298. [Google Scholar] [CrossRef] [PubMed]
  5. Kakrana, A.; Yang, A.; Anand, D.; Djordjevic, D.; Ramachandruni, D.; Singh, A.; Huang, H.; Ho, J.; Lachke, S.A. iSyTE 2.0: A database for expression-based gene discovery in the eye. Nucleic Acids Res. 2018, 46, D875–D885. [Google Scholar] [CrossRef]
  6. Anand, D.; Kakrana, A.; Siddam, A.D.; Huang, H.; Saadi, I.; Lachke, S.A. RNA sequencing-based transcriptomic profiles of embryonic lens development for cataract gene discovery. Hum. Genet. 2018, 137, 941–954. [Google Scholar] [CrossRef]
  7. Lachke, S.A.; Ho, J.; Kryukov, G.V.; O’Connell, D.J.; Aboukhalil, A.; Bulyk, M.L.; Park, P.J.; Maas, R.L. iSyTE: Integrated Systems Tool for Eye Gene Discovery. Investig. Ophthalmol. Vis. Sci. 2012, 53, 1617–1627. [Google Scholar] [CrossRef] [Green Version]
  8. You, C.; Wu, X.; Zhang, Y.; Dai, Y.; Huang, Y.; Xie, L. Visual Impairment and Delay in Presentation for Surgery in Chinese Pediatric Patients with Cataract. Ophthalmology 2011, 118, 17–23. [Google Scholar] [CrossRef]
  9. Szklarczyk, D.; Morris, J.H.; Cook, H.; Kuhn, M.; Wyder, S.; Simonovic, M.; Santos, A.; Doncheva, N.T.; Roth, A.; Bork, P.; et al. The STRING database in 2017: Quality-controlled protein-protein association networks, made broadly accessible. Nucleic Acids Res. 2017, 45, D362–D368. [Google Scholar] [CrossRef] [PubMed]
  10. Liu, H.; Barnes, J.; Pedrosa, E.; Herman, N.S.; Salas, F.; Wang, P.; Zheng, D.; Lachman, H.M. Transcriptome analysis of neural progenitor cells derived from Lowe syndrome induced pluripotent stem cells: Identification of candidate genes for the neurodevelopmental and eye manifestations. J. Neurodev. Disord. 2020, 12, 14. [Google Scholar] [CrossRef] [PubMed]
  11. Shiels, A.; Bennett, T.M.; Hejtmancik, J.F. Cat-Map: Putting cataract on the map. Mol. Vis. 2010, 16, 2007–2015. [Google Scholar] [PubMed]
  12. Anand, D.; Lachke, S.A. Systems biology of lens development: A paradigm for disease gene discovery in the eye. Exp. Eye Res. 2017, 156, 22–33. [Google Scholar] [CrossRef] [Green Version]
  13. Agrawal, S.A.; Anand, D.; Siddam, A.D.; Kakrana, A.; Dash, S.; Scheiblin, D.A.; Dang, C.A.; Terrell, A.M.; Waters, S.M.; Singh, A.; et al. Compound mouse mutants of bZIP transcription factors Mafg and Mafk reveal a regulatory network of non-crystallin genes associated with cataract. Hum. Genet. 2015, 134, 717–735. [Google Scholar] [CrossRef] [PubMed] [Green Version]
  14. Anand, D.; Agrawal, S.A.; Siddam, A.D.; Motohashi, H.; Yamamoto, M.; Lachke, S.A. An integrative approach to analyze microarray datasets for prioritization of genes relevant to lens biology and disease. Genom. Data 2015, 5, 223–227. [Google Scholar] [CrossRef]
  15. Choudhary, R.; Bodakhe, S.H. Olmesartan, an angiotensin II receptor blocker inhibits the progression of cataract formation in cadmium chloride induced hypertensive albino rats. Life Sci. 2016, 167, 105–112. [Google Scholar] [CrossRef] [PubMed]
  16. Domínguez-Calva, J.A.; Pérez-Vázquez, M.L.; Serebryany, E.; King, J.A.; Quintanar, L. Mercury-induced aggregation of human lens γ-crystallins reveals a potential role in cataract disease. J. Biol. Inorg. Chem. 2018, 23, 1105–1118. [Google Scholar] [CrossRef]
  17. Langford-Smith, A.; Tilakaratna, V.; Lythgoe, P.R.; Clark, S.J.; Bishop, P.N.; Day, A.J. Age and Smoking Related Changes in Metal Ion Levels in Human Lens: Implications for Cataract Formation. PLoS ONE 2016, 11, e147576. [Google Scholar] [CrossRef] [Green Version]
  18. Shiels, A.; Hejtmancik, J.F. Mutations and mechanisms in congenital and age-related cataracts. Exp. Eye Res. 2017, 156, 95–102. [Google Scholar] [CrossRef] [Green Version]
  19. Hawse, J.R.; Hejtmancik, J.F.; Horwitz, J.; Kantorow, M. Identification and functional clustering of global gene expression differences between age-related cataract and clear human lenses and aged human lenses. Exp. Eye Res. 2004, 79, 935–940. [Google Scholar] [CrossRef] [Green Version]
  20. Bell, S.J.; Oluonye, N.; Harding, P.; Moosajee, M. Congenital cataract: A guide to genetic and clinical management. Ther. Adv. Rare Dis. 2020, 1, 1726979822. [Google Scholar] [CrossRef]
  21. Shiels, A.; Hejtmancik, J.F. Molecular Genetics of Cataract. Prog. Mol. Biol. Transl. Sci. 2015, 134, 203–218. [Google Scholar] [CrossRef] [PubMed] [Green Version]
  22. Kaltner, H.; García, C.G.; Ludwig, A.K.; Manning, J.C.; Gabius, H.J. From glycophenotyping by (plant) lectin histochemistry to defining functionality of glycans by pairing with endogenous lectins. Histochem. Cell Biol. 2018, 149, 547–568. [Google Scholar] [CrossRef]
  23. Kaltner, H.; Toegel, S.; Caballero, G.G.; Manning, J.C.; Ledeen, R.W.; Gabius, H.J. Galectins: Their network and roles in immunity/tumor growth control. Histochem. Cell Biol. 2017, 147, 239–256. [Google Scholar] [CrossRef]
  24. García Caballero, G.; Schmidt, S.; Schnölzer, M.; Schlötzer-Schrehardt, U.; Knospe, C.; Ludwig, A.; Manning, J.C.; Muschler, P.; Kaltner, H.; Kopitz, J.; et al. Chicken GRIFIN: Binding partners, developmental course of localization and activation of its lens-specific gene expression by L-Maf/Pax6. Cell Tissue Res. 2019, 375, 665–683. [Google Scholar] [CrossRef] [PubMed]
  25. García, C.G.; Kaltner, H.; Michalak, M.; Shilova, N.; Yegres, M.; André, S.; Ludwig, A.K.; Manning, J.C.; Schmidt, S.; Schnölzer, M.; et al. Chicken GRIFIN: A homodimeric member of the galectin network with canonical properties and a unique expression profile. Biochimie 2016, 128–129, 34–47. [Google Scholar] [CrossRef] [PubMed]
  26. Barton, K.A.; Hsu, C.; Petrash, J.M. Interactions between Small Heat Shock Protein α-Crystallin and Galectin-Related Interfiber Protein (GRIFIN) in the Ocular Lens. Biochemistry 2009, 48, 3956–3966. [Google Scholar] [CrossRef] [Green Version]
  27. Taiyab, A.; Holms, J.; West-Mays, J.A. β-Catenin/Smad3 Interaction Regulates Transforming Growth Factor-β-Induced Epithelial to Mesenchymal Transition in the Lens. Int. J. Mol. Sci. 2019, 20, 2078. [Google Scholar] [CrossRef] [Green Version]
  28. Du, Y.; Guo, D.; Wu, Q.; Liu, D.; Bi, H. Zinc Chloride Inhibits Human Lens Epithelial Cell Migration and Proliferation Involved in TGF-β1 and TNF-α Signaling Pathways in HLE B-3 Cells. Biol. Trace Elem. Res. 2014, 159, 425–433. [Google Scholar] [CrossRef]
  29. Kubo, E.; Shibata, T.; Singh, D.; Sasaki, H. Roles of TGF β and FGF Signals in the Lens: Tropomyosin Regulation for Posterior Capsule Opacity. Int. J. Mol. Sci. 2018, 19, 3093. [Google Scholar] [CrossRef] [Green Version]
  30. de Iongh, R.U.; Lovicu, F.J.; Overbeek, P.A.; Schneider, M.D.; Joya, J.; Hardeman, E.D.; Mcavoy, J.W. Requirement for TGFbeta receptor signaling during terminal lens fiber differentiation. Development 2001, 128, 3995–4010. [Google Scholar] [CrossRef] [PubMed]
  31. Launay, S.; Maubert, E.; Lebeurrier, N.; Tennstaedt, A.; Campioni, M.; Docagne, F.; Gabriel, C.; Dauphinot, L.; Potier, M.C.; Ehrmann, M.; et al. HtrA1-dependent proteolysis of TGF-beta controls both neuronal maturation and developmental survival. Cell Death Differ. 2008, 15, 1408–1416. [Google Scholar] [CrossRef] [PubMed]
  32. Canfield, A.E.; Hadfield, K.D.; Rock, C.F.; Wylie, E.C.; Wilkinson, F.L. HtrA1: A novel regulator of physiological and pathological matrix mineralization? Biochem. Soc. Trans. 2007, 35, 669–671. [Google Scholar] [CrossRef] [PubMed]
  33. Gerhardt, M.J.; Marsh, J.A.; Morrison, M.; Kazlauskas, A.; Khadka, A.; Rosenkranz, S.; Deangelis, M.M.; Saint-Geniez, M.; Jacobo, S.M.P. ER stress-induced aggresome trafficking of HtrA1 protects against proteotoxicity. J. Mol. Cell Biol. 2017, 9, 516–532. [Google Scholar] [CrossRef] [PubMed]
  34. May, A.; Su, F.; Dinh, B.; Ehlen, R.; Tran, C.; Adivikolanu, H.; Shaw, P.X. Ongoing controversies and recent insights of the ARMS2-HTRA1 locus in age-related macular degeneration. Exp. Eye Res. 2021, 210, 108605. [Google Scholar] [CrossRef]
  35. Li, Y.; Yuan, J.; Rothzerg, E.; Wu, X.; Xu, H.; Zhu, S.; Xu, J. Molecular structure and the role of high-temperature requirement protein 1 in skeletal disorders and cancers. Cell Proliferat. 2020, 53, e12746. [Google Scholar] [CrossRef] [PubMed] [Green Version]
  36. Li, X.; Ban, G.; Al-Shameri, B.; He, X.; Liang, D.; Chen, W. High-temperature Requirement Protein A1 Regulates Odontoblastic Differentiation of Dental Pulp Cells via the Transforming Growth Factor Beta 1/Smad Signaling Pathway. J. Endodont. 2018, 44, 765–772. [Google Scholar] [CrossRef]
Figure 1. Differentially expressed genes (DEGs) in posterior subcapsular congenital cataract patients compared with in normal control samples. (a) Volcano plots of the DEGs in the anterior lens capsule samples. Blue dots indicate upregulated genes, and purple ones represent downregulated genes; (b) hierarchical clustering performed on the DEGs in the anterior lens capsule samples; highly expressed genes are shown in pink, and the lower ones are shown in blue; C indicates congenital cataract samples, while N represents normal control samples; (c) volcano plots of the DEGs in cortex and nuclear fibres; blue dots indicate upregulated genes, and purple dots represent downregulated genes; (d) hierarchical clustering performed on the DEGs in cortex and nuclear fibres.
Genes 12 01904 g001
Figure 2. Gene ontology (GO) annotation and Kyoto Encyclopaedia of Genes and Genomes (KEGG) pathway enrichment analysis results for the DEGs of the posterior subcapsular congenital cataract patients compared with those of the normal controls. (a) The top 30 GO enrichment of the DEGs in the anterior lens capsule samples; (b) the top 20 KEGG enrichment analysis results of the DEGs in the anterior lens capsule samples; (c) the top 30 GO enrichment of the DEGs in the cortex and nuclear fibres; (d) the top 20 KEGG enrichment analysis results of the DEGs in cortex and nuclear fibres.
Genes 12 01904 g002
Figure 3. Validation of RNA-sequencing results by RT-qPCR. (a) RT-qPCR validation results of the five upregulated genes and the five downregulated genes identified by RNA-sequencing analysis in the anterior lens capsule samples; (b) RT-qPCR validation results of the five upregulated genes and the four downregulated genes identified by RNA-sequencing analysis in cortex and nuclear fibres.
Genes 12 01904 g003
Figure 4. Images of immunohistochemistry of the stained HTRA1 for transparent lens from donors of different ages. (a). Image of a 19-day-old boy; (b) image of a 2-month-old boy; (c) image of a 3-month-old girl; (d) image of a 15-month-old boy; (e) image of a 19-year-old girl; (f) negative control image of a 2-month-old boy. The results indicated that the HTRA1 protein was located in the epithelial cells and outer fibre cells. The images are taken at a 20× magnification. Scale bar: 50 μm.
Genes 12 01904 g004
Table 1. Primers for the real-time quantitative PCR (RT-qPCR) assay.
TargetF/RPrimer Sequence (5′→3′)Amplicon Size (BP)
CRYGCForwardTCCCAACTACCAAGGTCAACA232
ReverseGTGGAGGGAACGGATCTCG
CRYGBForwardCACCTCACTGAAATTCACTCCC125
ReverseCCCCAATCAAGAAACCTCCTGT
CRYGAForwardGGTCCAATCCTGCCGTATAATTC109
ReverseACAGGCGCAGTCATCAGTG
CRYBB1ForwardGTGCTCAAATCTGGCAGACC92
ReverseGGAAGTTGGACTGCTCAAAGG
CRYBA1ForwardGGGCAAGAGGATGGAGTTCAC122
ReverseCACAGAAGCTGGTATGCTCATAA
HBA2ForwardCAAGACCTACTTCCCGCACTTCG341
ReverseGGGCAGGAGGAACGGCTACC
HBA1ForwardTCAACTTCAAGCTCCTAAGCCACTG110
ReverseCACAGAAGCCAGGAACTTGTCCAG
HBBForwardAGGAGAAGTCTGCCGTTACTG190
ReverseCCGAGCACTTTCTTGCCATGA
S100A9ForwardCTGTGTGGCTCCTCGGCTTTG98
ReverseTGGTGGAAGGTGTTGATGATGGTC
HBG2ForwardGTGGAAGATGCTGGAGGAGAAACC106
ReverseTGATGGCAGAGGCAGAGGACAG
APOEForwardGTTGCTGGTCACATTCCTGG146
ReverseGCAGGTAATCCCAAAAGCGAC
TSPAN12ForwardCCAGAGAAGATTCCGTGAAGTG107
ReverseGTCCCTCATCCAAGCAGAAAC
PRSS35ForwardCATCGAATGCCAGAAAGAACTCC135
ReverseGTCGGCTCAAGAACCAAATCT
ASS1ForwardTCCGTGGTTCTGGCCTACA126
ReverseGGCTTCCTCGAAGTCTTCCTT
SULF1ForwardGATCCCCGAGGTTCAGAGGA178
ReverseGGTGTAGTCACAAAGGCATTGA
METRNForwardCACAGACACCGCCAGGCAAG103
ReverseCCACTCCTCTCCCGTCCACAC
PRAP1ForwardACAGCCTGTACCACCCTCC82
ReverseAGCACCTGGTGATTTGGCATC
RAMP1ForwardCCAGGAGGCTAACTACGGTG297
ReverseGGGACCACGATGAAGGGGTA
TMEM54ForwardTGGGCCATGTGAGCTTCATC176
ReverseGAGGTAGCGTGACAACACGAT
GAPDHForwardGGAGCGAGATCCCTCCAAAAT197
ReverseGGCTGTTGTCATACTTCTCATGG
Table 2. RNA-seq samples, read metrics and mapped ratios.
SampleTissueRaw ReadsClean ReadsClean Read-PairsAverage LengthMapped
Ratio (%)
PSC patient 1Capsules79,150,68823,475,25611,737,628138.388.80%
PSC patient 2Capsules92,790,04636,750,67418,375,337141.993.40%
PSC patient 3Capsules102,532,01647,760,46023,880,230142.091.70%
PSC patient 4Capsules100,012,38832,018,41616,009,208142.492.60%
PSC patient 5Capsules98,193,32236,350,31018,175,155134.779.10%
PSC patient 6Capsules100,226,08840,541,83420,270,917134.179.90%
NC 1Capsules127,355,19260,141,11630,070,558144.695.60%
NC 2Capsules100,869,81837,378,54818,689,274138.086.40%
NC 3Capsules111,902,71247,398,99023,699,495141.592.20%
NC 4Capsules127,358,61048,182,94224,091,471144.294%
NC 5Capsules120,259,64052,969,55426,484,777134.690.60%
NC 6Capsules91,405,50031,710,34615,855,173133.684.20%
NC 7Capsules125,882,60056,962,56228,481,281136.593%
NC 8Capsules131,778,76254,214,65627,107,328135.591.70%
PSC patient 1Cortex123,977,23445,747,38022,873,690141.693.40%
PSC patient 3Cortex91,869,47825,684,82012,842,410137.985.90%
PSC patient 4Cortex110,104,320109,339,07054,669,535150.097.60%
PSC patient 5Cortex128,652,52848,532,58624,266,293138.789.40%
PSC patient 6Cortex116,294,43247,393,27823,696,639136.584.80%
NC 1Cortex98,977,18232,642,77416,321,387141.892.40%
NC 4Cortex167,149,11467,734,53833,867,269142.495.10%
NC 5Cortex94,542,66893,252,44246,626,221148.996.90%
NC 6Cortex114,900,736113,734,10256,867,051148.897.90%
NC 7Cortex92,822,21492,085,70646,042,853149.597.90%
PSC, posterior subcapsular congenital cataract; NC, normal control.
Table 3. The top 5 upregulated and downregulated DEGs in the anterior lens capsule samples of the posterior subcapsular congenital cataract patients.
DEGSymbolDescriptionLog2
Fold Change
p-ValueFalse Discovery Rate (FDR) Value
DownregulatedCRYGCCrystallin gamma C−8.1173.04 × 10−156.00 × 10⁻¹²
CRYGBCrystallin gamma B−7.9524.24 × 10−146.30 × 10⁻¹¹
CRYGACrystallin gamma A−7.8184.67 × 10−181.61 × 10⁻¹⁴
CRYBB1Crystallin beta B1−7.6953.07 × 10−222.11 × 10⁻¹⁸
CRYBA1Crystallin beta A1−7.6677.63 × 10−247.00 × 10⁻²⁰
UpregulatedHBA2Hemoglobin subunit alpha 210.1821.20 × 10−412.21 × 10−37
HBA1Hemoglobin subunit alpha 19.8381.27 × 10−443.48 × 10−40
HBBHemoglobin subunit beta9.4144.16 × 10−492.29 × 10−44
S100A9S100 calcium binding protein A95.0873.54 × 10−156.71 × 10⁻¹²
HBG2Hemoglobin subunit gamma 24.8632.18 × 10−64.59 × 10⁻⁴
Table 4. The top 5 upregulated and top 4 downregulated DEGs in the lens fibre cells of the posterior subcapsular congenital cataract patients.
DEGsSymbolDescriptionLog2
Fold Change
p-ValueFDR Value
DownregulatedAPOEApolipoprotein E−5.8891.47 × 10−119.71 × 10⁻⁸
TSPAN12Tetraspanin 12−4.4353.64 × 10−70.001
PRSS35Protease, serine 35−4.2492.21 × 10−60.004
ASS1Argininosuccinate Synthase 1−3.7866.89 × 10−70.002
SULF1Sulfatase 1−3.3383.63 × 10−50.028
UpregulatedMETRNMeteorin, glial cell differentiation regulator2.8725.07 × 10−60.007
PRAP1Proline rich acidic Protein 12.8522.85 × 10−50.024
RAMP1Receptor activity-modifying protein 12.3111.56 × 10−50.016
TMEM54Transmembrane protein 541.9211.37 × 10−60.003
Publisher’s Note: MDPI stays neutral with regard to jurisdictional claims in published maps and institutional affiliations.

