Abstract
Switchgrass (Panicum Virgatum L.) has been recognized as the new energy plant, which makes it ideal for the development of phytoremediation on heavy metal contamination in soils with great potential. This study aimed to screen the best internal reference genes for the real-time quantitative PCR (RT-qPCR) in leaves and roots of switchgrass for investigating its response to various heavy metals, such as cadmium (Cd), lead (Pb), mercury (Hg), chromium (Cr), and arsenic (As). The stability of fourteen candidate reference genes was evaluated by BestKeeper, GeNorm, NormFinder, and RefFinder software. Our results identified U2AF as the best reference gene in Cd, Hg, Cr, and As treated leaves as well as in Hg, Pb, As, and Cr stressed root tissues. In Pb treated leaf tissues, 18S rRNA was demonstrated to be the best reference gene. CYP5 was determined to be the optimal reference gene in Cd treated root tissues. The least stable reference gene was identified to be CYP2 in all tested samples except for root tissues stressed by Pb. To further validate the initial screening results, we used the different sets of combinatory internal reference genes to analyze the expression of two metal transport associated genes (PvZIP4 and PvPDB8) in young leaves and roots of switchgrass. Our results demonstrated that the relative expression of the target genes consistently changed during the treatment when CYP5/UBQ1, U2AF/ACT12, eEF1a/U2AF, or 18S rRNA/ACT12 were combined as the internal reference genes. However, the time-dependent change pattern of the target genes was significantly altered when CYP2 was used as the internal reference gene. Therefore, the selection of the internal reference genes appropriate for specific experimental conditions is critical to ensure the accuracy and reliability of RT-qPCR. Our findings established a solid foundation to further study the gene regulatory network of switchgrass in response to heavy metal stress.
1. Introduction
Real-time quantitative PCR (RT-qPCR) has become the leading technique applied in gene expression analysis due to its advantageous characteristics, such as high-throughput, high sensitivity, and specificity, along with great repeatability. Reference genes with stable expression levels are used as the standard markers to calibrate and ensure the accuracy and validity of results from RT-qPCR [1,2]. Thus, a few conventional housekeeping genes, such as β-Actin and 18S rRNA, are commonly used as reference genes in RT-qPCR for plants [3]. However, based on up-to-date studies, the universal reference gene with stable expression profiles in different tissues and organs, developmental stages as well as experimental conditions has not been discovered. Therefore, it is of pivotal importance to identify the appropriate and stable reference genes associated with various situations in the analysis of gene expression profiles.
Heavy metal, as the main environmental pollutant, has raised a growing concern in ecological and global public health in recent years [4]. With the overdevelopment and excessive utilization of mineral resources and reserves, the disposal of electronic waste, and the extensive application of pesticides and fertilizers, the pollution in soil and water by heavy metals has become an increasingly serious problem [5]. Furthermore, the enrichment of heavy metals in the soil by agronomic crops endangers human health in a direct manner. Therefore, the remediation of heavy metal polluted soils, especially phytoremediation, has gained increasing attention from both academia and industries due to its lower cost and fewer side effects than conventional chemical and physical techniques [6]. Though the hyperaccumulator has become the hotspot for ecological restoration in recent years, utilization of energy plants for remedying heavy metal contaminated soil can achieve a win–win situation for the production of biomass raw materials as well as the management of the polluted soil [7].
Switchgrass (Panicum Virgatum L.), a C4 warm-season perennial grass species, is originated from North America and widely distributed in non-natural areas (above 55° north latitude) [8]. The C4 grass has many merits, such as high efficiency in photosynthesis, high utilization of nitrogen, water, and nutrients, and it is also effective in water–soil conservation as well as the increase in organic matter in the soil [9]. Generally, the full growth season of switchgrass starts in the third year after plantation, and a single plantation lasts from 10 to 15 years. In addition, switchgrass is well tolerated and grows well on the land under a variety of stress conditions, such as drought, alkali-salt, flooding, and leanness [10]. The renewable energy that is produced from switchgrass has been reported to be about five fold of the energy that is consumed during the production process [11]. In addition, considering the environmental benefits in soil conservation and reducing greenhouse gas emissions, switchgrass has been recognized as the new energy plant with great potential, which makes it ideal for the development of phytoremediation on heavy metal contamination in soils [7,10].
In this study, we have selected fourteen common housekeeping genes as candidate reference genes from previous studies [10,12], aiming to identify appropriate reference genes with stable expression in various tissues of switchgrass and analyze its response to stress induced by different heavy metals. We further studied the differential gene expression of PvZIP4 and PvPDR8 from Zinc/Iron regulatory transporter family (ZIP) and ATP-binding cassette transporter family (ABC), respectively, pre and post the stress. Our results not only facilitate the understanding of the molecular mechanism of the heavy metal stress-induced response in switchgrass, but also establish the foundation for further studies on remediation of heavy metal contamination in soil.
2. Materials and Methods
2.1. Plant Materials and Treatment
The switchgrass cultivars “Alamo” seeds were sterilized in 10% NaClO for 30 min. After five times rinsing with deionized water, 100 seeds were sown and germinated in trays (30 cm length, 16 cm width, and 12 cm deep) with 1/2 strength Hoagland’s solution. Plants were incubated in a growth room with the following environmental conditions: temperature 25 °C/20 °C (12 h day/12 h night), photosynthetically active radiation 400 μmol m−2s−1. Two months after plantation, plants were treated with 1 mM solution of cadmium (Cd), lead (Pb), mercury (Hg), chromium (Cr), and arsenic (As), respectively. Three replicates (three pots) were conducted for each heavy metal treatment group in a completely randomized design. Leaf and/or root samples were collected at the following time points 0, 1.5, 3, 6, 12, 24, and 48 h post-treatment with different heavy metals. Tissue samples were stored at −80 °C for further analysis.
2.2. Extraction of Total RNA and Reverse Transcription
Switchgrass tissues weighing 50–100 mg were pulverized using a Tissuelyzer (Qiagen, Germantown, MD, USA), and total RNA was extracted via Trizol reagent (Invitrogen, Carlsbad, CA, USA). The quality of RNA was validated by running the 1.2% agarose gel electrophoresis and visualized by an Analytikjena ScanDrop (Jena, Germany). Total RNA (1 µg) was extracted for each sample and reverse transcribed into the first strand of cDNA using the PrimeScriptTM RT reagent kit (TaKaRa, Dalian, China) and stored at −80 °C for further analysis.
2.3. Design and Validation of Specific Primers
Fourteen candidate reference genes were selected based on previous studies [10,12]. These genes are as follows: 18Sr RNA(GR878775), ACT12(GR878265), ACT2(FL724919), CYP2(FL942644), CYP5(FE633090), eEF1a(GR876801), eEF4a(GR877213), U2AF(FL907910), UBC(GR879761), FTSH4(FL791612), UBQ1(FL955474), UBQ2(FL920273.1), UBQ6(FE609298), and UCE(GR879053). PvZIP4(Pavir.J08901) from the ZIP family and PvPDR8(PTHR19241) from the ABC family in switchgrass were utilized to validate selected reference genes in further gene expression analysis. Specific primers were designed via the Primer Premier 5.0 software and synthesized by Qingke Biotech (Chengdu, China). The sequences of primers for candidate reference genes and transporter genes in RT-qPCR are listed in Table S1. The specificity of primers was validated from the melting curve of RT-qPCR reaction.
2.4. Real-Time PCR
Quantitative analysis via real-time PCR was conducted using a Sosofast Supermix reagent kit (Bio-Rad, Hercules, CA, USA) and the CFX96 real-time PCR system (Bio-Rad, Hercules, CA, USA). The experiment was performed in 20 μL volume of reaction in ice-bath. Reaction reagents were as follows: 1 μL of primer at a final concentration of 0.2 μmol·L−1, 10 μL qPCR SYBR Green SuperMix, 2 μL cDNA, and ddH2O to bring the total volume to 20 μL. The sequential steps of real-time PCR include pre-denaturation at 94 °C for 10 s, denaturation at 94 °C for 10 s, annealing at 62 °C for 5 s, 40 cycles in total. Three technical replicates were performed in a sample mixture with each heavy metal stress at each time point. Then the two closest cycle threshold (Ct) values were used for RT-qPCR analysis.
2.5. Analysis of Stability
The cycle threshold (Ct) value for each reference gene was obtained from RT-qPCR and analyzed through GeNorm [13], NormFinder [14], BestKeeper [15], and RefFinder (http://www.leonxie.com/referencegene.php) software. When the data analysis was performed with GeNorm and NormFinder, the Ct value was first converted to relative quantitative Q value via the formula Q = 2−ΔCt (ΔCt = Ctsample − Ctmin). Ctsample is the Ct value of the housekeeping gene in each of heavy metals treatment; Ct min indicates the lowest Ct value of this housekeeping gene among each of heavy metals treatment. Then the expression stability measurement (M) value was calculated by the GeNorm program for each candidate reference gene. BestKeeper directly utilized the Ct value for stability analysis without the additional converting step to measure the comparisons of the coefficient of variance (CV) and the standard deviation (SD). Finally, RefFinder integrates all three methods mentioned above to calculate the geometric mean for each reference gene and the comprehensive ranking index of stability. A lower index value indicates a higher stability of the reference gene. The optimal number of reference gene was determined by the paired coefficient of variation Vn/Vn+1. It is generally considered that when the value of Vn/Vn+1 is less than 0.15, it is unnecessary to introduce a new reference gene. Otherwise, the (n+1)th reference gene is in need.
2.6. Validation of Reference Genes by Expression Analysis of Two Metal Transporters Genes
The two homologs of metal transporters PvZIP4 and PvPDR8 from switchgrass were obtained from the database (https://phytozome.jgi.doe.gov/pz/portal.html). For the validation of selected reference genes, the expression levels of two genes were analyzed using the most and least stable reference genes under heavy metal stress, calculated using the 2−ΔΔCt method [16]. Three replicate samples were included for each treatment, and three technical replicates were conducted for each biological sample.
3. Results
3.1. Specificity of Primers for Reference Genes
The RT-qPCR reactions were performed using the total RNA reverse transcription products from young leaves and young roots of switchgrass treated by different heavy metals treatment as the template. The results suggested that a distinct single peak was identified in the melting curves of all genes (Figure S1). In addition, the PCR amplification curve of all samples showed great repeatability, indicating that the primers were able to amplify the desired products of each gene with high specificity and no primer dimer. Therefore, our results from RT-qPCR were confirmed to be valid and reliable.
3.2. Analysis of Reference Gene Expression
It has been reported that the Ct value of reference genes is inversely proportional to the expression level of that gene [17]. The greater the Ct value of the reference gene is, the lower the amount of the target gene being expressed in the sample and vice versa. Expression abundance of fourteen reference genes in all samples was analyzed via RT-qPCR (Figure 1; Table S2). Our results demonstrated that the Ct value for each reference gene was in the range of 5–33. The lowest Ct value was found in the 18S rRNA gene ranging between 5 and 15, while its expression abundance was the highest among all the reference genes. The low values were in the case of UBQ2 and ACT12. ACT2 had high value as CYP2 and eEF4a, indicating the lowest expression abundance. The large distribution of Ct values suggested that the expression abundance differs among the reference genes.
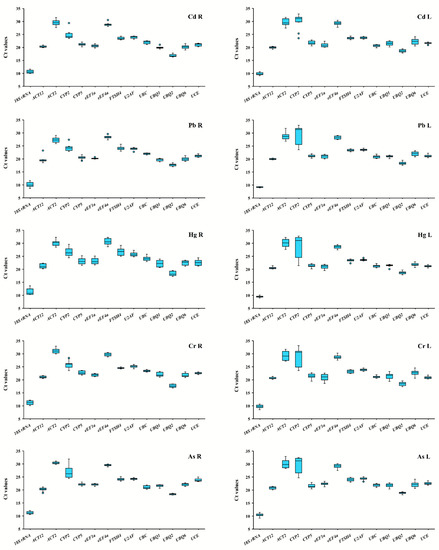
Figure 1.
Median cycle threshold (Ct) values for fourteen candidate reference genes in switchgrass root and leaf samples under heavy metals stress conditions. The variation is displayed as medians values (lines across the box plot), 25th to 75th percentiles (boxes), and the maximum and minimum values (whiskers). Cadmium-treated leaves (CdL) and roots (CdR); lead-treated leaves (PbL) and roots (PbR); mercury-treated leaves (HgL) and roots (HgR); chromium-treated leaves (CrL) and roots (CrR); arsenic-treated leaves (AsL) and roots (AsR), the same below.
3.3. Analysis of Reference Genes Stability
3.3.1. GeNorm Analysis
The expression stability of reference genes was analyzed via GeNorm V3.4 and represented by calculated M values. The lower the M value is, the higher stability the reference gene has and vice versa. Based on this principle, the M value was determined for each reference gene of all samples. Different combination of reference genes was shown to be the most stable ones in roots and leaves responding to each heavy metal stress: UBQ1/FTSH4 in Cd-treated roots (CdR) U2AF/ACT12 in Cd-treated leaves (CdL), eEF1a/U2AF in Pb-treated roots (PbR), 18Sr/ACT12 in Pb-treated leaves (PbL), UBQ1/UCE in Hg-treated roots (HgR), UBQ6/CYP5 in Hg-treated leaves (HgL), UCE/UBC in Cr-treated roots (CrR), UCE/UBC in Cr-treated leaves (CrL), eEF1a/eEF4a in As-treated roots (AsR) and U2AF/ACT12 in As-treated leaves (AsL). However, the overall evaluation suggested that eEF4a and U2AF in both leaf and root tissues displayed the highest stability with the lowest M values under all stress conditions tested (Figure 2).
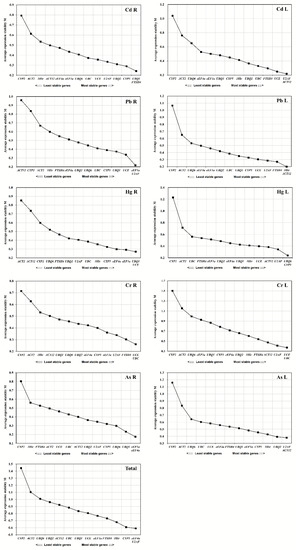
Figure 2.
Expression stability measurement (M) for fourteen candidate reference genes in switchgrass root and leaf samples under heavy metals stress conditions.
When the pairwise variation Vn/Vn+1 value is lower than the threshold of 0.15, the value (n) can be considered as the optimal number of reference genes for accurate normalization [13]. The V2/3 value of reference gene in all samples under the stress of each heavy metals was shown to be smaller than the threshold value 0.15 (Figure 3), indicating that the gene expression analysis needs two reference genes to achieve the best performance. However, the combined use of the four reference genes could be suitable for testing all the considered tissues and stress conditions.
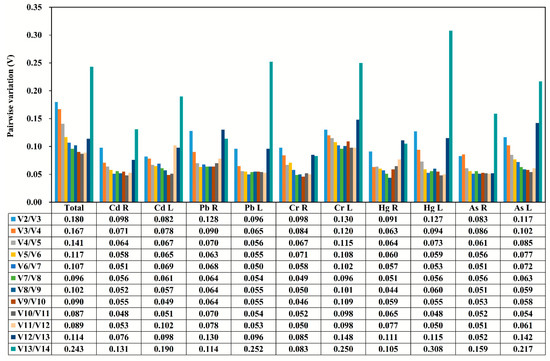
Figure 3.
The pairwise variation (V) measure of the candidate reference genes using GeNorm. Vn/Vn+1 values were used to calculate the optimal number of reference genes (n).
3.3.2. BestKeeper Analysis
The standard deviation (SD) of the Ct value of each housekeeping gene was calculated via BestKeeper V1. With the SD value less than 1, the housekeeping gene is considered as the stable one. Furthermore, the lower the SD value is, the higher stability that gene displays. Reversely, the gene was counted as being not stable if the SD value is higher than 1. Our results demonstrated that the U2AF gene exhibited the highest stability in total, particularly in the root sample treated with Hg and leaf samples treated with Pb, Hg, and As (Table 1). UCE was found to be the most stable reference gene in leaf samples treated with Cd, while eEF4a was identified to be the most stable reference gene for root samples treated with Cd and As. In the root and leaf samples treated with Pb and Cr, respectively, the UBC gene was shown to have the highest stability. When the root samples were treated with Cr, FTSH4 was found to be the most stable gene. Among all of the reference genes, the SD values of the CYP2 gene were demonstrated to be greater than 1 in all treatments except for PbR, indicating the instability of this gene (Table 1).

Table 1.
Expression stability values for switchgrass candidate reference genes calculated by BestKeeper.
3.3.3. NormFinder Analysis
The lower value calculated from NormFinder V20 indicates the higher stability of the housekeeping gene expression. Results demonstrated that U2AF was shown to be the most stable reference gene in leaf samples under stress by Cd and root samples under stress by Hg, Cr, and As (Table 2). CYP5 was ranked as the most stable reference gene in root tissues treated with Cd. In response to Pb stress, 18S rRNA and eEF1a were identified to have the highest stability in both leaf and root tissues. In the leaf samples treated with Hg and Cr, the ACT12 gene was identified to have the highest stability. UBQ2 was shown to be the most stable reference gene in leaves treated with As. Overall evaluation identified four reference genes to be the most stable ones as follows: U2AF (0.463), CYP5 (0.484), UBQ1 (0.539), eEF4a (0.569). CYP2 was shown to be the least stable gene in all samples except for the root tissues treated with Pb and Hg (Table 2).
Table 2.
Expression stability values for switchgrass candidate reference genes calculated by NormFinder.
3.3.4. RefFinder Analysis
RefFinder V1.0 was used to evaluate the comprehensive stability of reference genes integrating the methodologies of GeNorm, NormFinder, and BestKeeper analyses. Our results identified U2AF along with different genes to be the ideal reference genes in leaf tissues treated with Cd, Hg, Cr, As, and as well as root tissues in response to Pb, Hg, Cr, and As stress (Table 3). 18S rRNA and ACT12 were found to be optimal reference genes in Pb treated leaf tissues. In Cd treated root samples, CYP5 and UBQ1 were demonstrated to be the appropriate reference genes. Regarding the unstable reference genes, CYP2 was shown to have the least stability in all treatments except for root tissues with Pb. Furthermore, ACT2 was found to have poor stability in all samples except for root tissues treated with Pb and As (Table 3).
Table 3.
The most stable and least stable combination of reference genes based on RefFinder analysis.
3.4. Detection of Target Gene Expression Levels Normalized by Screened Reference Genes
Recent studies have identified numerous genes involved in heavy metal stress response. The expressions of these genes were shown to function significantly in cellular transportation and enrichment of heavy metals as well as enhancement of plant resistance [18,19]. Especially gene coded proteins involved in the transportation of heavy metals have been extensively studied. These genes include the ABC transporter family, ZIP family, and heavy-metal ATPases (HMA) family, and they are reported to improve the tolerance towards heavy metals in plants [20,21,22]. Based on the comprehensive evaluation of reference genes stability in young leaves and young roots of switchgrass in response to different heavy metals, we selected and combined the reference genes with the least and highest stability to analyze the expression of PvZIP4 gene from ZIP family and PvPDR8 gene from ABC family in leaf and root tissues to validate our candidate reference genes (Figure 4). When CYP5/UBQ1 or U2AF/ACT12 was used as the reference gene pair, the change in relative expressions of target genes in response to Cd treatment was basically consistent. Meanwhile, the expression profile of target genes under Pb stress was also consistent when normalized by eEF1a/U2AF or 18S rRNA/ACT12, indicating that the expression of these reference genes is stable (Figure 4). However, when CYP2 was used as the reference gene, a significant decrease in the relative expression of PvZIP4 in Cd treated root samples shown at 3 h, 6 h, 12 h, 24 h, and 48 h compared to 0 h, was observed, which contradicted with the increasing trend demonstrated by other reference genes. Moreover, by using the CYP2 as the reference gene, the expression of PvPDR8 increased in leaves after 12, 24, and 48 h of Pb treatment compared to 1.5h, 3h, and 6h, as opposed to the time-dependent expression change pattern obtained from the reference genes 18S rRNA, ACT12, or the pair (18S rRNA/ACT12). Our results suggested that CYP2 had the poor stability of expression in young leaf tissues with different treatments, making it not appropriate to adjust the relative expression of target genes in an accurate manner.
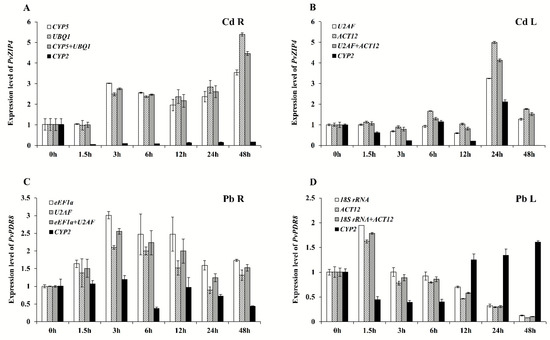
Figure 4.
Expression levels of PvZIP4 and PvPDR8 in switchgrass leaves and roots under Cd and Pb stresses at different times. (A,B) represent expression levels of PvZIP4. (C,D) represent expression levels of PvPDR8. The relative expression levels were fold-change to time 0 h. R, L represent roots and leaves, respectively. Bars indicate standard errors.
4. Discussion
The selection of proper internal reference genes largely depends on the target tissues, cells, and experimental conditions. The internal reference genes display specific differential expression when tissues/organs, developmental stages, and biotic/abiotic stress differ. There is no single internal reference gene which is constantly stable in expression under different experimental conditions in plants. The stability of the conserved reference genes also differs in different plant species. Take the internal reference gene GAPDH as an example, it displays poor expression stability in crops, such as wheat (Triticum aestivum L.) [23] and chicory (Cichorium intybus L.) [24], while being stable in grape (Vitis vinifera L.) [25] and sugarcane (Saccharum officinarum L.) [26]. Nakayama et al. [27] identified that Fbox/60s and Fbox/ABC are proper internal reference genes in the seedling tissue of soybean (Glycine max), while ELF1B and ACTB are identified as appropriate internal reference genes in soybean root tissues. It supports the argument that the internal reference genes display differential expression in different species and tissues. The previous studies showed that the expression of internal reference genes is closely related to experimental conditions. TIP41 in Arabidopsis thaliana L. was stable in expression under the nutrient deficient stress [28], while its expression stability was significantly reduced when the stress was induced by copper and cadmium [29]. In addition, the stability of the reference genes from the same gene family differs. Gutierrez et al. [30] discovered that the expression of the internal reference gene UBQ5 was more stable in Arabidopsis than UBQ4, UBQ10, and UBQ11 though they are from the same gene family. Therefore, it is imperative to select the stable reference gene based on the specific experimental conditions for RT-qPCR.
Switchgrass has gained increasing popularity in the study of energy plants in recent years. The previous studies focused on the expression analysis of internal reference genes in switchgrass under various abiotic stress conditions, such as drought, salinity, high temperature, and water flooding [10,12]. However, it did not delve into the systemic comparative analysis of expression stability of these internal reference genes among different tissues of switchgrass under heavy metal stress, resulting in the possible deviations in quantifications of the expression of target genes in response to different heavy metal treatments. Housekeeping genes are often expressed in cells with an active metabolism, which maintain the basic functions of cells and play an important role in the regulation of the cell cycle. Housekeeping genes are better candidate genes for evaluating gene expression and its functional properties [31]. Commonly used housekeeping genes in Gramineae crop, e.g., actin (ACT), 18S ribosomal RNA protein (18S rRNA), cyclophilin (CYP), eukariotic elongation factor (eEF), splicing factor U2af (U2AF), ftsh protease (FTSH), ubiqutin (UBQ), and ubiqutin conjugating enzyme (UCE) are considered to be suitable due to their presence in all nucleated cell types and essential functions in cell survival. Moreover, their expression has been considered to be stable in various tissues [32,33]. Our study reports the first validation of housekeeping genes in switchgrass allowing the identification of the most suitable reference gene(s) for normalization of RT-qPCR in different plant tissues (roots and leaves) and different time-courses subjected to heavy metal treatments such as by Cd, Pb, Hg, Cr, and As.
To avoid the limitations of using only single software analysis, our study applied three analytical approaches GeNorm, NormFinder, and BestKeeper to determine the expression stability of internal reference genes in different tissues under heavy metal stresses. The basis for evaluating gene stability in GeNorm is to use the logarithmic conversion value (2−ΔCt) of each gene to calculate the average variability (M value) [13]. Meanwhile, GeNorm can determine the optimal number of reference genes required for quantitative analyses: When the comparative difference analysis is performed on the internal reference gene normalization factor (Vn/Vn+1), the n value equals the number of optimal reference genes applied in RT-qPCR analysis. In this study, the gene expression analysis needs two reference genes to achieve the best performance. The combined use of the four house-keeping genes could be suitable for testing all the considered tissues, and stress conditions were based on the pairwise variation Vn/Vn+1 value. However, considering we commonly select only single heavy metal treatment to study the gene regulatory network of plants in response to heavy metal stress, four reference genes for gene normalization in all the considered tissues and stress conditions have limited practical values. The algorithm of NormFinder is similar to GeNorm using the logarithmic conversion value (2−ΔCt) as the relative expression of the gene to calculate the stability of gene expression [14]. BestKeeper focuses on the standard coefficient variation (SD) and variation correlation coefficient (CV) to screen the stability of internal reference genes [15]. The results from these approaches differ due to the algorithm differences. For example, U2AF was determined to be the most stable reference gene by GeNorm and NormFinder. However, it turned out that ACT12 was evaluated as the best in BestKeeper analysis. In addition, GeNorm alone suggested that eEF4a and U2AF were the top selections with the highest stability. The result inconsistency has been reported previously when different analytical software was applied [34]. Therefore, RefFinder integrates the algorithms of GeNorm, NormFinder, and BestKeeper to achieve comprehensive evaluation of the stability of reference genes, avoiding the unilateral judgment from a single method. In this study, U2AF displayed the highest stability in Cd, Hg, Cr, and As treated leaves as well as in Pb, Hg, Cr, and As treated roots of switchgrass. U2AF has been reported in other studies to be the most stable reference gene, such as in Pinus massoniana L., at different stages post-inoculation by nematode [35] and roots/leaves of Paspalum vaginatum Sw. under Cd and cold stress [36]. In the roots of switchgrass subjected to Cd treatment, CYP5 and UBQ1 were determined to be the most appropriate internal reference genes. CYP5 was identified as the most stable reference gene in ganoderma under various experimental conditions [37]. De Andrade et al. [38] found that UBQ1 was stably expressed in leaves of Saccharum spp under the drought stress. 18S rRNA displayed the best stability in Pb treated leaves of switchgrass.
Early selection of internal reference genes is mainly dependent on the assumptions of the essentiality of the housekeeping genes’ functions. For example, based on the essential functions of Actin and TUB in cytoskeleton composition, these genes were speculated to be stably expressed in all cellular and physiological states [39]. However, the stability of internal reference genes can actually vary in different conditions in reality [40]. Actin2 in our study had poor stability under all experimental conditions. Some previous studies claimed that Actin was not the proper internal reference gene in chrysanthemum under abiotic stresses (high temperature, water flooding, aphid) [41] and wild type potato before and after the cold acclimation [42]. However, ACT12, another member of the Actin gene family, was shown to be stably expressed in leaves of switchgrass under the stress of Pb in our study. Thus, the expressions of housekeeping genes are not universally stable among various species in response to different stress conditions. The selection of internal reference genes should be expanded beyond the housekeeping gene families. Cyclophilins (CyPs) are ubiquitous proteins functioning in the folding of certain proteins involved in signal transduction processes. In Solanum tuberosum L., the level of a cyclophilin gene mRNA accumulation is stimulated by the application of abscisic acid and methyl jasmonate in tubers. However, treatment with fungal elicitor or salicilic acid has no such obvious effect [43]. Moreover, CYP mRNA synthesis was also shown to be variable in maize and bean with mercuric chloride treatment and in other abiotic stresses conditions, such as heat, wounding, salt stress, and low temperature [44,45]. In addition, different drugs significantly induced CYP transcription in human tissues [46]. In this study, CYP2 was found to be unstable as a reference gene in all samples except for root tissues treated with Pb. Therefore, particular caution should be taken when CYP is considered as a reliable reference gene.
To validate the selected internal reference genes from the screen, we chose PvZIP4 and PvPDR8 encoding the metal transporters as the target genes with expression induced by heavy metal stress [20,22]. The expression of these target genes in response to Cd and Pb stress was analyzed using two optimal and one poorly stable reference genes. Our results demonstrated that the target genes exhibited a general expression pattern in response to heavy metal stress when CYP5/UBQ1, U2AF/ACT12, eEF1a/U2AF, and 18S rRNA/ACT12 were used as the internal reference genes, while irregular patterns were shown with CYP2 selected to be the reference gene for RT-qPCR analysis. It suggested that the selection of proper internal reference genes is essential for RT-qPCR quantitative analysis.
5. Conclusions
Our study provides a good reference for selecting proper internal reference genes to study the expression of target genes under heavy metal stress in switchgrass. According to the results of RefFinder, U2AF was the best reference gene in Cd, Hg, Cr, and As treated leaves as well as in Hg, Pb, As, and Cr stressed root tissues. 18S rRNA was considered the most stable reference gene in Pb treated leaf tissues. CYP5 was determined to be the optimal reference gene in Cd treated root tissues. While the least stable reference gene was identified to be CYP2 in all tested samples except for root tissues stressed by Pb. In addition, the choice of the combination of the appropriate internal reference genes can significantly impact the analysis of the target gene expression pattern in response to different heavy metal stresses. Our findings established a solid foundation to further study the gene regulatory network of switchgrass in response to heavy metal stress.
Supplementary Materials
The following are available online at https://www.mdpi.com/2073-4425/11/5/502/s1, Figure S1: Melting curves for fourteen candidate reference genes. Table S1. Reference genes and primer sequences. Table S2. Ct value for fourteen candidate reference genes under different heavy metal stresses.
Author Contributions
J.Z. and Y.M. conceived and designed the experiments; J.Z. performed the experiments; J.Z. and M.Z. analyzed the data; Y.M., M.Z., and J.Z. wrote the paper; All authors have read and agreed to the published version of the manuscript.
Funding
This research work was funded by the Sichuan Science and Technology Program (No. 2019YFH0064) and the National Natural Science Foundation of China (81703410).
Conflicts of Interest
The authors declare no conflict of interest.
References
- Hashemi, S.H.; Nematzadeh, G.; Ahmadian, G.; Yamchi, A.; Kuhlmann, M. Identification and validation of Aeluropus littoralis reference genes for Quantitative Real-Time PCR Normalization. J. Biol. Res.-Thessalon. 2016, 23, 18. [Google Scholar] [CrossRef] [PubMed][Green Version]
- Sun, H.P.; Li, F.; Ruan, Q.M.; Zhong, X.H. Identification and validation of reference genes for quantitative real-time PCR studies in Hedera helix L. Plant Physiol. Biochem. 2016, 108, 286–294. [Google Scholar] [CrossRef] [PubMed]
- Patankar, H.V.; Assaha, D.V.M.; Al-Yahyai, R.; Sunkar, R.; Yaish, M.W. Identification of Reference Genes for Quantitative Real-Time PCR in Date Palm (Phoenix dactylifera L.) Subjected to Drought and Salinity. PLoS ONE 2016, 11, e0166216. [Google Scholar] [CrossRef] [PubMed]
- Tchounwou, P.B.; Yedjou, C.G.; Patlolla, A.K.; Sutton, D.J. Heavy metal toxicity and the environment. In Molecular, Clinical and Environmental Toxicology; Luch, A., Ed.; Springer: Basel, Switzerland, 2012; Volume 101, pp. 133–164. [Google Scholar]
- Seiler, C.; Berendonk, T.U. Heavy metal driven co-selection of antibiotic resistance in soil and water bodies impacted by agriculture and aquaculture. Front. Microbiol. 2012, 3, 399. [Google Scholar] [CrossRef]
- Lone, M.I.; He, Z.L.; Stoffella, P.J.; Yang, X.E. Phytoremediation of heavy metal polluted soils and water: Progresses and perspectives. J. Zhejiang Univ. Sci. B 2008, 9, 210–220. [Google Scholar] [CrossRef]
- Balsamo, R.A.; Kelly, W.J.; Satrio, J.A.; Ruiz-Felix, M.N.; Fetterman, M.; Wynn, R.; Hagel, K. Utilization of Grasses for Potential Biofuel Production and Phytoremediation of Heavy Metal Contaminated Soils. Int. J. Phytoremediat. 2015, 17, 448–455. [Google Scholar] [CrossRef]
- Bouton, J.H. Molecular breeding of switchgrass for use as a biofuel crop. Curr. Opin Genet. Dev. 2007, 17, 553–558. [Google Scholar] [CrossRef]
- Parrish, D.J.; Fike, J.H. The Biology and Agronomy of Switchgrass for Biofuels. Crit. Rev. Plant. Sci. 2005, 24, 423–459. [Google Scholar] [CrossRef]
- Gimeno, J.; Eattock, N.; Van Deynze, A.; Blumwald, E. Selection and Validation of Reference Genes for Gene Expression Analysis in Switchgrass (Panicum virgatum) Using Quantitative Real-Time RT-PCR. PLoS ONE 2014, 9, e91474. [Google Scholar] [CrossRef]
- Schmer, M.R.; Vogel, E.K.; Mitchell, R.; Perrin, M.R. Net energy of cellulosic ethanol from switchgrass. Proc. Natl. Acad. Sci. USA 2008, 105, 464–469. [Google Scholar] [CrossRef]
- Huang, L.; Yan, H.; Jiang, X.; Zhang, X.; Zhang, Y.; Huang, X.; Zhang, Y.; Miao, J.; Xu, B.; Frazier, T.; et al. Evaluation of Candidate Reference Genes for Normalization of Quantitative RT-PCR in Switchgrass Under Various Abiotic Stress Conditions. Bioenergy Res. 2014, 7, 1201–1211. [Google Scholar] [CrossRef]
- Vandesompele, J.; De Preter, K.; Pattyn, F.; Poppe, B.; Van Roy, N.; De Paepe, A.; Speleman, F. Accurate normalization of real-time quantitative RT-PCR data by geometric averaging of multiple internal control genes. Genome Biol. 2002, 3, RESEARCH0034. [Google Scholar] [CrossRef] [PubMed]
- Andersen, C.L.; Jensen, J.L.; Orntoft, T.F. Normalization of real-time quantitative reverse transcription-PCR data: A model-based variance estimation approach to identify genes suited for normalization, applied to bladder and colon cancer data sets. Cancer Res. 2004, 64, 5245–5250. [Google Scholar] [CrossRef] [PubMed]
- Pfaffl, M.W.; Tichopad, A.; Prgomet, C.; Neuvians, T.P. Determination of stable housekeeping genes, differentially regulated target genes and sample integrity: BestKeeper-Excel-Based tool using pair-wise correlations. Biotechnol. Lett. 2004, 26, 509–515. [Google Scholar] [CrossRef]
- Livak, K.J.; Schmittgen, T.D. Analysis of Relative Gene Expression Data Using Real-Time Quantitative PCR and the 2-ΔΔCT Method. Methods 2001, 25, 402–408. [Google Scholar] [CrossRef]
- Wang, Y.; Yu, K.; Poysa, V.; Shi, C.; Zhou, Y. Selection of reference genes for normalization of qRT-PCR analysis of differentially expressed genes in soybean exposed to cadmium. Mol. Biol. Rep. 2012, 39, 1585–1594. [Google Scholar] [CrossRef]
- Grennan, A.K. Identification of Genes Involved in Metal Transport in Plants. Plant. Physiol. 2009, 149, 1623–1624. [Google Scholar] [CrossRef]
- Ueno, D.; Iwashita, T.; Zhao, F.J.; Ma, J.F. Characterization of Cd Translocation and Identification of the Cd Form in Xylem Sap of the Cd-Hyperaccumulator Arabidopsis halleri. Plant. Cell Physiol. 2008, 49, 540–548. [Google Scholar] [CrossRef]
- Guerinot, M.L. The ZIP family of metal transporters. Biochim. Biophys. Acta 2000, 1465, 190–198. [Google Scholar] [CrossRef]
- Ueno, D.; Yamaji, N.; Kono, I.; Huang, C.F.; Ando, T.; Yano, M.; Ma, J.F. Gene limiting cadmium accumulation in rice. Proc. Natl. Acad. Sci. USA 2010, 107, 16500–16505. [Google Scholar] [CrossRef]
- Feng, J.; Jia, W.; Lv, S.; Bao, H.; Miao, F.; Zhang, X.; Wang, J.; Li, J.; Li, D.; Zhu, C. Comparative transcriptome combined with morpho-physiological analyses revealed key factors for differential cadmium accumulation in two contrasting sweet sorghum genotypes. Plant. Biotechnol. J. 2018, 107, 558–571. [Google Scholar] [CrossRef] [PubMed]
- Long, X.Y.; Wang, J.R.; Ouellet, T.; Rocheleau, H.; Wei, Y.M.; Pu, Z.E.; Jiang, Q.T.; Lan, X.J.; Zheng, Y.L. Genome-wide identification and evaluation of novel internal control genes for Q-PCR based transcript normalization in wheat. Plant. Mol. Biol. 2011, 74, 307–311. [Google Scholar] [CrossRef] [PubMed]
- Maroufi, A.; Bockstaele, E.V.; Loose, M.D. Validation of reference genes for gene expression analysis in chicory (Cichorium intybus) using quantitative real-time PCR. BMC Mol. Biol. 2010, 11, 15. [Google Scholar] [CrossRef] [PubMed]
- Reid, K.E.; Olsson, N.; Schlosser, J.; Peng, F.; Lund, S.T. An optimized grapevine RNA isolation procedure and statistical determination of reference genes for real-time RT-PCR during berry development. BMC Plant. Biol. 2006, 6, 27. [Google Scholar] [CrossRef] [PubMed]
- Iskandar, H.M.; Simpson, R.S.; Casu, R.E.; Bonnett, G.D.; Maclean, D.J.; Manners, J.M. Comparison of reference genes for quantitative real-time polymerase chain reaction analysis of gene expression in sugarcane. Plant. Mol. Biol. Report. 2004, 22, 325–337. [Google Scholar] [CrossRef]
- Nakayama, T.J.; Rodrigues, F.A.; Neumaier, N.; Marcelino-Guimarães, F.C.; Farias, J.R.; de Oliveira, M.C.; Borém, A.; de Oliveira, A.C.; Emygdio, B.M.; Nepomuceno, A.L. Reference genes for quantitative real-time polymerase chain reaction studies in soybean plants under hypoxic conditions. Genet. Mol. Res. 2014, 13, 860–871. [Google Scholar] [CrossRef]
- Czechowski, T.; Stitt, M.; Altmann, T.; Udvardi, M.K.; Scheible, W.R. Genome-Wide Identification and Testing of Superior Reference Genes for Transcript Normalization in Arabidopsis. Plant. Physiol. 2005, 139, 5–17. [Google Scholar] [CrossRef]
- Remans, T.; Smeets, K.; Opdenakker, K.; Mathijsen, D.; Vangronsveld, J.; Cuypers, A. Normalisation of real-time RT-PCR gene expression measurements in Arabidopsis thaliana exposed to increased metal concentrations. Planta 2008, 227, 1343–1349. [Google Scholar] [CrossRef]
- Gutierrez, L.; Mauriat, M.; Guénin, S.; Pelloux, J.; Lefebvre, J.-F.; Louvet, R.; Rusterucci, C.; Moritz, T.; Guerineau, F.; Bellini, C.; et al. The lack of a systematic validation of reference genes: A serious pitfall undervalued in reverse transcription-polymerase chain reaction (RT-PCR) analysis in plants. Plant. Biotechnol. J. 2008, 6, 609–618. [Google Scholar] [CrossRef]
- Warrington, J.A.; Nair, A.; Mahadevappa, M.; Tsyganskaya, M. Comparison of human adult and fetal expression and identification of 535 housekeeping/maintenance genes. Physiol. Genom. 2000, 2, 143–147. [Google Scholar] [CrossRef]
- Almas, D.E.; Kamrodi, A.R. Validation of Appropriate Reference Genes for Real-Time Quantitative PCR Gene Expression Analysis in Rice Plants Exposed to Metal Stresses. Russ. J. Plant. Physiol. 2018, 65, 890–897. [Google Scholar] [CrossRef]
- Lin, Y.; Zhang, C.; Lan, H.; Gao, S.; Liu, H.; Liu, J.; Cao, M.; Pan, G.; Rong, T.; Zhang, S. Validation of Potential Reference Genes for qPCR in Maize across Abiotic Stresses, Hormone Treatments, and Tissue Types. PLoS ONE 2014, 9, e95445. [Google Scholar] [CrossRef] [PubMed]
- Hong, S.Y.; Seo, P.J.; Yang, M.S.; Xiang, F.; Park, C.M. Exploring valid reference genes for gene expression studies in Brachypodium distachyon by real-time PCR. BMC Plant. Biol. 2008, 8, 112. [Google Scholar] [CrossRef] [PubMed]
- Wei, Y.; Liu, Q.; Dong, H.; Zhou, Z.; Hao, Y.; Chen, X.; Xu, L. Selection of Reference Genes for Real-Time Quantitative PCR in Pinus massoniana Post Nematode Inoculation. PLoS ONE 2016, 11, e0147224. [Google Scholar] [CrossRef]
- Liu, Y.; Liu, J.; Xu, L.; Lai, H.; Chen, Y.; Yang, Z.; Huang, B. Identification and Validation of Reference Genes for Seashore Paspalum Response to Abiotic Stresses. Int. J. Mol. Sci. 2017, 18, 1322. [Google Scholar] [CrossRef]
- Xu, Z.; Xu, J.; Ji, A.; Zhu, Y.; Zhang, X.; Hu, Y.; Song, J.; Chen, S. Genome-wide selection of superior reference genes for expression studies in Ganoderma lucidum. Gene 2015, 574, 352–358. [Google Scholar] [CrossRef]
- de Andrade, L.M.; dos Santos Brito, M.; Junior, R.F.P.; Marchiori, P.E.R.; Nóbile, P.M.; Martins, A.P.B.; Ribeiro, R.V.; Creste, S. Reference genes for normalization of qPCR assays in sugarcane plants under water deficit. Plant. Methods 2017, 13, 28. [Google Scholar] [CrossRef]
- Luo, H.; Luo, K.; Luo, L.; Li, E.X.; Guan, B.; Xiong, D.; Sun, B.; Peng, K.; Yang, B. Evaluation of candidate reference genes for gene expression studies in Cymbidium kanran. Sci. Hortic. 2014, 167, 43–48. [Google Scholar] [CrossRef]
- Die, J.V.; Román, B.; Nadal, S.; González-Verdejo, C.I. Evaluation of candidate reference genes for expression studies in Pisum sativum under different experimental conditions. Planta 2010, 232, 145–153. [Google Scholar] [CrossRef]
- Gu, C.; Chen, S.; Liu, Z.; Shan, H.; Luo, H.; Guan, Z.; Chen, F. Reference Gene Selection for Quantitative Real-Time PCR in Chrysanthemum Subjected to Biotic and Abiotic Stress. Mol. Biotechnol. 2011, 49, 192–197. [Google Scholar] [CrossRef]
- Li, F.; Xu, J.F.; Liu, J.; Duan, S.G.; Lei, Z.G.; Jiwan, P.; Jin, L.P. Selection of Reference Genes from Wild Potato Solanum acaule before and after Cold Acclimation. Southwest China J. Agric. Sci. 2012, 25, 1592–1595. [Google Scholar]
- Godoy, A.V.; Lazzaro, A.S.; Casalongué, C.A.; Segundo, B.S. Expression of a Solanum tuberosum cyclophilin gene is regulated by fungal infection and abiotic stress conditions. Plant. Sci. 2000, 152, 123–134. [Google Scholar] [CrossRef]
- Marivet, J.; Frendo, P.; Burkard, G. DNA sequence analysis of a cyclophilin gene from maize: Developmental expression and regulation by salicylic acid. Mol. Gen. Genet. 1995, 247, 222–228. [Google Scholar] [CrossRef] [PubMed]
- Marivet, J.; Frendo, P.; Burkard, G. Effects of abiotic stresses on cyclophilin gene expression in maize and bean and sequence analysis of bean cyclophilin cDNA. Plant. Sci. 1992, 84, 171–178. [Google Scholar] [CrossRef]
- Perez, G.; Tabares, B.; Jover, R.; Gomez-Lechon, M.-J.; Castell, J.V. Semi-automatic quantitative RT-PCR to measure CYP induction by drugs in human hepatocytes. Toxicol. In Vitro 2003, 17, 643–649. [Google Scholar] [CrossRef]
© 2020 by the authors. Licensee MDPI, Basel, Switzerland. This article is an open access article distributed under the terms and conditions of the Creative Commons Attribution (CC BY) license (http://creativecommons.org/licenses/by/4.0/).