A High Quality Asian Genome Assembly Identifies Features of Common Missing Regions

 , , , , , , and
Abstract
:1. Introduction
2. Materials and Methods
2.1. Comparison between the Reference Genome (GRCh38) and the AK1
2.2. Study Samples and Materials for the Profiling of Sequencing Reads to the Reference Genome (GRCh38)
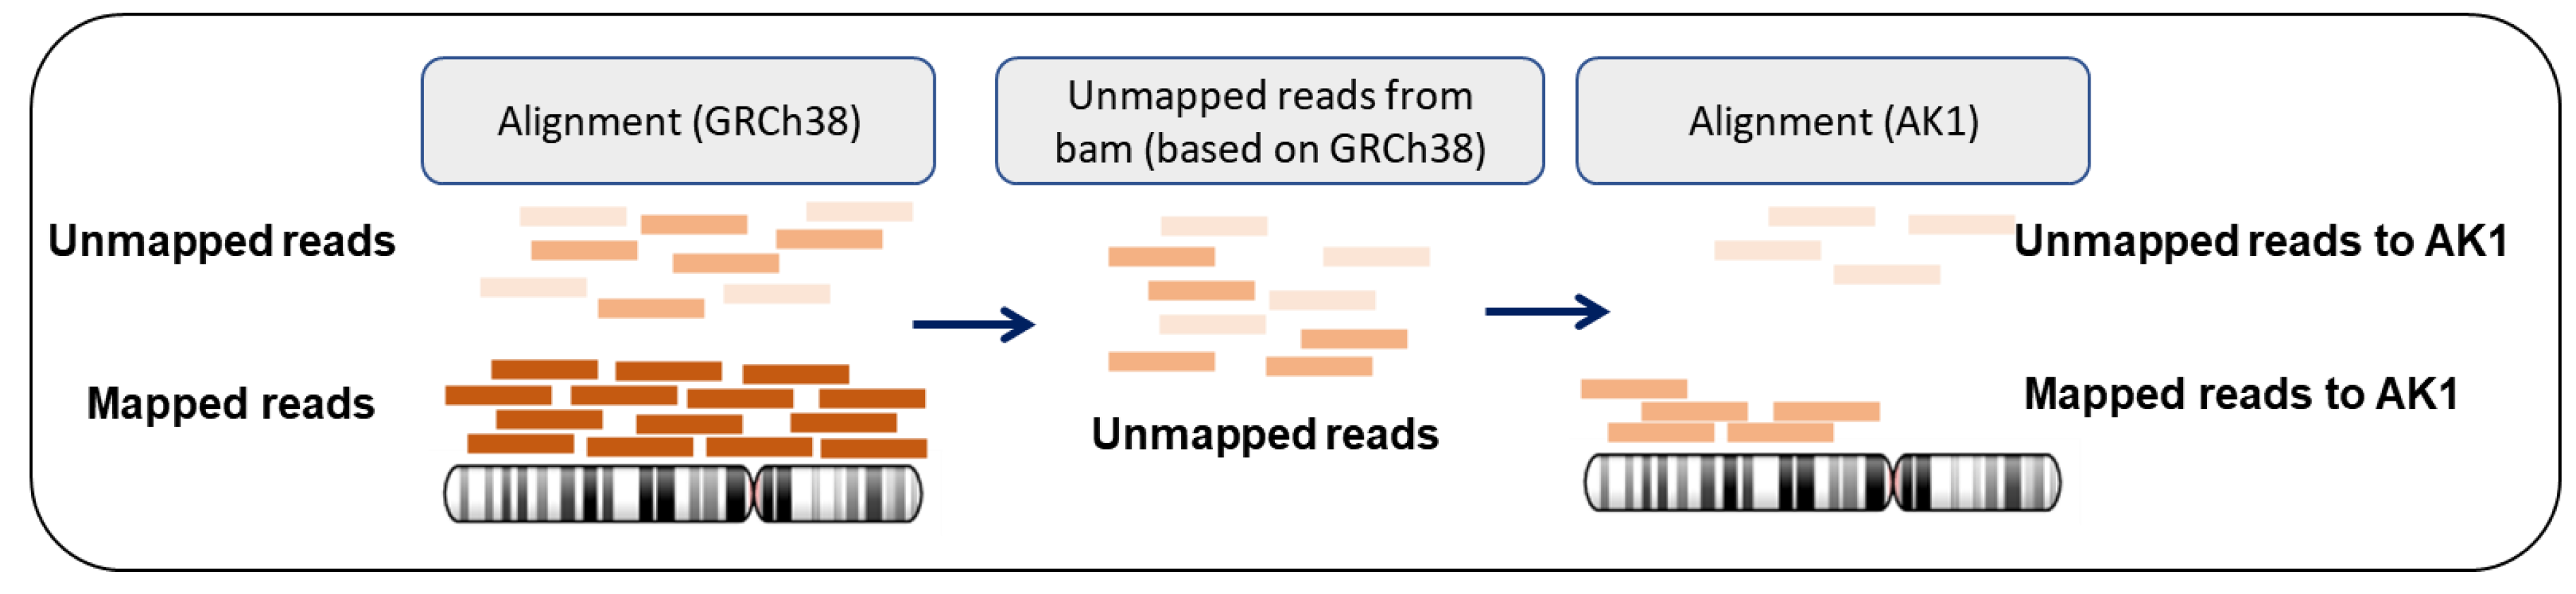
2.3. Investigation of the Characteristics of Mapped/Unmapped Reads from BAM Files and Realignment of the Extracted “Unmapped Reads” against the AK1 Genome Assembly
2.4. Functional Search for the Common Missing Regions
2.5. Verification of the Missing Regions by PCR
3. Results
3.1. Systematic Comparison between GRCh38 p.12 and AK1
3.2. Profile of the “Unmapped Reads”
3.3. Genomic Regions Recovered by “Realignment” to AK1
3.4. Characterization and Heterogeneity of Common Missing Parts
4. Discussion
Supplementary Materials
Author Contributions
Funding
Acknowledgments
Conflicts of Interest
Data and Materials Availability
References
- Schneider, V.A.; Graves-Lindsay, T.; Howe, K.; Bouk, N.; Chen, H.C.; Kitts, P.A.; Murphy, T.D.; Pruitt, K.D.; Thibaud-Nissen, F.; Albracht, D.; et al. Evaluation of GRCh38 and de novo haploid genome assemblies demonstrates the enduring quality of the reference assembly. Genome Res. 2017, 27, 849–864. [Google Scholar] [CrossRef] [PubMed] [Green Version]
- 1000 Genomes Project Consortium; Auton, A.; Brooks, L.D.; Durbin, R.M.; Garisson, E.P.; Kang, H.M.; Korbel, J.O.; Marchini, J.L.; Mccarthy, S.; McVean, G.; et al. A global reference for human genetic variation. Nature 2015, 526, 68–74. [Google Scholar] [CrossRef] [PubMed] [Green Version]
- Sudmant, P.H.; Mallick, S.; Nelson, B.J.; Hormozdiari, F.; Krumm, N.; Huddleston, J.; Coe, B.P.; Baker, C.; Nordenfelt, S.; Bamshad, M.; et al. Global diversity, population stratification, and selection of human copy-number variation. Science 2015, 349, aab3761. [Google Scholar] [CrossRef] [PubMed] [Green Version]
- Mondal, M.; Casals, F.; Xu, T.; Dall’Olio, G.M.; Pybus, M.; Netea, M.G.; Comas, D.; Laayouni, H.; Li, Q.; Majumder, P.P.; et al. Genomic analysis of Andamanese provides insights into ancient human migration into Asia and adaptation. Nat. Genet. 2016, 48, 1066–1070. [Google Scholar] [CrossRef]
- Maretty, L.; Jensen, J.M.; Petersen, B.; Sibbesen, J.A.; Liu, S.; Villesen, P.; Skov, L.; Belling, K.; Theil Have, C.; Izarzugaza, J.M.G.; et al. Sequencing and de novo assembly of 150 genomes from Denmark as a population reference. Nature 2017, 548, 87–91. [Google Scholar] [CrossRef] [Green Version]
- Genovese, G.; Handsaker, R.E.; Li, H.; Kenny, E.E.; McCarroll, S.A. Mapping the human reference genome’s missing sequence by three-way admixture in Latino genomes. Am. J. Hum. Genet. 2013, 93, 411–421. [Google Scholar] [CrossRef] [Green Version]
- Chen, G.; Li, R.; Shi, L.; Qi, J.; Hu, P.; Luo, J.; Liu, M.; Shi, T. Revealing the missing expressed genes beyond the human reference genome by RNA-Seq. BMC Genom. 2011, 12, 590. [Google Scholar] [CrossRef] [Green Version]
- Sherman, R.M.; Forman, J.; Antonescu, V.; Puiu, D.; Daya, M.; Rafaels, N.; Boorgula, M.P.; Chavan, S.; Vergara, C.; Ortega, V.E.; et al. Assembly of a pan-genome from deep sequencing of 910 humans of African descent. Nat. Genet. 2018, 51, 30–35. [Google Scholar] [CrossRef]
- Kehr, B.; Helgadottir, A.; Melsted, P.; Jonsson, H.; Helgason, H.; Jonasdottir, A.; Jonasdottir, A.; Sigurdsson, A.; Gylfason, A.; Halldorsson, G.H.; et al. Diversity in non-repetitive human sequences not found in the reference genome. Nat. Genet. 2017, 49, 588–593. [Google Scholar] [CrossRef]
- Duan, Z.; Qiao, Y.; Lu, J.; Lu, H.; Zhang, W.; Yan, F.; Sun, C.; Hu, Z.; Zhang, Z.; Li, G.; et al. HUPAN: A pan-genome analysis pipeline for human genomes. Genome Biol. 2019, 20, 149. [Google Scholar] [CrossRef] [Green Version]
- Audano, P.A.; Sulovari, A.; Graves-Lindsay, T.A.; Cantsilieris, S.; Sorensen, M.; Welch, A.E.; Dougherty, M.L.; Nelson, B.J.; Shah, A.; Dutcher, S.K.; et al. Characterizing the Major Structural Variant Alleles of the Human Genome. Cell 2019, 176, 663–675 e619. [Google Scholar] [CrossRef] [PubMed] [Green Version]
- Li, R.; Tian, X.; Yang, P.; Fan, Y.; Li, M.; Zheng, H.; Wang, X.; Jiang, Y. Recovery of non-reference sequences missing from the human reference genome. BMC Genom. 2019, 20, 746. [Google Scholar] [CrossRef] [PubMed]
- Seo, J.S.; Rhie, A.; Kim, J.; Lee, S.; Sohn, M.H.; Kim, C.U.; Hastie, A.; Cao, H.; Yun, J.Y.; Kim, J.; et al. De novo assembly and phasing of a Korean human genome. Nature 2016, 538, 243–247. [Google Scholar] [CrossRef] [PubMed] [Green Version]
- Harris, R.S. Improved Pairwise Alignment of Genomic DNA. Ph.D. Thesis, Pennsylvania State University, State College, PA, USA, 2007. [Google Scholar]
- Li, H.; Durbin, R. Fast and accurate short read alignment with Burrows-Wheeler transform. Bioinformatics 2009, 25, 1754–1760. [Google Scholar] [CrossRef] [Green Version]
- Tischler, G.; Steven, L. Biobambam: Tools for read pair collation based algorithms on BAM files. Source Code Biol. Med. 2014, 9, 13. [Google Scholar] [CrossRef] [Green Version]
- McKenna, A.; Hanna, M.; Banks, E.; Sivachenko, A.; Cibulskis, K.; Kernytsky, A.; Garimella, K.; Altshuler, D.; Gabriel, S.; Daly, M.; et al. The Genome Analysis Toolkit: A MapReduce framework for analyzing next-generation DNA sequencing data. Genome Res. 2010, 20, 1297–1303. [Google Scholar] [CrossRef] [Green Version]
- Andrews, S. FastQC: A Quality Control Tool for High Throughput Sequence Data. 2010. Available online: http://www.bioinformatics.babraham.ac.uk/projects/fastqc/ (accessed on 20 June 2019).
- Smit, A.; Hubley, R.; Green, P. RepeatMasker Open-4.0. 2015. Available online: http://www.repeatmasker.org/ (accessed on 11 July 2019).
- Sims, D.; Sudbery, I.; Ilott, N.E.; Heger, A.; Ponting, C.P. Sequencing depth and coverage: Key considerations in genomic analyses. Nat. Rev. Genet. 2014, 15, 121–132. [Google Scholar] [CrossRef]
- Quinlan, A.R.; Hall, I.M. BEDTools: A flexible suite of utilities for comparing genomic features. Bioinformatics 2010, 26, 841–842. [Google Scholar] [CrossRef] [Green Version]
- Walker, M.A.; Pedamallu, C.S.; Ojesina, A.I.; Bullman, S.; Sharpe, T.; Whelan, C.W.; Meyerson, M. GATK PathSeq: A customizable computational tool for the discovery and identification of microbial sequences in libraries from eukaryotic hosts. Bioinformatics 2018, 34, 4287–4289. [Google Scholar] [CrossRef] [Green Version]
- Camacho, C.; Coulouris, G.; Avagyan, V.; Ma, N.; Papadopoulos, J.; Bealer, K.; Madden, T.L. BLAST+: Architecture and applications. BMC Bioinform. 2009, 10, 421. [Google Scholar] [CrossRef] [Green Version]
- Karolchik, D.; Baertsch, R.; Diekhans, M.; Furey, T.S.; Hinrichs, A.; Lu, Y.; Roskin, K.M.; Schwartz, M.; Sugnet, C.W.; Thomas, D.; et al. The UCSC genome browser database. Nucleic Acids Res. 2003, 31, 51–54. [Google Scholar] [CrossRef] [PubMed]
- Robinson, J.T.; Thorvaldsdottir, H.; Winckler, W.; Guttman, M.; Lander, E.S.; Getz, G.; Mesirov, J.P. Integrative genomics viewer. Nat. Biotechnol. 2011, 29, 24–26. [Google Scholar] [CrossRef] [Green Version]
- Kent, W.J. BLAT—the BLAST-like alignment tool. Genome Res. 2002, 12, 656–664. [Google Scholar] [CrossRef] [PubMed] [Green Version]
- Untergasser, A.; Cutcutache, I.; Koressaar, T.; Ye, J.; Faircloth, B.C.; Remm, M.; Rozen, S.G. Primer3--new capabilities and interfaces. Nucleic Acids Res. 2012, 40, e115. [Google Scholar] [CrossRef] [PubMed] [Green Version]
- Wong, K.H.Y.; Levy-Sakin, M.; Kwok, P.Y. De novo human genome assemblies reveal spectrum of alternative haplotypes in diverse populations. Nat. Commun. 2018, 9, 3040. [Google Scholar] [CrossRef]
- Fan, X.; Chaisson, M.; Nakhleh, L.; Chen, K. HySA: A Hybrid Structural variant Assembly approach using next-generation and single-molecule sequencing technologies. Genome Res. 2017, 27, 793–800. [Google Scholar] [CrossRef] [Green Version]
- Ta, H. BioEdit: A user-friendly biological sequence alignment editor and analysis program for Windows 95/98/NT. Nucl. Acids Symp. Ser. 1999, 41, 95–98. [Google Scholar]
- Derrien, T.; Estelle, J.; Marco Sola, S.; Knowles, D.G.; Raineri, E.; Guigo, R.; Ribeca, P. Fast computation and applications of genome mappability. PLoS ONE 2012, 7, e30377. [Google Scholar] [CrossRef]
- Pockrandt, C.; Alzamel, M.; Iliopoulos, C.S.; Reinert, K. GenMap: Ultra-fast computation of genome mappability. Bioinformatics 2020, 36, 3687–3692. [Google Scholar] [CrossRef]


| All | Group 1 | Group 2 | Group 3 | |
|---|---|---|---|---|
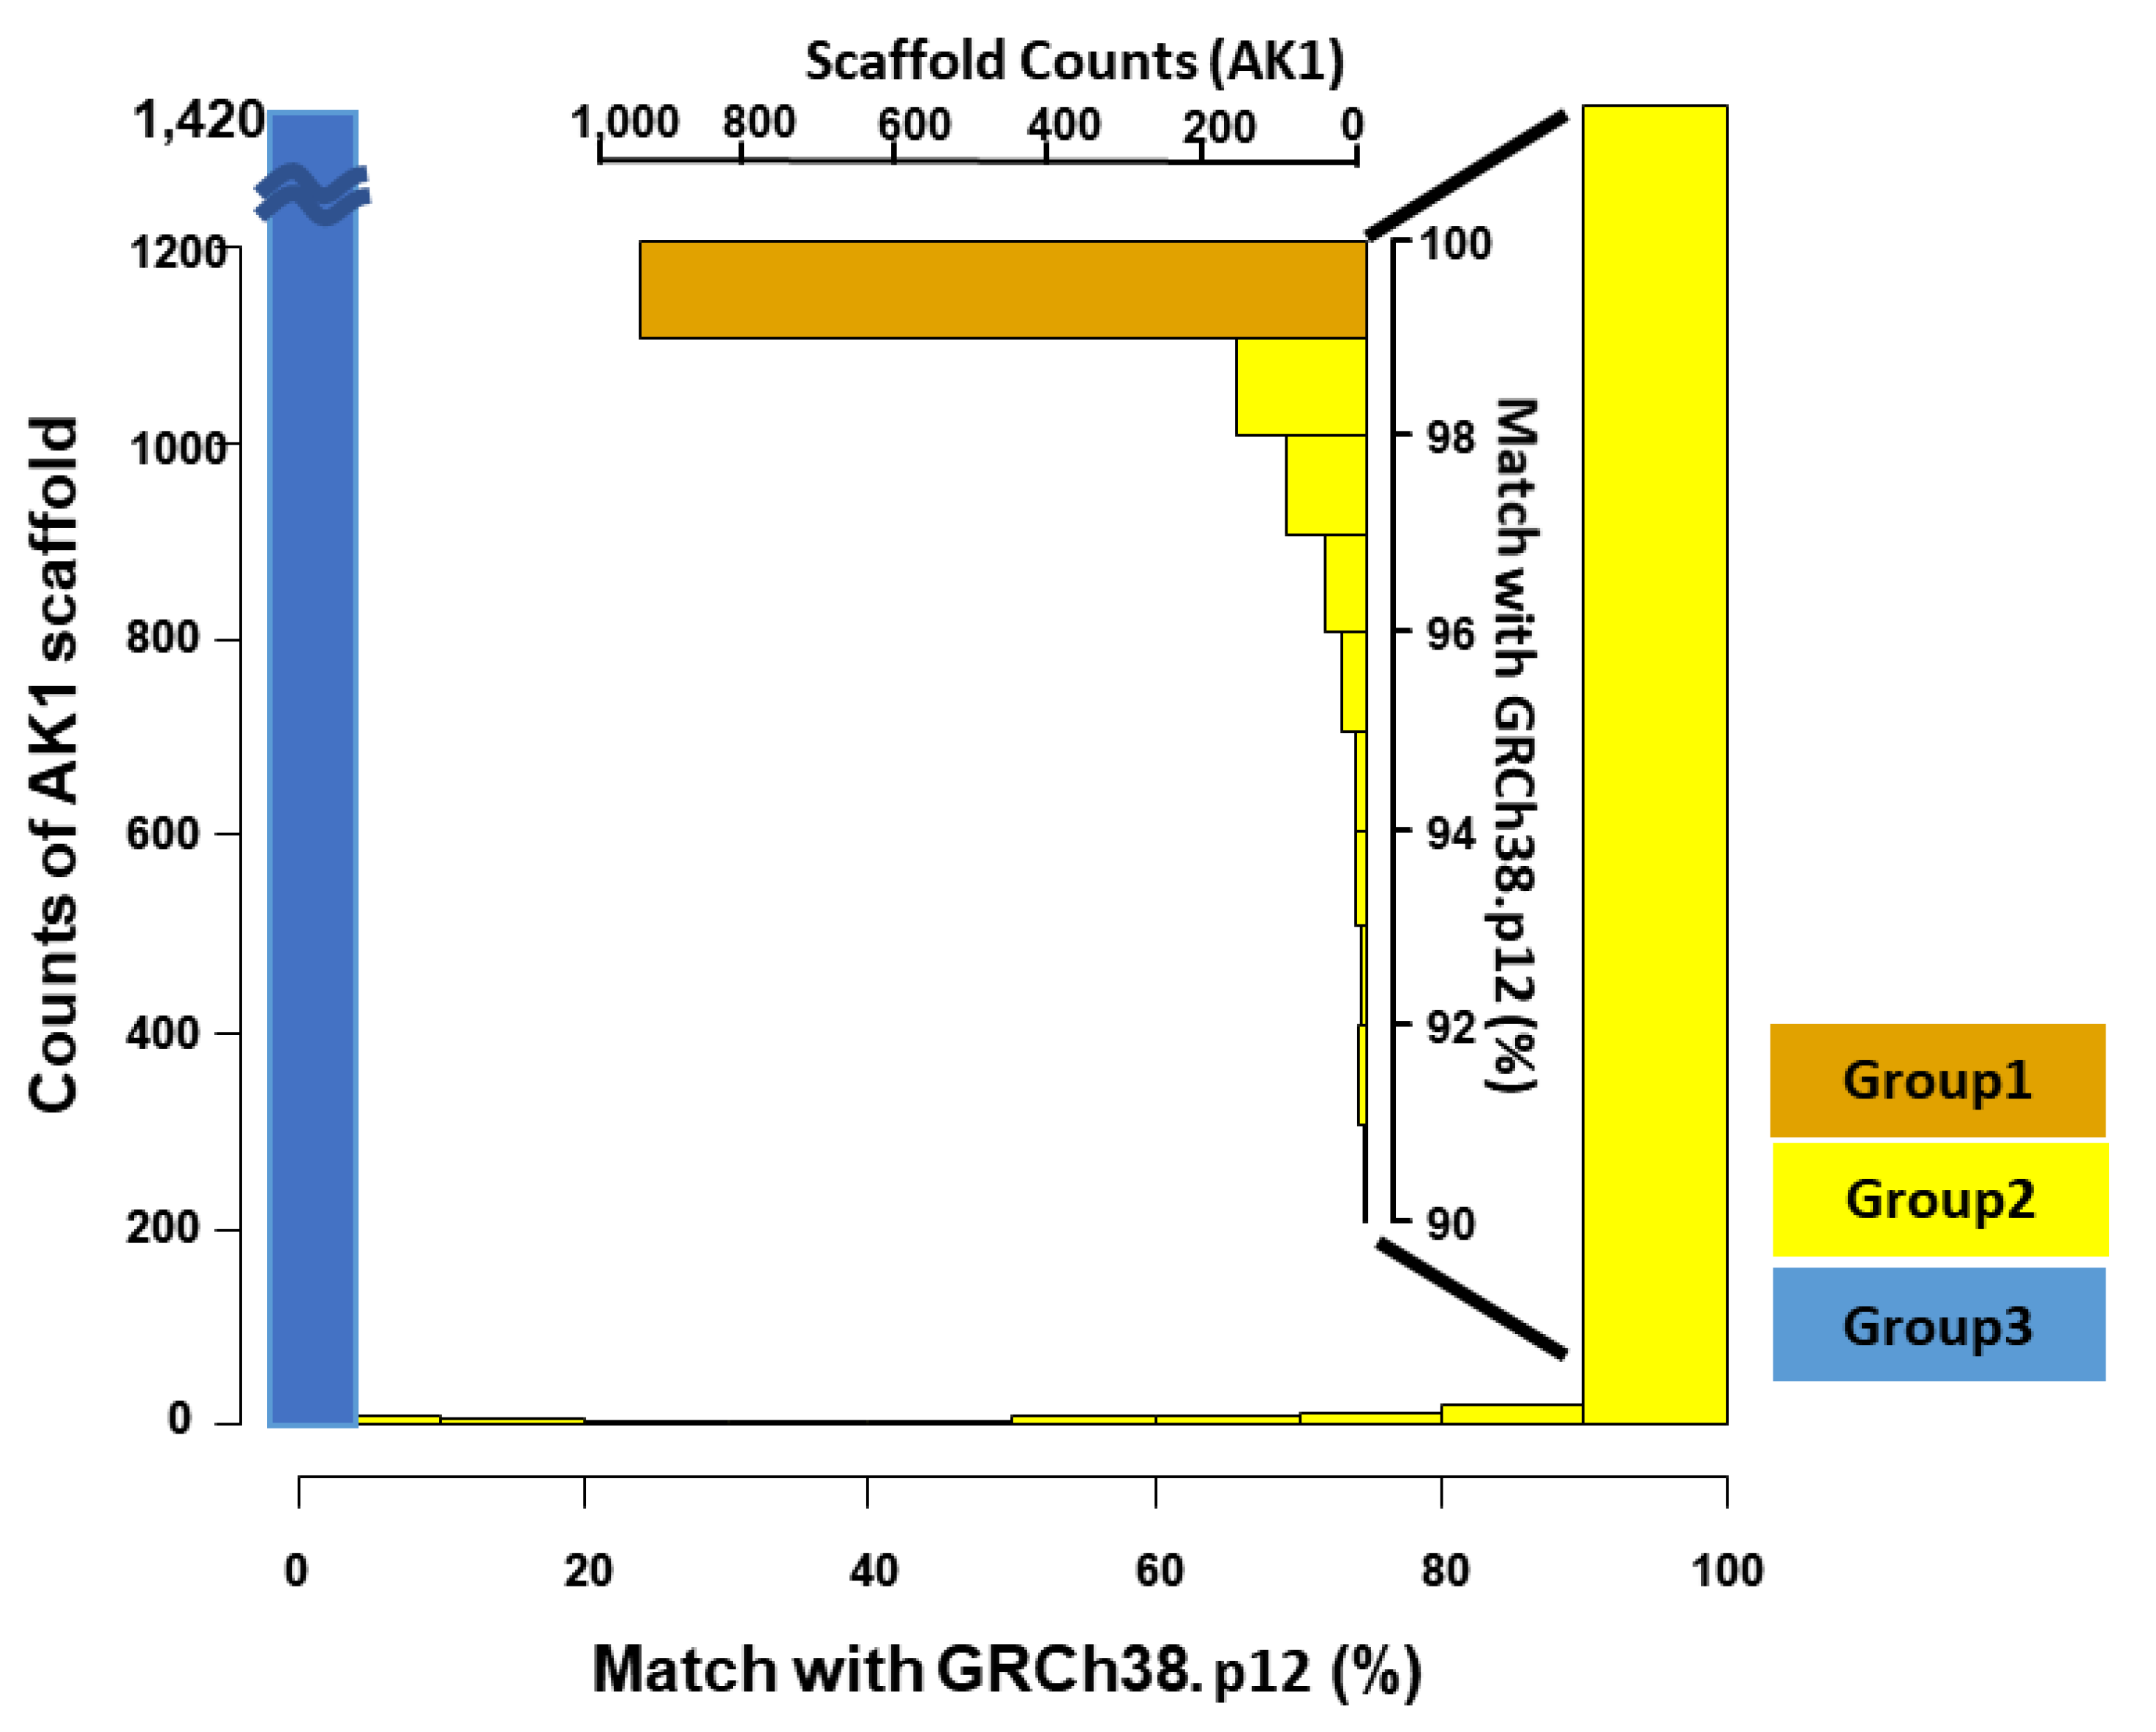
| Number of Scaffolds | 2832 | 945 | 467 | 1420 |
| Total scaffold size (Scaffold N50) | 2904 Mb (44.85 Mb) | 2,697 Mb (45.09 Mb) | 165 Mb (13.74 Mb) | 41 Mb (34.60 kb) |
| Size matched with GRCh38.p12 (%) | 2851 Mb (98.2) | 2691 Mb (99.8) | 160 Mb (96.2) | 0 |
| by Sequence types Chromosomes (or alternative) | 2839 Mb | 2681 Mb | 158 Mb | 0 |
| Fix | 8047 kb | 7831 kb | 216 kb | 0 |
| Random | 2783 kb | 1906 kb | 878 kb | 0 |
| Unknown chromosomes | 1005 kb | 648 kb | 358 kb | 0 |
| Scaffolds matched multiple chromosomes of GRCh38.p12 | 487 | 343 | 144 | 0 |
| Total size of scaffolds contributed from multiple chromosomes * | 22.2 Mb | 21.1 Mb | 1.1 Mb | 0 |
| Sample ID | Ancestry | Population | Total Number of Unmapped Reads (K) | Unpaired Reads, Counts (K) (%) | Mapped on AK1, Read Counts (K) * Mapping Rate (%) | Suggestive Microbial Origin, Read Count | ||||
|---|---|---|---|---|---|---|---|---|---|---|
| Overall | Mapping Quality > 10 | |||||||||
| HG02922 | AFR | Esan | 59,751 | Average 42,613 | 36,871 (61.7) | 205 (0.9) | Mean % 0.90 | 110 (0.5) | Mean % 0.46 | 318 |
| HG03052 | Mende | 34,958 | 21,174 (60.6) | 127 (0.9) | 67 (0.5) | 401 | ||||
| NA19625 | African-American SW | 48,718 | 34,396 (70.6) | 121 (0.8) | 63 (0.4) | 353 | ||||
| HG01879 | African-Caribbean | 35,674 | 198,064 (55.5) | 165 (1.0) | 78 (0.5) | 1191 | ||||
| NA19017 | Luhya | 33,965 | 20,442 (60.2) | 96 (0.7) | 56 (0.4) | 2188 | ||||
| HG00419 | EAS | South. Han Chinese | 34,935 | Average 36,474 | 22,398 (64.1) | 131 (1.0) | Mean % 0.95 | 66 (0.5) | Mean % 0.51 | 527 |
| NA18525 | Han Chinese | 15,620 | 8,759 (56.1) | 51 (0.7) | 34 (0.5) | 517 | ||||
| HG01595 | Kinh Vietnamese | 59,355 | 31,507 (53.1) | 265 (1.0) | 140 (0.5) | 3405 | ||||
| NA18939 | Japanese | 27,950 | 15,520 (55.5) | 127 (1.0) | 66 (0.5) | 522 | ||||
| HG00759 | Dai Chinese | 44,510 | 21,418 (48.1) | 234 (1.0) | 117 (0.5) | 512 | ||||
| NA20502 | EUR | Tuscan | 26,343 | Average 26,711 | 19,640 (74.6) | 57 (0.9) | Mean % 0.88 | 33 (0.5) | Mean % 0.49 | 1557 |
| HG00096 | British | 29,915 | 16,773 (56.1) | 108 (0.8) | 64 (0.5) | 1878 | ||||
| HG01500 | Spanish | 31,331 | 15,726 (50.2) | 164 (1.1) | 76 (0.5) | 2423 | ||||
| HG00268 | Finnish | 19,255 | 12,139 (63.0) | 58 (0.8) | 36 (0.5) | 289 | ||||
| Total Average (Mean ± sd) | 35,877 ± 13,193 | 21,184 ± 8091 (59.0%) | 137± 65 (0.92%) | 71 ±31 (0.49%) | 1149 ± 988 | |||||
| Family | 110 Regions (More than Ten Reads Are Mapped in More than Two Samples | 38 Regions (More than Ten Reads Are Mapped in More than Seven Samples) | |
|---|---|---|---|
| Mean % (SD) | Mean % (SD) | ||
| SINE | All | 8.01(9.85) | 2.54 (5.41) |
| ALUs | 6.41 (12.25) | 0.27 (1.63) | |
| MIRs | 1.6 (6.65) | 2.27 (7.37) | |
| LINE | All | 7.34 (13.35) | 3.64 (13.80) |
| LINE1 | 5.13 (15.50) | 3.64 (13.80) | |
| LINE2 | 2.21 (10.77) | 0 | |
| L3/CR1 | 0 | 0 | |
| LTR | All | 2.47(4.79) | 0.56 (2.50) |
| ERVL | 0.88 (5.86) | 0 | |
| ERVL-MaLRs | 0.98 (4.35) | 0.56 (2.50) | |
| ERV-class I | 0.60 (3.93) | 0 | |
| ERV-class II | 0 | 0 | |
| DNA | All | 0.14 (0.70) | 0 |
| hAT-Charlie | 0.14 (0.70) | 0 | |
| TcMar-Tigger | 0 | 0 | |
| Unclassified | 0.48 (5.01) | 0 | |
| Small RNA | 0.05 (0.51) | 0 | |
| Satellite | 8.94 (26.92) | 7.85 (26.82) | |
| Simple repeats | 17.62 (33.73) | 10.82 (29.95) | |
| Low complexity | 11.80 (31.59) | 0.52 (2.00) | |
| AK1 Genome Information | Sequence Comparison Using UCSC BLAT | Validated by PCR | Hg38 Position | Verified Actual Indel Size (bp) | Breakpoint Structure | Mechanism | Microhomology (bp) | Microhomology Sequence or Homologous Sequence | ||||||||
|---|---|---|---|---|---|---|---|---|---|---|---|---|---|---|---|---|
| ID | Scaffold of AK1 | The Estimated Location of Globally Missing Region (≥7 indiv) | Human (GRCh38) | Chimp (panTro6) | Gorilla (gorGor4) | Eur 1 | Eur 2 | Eur 3 | Eur 4 | |||||||
| Start | End | |||||||||||||||
| G1-1 | KV784719.1 | 30,209,977 | 30,210,924 | X | O | O | O | O | O | O | chr13:48910547-48914294 | 1198 | Unique-Unique | NHEJ | 0 | |
| G1-2 | KV784719.1 | 79,001,655 | 79,002,640 | X | N | O | X | X | X | X | chr13:97337324-97340428 | 1333 | SR-SR | NHEJ | 4 | TGTG |
| G1-3 | KV784719.1 | 93,452,303 | 93,455,222 | - | O | O | X | X | X | X | N/A | N/A | N/A | N/A | N/A | N/A |
| G1-4 | KV784719.1 | 93,470,705 | 93,471,918 | - | O | O | X | X | X | X | N/A | N/A | N/A | N/A | N/A | N/A |
| G1-5 | KV784720.1 | 27,885,647 | 27,886,104 | X | O | O | O | O | O | O | chr4:79781761-79785451 | 767 | Alu-Unique | NHEJ | 2 | CT |
| G1-6 | KV784723.1 | 8,349,171 | 8,349,628 | X | O | O | O | O | O | O | chr4:181366776-181370046 | 1192 | Unique-Unique | NHEJ | 0 | |
| G1-7 | KV784723.1 | 10,288,012 | 10,288,493 | X | O | O | Del | Del | Pol | Del | chr4:179430209-179433860 | 827 | Unique-Unique | NHEJ | 4 | ATTT |
| G1-8 | KV784723.1 | 34,400,763 | 34,401,227 | X | O | O | X | X | X | X | chr4:155347518-155351075 | 901 | Unique-Unique | NAHR | 38 | TTTCTTGTCTCCTGCCTTCTGCCAAGCCTTAGTCACAA |
| G1-9 | KV784731.1 | 15,610,509 | 15,611,959 | X | O | N | O | O | O | O | chr5:6446724-6450554 | 1636 | SR-Unique | NHEJ | 4 | CTGC |
| G1-10 | KV784736.1 | 6,179,476 | 6,184,176 | X | O | O | O | O | O | O | chr6:67607329-67611067 | 4961 | Alu-L1 | NHEJ | 4 | AAAA |
| G1-11 | KV784736.1 | 18,433,040 | 18,435,697 | X | O | O | O | O | O | O | chr6:79899617-79903449 | 2892 | Unique-Unique | NHEJ | 5 | GGACT |
| G1-12 | KV784738.1 | 33,432,222 | 33,432,240 | X | O | N | X | X | X | X | chr10:2389608-2395439 | 4163 | Unique-Unique | NHEJ | 5 | CCCTC |
| G1-13 | KV784747.1 | 1,225,842 | 1,227,344 | X | O | O | Del | Del | Pol | O | chr6:28174388-28177850 | 2035 | Unique-Unique | NHEJ | 2 | AG |
| G1-14 | KV784754.1 | 50,234,036 | 50,235,663 | X | O | O | O | O | O | O | chr8:136025060-136028726 | 1957 | Unique-Alu | NHEJ | 5 | ATCTC |
| G1-15 | KV784761.1 | 2,374,855 | 2,374,857 | X | - | - | O | O | O | O | chr18:13980325-13983782 | 543 | Unique-Unique | NHEJ | 4 | TCCT |
| G1-16 | KV784762.1 | 646,396 | 646,455 | X | N | N | X | X | X | X | chr19:869056-876703 | 2372 | G-rich-G-rich | NHEJ | 4 | GGGG |
| G1-17 | KV784762.1 | 942,159 | 943,260 | X | O | O | O | O | O | O | chr19:1160489-1162472 | 3127 | Alu-Alu | NAHR | 25 | CCTGTAATCCCAGCACTTTGGGAGG |
| G1-18 | KV784774.1 | 387,226 | 387,651 | X | O | O | X | X | X | X | chrX:47084676-47092500 | 2920 | SR-Alu | NHEJ | 3 | ATG |
| G1-19 | KV784797.1 | 27,753,978 | 27,754,392 | X | O | O | O | O | O | O | chr1:93874952-93876859 | 2521 | Unique-Alu | NHEJ | 0 | |
| G1-20 | KV784800.1 | 13,617,523 | 13,617,941 | X | O | O | Pol | Pol | O | Pol | chr10:63781277-63784929 | 763 | Alu-Unique | NHEJ | 4 | AGAA |
| G1-21 | KV784803.1 | 15,594,978 | 15,595,455 | X | O | O | O | Pol | Del | Del | chr14:88710100-88713185 | 1390 | LTR-LTR | NHEJ | 6 | GAACTG |
| G1-22 | KV784803.1 | 21,188,206 | 21,188,829 | X | O | O | Del | Del | O | O | chr14:83119034-83122153 | 1504 | L1-Unique | NHEJ | 3 | AGA |
| G1-23 | KV784804.1 | 4,078,861 | 4,078,900 | X | O | O | O | O | O | O | chr17:40521389-40524617 | 820 | Unique-Alu | NHEJ | 1 | G |
| G1-24 | KV784806.1 | 65,330,325 | 65,332,270 | X | O | O | O | O | O | O | chr2:21821760-21825542 | 2160 | L1-Unique | NHEJ | 1 | T |
| G1-25 | KV784811.1 | 3,734,091 | 3,735,143 | X | O | O | O | O | O | O | chr7:68760760-68763395 | 2414 | Alu-Unique | NHEJ | 3 | AAG |
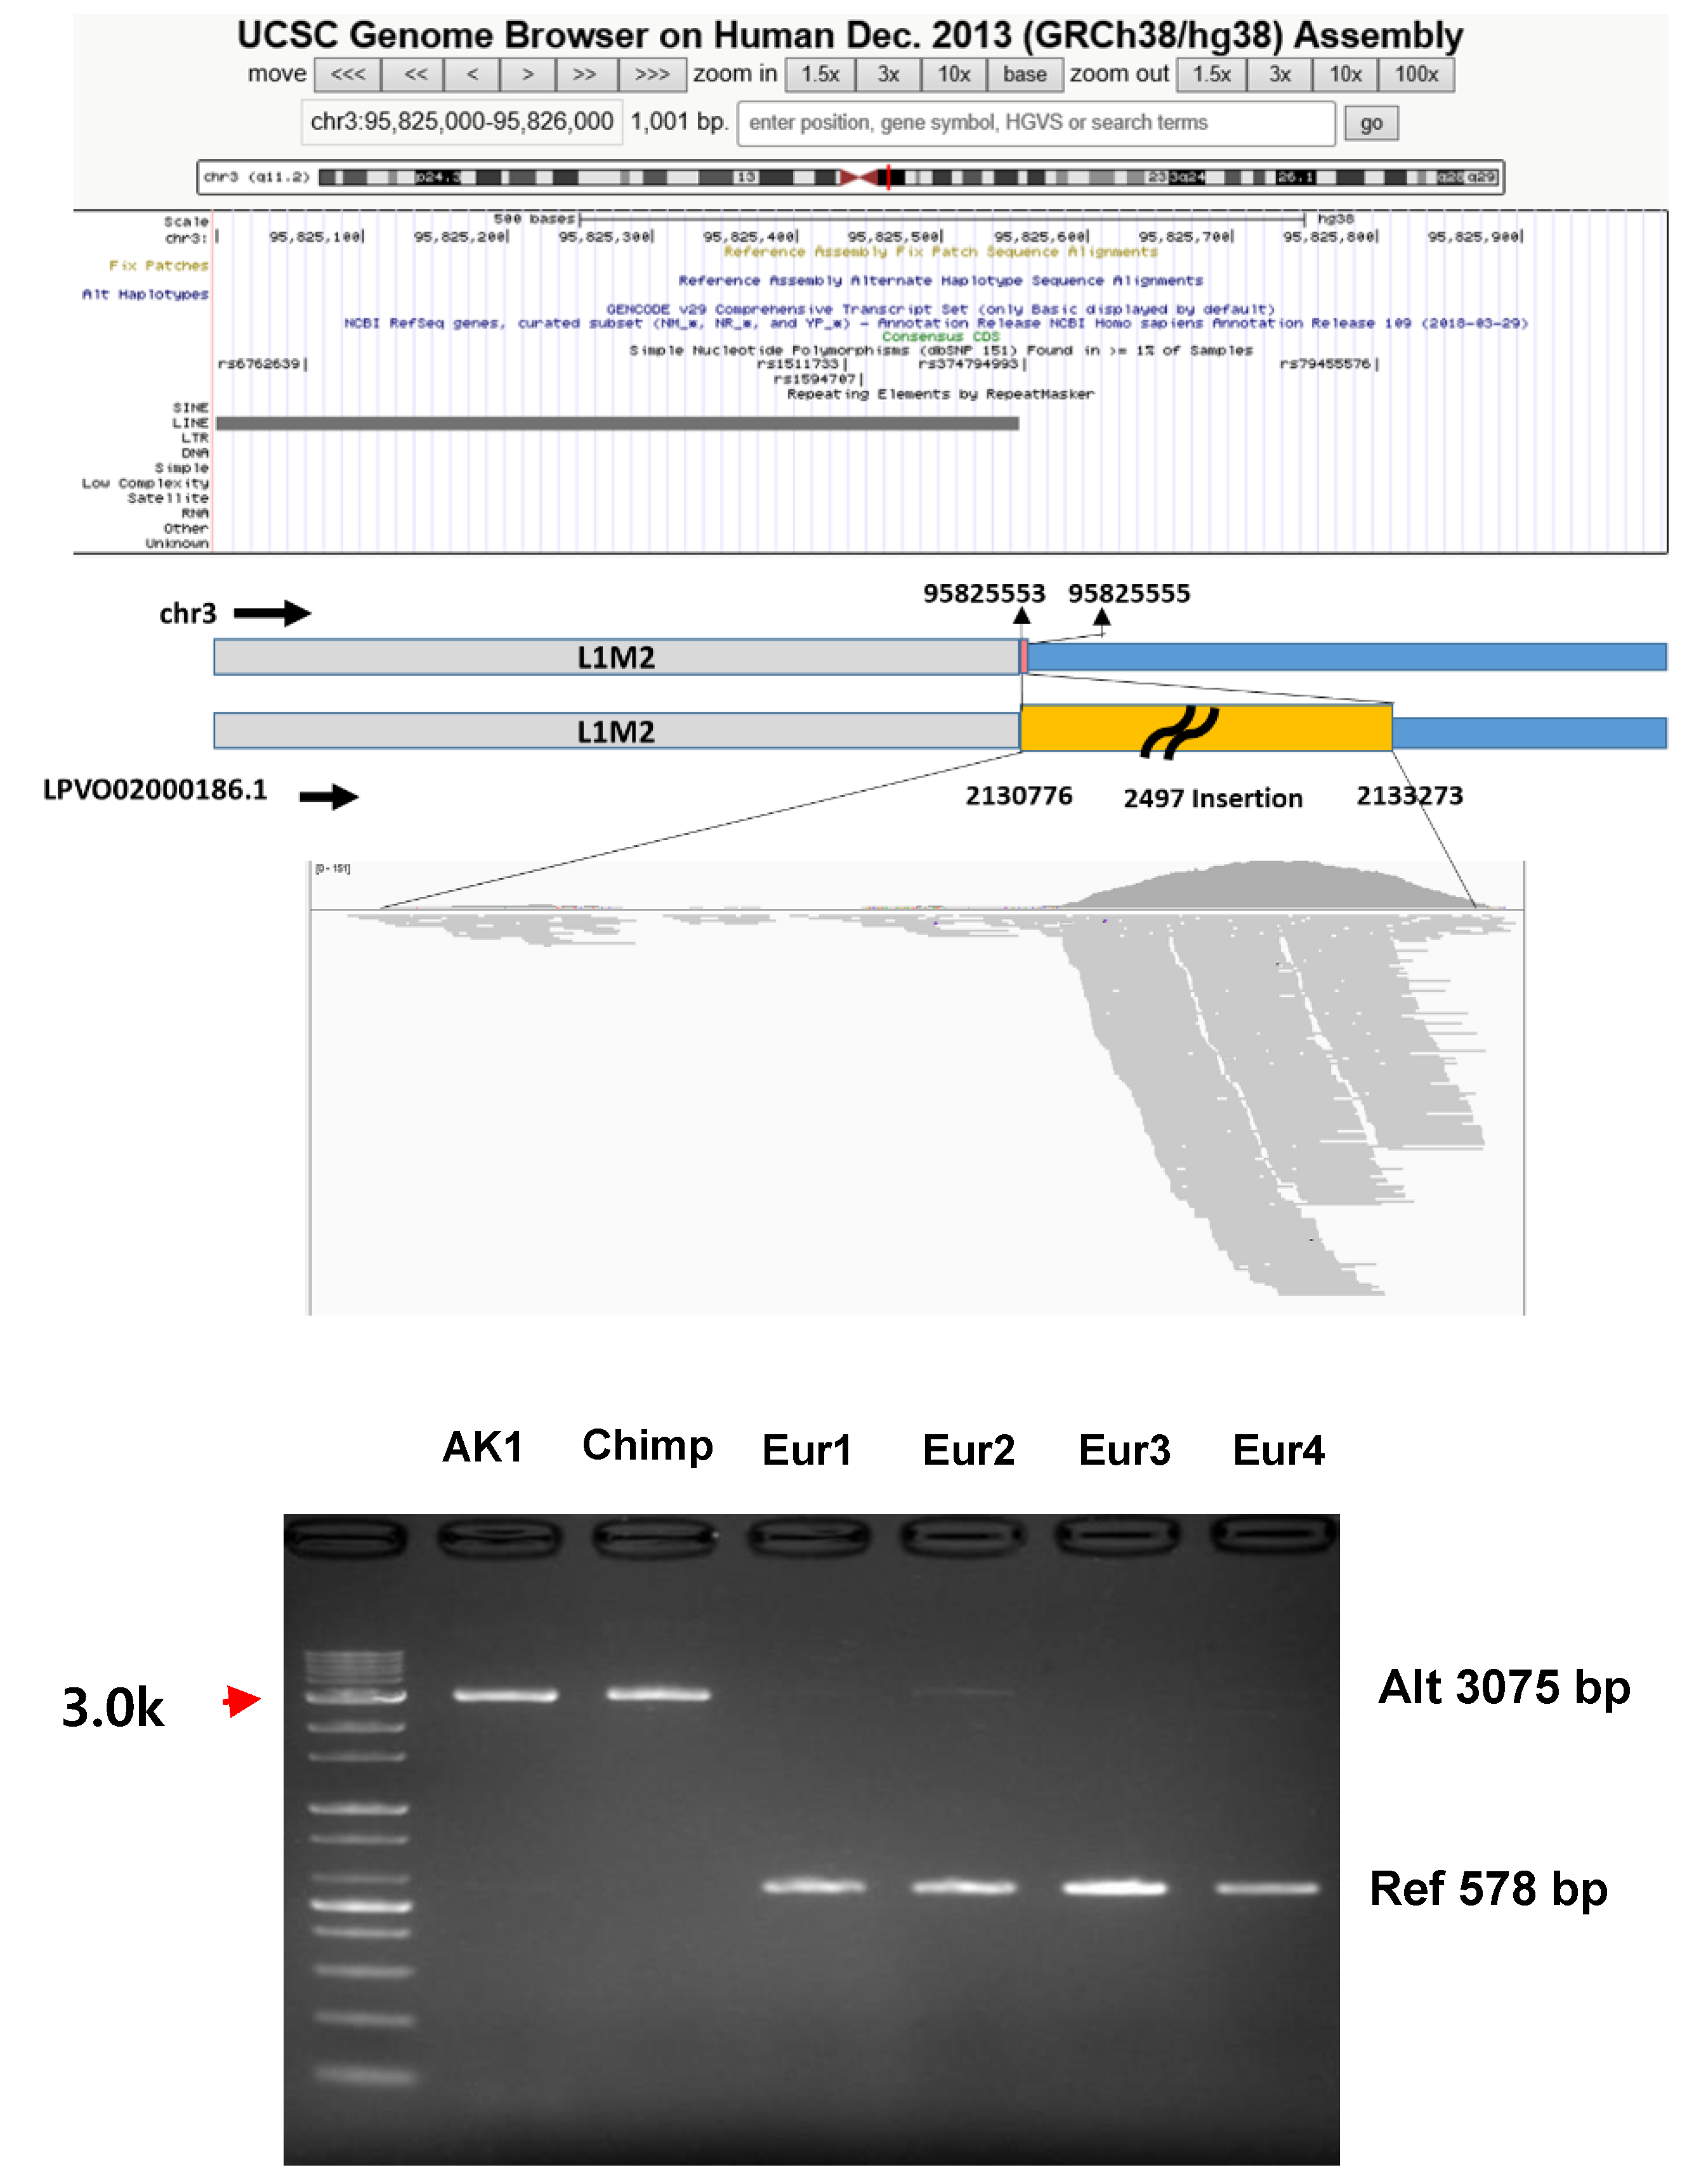
| G1-26 | LPVO02000186.1 | 2,132,760 | 2,132,810 | X | O | O | Pol | Pol | O | Pol | chr3:95822539-95830080 | 2497 | L1-Unique | NHEJ | 0 | |
| G1-27 | LPVO02000191.1 | 8,716,140 | 8,716,258 | X | O | N | X | X | X | X | chr3:194273873-194277269 | 720 | G-rich-G-rich | NHEJ | 2 | GG |
| G1-28 | LPVO02000230.1 | 3,020,537 | 3,020,573 | X | X | N | X | X | X | X | chr5:181099166-181102877 | 615 | SR-SR | NHEJ | 3 | CCT |
| G1-29 | LPVO02000423.1 | 11,658,530 | 11,658,908 | X | O | O | X | X | X | X | chr11:101923894-101927461 | 806 | Alu-Alu | NHEJ | 8 | GTGCAGTG |
| G1-30 | LPVO02000423.1 | 13,811,264 | 13,811,292 | X | O | O | Del | Pol | Del | Pol | chr11:104076897-104080443 | 579 | LTR-Unique | NHEJ | 2 | TT |
| G1-31 | LPVO02000621.1 | 1,217,413 | 1,217,481 | X | N | N | X | X | X | X | chrX:2318537-2323680 | 4923 | Alu-Alu | NAHR | 24 | GTGGAGGTTGCAGTGAGCCGAGAT |
Publisher’s Note: MDPI stays neutral with regard to jurisdictional claims in published maps and institutional affiliations. |
© 2020 by the authors. Licensee MDPI, Basel, Switzerland. This article is an open access article distributed under the terms and conditions of the Creative Commons Attribution (CC BY) license (http://creativecommons.org/licenses/by/4.0/).
Share and Cite
Kim, J.; Sung, J.; Han, K.; Lee, W.; Mun, S.; Lee, J.; Bahk, K.; Yang, I.; Bae, Y.-K.; Kim, C.; et al. A High Quality Asian Genome Assembly Identifies Features of Common Missing Regions. Genes 2020, 11, 1350. https://doi.org/10.3390/genes11111350
Kim J, Sung J, Han K, Lee W, Mun S, Lee J, Bahk K, Yang I, Bae Y-K, Kim C, et al. A High Quality Asian Genome Assembly Identifies Features of Common Missing Regions. Genes. 2020; 11(11):1350. https://doi.org/10.3390/genes11111350
Chicago/Turabian StyleKim, Jina, Joohon Sung, Kyudong Han, Wooseok Lee, Seyoung Mun, Jooyeon Lee, Kunhyung Bahk, Inchul Yang, Young-Kyung Bae, Changhoon Kim, and et al. 2020. "A High Quality Asian Genome Assembly Identifies Features of Common Missing Regions" Genes 11, no. 11: 1350. https://doi.org/10.3390/genes11111350