Involvement of Essential Signaling Cascades and Analysis of Gene Networks in Diabesity

 ,
, 

Abstract
:
1. Introduction
2. Materials and Methods
2.1. Data Source
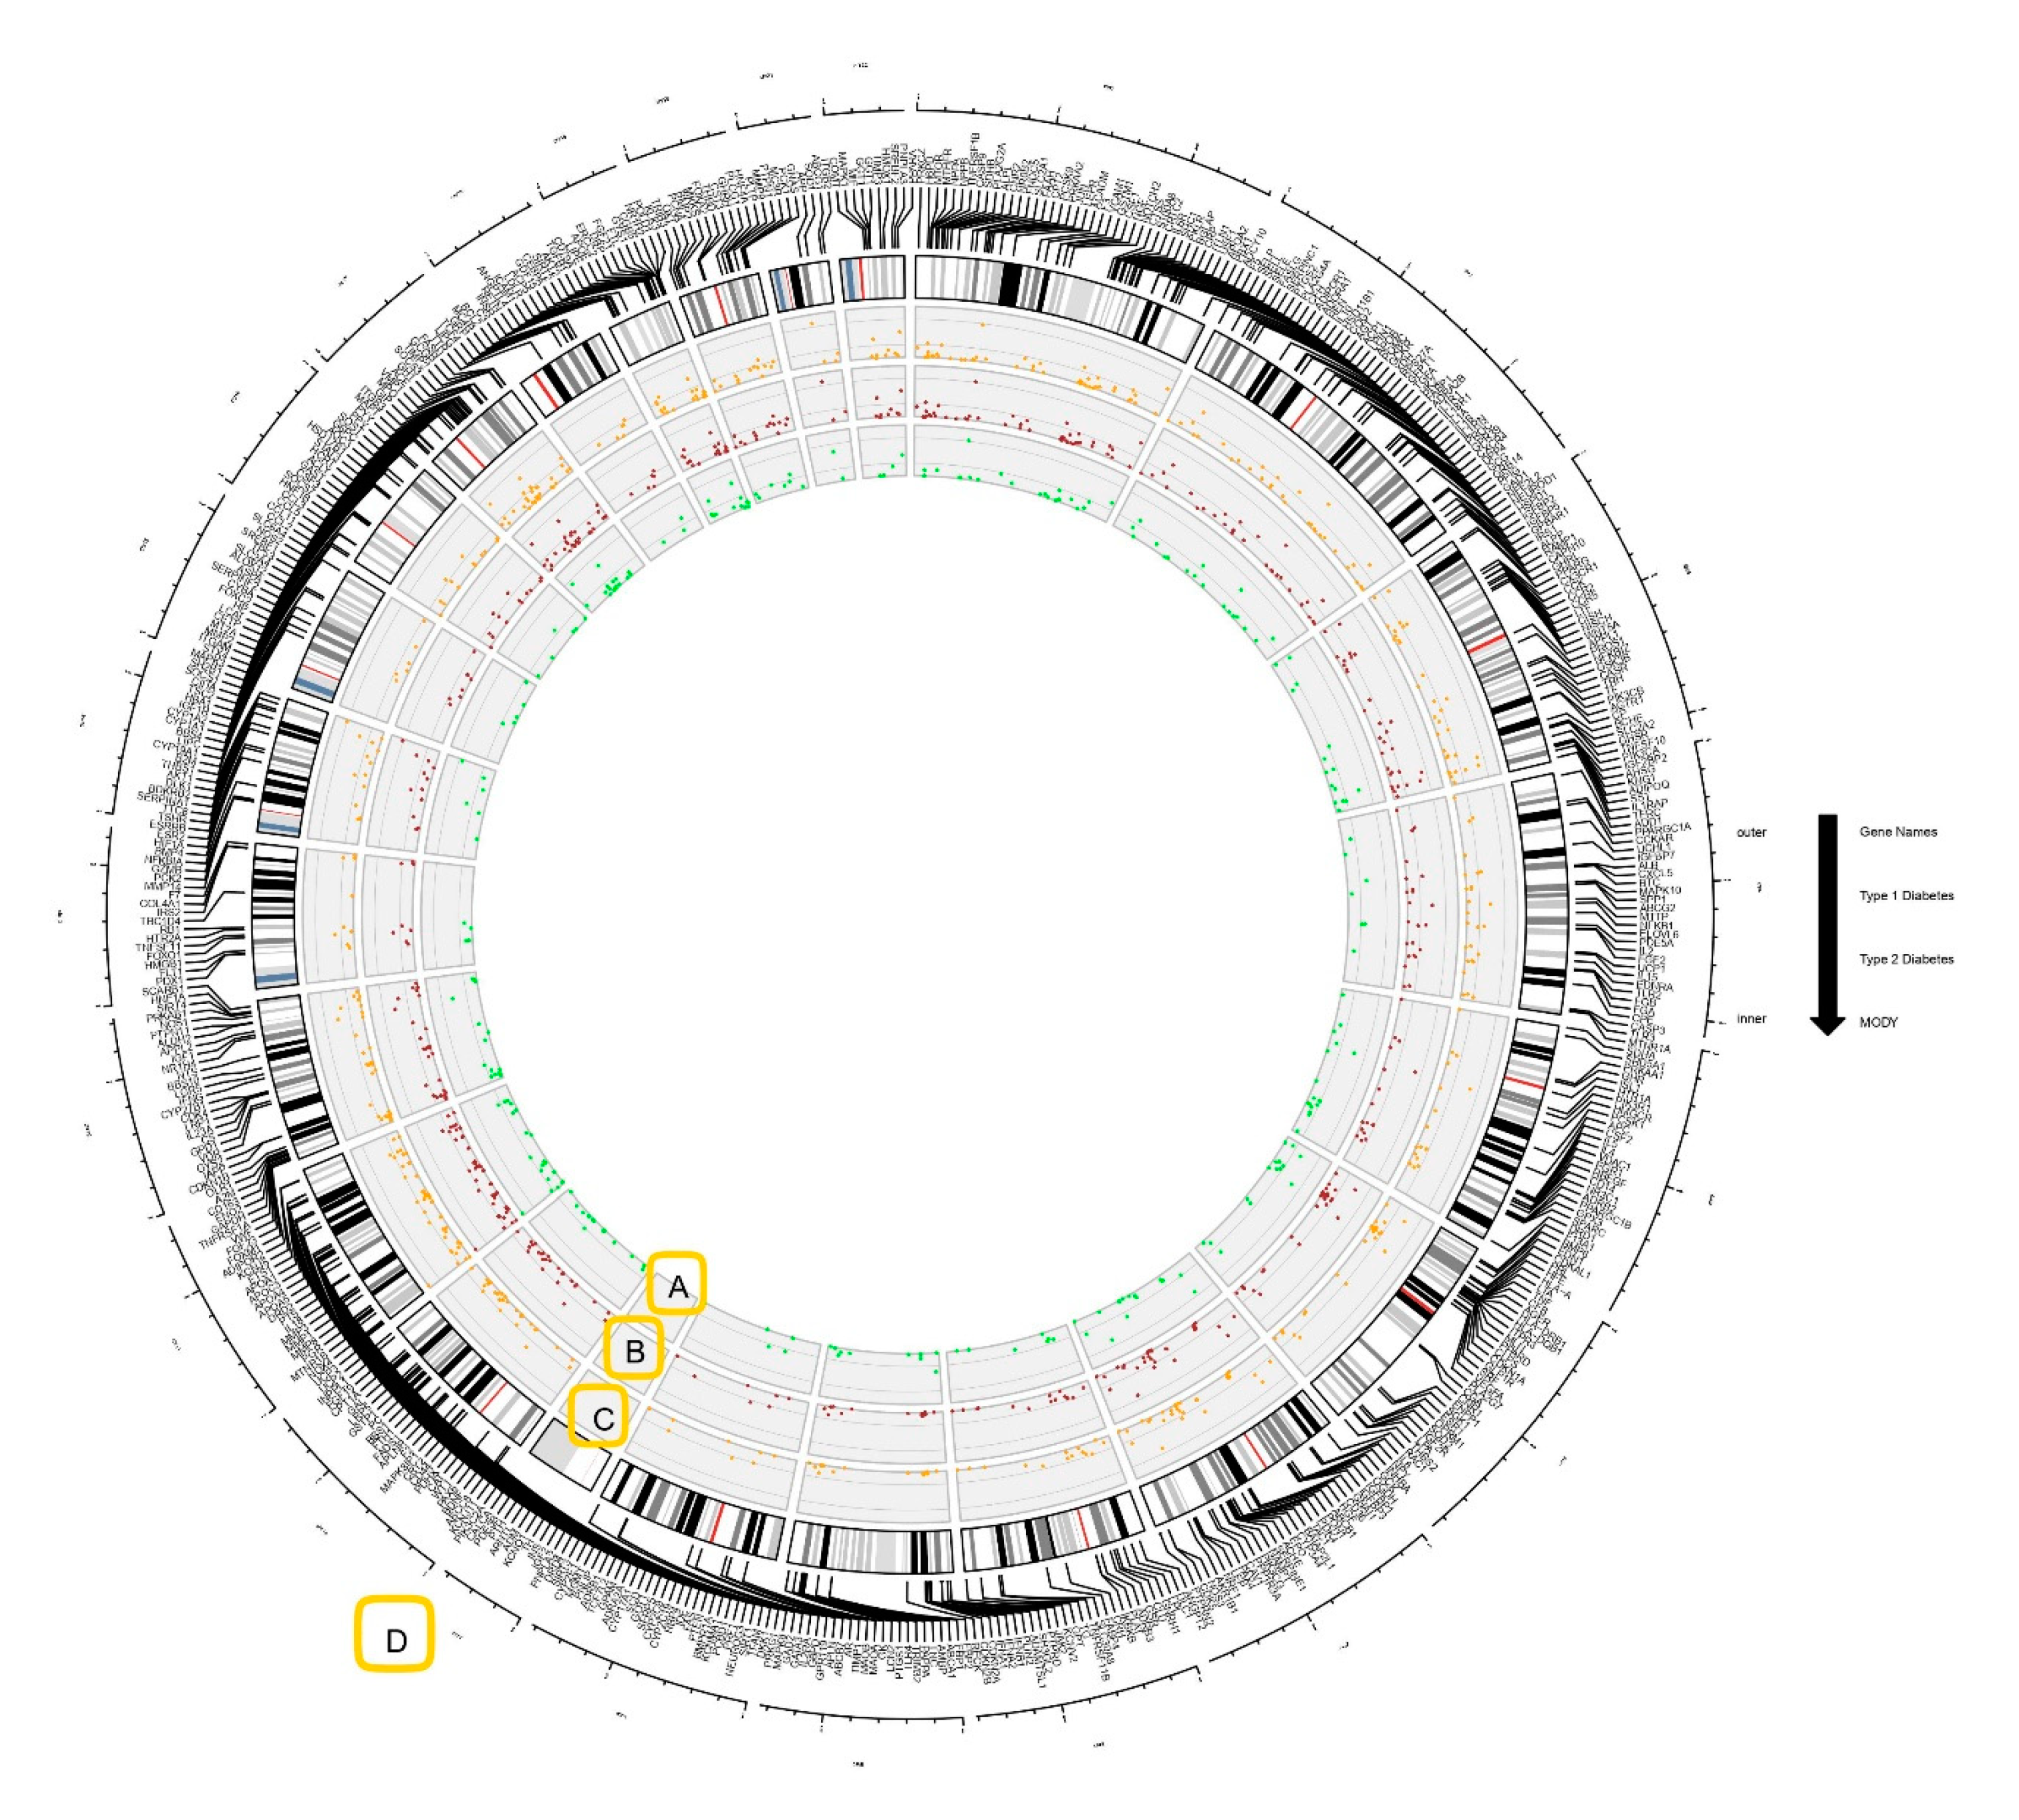
2.2. Circos Plot Construction and Data Visualization
2.3. PPI Network Construction and Visualization
2.4. Identification of Protein Complexes and Pathways
3. Results
3.1. Genes Associated with Diabesity
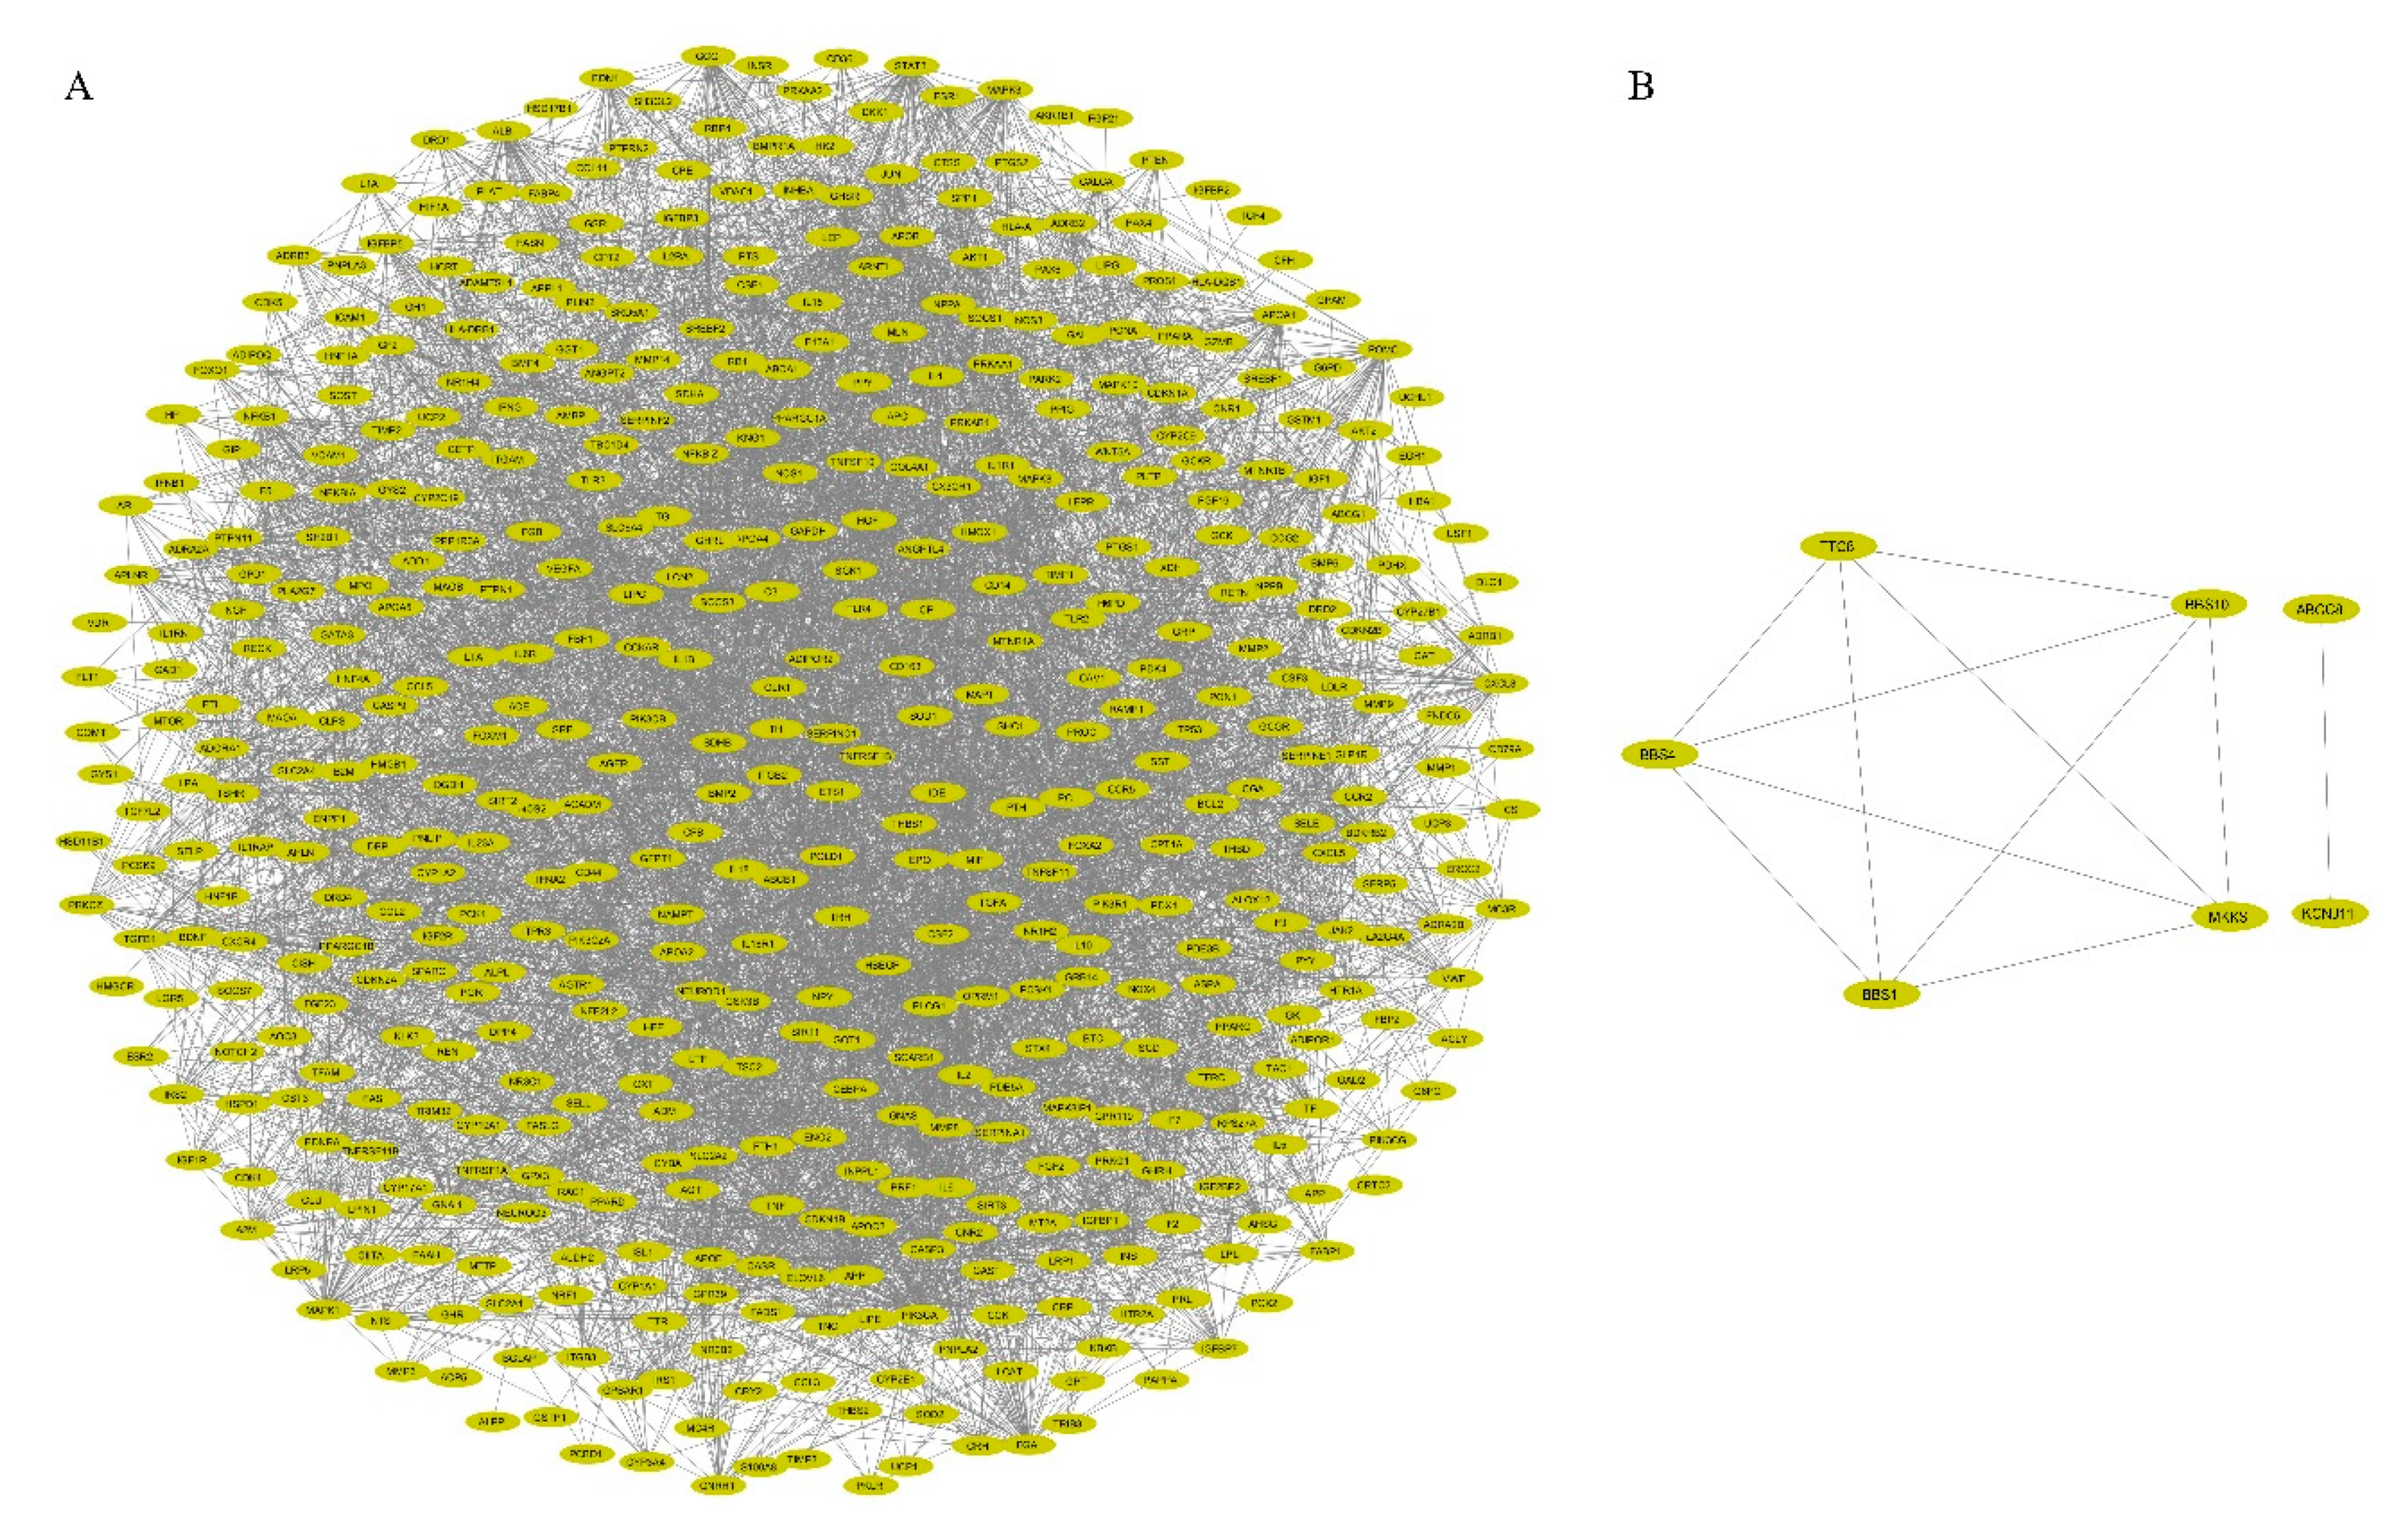
3.2. PPI Network Construction and Visualization
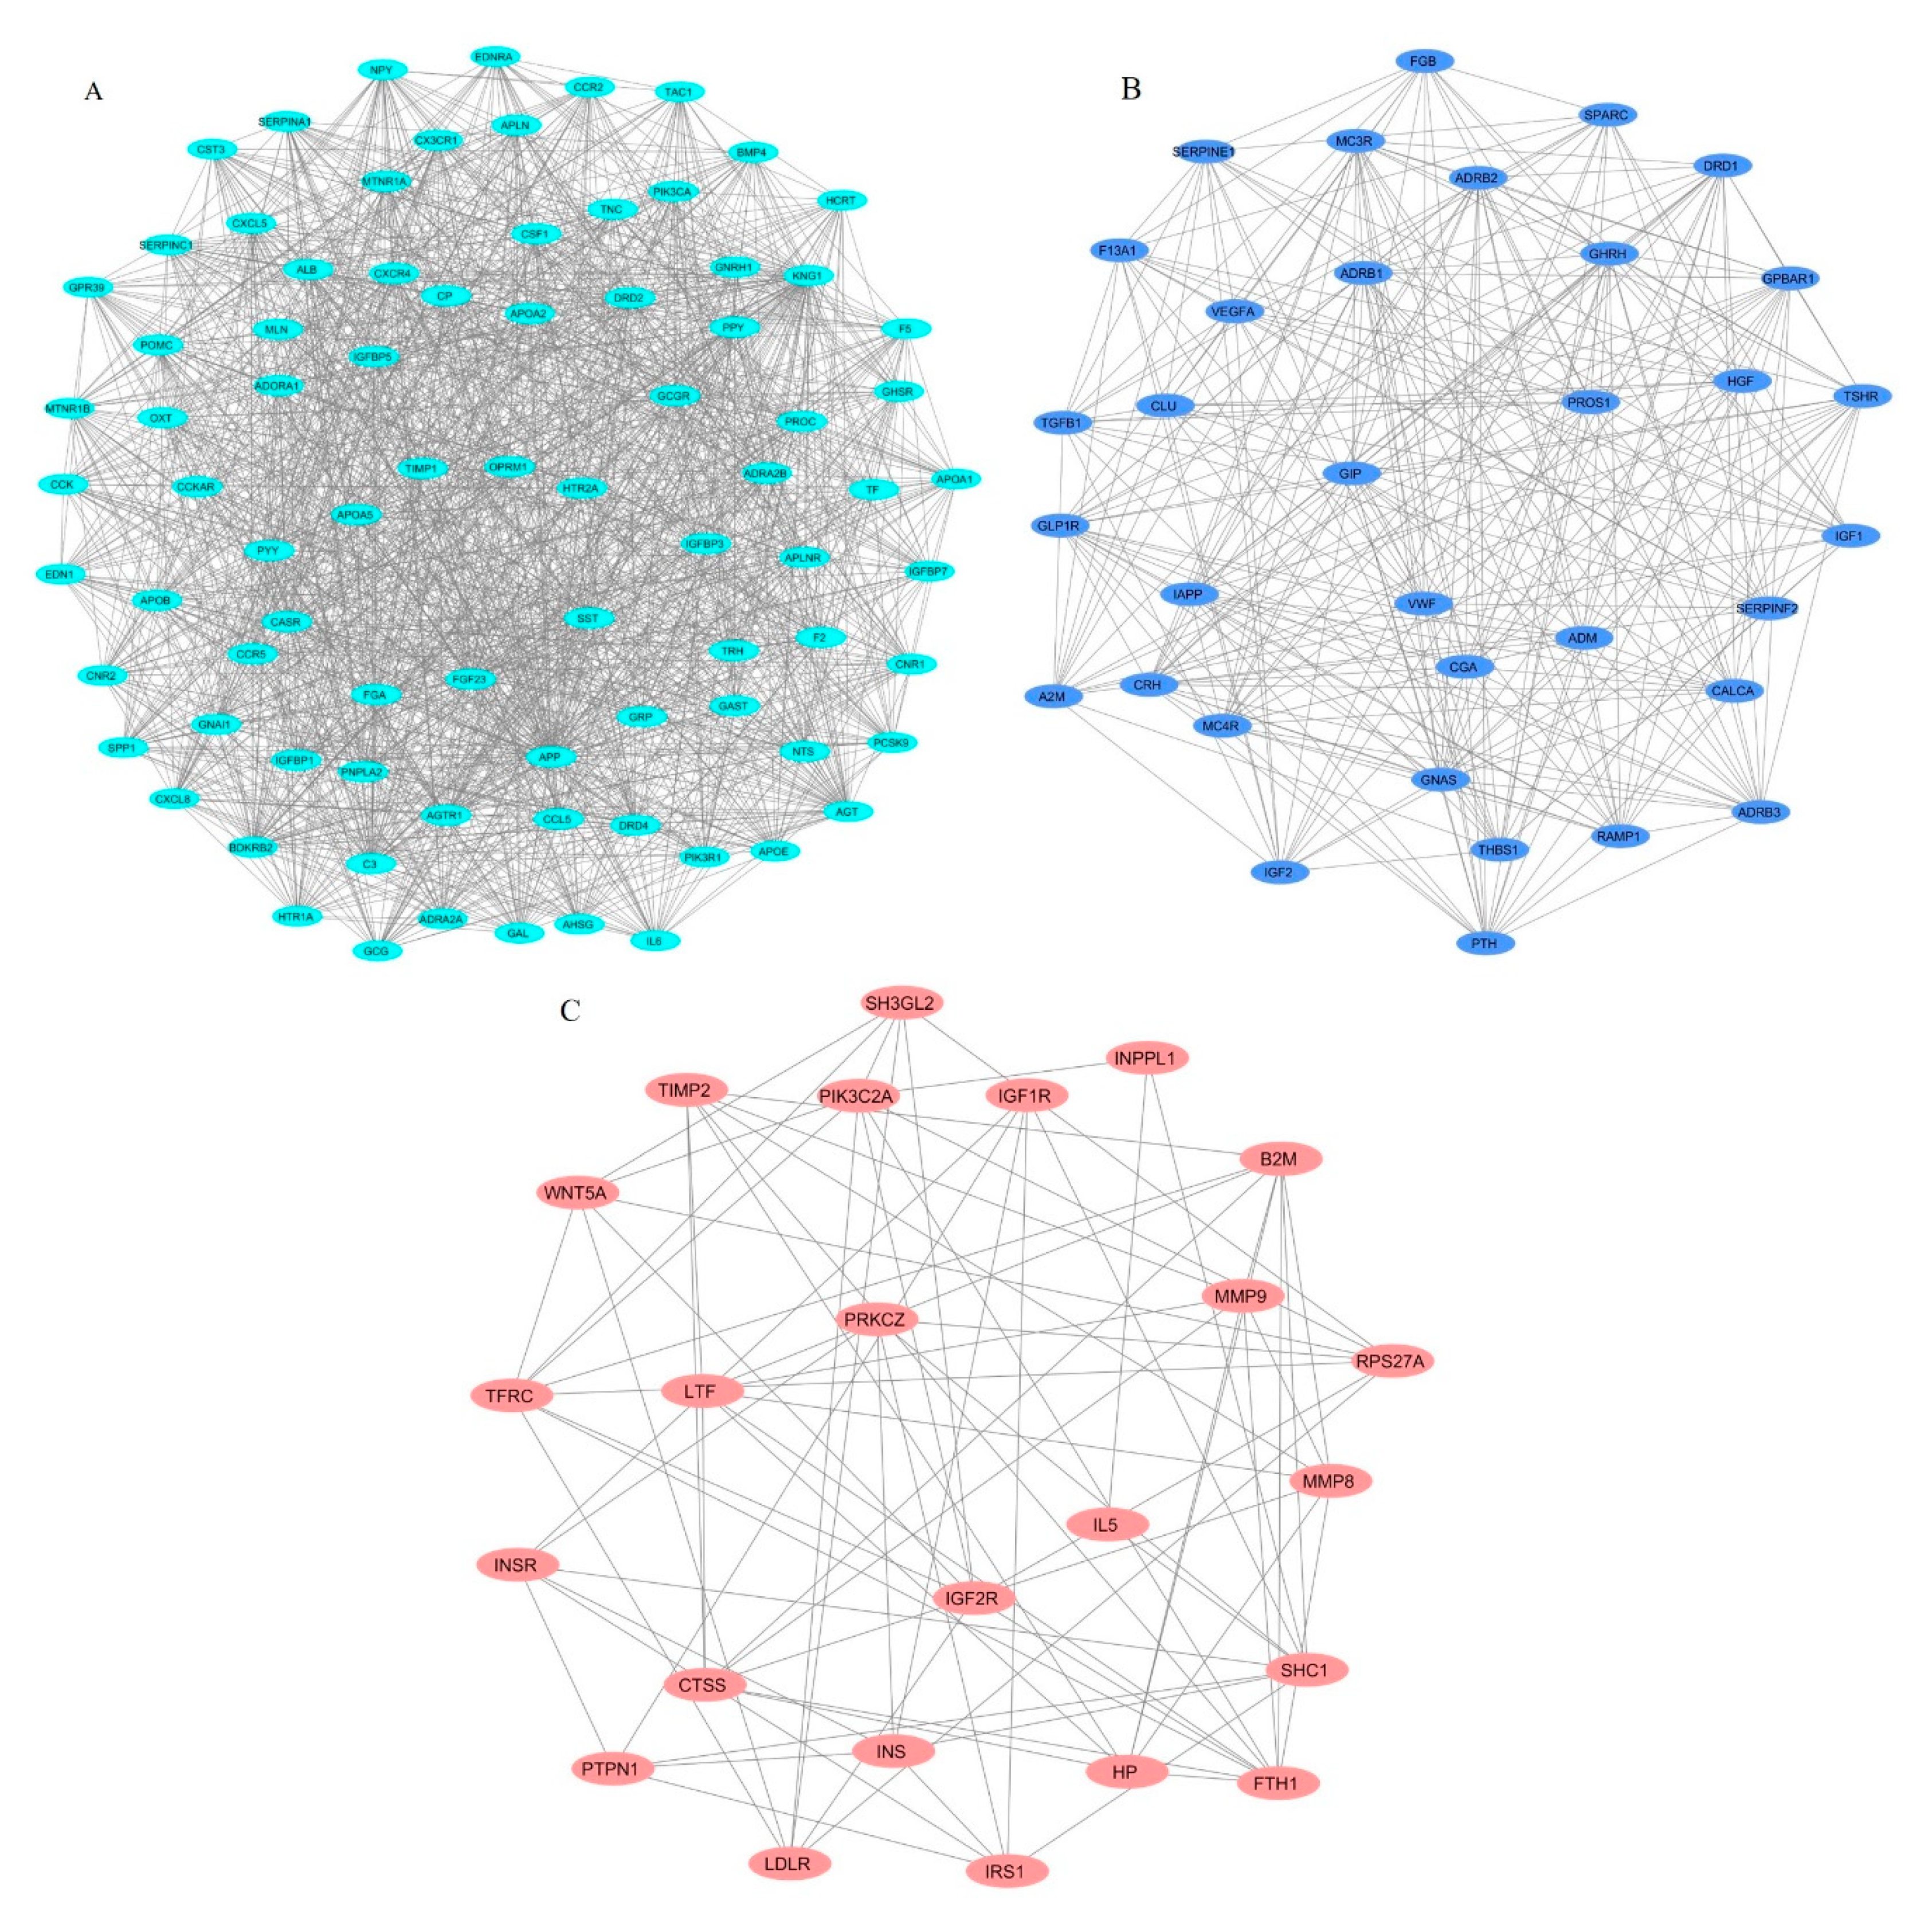
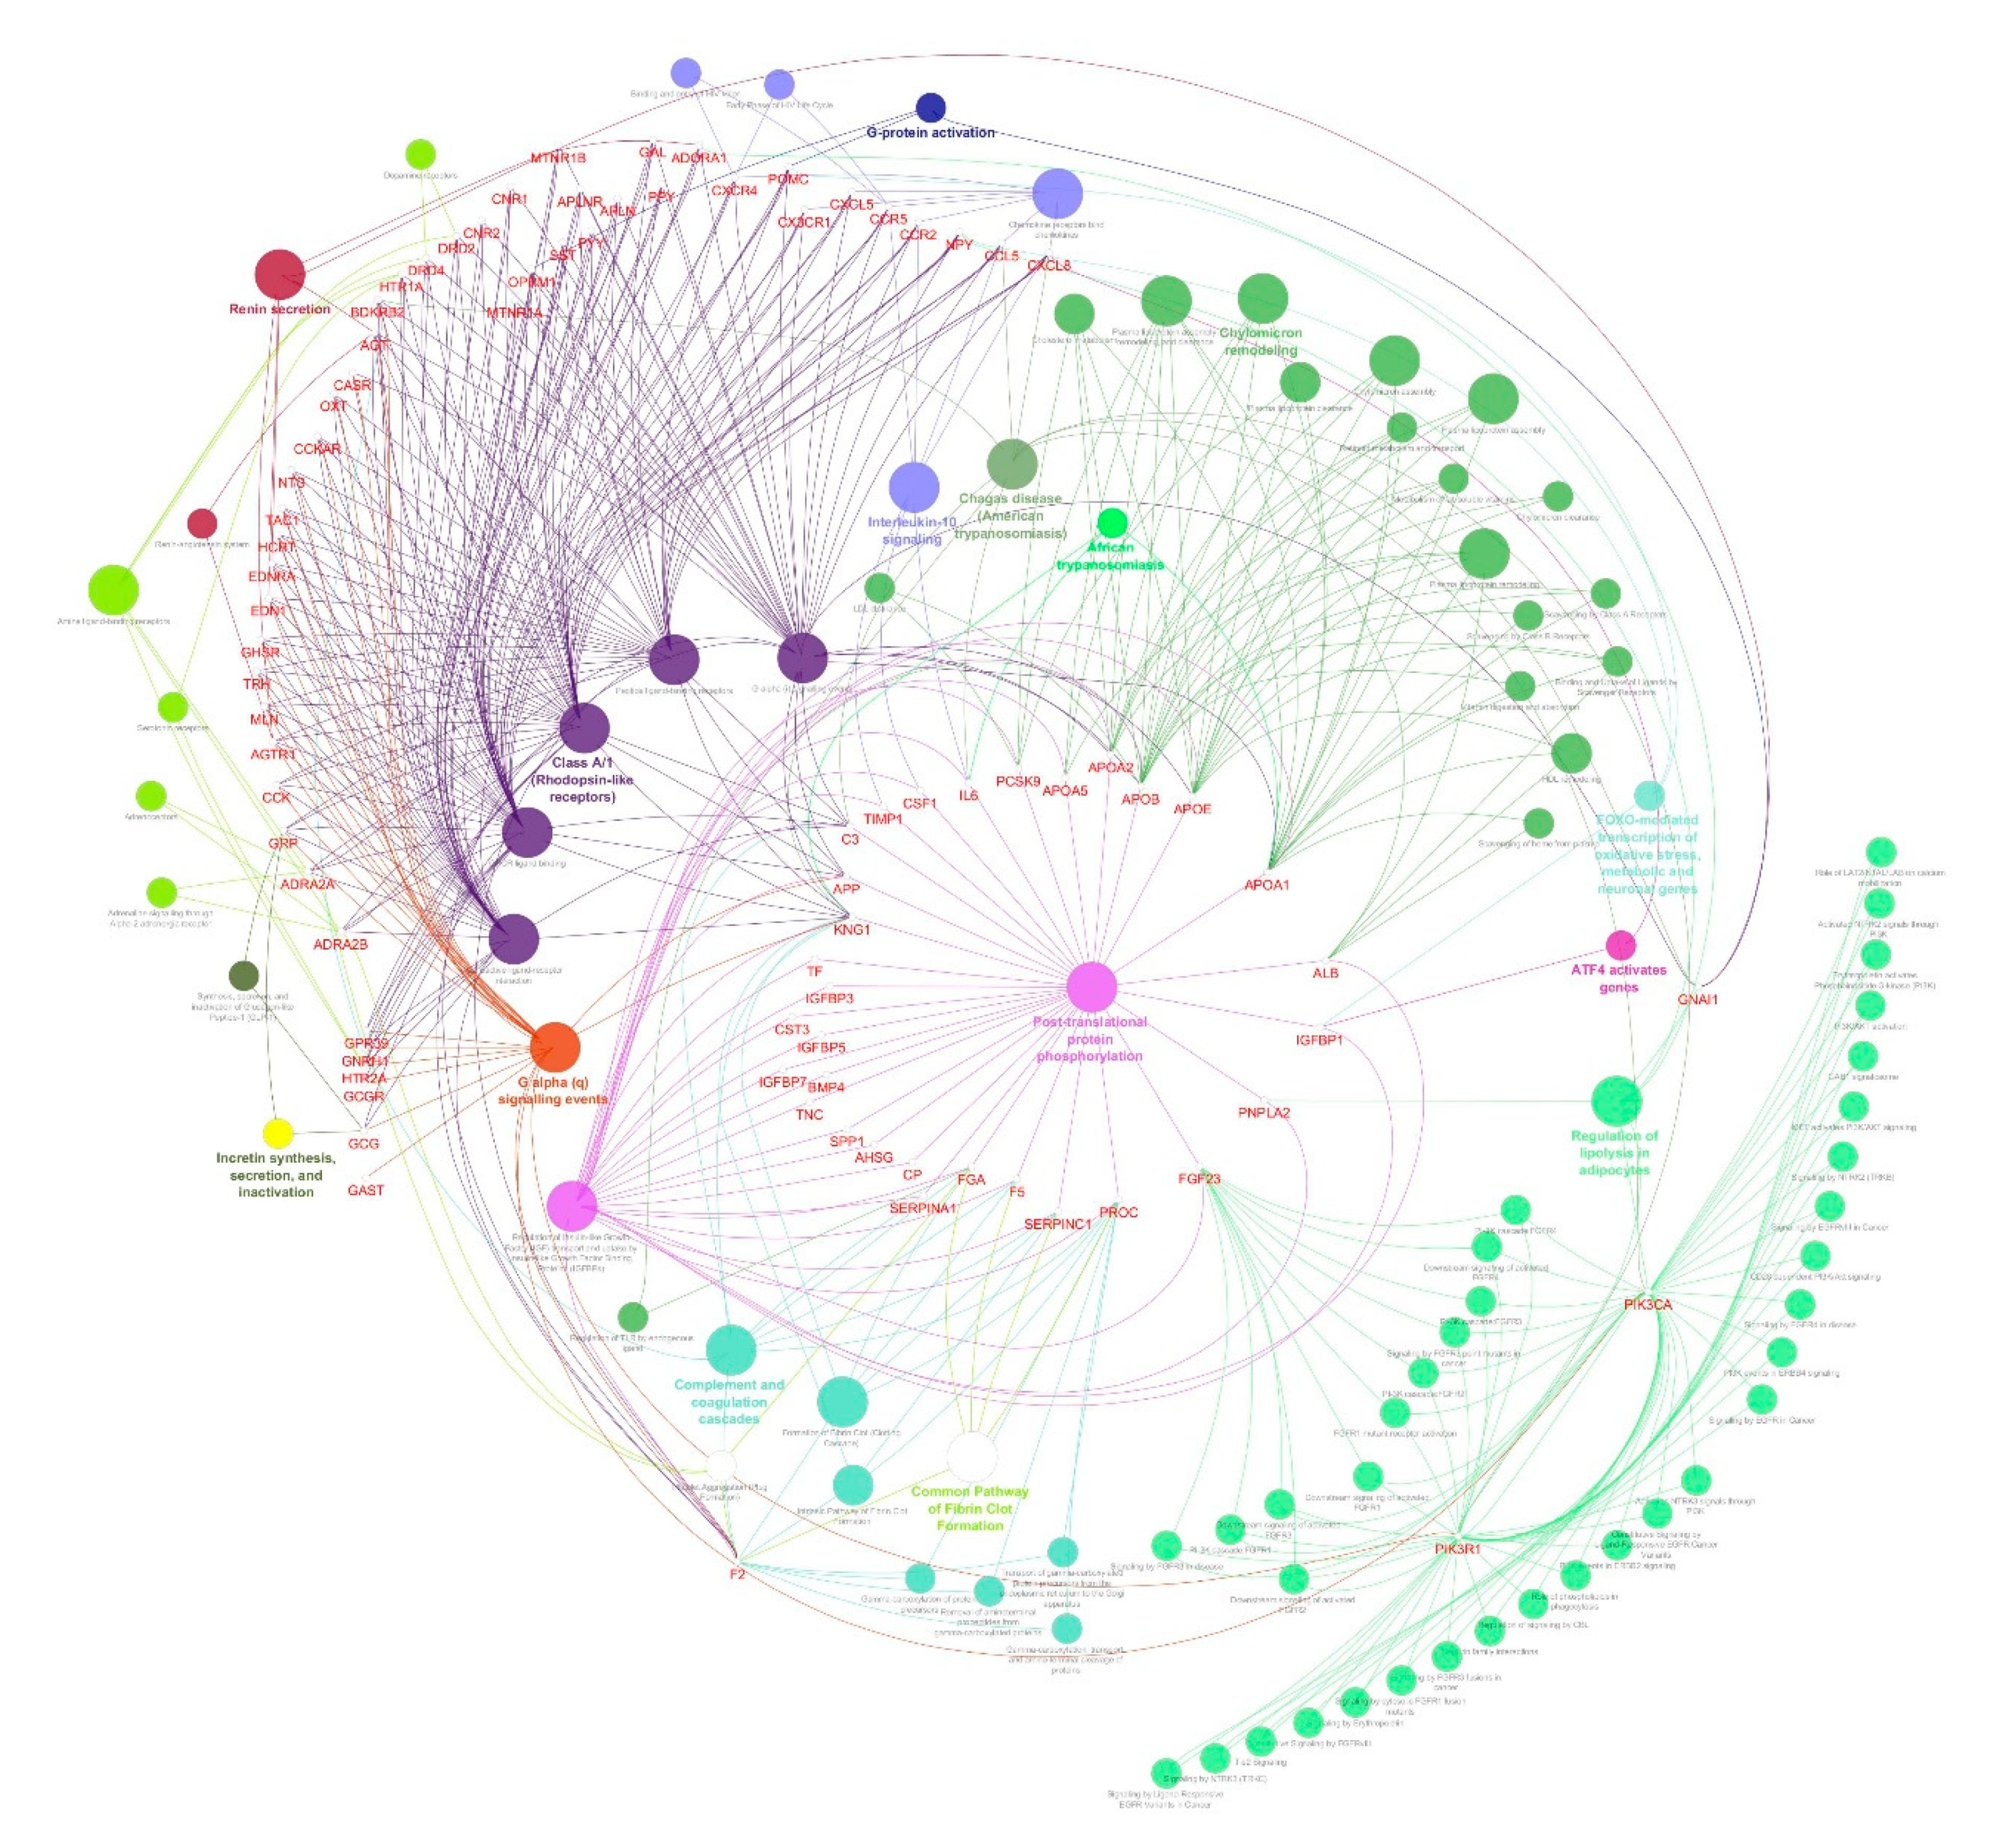
3.3. Identification of Protein Complexes and Pathways
4. Discussion
5. Conclusions
Supplementary Materials
Author Contributions
Funding
Acknowledgments
Conflicts of Interest
References
- Shafrir, E. Development and consequences of insulin resistance: Lessons from animals with hyperinsulinaemia. Diabetes Metab. 1996, 22, 122–131. [Google Scholar] [PubMed]
- Zimmet, P. Globalization, coca-colonization and the chronic disease epidemic: Can the Doomsday scenario be averted? J. Intern. Med. 2000, 247, 301–310. [Google Scholar] [CrossRef] [PubMed] [Green Version]
- Kahn, S.E.; Hull, R.L.; Utzschneider, K.M. Mechanisms linking obesity to insulin resistance and type 2 diabetes. Nature 2006, 444, 840–846. [Google Scholar] [CrossRef] [PubMed]
- Kaneto, H. Pancreatic β-cell glucose toxicity in type 2 diabetes mellitus. Curr. Diabetes Rev. 2015, 11, 2–6. [Google Scholar] [CrossRef] [PubMed]
- Sáez, T.; Toledo, F.; Sobrevia, L. Impaired signalling pathways mediated by extracellular vesicles in diabesity. Mol. Asp. Med. 2019, 66, 13–20. [Google Scholar] [CrossRef] [PubMed]
- Villalobos-Labra, R.; Silva, L.; Subiabre, M.; Araos, J.; Salsoso, R.; Fuenzalida, B.; Sáez, T.; Toledo, F.; González, M.; Quezada, C.; et al. Akt/mTOR Role in Human Foetoplacental Vascular Insulin Resistance in Diseases of Pregnancy. J. Diabetes Res. 2017, 2017, 1–13. [Google Scholar] [CrossRef] [PubMed] [Green Version]
- Cardoso, S.; Moreira, P.I. Diabesity and brain disturbances: A metabolic perspective. Mol. Asp. Med. 2019, 66, 71–79. [Google Scholar] [CrossRef]
- Ozcan, U.; Cao, Q.; Yilmaz, E.; Lee, A.H.; Iwakoshi, N.N.; Özdelen, E.; Tuncman, G.; Görgün, C.; Glimcher, L.H.; Hotamisligil, G.S. Endoplasmic Reticulum Stress Links Obesity, Insulin Action, and Type 2 Diabetes. Science 2004, 306, 457–461. [Google Scholar] [CrossRef] [Green Version]
- Chadt, A.; Scherneck, S.; Joost, H.-G.; Al-Hasani, H. Molecular links between Obesity and Diabetes: “Diabesity”. In Endotext; Feingold, K.R., Anawalt, B., Boyce, A., Eds.; MDText.com, Inc., 2000. Available online: http://www.ncbi.nlm.nih.gov/books/NBK279051/ (accessed on 12 August 2020).
- Gregor, M.F.; Hotamisligil, G.S. Inflammatory mechanisms in obesity. Annu. Rev. Immunol. 2011, 29, 415–445. [Google Scholar] [CrossRef] [Green Version]
- Xu, H.; Barnes, G.T.; Yang, Q.; Tan, G.; Yang, D.; Chou, C.J.; Sole, J.; Nichols, A.; Ross, J.S.; Tartaglia, L.A.; et al. Chronic inflammation in fat plays a crucial role in the development of obesity-related insulin resistance. J. Clin. Investig. 2003, 112, 1821–1830. [Google Scholar] [CrossRef]
- Smith, U. Abdominal obesity: A marker of ectopic fat accumulation. J. Clin. Investig. 2015, 125, 1790–1792. [Google Scholar] [CrossRef] [Green Version]
- Tan, C.Y.; Vidal-Puig, A. Adipose tissue expandability: The metabolic problems of obesity may arise from the inability to become more obese. Biochem. Soc. Trans. 2008, 36, 935–940. [Google Scholar] [CrossRef] [PubMed]
- Guilherme, A.; Virbasius, J.V.; Puri, V.; Czech, M.P. Adipocyte dysfunctions linking obesity to insulin resistance and type 2 diabetes. Nat. Rev. Mol. Cell Biol. 2008, 9, 367–377. [Google Scholar] [CrossRef] [PubMed] [Green Version]
- Ogurtsova, K.; Fernandes, J.D.R.; Huang, Y.; Linnenkamp, U.; Guariguata, L.; Cho, N.; Cavan, D.; Shaw, J.; E Makaroff, L. IDF Diabetes Atlas: Global estimates for the prevalence of diabetes for 2015 and 2040. Diabetes Res. Clin. Pract. 2017, 128, 40–50. [Google Scholar] [CrossRef] [Green Version]
- Zimmet, P.; Alberti, K.G.M.M.; Shaw, J. Global and societal implications of the diabetes epidemic. Nature 2001, 414, 782–787. [Google Scholar] [CrossRef]
- Redinger, R.N. The pathophysiology of obesity and its clinical manifestations. Gastroenterol. Hepatol. 2007, 3, 856–863. [Google Scholar]
- Fowler, M.J. Microvascular and Macrovascular Complications of Diabetes. Clin. Diabetes 2008, 26, 77–82. [Google Scholar] [CrossRef] [Green Version]
- Haffner, S.M.; D’Agostino, R.; Mykkanen, L.; Tracy, R.; Howard, B.; Rewers, M.; Selby, J.; Savage, P.J.; Saad, M.F. Insulin sensitivity in subjects with type 2 diabetes. Relationship to cardiovascular risk factors: The Insulin Resistance Atherosclerosis Study. Diabetes Care 1999, 22, 562–568. [Google Scholar] [CrossRef]
- Rankinen, T.; Zuberi, A.; Chagnon, Y.C.; Weisnagel, S.J.; Argyropoulos, G.; Walts, B.; Pérusse, L.; Bouchard, C. The human obesity gene map: The 2005 update. Obesity 2006, 14, 529–644. [Google Scholar] [CrossRef]
- Butler, M.G.; McGuire, A.; Manzardo, A.M. Clinically relevant known and candidate genes for obesity and their overlap with human infertility and reproduction. J. Assist. Reprod. Genet. 2015, 32, 495–508. [Google Scholar] [CrossRef] [PubMed]
- Choquet, H.; Meyre, D. Genetics of Obesity: What have we Learned? Curr. Genom. 2011, 12, 169–179. [Google Scholar] [CrossRef] [Green Version]
- Gaulton, K.J.; the DIAbetes Genetics Replication And Meta-analysis (DIAGRAM) Consortium; Ferreira, T.; Lee, Y.; Raimondo, A.; Maegi, R.; Reschen, M.E.; Mahajan, A.; E Locke, A.; Rayner, N.W.; et al. Genetic fine mapping and genomic annotation defines causal mechanisms at type 2 diabetes susceptibility loci. Nat. Genet. 2015, 47, 1415–1425. [Google Scholar] [CrossRef]
- Gloyn, A.L.; Reimann, F.; Girard, C.; Edghill, E.L.; Proks, P.; Pearson, E.; Temple, I.K.; Mackay, D.J.G.; Shield, J.P.H.; Freedenberg, D.; et al. Relapsing diabetes can result from moderately activating mutations in KCNJ11. Hum. Mol. Genet. 2005, 14, 925–934. [Google Scholar] [CrossRef] [Green Version]
- Flanagan, S.P.; Edghill, E.L.; Gloyn, A.L.; Ellard, S.; Hattersley, A.T. Mutations in KCNJ11, which encodes Kir6.2, are a common cause of diabetes diagnosed in the first 6 months of life, with the phenotype determined by genotype. Diabetologia 2006, 49, 1190–1197. [Google Scholar] [CrossRef] [Green Version]
- Bonnefond, A.; Philippe, J.; Durand, E.; Dechaume, A.; Huyvaert, M.; Montagne, L.; Marre, M.; Balkau, B.; Fajardy, I.; Vambergue, A.; et al. Whole-exome sequencing and high throughput genotyping identified KCNJ11 as the thirteenth MODY gene. PLoS ONE 2012, 7, e37423. [Google Scholar] [CrossRef]
- Baturin, A.K.; Sorokina, E.Y.; Pogozheva, A.V.; Peskova, E.V.; Makurina, O.N.; Tutelyan, V.A. The study of the association of polymorphism rs5219 gene KCNJ11 with obesity and the risk of type 2 diabetes among residents of the Moscow Region. Vopr. Pitan. 2015, 84, 4–9. [Google Scholar]
- Froguel, P.; Zouali, H.; Vionnet, N.; Velho, G.; Vaxillaire, M.; Sun, F.; Lesage, S.; Stoffel, M.; Takeda, J.; Passa, P.; et al. Familial Hyperglycemia Due to Mutations in Glucokinase—Definition of a Subtype of Diabetes Mellitus. N. Engl. J. Med. 1993, 328, 697–702. [Google Scholar] [CrossRef]
- Yamagata, K.; Oda, N.; Kaisaki, P.J.; Menzel, S.; Furuta, H.; Vaxillaire, M.; Southam, L.; Cox, R.D.; Lathrop, G.M.; Boriraj, V.V.; et al. Mutations in the hepatocyte nuclear factor-1α gene in maturity-onset diabetes of the young (MODY3). Nature 1996, 384, 455–458. [Google Scholar] [CrossRef] [PubMed]
- Horikawa, Y.; Iwasaki, N.; Hara, M.; Furuta, H.; Hinokio, Y.; Cockburn, B.N.; Lindner, T.; Yamagata, K.; Ogata, M.; Tomonaga, O.; et al. Mutation in hepatocyte nuclear factor–1β gene (TCF2) associated with MODY. Nat. Genet. 1997, 17, 384–385. [Google Scholar] [CrossRef]
- Yamagata, K.; Furuta, H.; Oda, N.; Kaisaki, P.J.; Menzel, S.; Cox, N.J.; Fajans, S.S.; Signorini, S.; Stoffel, M.; Bell, G.I. Mutations in the hepatocyte nuclear factor-4α gene in maturity-onset diabetes of the young (MODY1). Nature 1996, 384, 458–460. [Google Scholar] [CrossRef]
- Staffers, D.A.; Ferrer, J.; Clarke, W.L.; Habener, J.F. Early-onset type-ll diabetes mellitus (MODY4) linked to IPF1. Nat. Genet. 1997, 17, 138–139. [Google Scholar] [CrossRef] [PubMed]
- Malecki, M.T.; Jhala, U.S.; Antonellis, A.; Fields, L.; Doria, A.; Orban, T.; Saad, M.; Warram, J.H.; Montminy, M.; Krolewski, A.S. Mutations in NEUROD1 are associated with the development of type 2 diabetes mellitus. Nat. Genet. 1999, 23, 323–328. [Google Scholar] [CrossRef] [PubMed]
- Fajans, S.S.; Bell, G.I.; Polonsky, K.S. Molecular Mechanisms and Clinical Pathophysiology of Maturity-Onset Diabetes of the Young. N. Engl. J. Med. 2001, 345, 971–980. [Google Scholar] [CrossRef] [PubMed]
- Hegele, R.A.; Cao, H.; Harris, S.B.; Hanley, A.J.G.; Zinman, B. The Hepatic Nuclear Factor-1α G319S Variant Is Associated with Early-Onset Type 2 Diabetes in Canadian Oji-Cree. J. Clin. Endocrinol. Metab. 1999, 84, 1077–1082. [Google Scholar] [CrossRef] [Green Version]
- Scuteri, A.; Sanna, S.; Chen, W.-M.; Uda, M.; Albai, G.; Strait, J.; Najjar, S.; Nagaraja, R.; Orrú, M.; Usala, G.; et al. Genome-wide association scan shows genetic variants in the FTO gene are associated with obesity-related traits. PLoS Genet. 2007, 3, e115. [Google Scholar] [CrossRef]
- Sutherland, A.P.R.; Wali, J.A.; Thomas, H.E. Linking obesity with type 2 diabetes: The role of T-bet. Diabetes Metab. Syndr. Obesity Targets Ther. 2014, 7, 331–340. [Google Scholar] [CrossRef] [Green Version]
- De Mello, A.H.; Costa, A.B.; Engel, J.D.G.; Rezin, G.T. Mitochondrial dysfunction in obesity. Life Sci. Life Sci. 2018, 192, 26–32. [Google Scholar] [CrossRef]
- Lowell, B.B.; Shulman, G.I. Mitochondrial dysfunction and type 2 diabetes. Science 2005, 307, 384–387. [Google Scholar] [CrossRef] [Green Version]
- Ray, I.; Bhattacharya, A.; De, R.K. OCDD: An obesity and co-morbid disease database. BioData Min. 2017, 10, 33. [Google Scholar] [CrossRef] [Green Version]
- Yu, Y.; Ouyang, Y.; Yao, W. shinyCircos: An R/Shiny application for interactive creation of Circos plot. Bioinformatics 2018, 34, 1229–1231. [Google Scholar] [CrossRef] [Green Version]
- Kent, W.J.; Sugnet, C.W.; Furey, T.S.; Roskin, K.M.; Pringle, T.H.; Zahler, A.M.; Haussler, A.D. The human genome browser at UCSC. Genome Res. 2002, 12, 996–1006. [Google Scholar] [CrossRef] [PubMed] [Green Version]
- Szklarczyk, D.; Franceschini, A.; Wyder, S.; Forslund, K.; Heller, D.; Huerta-Cepas, J.; Simonovic, M.; Roth, A.; Santos, A.; Tsafou, K.P.; et al. STRING v10: Protein-protein interaction networks, integrated over the tree of life. Nucleic Acids Res. 2014, 43, D447–D452. [Google Scholar] [CrossRef] [PubMed]
- Shannon, P.; Markiel, A.; Ozier, O.; Baliga, N.S.; Wang, J.T.; Ramage, D.; Amin, N.; Schwikowski, B.; Ideker, T. Cytoscape: A software environment for integrated models of biomolecular interaction networks. Genome Res. 2003, 13, 2498–2504. [Google Scholar] [CrossRef] [PubMed]
- Bader, G.D.; Hogue, C.W.V. An automated method for finding molecular complexes in large protein interaction networks. BMC Bioinform. 2003, 4, 2. [Google Scholar] [CrossRef] [PubMed] [Green Version]
- Bindea, G.; Mlecnik, B.; Hackl, H.; Charoentong, P.; Tosolini, M.; Kirilovsky, A.; Fridman, W.-H.; Pagès, F.; Trajanoski, Z.; Galon, J. ClueGO: A Cytoscape plugin to decipher functionally grouped gene ontology and pathway annotation networks. Bioinformatics 2009, 25, 1091–1093. [Google Scholar] [CrossRef] [Green Version]
- Bindea, G.; Galon, J.; Mlecnik, B. CluePedia Cytoscape plugin: Pathway insights using integrated experimental and in silico data. Bioinformatics 2013, 29, 661–663. [Google Scholar] [CrossRef]
- Kumar, S.U.; Kumar, D.T.; Siva, R.; Doss, C.G.P.; Zayed, H. Integrative Bioinformatics Approaches to Map Potential Novel Genes and Pathways Involved in Ovarian Cancer. Front. Bioeng. Biotechnol. 2019, 7, 391. [Google Scholar] [CrossRef] [Green Version]
- Kumar, S.U.; Kumar, D.T.; Siva, R.; Doss, C.G.P.; Younes, S.; Younes, N.; Sidenna, M.; Zayed, H. Dysregulation of Signaling Pathways Due to Differentially Expressed Genes From the B-Cell Transcriptomes of Systemic Lupus Erythematosus Patients—A Bioinformatics Approach. Front. Bioeng. Biotechnol. 2020, 8, 276. [Google Scholar] [CrossRef]
- Kumar, S.U.; Kumar, D.T.; Bithia, R.; Sankar, S.; Magesh, R.; Sidenna, M.; Doss, C.G.P.; Zayed, H. Analysis of Differentially Expressed Genes and Molecular Pathways in Familial Hypercholesterolemia Involved in Atherosclerosis: A Systematic and Bioinformatics Approach. Front. Genet. 2020, 11, 734. [Google Scholar] [CrossRef]
- Feinstein, R.; Kanety, H.; Papa, M.Z.; Lunenfeld, B.; Karasik, A. Tumor necrosis factor-α suppresses insulin-induced tyrosine phosphorylation of insulin receptor and its substrates. J. Biol. Chem. 1993, 268, 26055–26058. [Google Scholar]
- Kim, J.; Bachmann, R.A.; Chen, J. Interleukin-6 and insulin resistance. Vitam. Horm. 2009, 80, 613–633. [Google Scholar] [CrossRef] [PubMed]
- Hotamisligil, G.K.S.; Peraldi, P.; Budavari, A.; Ellis, R.; White, M.F.; Spiegelman, B.M. IRS-1-mediated inhibition of insulin receptor tyrosine kinase activity in TNF-α- and obesity-induced insulin resistance. Science 1996, 271, 665–670. [Google Scholar] [CrossRef] [PubMed]
- Febbraio, M.A. Role of interleukins in obesity: Implications for metabolic disease. Trends Endocrinol. Metab. 2014, 25, 312–319. [Google Scholar] [CrossRef]
- Mandrup-Poulsen, T. The role of interleukin-1 in the pathogenesis of IDDM. Diabetologia 1996, 39, 1005–1029. [Google Scholar] [CrossRef]
- Ponugoti, B.; Dong, G.; Graves, D.T. Role of forkhead transcription factors in diabetes-induced oxidative stress. Exp. Diabetes Res. 2012, 2012, 1–7. [Google Scholar] [CrossRef] [Green Version]
- Kamagate, A.; Dong, H.H. FoxO1 integrates insulin signaling to VLDL production. Cell Cycle 2008, 7, 3162–3170. [Google Scholar] [CrossRef]
- Wang, Y.; Zhou, Y.; Graves, D.T. FOXO transcription factors: Their clinical significance and regulation. BioMed Res. Int. 2014, 2014, 1–13. [Google Scholar] [CrossRef] [Green Version]
- Lewis, G.F.; Carpentier, A.; Adeli, K.; Giacca, A. Disordered fat storage and mobilization in the pathogenesis of insulin resistance and type 2 diabetes. Endocr. Rev. 2002, 23, 201–229. [Google Scholar] [CrossRef]
- Figueroa, D.M.; Gordon, E.M.; Yao, X.; Levine, S.J. Chapter 13—Apolipoproteins as context-dependent regulators of lung inflammation. In Mechanisms and Manifestations of Obesity in Lung Disease; Johnston, R.A., Suratt, B.T., Eds.; Academic Press: Cambridge, MA, USA, 2019; pp. 301–326. [Google Scholar] [CrossRef]
- Lönn, M.; Mehlig, K.; Bengtsson, C.; Lissner, L. Adipocyte size predicts incidence of type 2 diabetes in women. FASEB J. 2009, 24, 326–331. [Google Scholar] [CrossRef] [PubMed]
- Krotkiewski, M.; Björntorp, P.; Sjöström, L.; Smith, U. Impact of obesity on metabolism in men and women. Importance of regional adipose tissue distribution. J. Clin. Investig. 1983, 72, 1150–1162. [Google Scholar] [CrossRef]
- Perry, R.J.; Camporez, J.-P.G.; Kursawe, R.; Titchenell, P.M.; Zhang, D.; Perry, C.J.; Jurczak, M.J.; Abudukadier, A.; Han, M.S.; Zhang, X.-M.; et al. Hepatic Acetyl CoA Links Adipose Tissue Inflammation to Hepatic Insulin Resistance and Type 2 Diabetes. Cell 2015, 160, 745–758. [Google Scholar] [CrossRef] [PubMed] [Green Version]
- Smith, U.; Kahn, B.B. Adipose tissue regulates insulin sensitivity: Role of adipogenesis, de novo lipogenesis and novel lipids. J. Intern. Med. 2016, 280, 465–475. [Google Scholar] [CrossRef] [PubMed] [Green Version]
- Hamann, A.; Matthaei, S. Regulation of energy balance by leptin. Exp. Clin. Endocrinol. Diabetes 2009, 104, 293–300. [Google Scholar] [CrossRef]
- Daghestani, M.H.; Daghestani, M.H.; Daghistani, M.H.; Eldali, A.; Hassan, Z.K.; Elamin, M.H.; Warsy, A.S. ADRB3 polymorphism rs4994 (Trp64Arg) associates significantly with bodyweight elevation and dyslipidaemias in Saudis but not rs1801253 (Arg389Gly) polymorphism in ARDB1. Lipids Health Dis. 2018, 17, 58. [Google Scholar] [CrossRef] [PubMed] [Green Version]
- Galavi, H.; Noorzehi, N.; Saravani, R.; Sargazi, S.; Mollashahee-Kohkan, F.; Shahraki, H. Genetic polymorphism in ADRB-1 is associated with type 2 diabetes susceptibility in Iranian population. Gene Rep. 2018, 12, 171–174. [Google Scholar] [CrossRef]
- Estrada-Velasco, B.I.; Cruz, M.; Madrid-Marina, V.; A Martínez-Nava, G.; Gomez-Zamudio, J.; I Burguete-García, A. IRS1, TCF7L2, ADRB1, PPARG, and HHEX Polymorphisms Associated with Atherogenic Risk in Mexican Population. BioMed Res. Int. 2013, 2013, 1–7. [Google Scholar] [CrossRef]
- Willer, C.J.; Speliotes, E.K.; Loos, R.J.; Li, S.; Lindgren, C.M.; Heid, I.M.; Lettre, G. Six new loci associated with body mass index highlight a neuronal influence on body weight regulation. Nat. Genet. 2009, 41, 25–34. [Google Scholar] [CrossRef]
- Timper, K.; Brüning, J.C. Hypothalamic circuits regulating appetite and energy homeostasis: Pathways to obesity. Dis. Model. Mech. 2017, 10, 679–689. [Google Scholar] [CrossRef] [Green Version]
- Doulla, M.; McIntyre, A.D.; Hegele, R.A.; Gallego, P.H. A novel MC4R mutation associated with childhood-onset obesity: A case report. Paediatr. Child Health 2014, 19, 515–518. [Google Scholar] [CrossRef] [Green Version]
- Qi, L.; Kraft, P.; Hunter, D.J.; Hu, F.B. The common obesity variant near MC4R gene is associated with higher intakes of total energy and dietary fat, weight change and diabetes risk in women. Hum. Mol. Genet. 2008, 17, 3502–3508. [Google Scholar] [CrossRef] [Green Version]
- Jung, U.J.; Choi, M.-S. Obesity and its metabolic complications: The role of adipokines and the relationship between obesity, inflammation, insulin resistance, dyslipidemia and nonalcoholic fatty liver disease. Int. J. Mol. Sci. 2014, 15, 6184–6223. [Google Scholar] [CrossRef] [Green Version]
- Lee, S.; Kwak, H.-B. Role of adiponectin in metabolic and cardiovascular disease. J. Exerc. Rehabil. 2014, 10, 54–59. [Google Scholar] [CrossRef] [Green Version]
- DeRosa, G.; Catena, G.; Gaudio, G.; D’Angelo, A.; Maffioli, P. Adipose tissue dysfunction and metabolic disorders: Is it possible to predict who will develop type 2 diabetes mellitus? Role of markErs in the progreSsion of dIabeteS in obese paTIeNts (The RESISTIN trial). Cytokine 2020, 127, 154947. [Google Scholar] [CrossRef]
- Farooqi, I.S.; Drop, S.; Clements, A.; Keogh, J.M.; Biernacka, J.; Lowenbein, S.; Challis, B.G.; O’Rahilly, S. Heterozygosity for a POMC-null mutation and increased obesity risk in humans. Diabetes 2006, 55, 2549–2553. [Google Scholar] [CrossRef] [Green Version]
- Aslan, I.R.; Ranadive, S.A.; Valle, I.; Kollipara, S.; Noble, J.A.; Vaisse, C. The melanocortin system and insulin resistance in humans: Insights from a patient with complete POMC deficiency and type 1 diabetes mellitus. Int. J. Obes. 2013, 38, 148–151. [Google Scholar] [CrossRef] [PubMed] [Green Version]
- Parton, L.E.; Ye, C.P.; Coppari, R.; Enriori, P.J.; Choi, B.; Zhang, C.-Y.; Xu, C.; Vianna, C.R.; Balthasar, N.; Lee, C.E.; et al. Glucose sensing by POMC neurons regulates glucose homeostasis and is impaired in obesity. Nature 2007, 449, 228–232. [Google Scholar] [CrossRef] [PubMed]
- Schmieder, R.E.; Hilgers, K.F.; Schlaich, M.P.; Schmidt, B.M.W. Renin-angiotensin system and cardiovascular risk. Lancet 2007, 369, 1208–1219. [Google Scholar] [CrossRef]
- Engeli, S.; Gorzelniak, K.; Kreutz, R.; Runkel, N.; Distler, A.; Sharma, A.M. Co-expression of renin-angiotensin system genes in human adipose tissue. J. Hypertens. 1999, 17, 555–560. [Google Scholar] [CrossRef] [PubMed]
- Yvan-Charvet, L.; Quignard-Boulangé, A. Role of adipose tissue renin-angiotensin system in metabolic and inflammatory diseases associated with obesity. Kidney Int. 2011, 79, 162–168. [Google Scholar] [CrossRef] [PubMed]
- Kalupahana, N.S.; Moustaid-Moussa, N. The renin-angiotensin system: A link between obesity, inflammation and insulin resistance. Obes. Rev. 2011, 13, 136–149. [Google Scholar] [CrossRef] [PubMed]
- Herrera, B.M.; Keildson, S.; Lindgren, C.M. Genetics and epigenetics of obesity. Maturitas 2011, 69, 41–49. [Google Scholar] [CrossRef] [PubMed]
- Lev-Ran, A. Thrifty genotype: How applicable is it to obesity and type 2 diabetes? Diabetes Rev. 1999, 7, 1–22. [Google Scholar]
- Kahn, C.R. Insulin Action, Diabetogenes, and the Cause of Type II Diabetes. Diabetes 1994, 43, 1066–1085. [Google Scholar] [CrossRef] [PubMed]
- Waterfield, T.; Gloyn, A.L. Monogenic β-cell dysfunction in children: Clinical phenotypes, genetic etiology and mutational pathways. Pediatr. Health 2008, 2, 517–532. [Google Scholar] [CrossRef]


| S.no | Simple Parameters | Comprehended Values |
|---|---|---|
| 1. | Nodes number | 514 |
| 2. | Characteristic path length | 3.171 |
| 3. | Network heterogeneity | 1.068 |
| 4. | Clustering coefficient | 0.484 |
| 5. | Average number of neighbors | 16.054 |
| 6. | Network centralization | 0.196 |
| 7. | Network density | 0.031 |
| 8. | Network diameter | 9 |
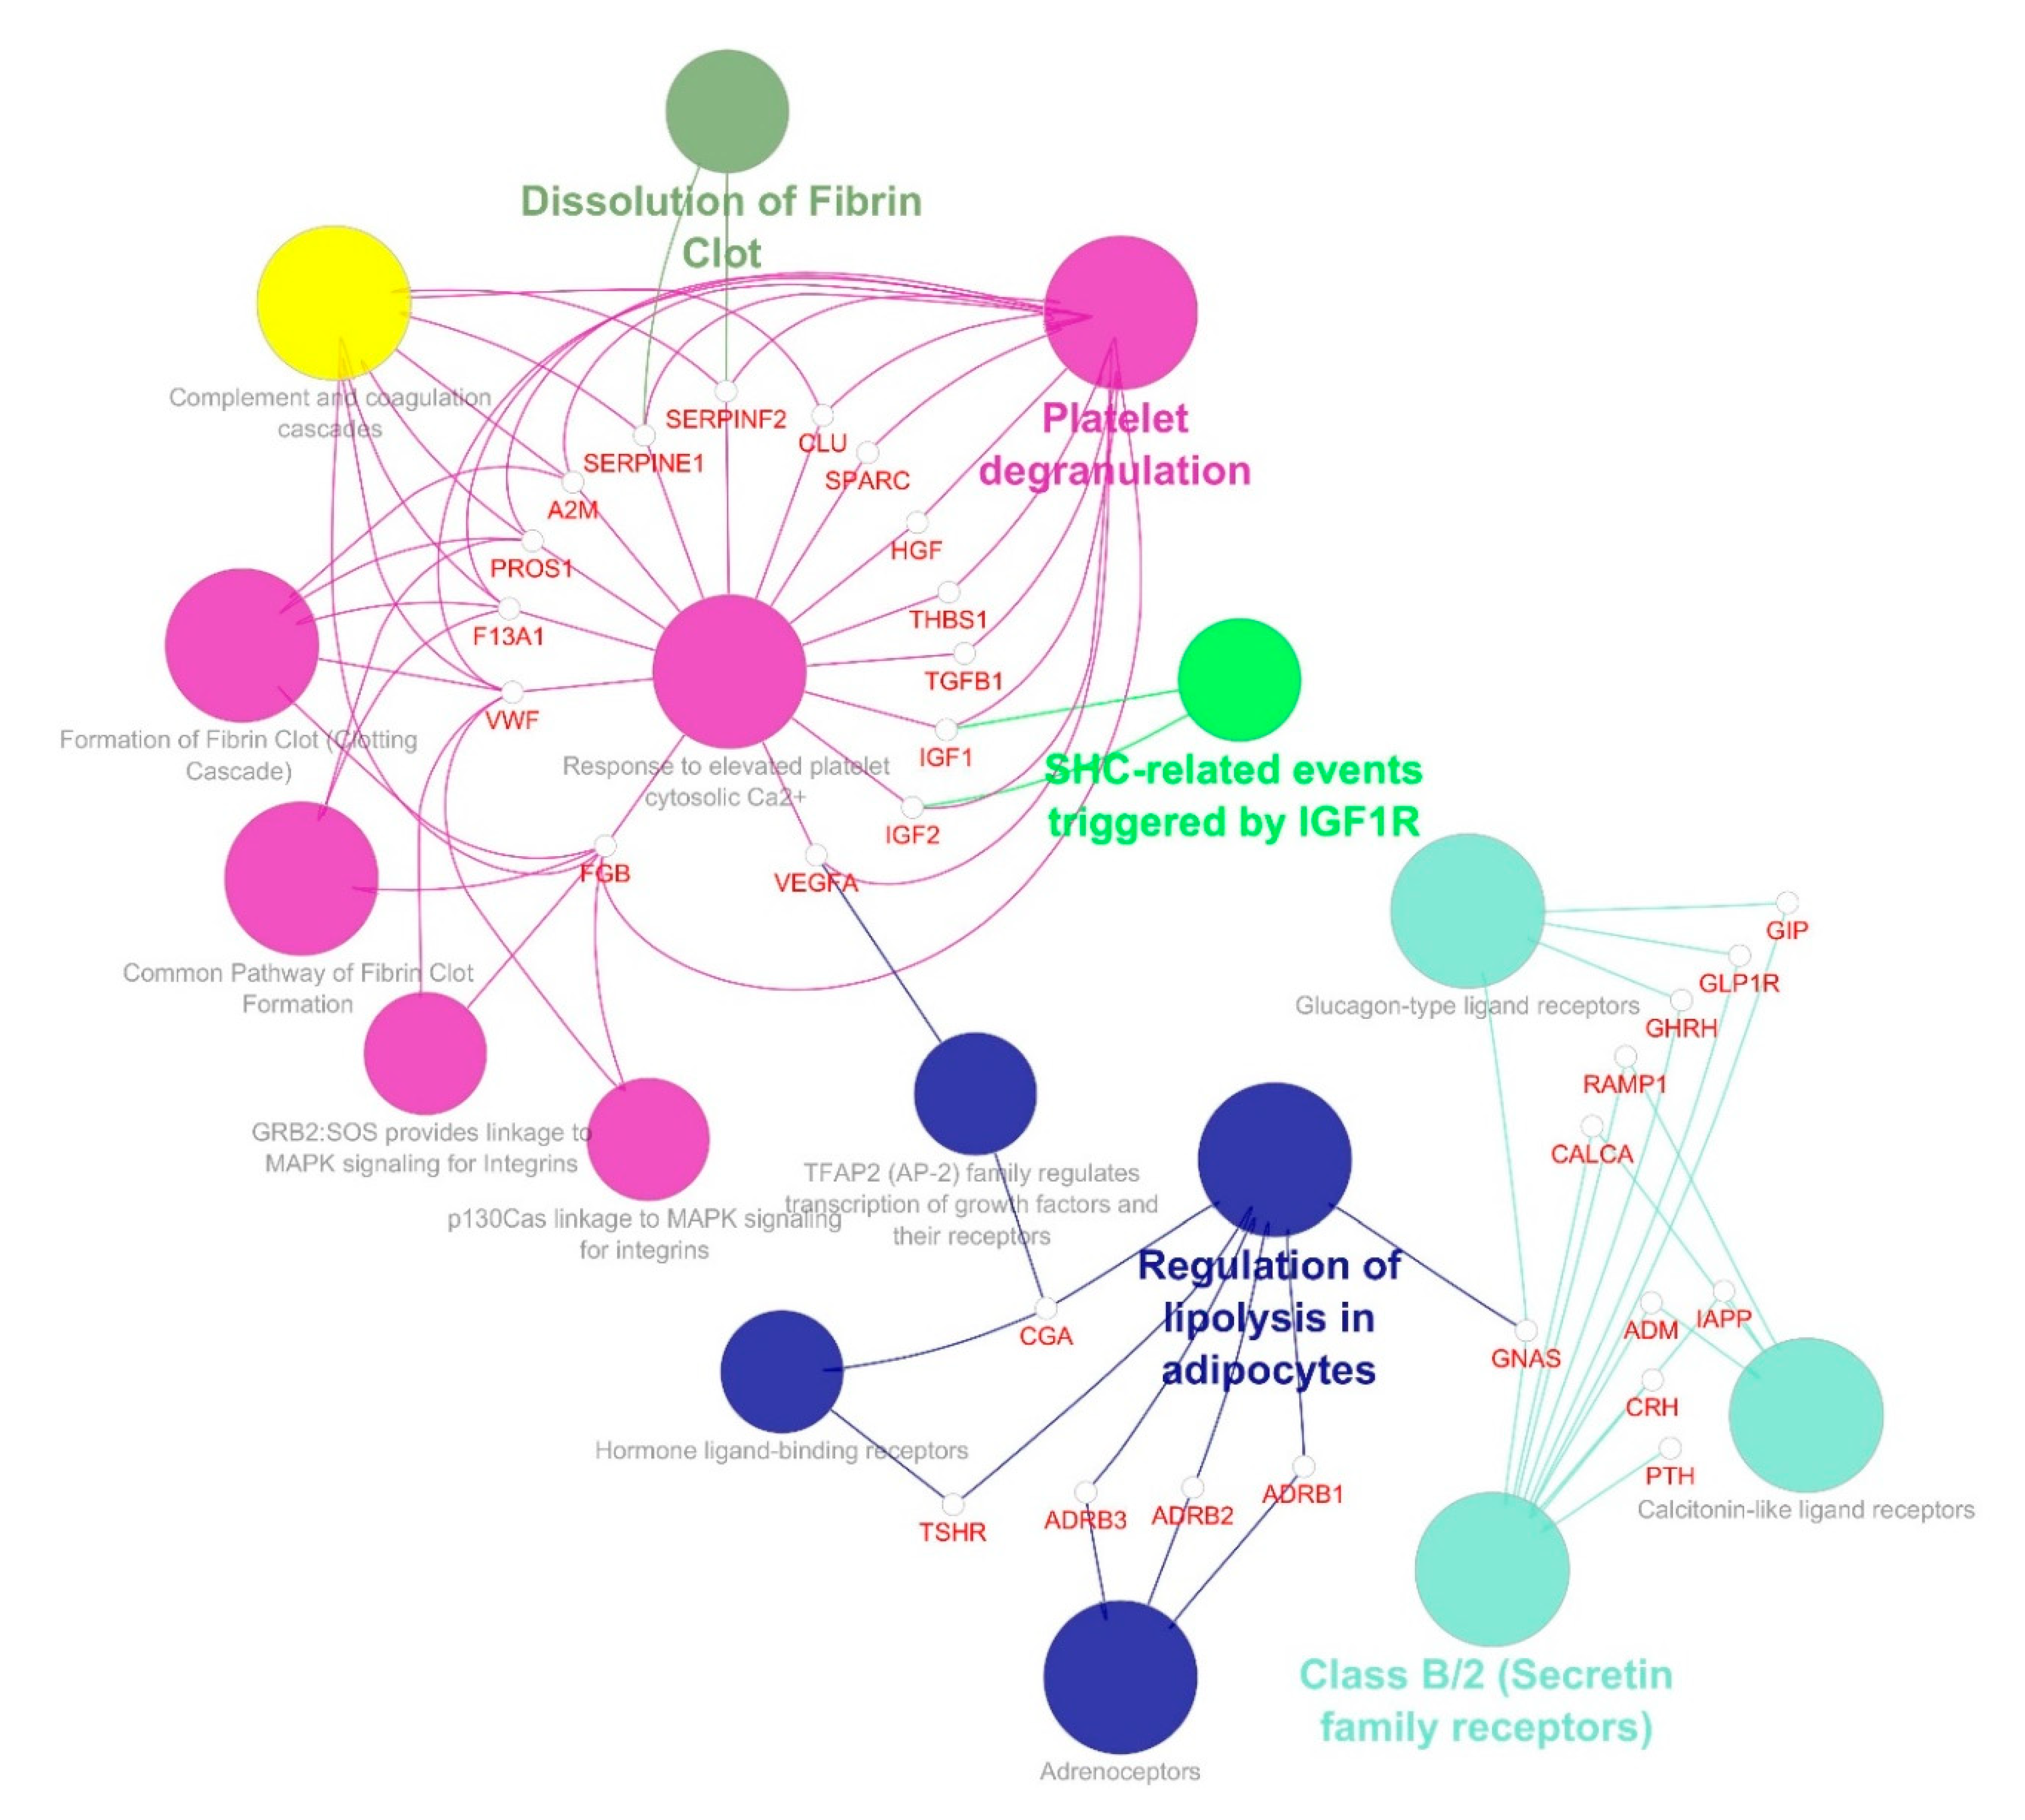
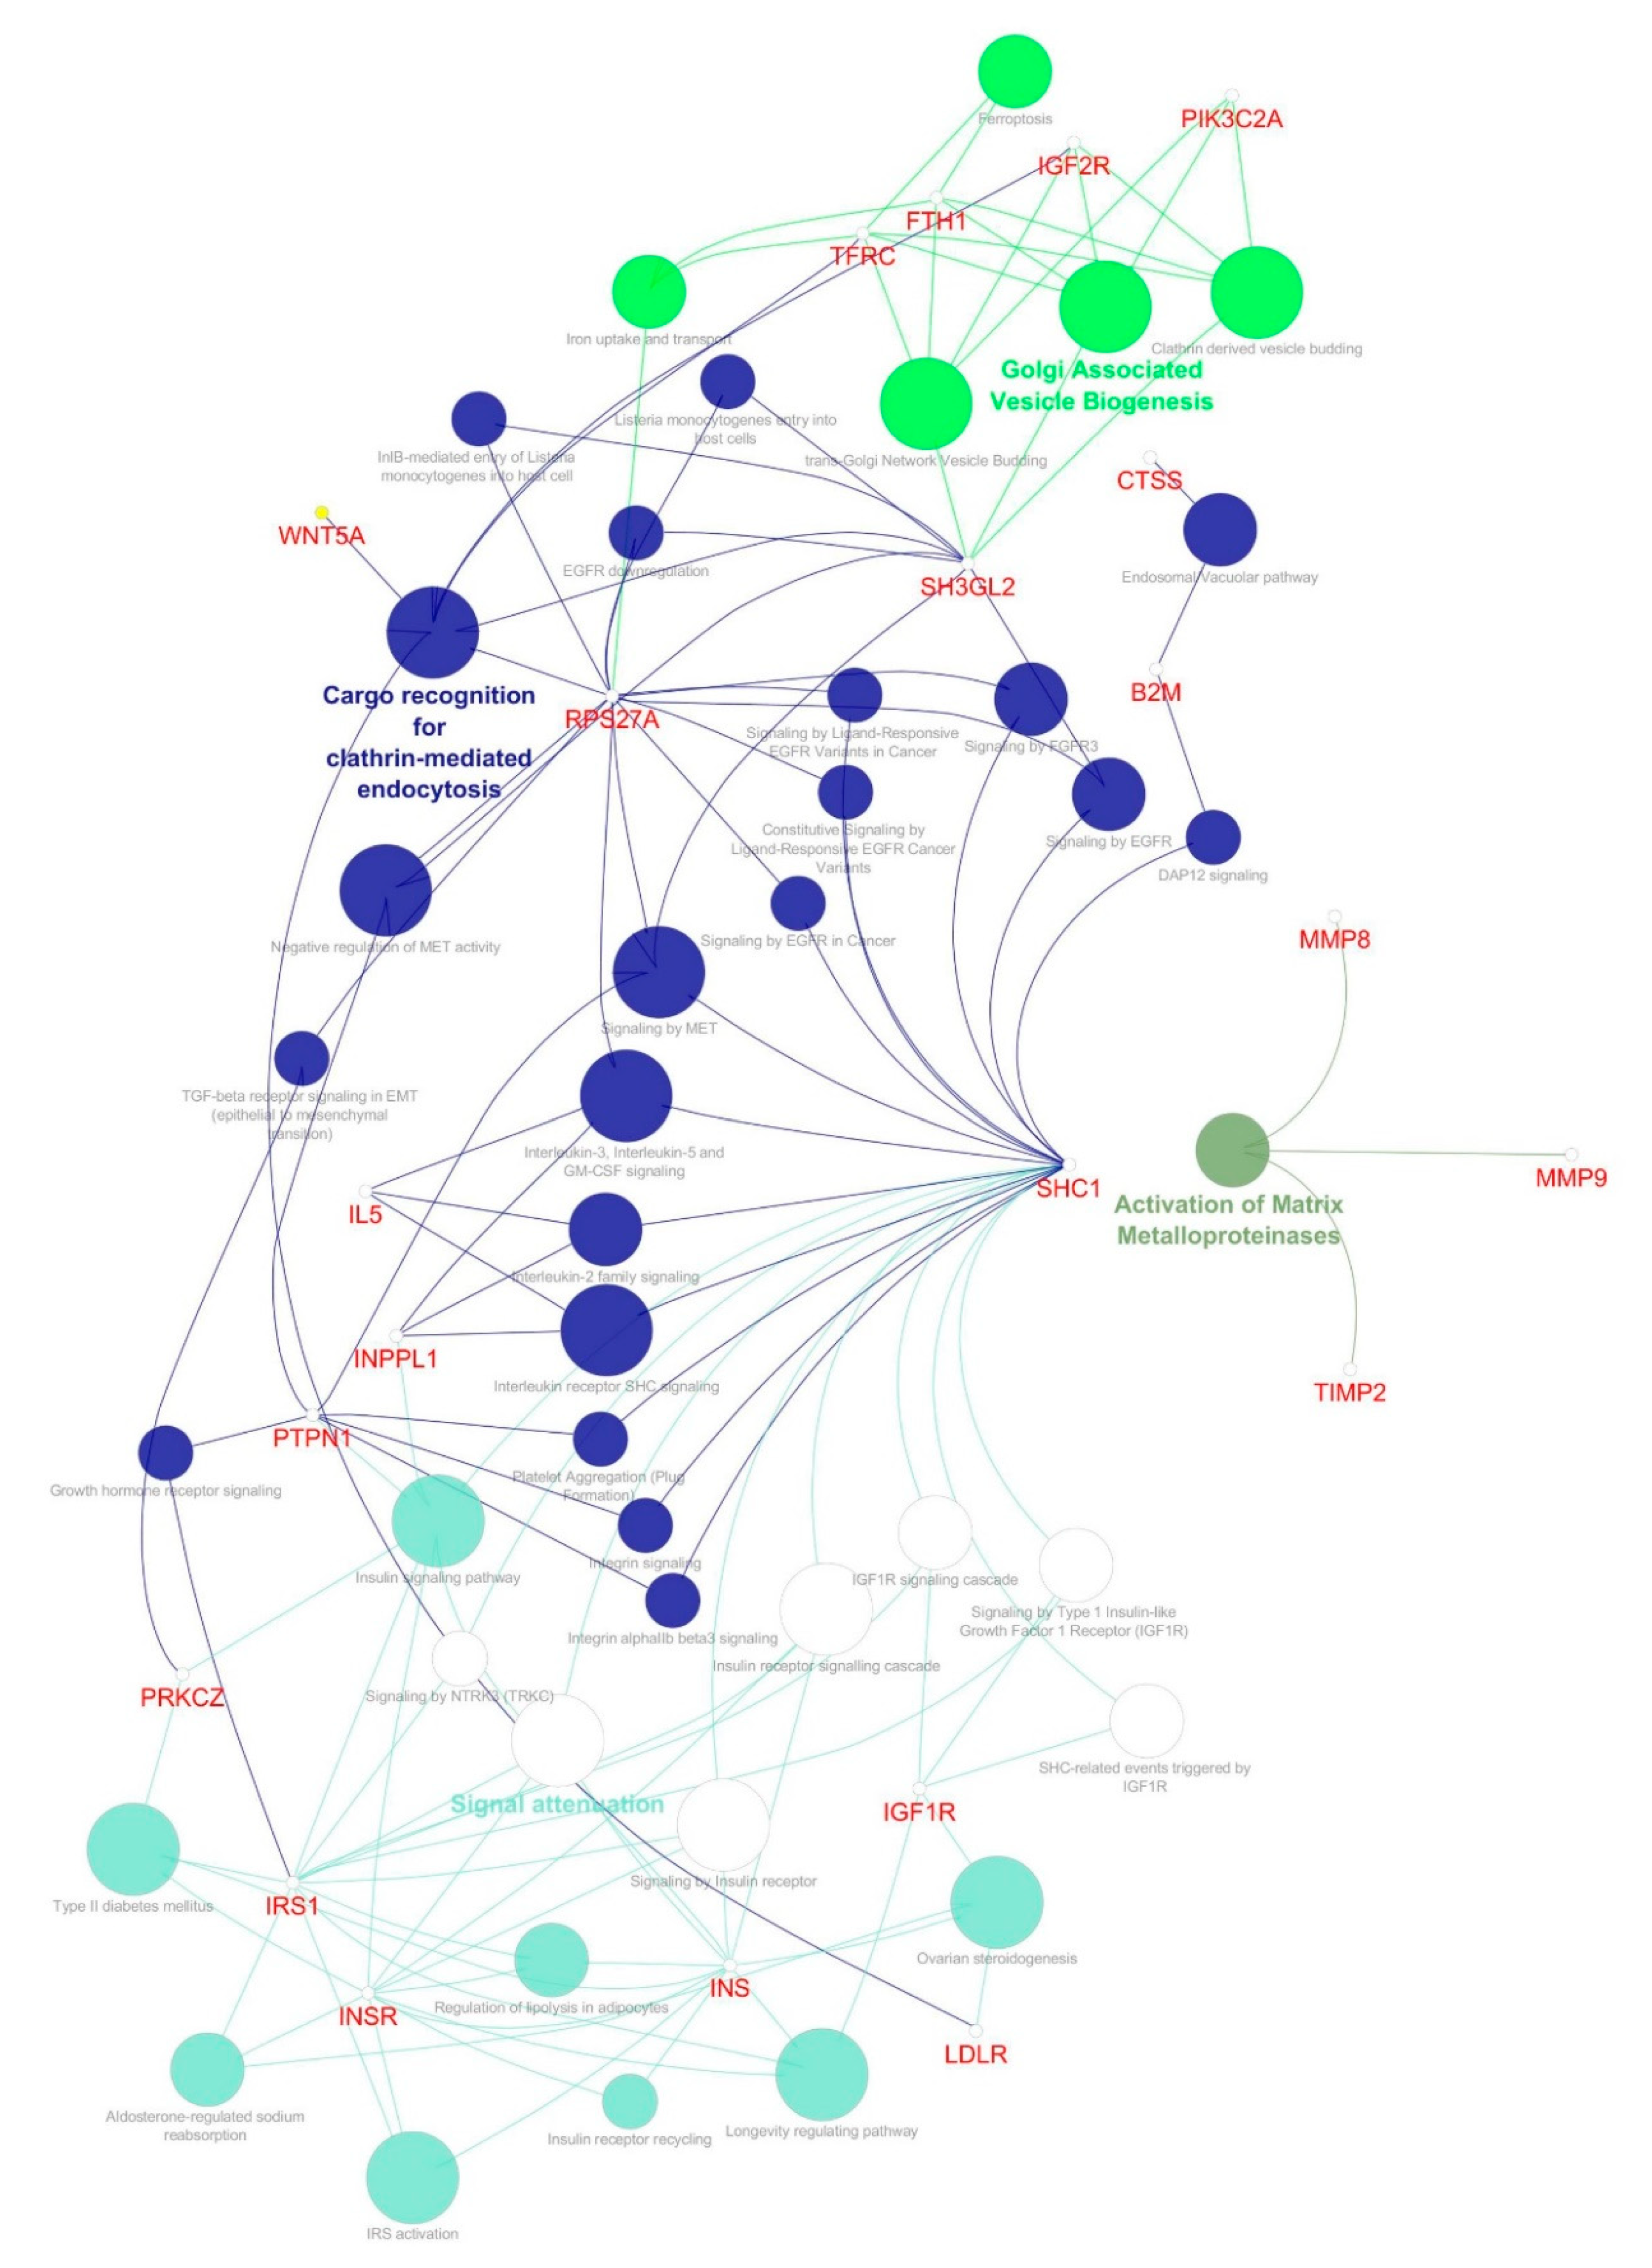
| Cluster | Score (Density * # Nodes) | Nodes | Edges | Nodes IDs |
|---|---|---|---|---|
| 1 | 33.61 | 83 | 1378 | C3, TNC, APOA2, MTNR1A, MTNR1B, CXCL5, SERPINA1, AHSG, ALB, GAST, BMP4, SPP1, SST, APOA5, PYY, F5, FGF23, IGFBP3, PPY, CCK, TRH, CCKAR, GNRH1, GCG, GRP, OPRM1, HCRT, GPR39, GHSR, IGFBP7, DRD4, POMC, CX3CR1, ADRA2A, APOA1, TAC1, NTS, GAL, ADRA2B, TIMP1, HTR1A, CCR2, APOB, FGA, BDKRB2, GNAI1, KNG1, PNPLA2, APOE, APLNR, APLN, IGFBP1, CASR, AGTR1, CXCL8, EDN1, MLN, EDNRA, PROC, OXT, PCSK9, AGT, CNR1, DRD2, PIK3R1, PIK3CA, F2, CXCR4, SERPINC1, IGFBP5, CCL5, APP, HTR2A, CCR5, CSF1, CNR2, NPY, GCGR, CP, TF, IL6, CST3, ADORA1 |
| 2 | 16.788 | 34 | 277 | GIP, PROS1, FGB, TGFB1, CLU, ADRB3, IGF1, MC4R, VWF, A2M, CALCA, PTH, IAPP, HGF, CGA, RAMP1, ADRB1, DRD1, F13A1, SERPINF2, SPARC, TSHR, GNAS, GLP1R, THBS1, GPBAR1, ADRB2, SERPINE1, ADM, CRH, MC3R, GHRH, IGF2, VEGFA |
| 3 | 6.783 | 24 | 78 | SH3GL2, INPPL1, TIMP2, CTSS, IL5, LTF, SHC1, PIK3C2A, IRS1, TFRC, MMP8, PTPN1, HP, B2M, LDLR, PRKCZ, MMP9, INS, WNT5A, FTH1, INSR, IGF1R, IGF2R, RPS27A |
Publisher’s Note: MDPI stays neutral with regard to jurisdictional claims in published maps and institutional affiliations. |
© 2020 by the authors. Licensee MDPI, Basel, Switzerland. This article is an open access article distributed under the terms and conditions of the Creative Commons Attribution (CC BY) license (http://creativecommons.org/licenses/by/4.0/).
Share and Cite
S., U.K.; Rajan, B.; D., T.K.; V., A.P.; Abunada, T.; Younes, S.; Okashah, S.; Ethiraj, S.; C., G.P.D.; Zayed, H. Involvement of Essential Signaling Cascades and Analysis of Gene Networks in Diabesity. Genes 2020, 11, 1256. https://doi.org/10.3390/genes11111256
S. UK, Rajan B, D. TK, V. AP, Abunada T, Younes S, Okashah S, Ethiraj S, C. GPD, Zayed H. Involvement of Essential Signaling Cascades and Analysis of Gene Networks in Diabesity. Genes. 2020; 11(11):1256. https://doi.org/10.3390/genes11111256
Chicago/Turabian StyleS., Udhaya Kumar, Bithia Rajan, Thirumal Kumar D., Anu Preethi V., Taghreed Abunada, Salma Younes, Sarah Okashah, Selvarajan Ethiraj, George Priya Doss C., and Hatem Zayed. 2020. "Involvement of Essential Signaling Cascades and Analysis of Gene Networks in Diabesity" Genes 11, no. 11: 1256. https://doi.org/10.3390/genes11111256