Article

Fenugreek Stimulates the Expression of Genes Involved in Milk Synthesis and Milk Flow through Modulation of Insulin/GH/IGF-1 Axis and Oxytocin Secretion

by
Thomas Sevrin
1,2,
Clair-Yves Boquien
2,
Alexis Gandon
2,
Isabelle Grit
2,
Pierre de Coppet
2,
Dominique Darmaun
2,3 and
Marie-Cécile Alexandre-Gouabau
2,*
1
FRANCE Bébé Nutrition (FBN) Laboratory, 53000 Laval, France
2
Mixed Research Unit 1280 Pathophysiology of Nutritional adaptations (UMR 1280 PhAN) Nantes University, Research Center in Human Nutrition-West (CRNH-O), Institute of Digestive Tract Diseases (IMAD), French National Research Institute for Agriculture, Food and Environment (INRAE), F-44000 Nantes, France
3
Nantes University Hospital (CHU) Nantes, F-44000 Nantes, France
*
Author to whom correspondence should be addressed.
Genes 2020, 11(10), 1208; https://doi.org/10.3390/genes11101208
Submission received: 18 September 2020 / Revised: 6 October 2020 / Accepted: 13 October 2020 / Published: 16 October 2020
(This article belongs to the Special Issue Gene Analysis of Mammary Gland Development and Breast Cancers)

Abstract

:
We previously demonstrated galactagogue effect of fenugreek in a rat model of lactation challenge, foreshadowing its use in women’s breastfeeding management. To assess longitudinal molecular mechanisms involved in milk synthesis/secretion in dams submitted to fenugreek supplementation, inguinal mammary, pituitary glands and plasma were isolated in forty-three rats nursing large 12 pups-litters and assigned to either a control (CTL) or a fenugreek-supplemented (FEN) diet during lactation. RT-PCR were performed at days 12 and 18 of lactation (L12 and L18) and the first day of involution (Inv1) to measure the relative expression of genes related to both milk synthesis and its regulation in the mammary gland and lactogenic hormones in the pituitary gland. Plasma hormone concentrations were measured by ELISA. FEN diet induced 2- to 3-times higher fold change in relative expression of several genes related to macronutrient synthesis (Fasn, Acaca, Fabp3, B4galt1, Lalba and Csn2) and energy metabolism (Cpt1a, Acads) and in IGF-1 receptor in mammary gland, mainly at L12. Pituitary oxytocin expression and plasma insulin concentration (+77.1%) were also significantly increased. Altogether, these findings suggest fenugreek might extend duration of peak milk synthesis through modulation of the insulin/GH/IGF-1 axis and increase milk ejection by activation of oxytocin secretion.

1. Introduction

The World Health Organization (WHO) recommends exclusive breastfeeding for infants up to 6 months of age, based on evidence of its clear health benefits on mother–infant dyad [1,2,3]. Yet, 6 months after delivery, less than 40% of mothers are still breastfeeding in several high-income countries of North America and Europe [4]. Although the early cessation of breastfeeding is multifactorial [5], the perception that their milk secretion is insufficient to support adequate infant growth is reported by about 35% of lactating women [6,7]. Though perceived milk insufficiency due to psychological issues likely is more frequent than true insufficient milk secretion [5,8], the latter can result from many causes, ranging from true physiologic inability to lactate (5% of the cases) to suboptimal breastfeeding management [8,9]. It is well established that mothers’ milk production can often be increased through psychological support or maternal breastfeeding counseling [5,9]. Nevertheless, more and more healthy mothers try to enhance their milk supply by taking various nutritional supplements [10] presumed to have a galactagogue effect.
In the absence of a reference galactagogue molecule, the use of plant extracts has grown rapidly [10], with nowadays 15% to 25% of mothers using herbal remedies to increase their milk supply in Western countries [11,12]. Fenugreek is the most consumed, accounting for 50% of the plant extracts taken during breastfeeding [11], although strong evidence of its effectiveness and safety is scarce [11,13]. In a recent study using the deuterium oxide enrichment method to accurately measure milk secretion in a model of rat nursing large litters [14], we found that dietary fenugreek at a dose of 1 g/kg body weight/day increased milk production by 16% and offspring growth by 11% without any evidence for adverse metabolic effect on either dams or offspring [15], demonstrating a promising potential of fenugreek in the treatment of breastfeeding deficiency. However, the mechanisms underlying its effect remain poorly understood [16] and deciphering the targets of fenugreek in the lactation process should allow initiating careful support to mothers with lactation difficulties.
Milk production is mainly achieved by complex interactions signals both from the endocrine pathway and the local mammary gland environment. Indeed, in response to nipple areola stimulation during suckling, a nervous message is sent to the hypothalamus that stimulates the secretion of both prolactin and oxytocin, the main milk secretory hormones, at the pituitary level. Prolactin stimulates the synthesis of main milk macronutrients by binding to its receptors located on the surface of lactocytes (milk secretory cells). Oxytocin stimulates milk ejection by inducing the contraction of myoepithelial cells surrounding mammary secretory alveoli [17,18]. Insulin also plays an essential role by stimulating mainly protein and lactose synthesis in the mammary gland [19]. Finally, growth hormone (GH) and its effector insulin-like growth factor 1 (IGF-1), and thyroid hormones, can stimulate milk production directly in the mammary gland or by redirecting the nutrient flow toward breast tissues [20,21,22].
Among the therapeutic properties of its numerous bioactive constituents [23,24,25], such as trigonelline or diosgenin, fenugreek may increase prolactin secretion [26] due to an estrogenic action, which decreases the secretion of dopamine (a prolactin secretion inhibitor) in the hypothalamus [26,27,28]. Fenugreek may also increase food consumption through inhibition of leptin secretion [29]. Some fenugreek constituents had also been shown to increase GH secretion by rat pituitary cells [30]. In addition, fenugreek is a well-known hypoglycemic agent [25] due to its capacity to increase insulin secretion by β-pancreatic cells [24]. Finally, fenugreek is rich in antioxidant compounds [24,25] that could sustain an optimal mammary gland function. We hypothesized that fenugreek may increase milk production through an effect on the regulation of lactation.
The objectives of the present study were (i) to determine whether fenugreek impacted genes responsible for the synthesis of milk constituents and milk production, particularly candidate genes present in mammary and pituitary glands and responsible for the regulation of lactogenesis and milk ejection, and (ii) to determine the time course of the observed effects on the candidate genes at 3 time points: mid-lactation, late lactation and early mammary gland involution.

2. Materials and Methods

2.1. Animal Experiment

2.1.1. Housing and Diets

Pregnant Sprague-Dawley rats, purchased from Janvier Labs (Le Genest-Saint-Isle, France) at first gestational day (G1), were housed individually in cages with wood chips located on ventilated racks kept at a constant temperature of 22 ± 1 °C and at a relative humidity of 50% ± 3%. Cages were placed in a room with a fixed 12 h light–dark cycle (light from 7:00 a.m. to 7:00 p.m.). Pregnant rats had access to water and food ad libitum.
During gestation, every dam received a control diet (CTL) based on AIN-93G diet with 20 g protein per 100 g of food. At parturition (G21 = L0), dams received ad libitum either the control diet (CTL) alone or the CTL diet supplemented with dry water extract of fenugreek seeds (Plantex, Sainte-Geneviève-des-Bois, France) (FEN) at 1 g/kg body weight/day as previously described [15]. The diets were manufactured by the “Experimental Food Preparation Unit” (INRAE-UPAE, Jouy-en-Josas, France).

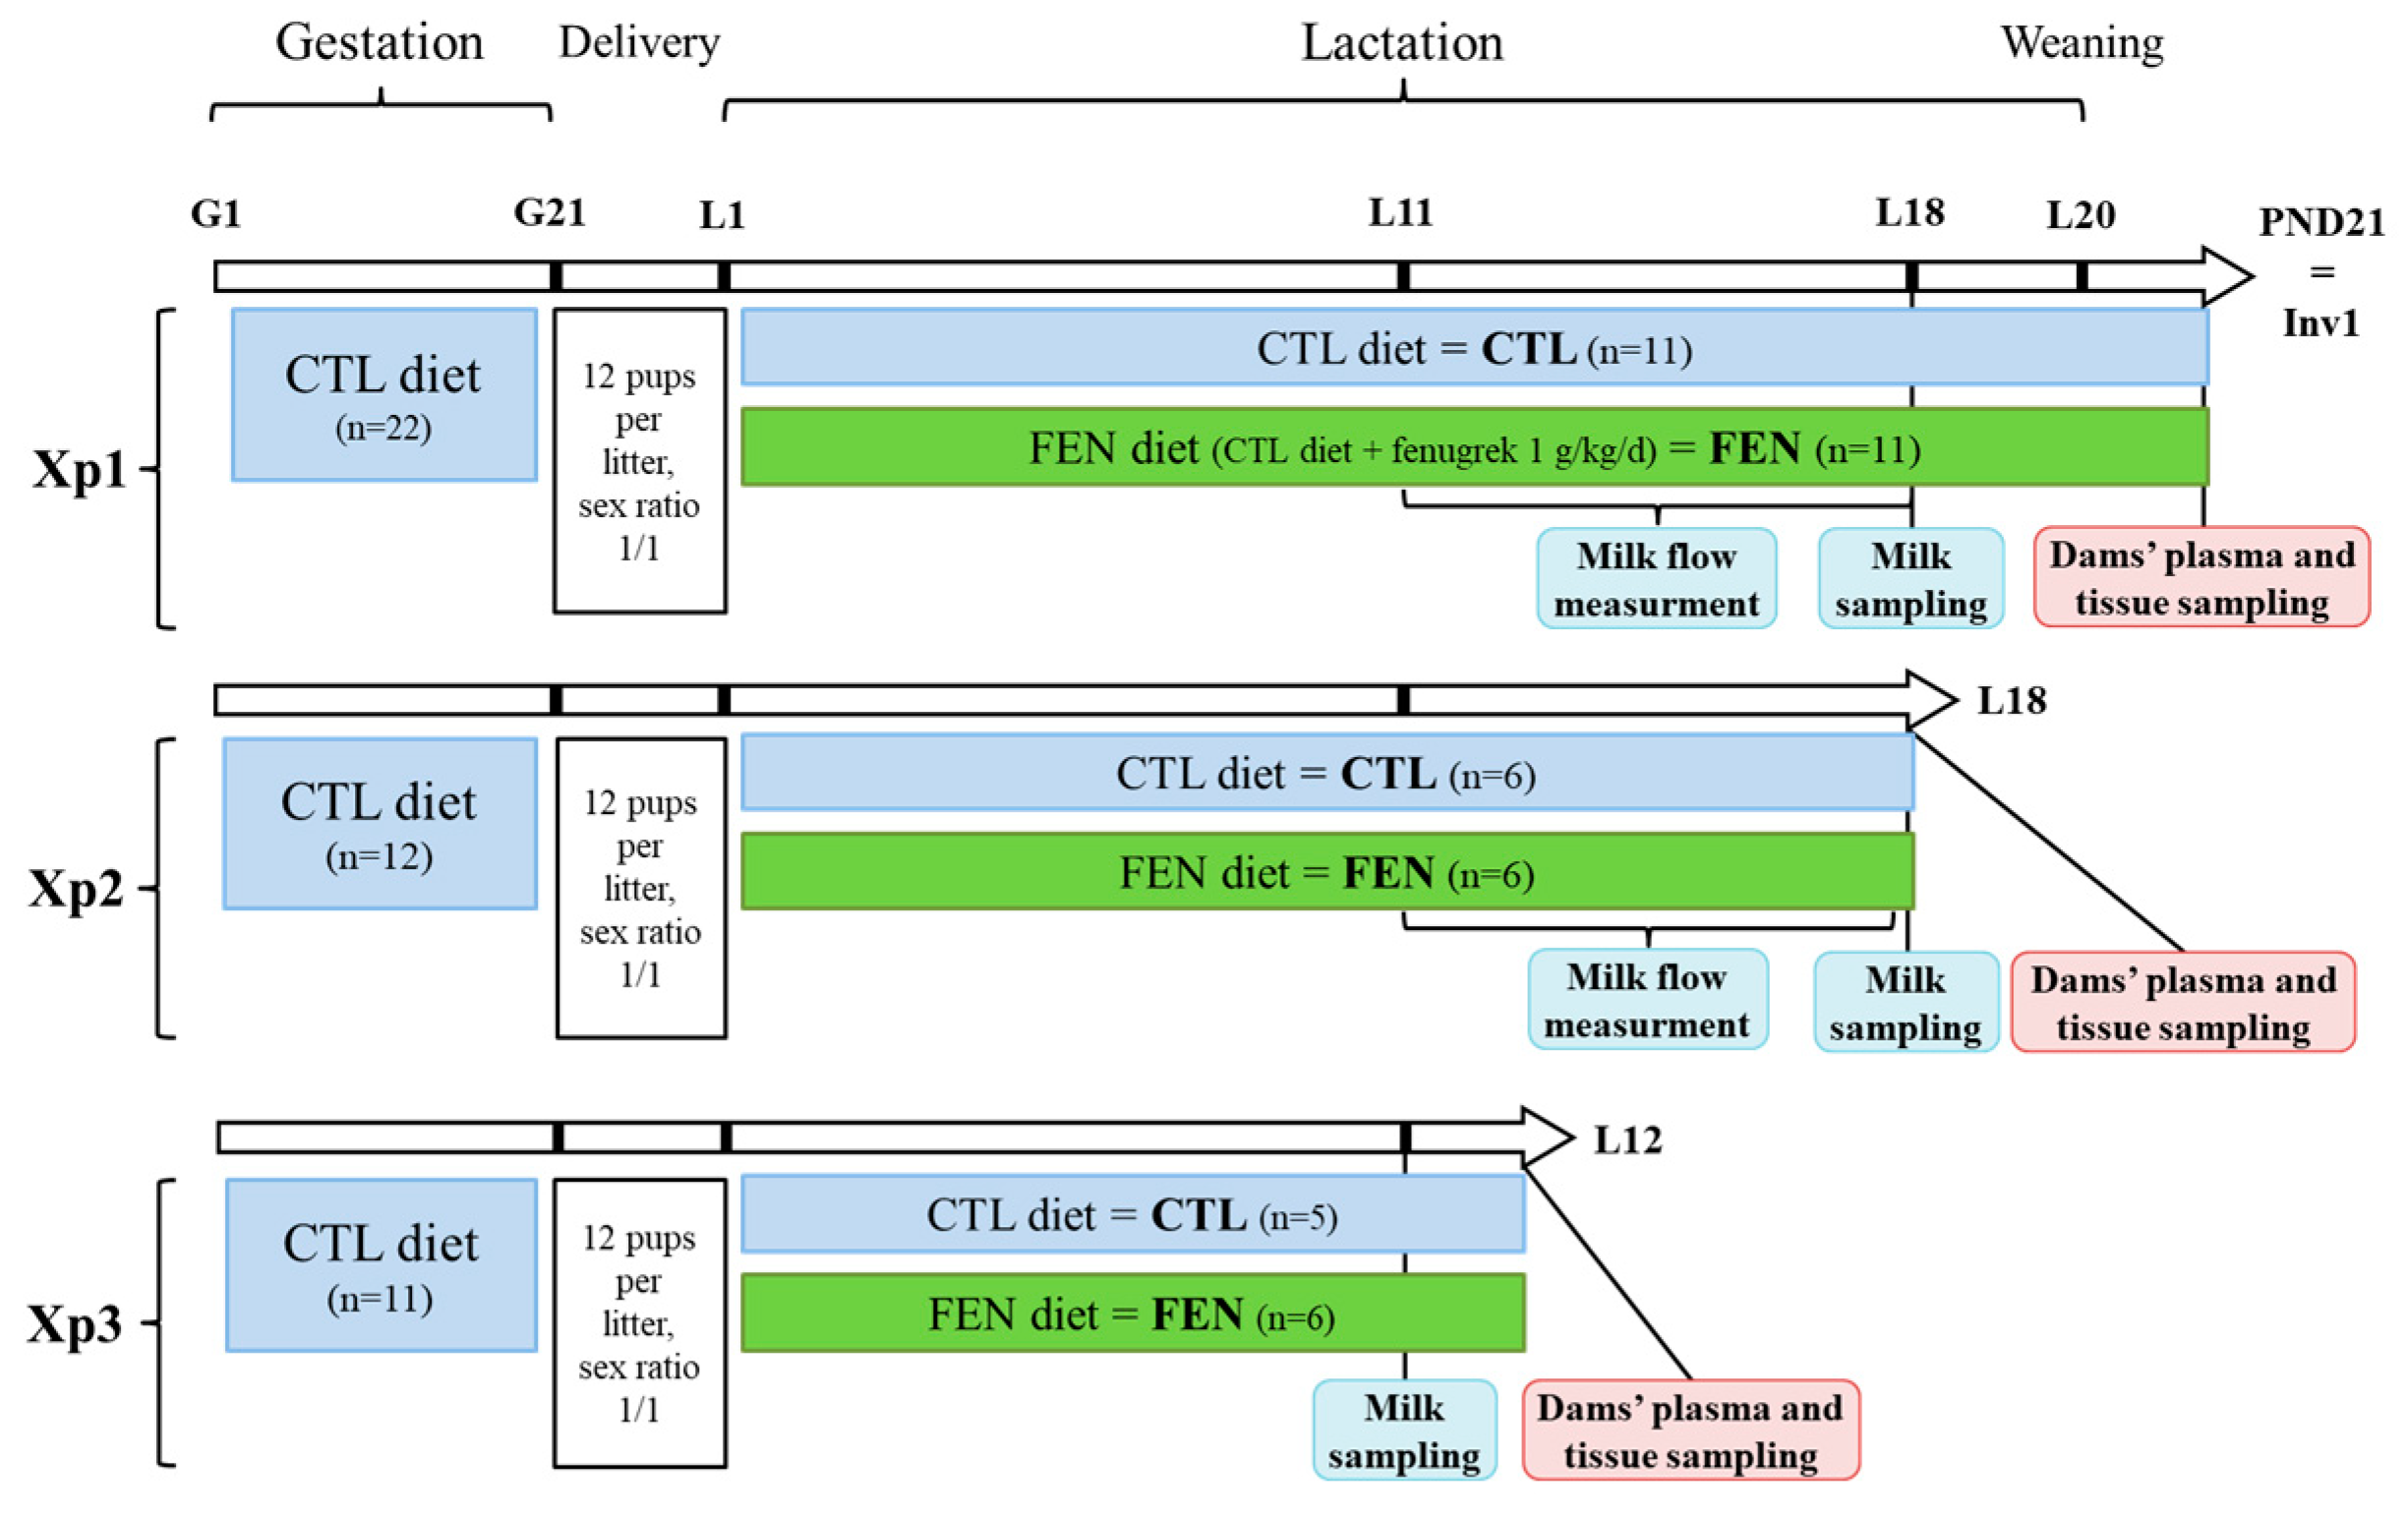
2.1.2. Experimental Design

The experimental protocol was approved by the Animal Ethics committee of Pays de La Loire and registered under reference (protocol APAFIS 2018121018129789) (Angers, France, 10 December 2018). All animal procedures were carried out in accordance with current institutional guidelines on animal experimentation in the EU (directive 2010/63/EU), in France (French Veterinary Department—A44276) and the French Ministry of Research in compliance with the commonly-accepted “3Rs”.
The study consisted of a succession of 3 separate experiments (Xp1, Xp2 and Xp3) with 22, 12 and 11 individual litters respectively, as shown in Figure 1. In the three experiments, all dams received CTL diet during gestation. Delivery occurred at G21 also considered as day 0 of lactation (L0) and dams were randomly assigned either to the CTL or FEN diet throughout lactation. Pups were pooled by sex and randomly adopted by CTL or FEN dams. Litters were homogenized to 12 pups with a sex ratio of 1/1 and balanced weight of 84 ± 2 g (Figure 1). The 3 experiments differed by the time at which animal follow up was stopped: post-natal day 21 for Xp1, L18 for Xp2 and L12 for Xp3. In Xp1 and Xp2, milk flow between dams and their pups was recorded between L11 and L18 using the deuterated water enrichment method and milk sample was collected at L18. In the Xp1, as previously described [14], pups were weaned at L20 to start the involution phase for dams’ mammary glands. At post-natal day 21, also assimilated to first involution day (Inv1), dams were fasted for 4 h before sacrifice and sampling of plasma and tissues. In Xp2, after milk sampling at L18, food and pups were removed from the cage for 2.5 h and 1 h respectively, before the beginning of dams’ sacrifice to avoid bias linked to hormone secretion during suckling. Finally, in Xp3, milk was sampled at L11 and dams were sacrificed at L12 after 1.5 h fasting and 1 h removal of pups (Figure 1).

2.1.3. Dam-Litter Dyad Follow-Up and Milk Flow Measurement

Throughout lactation period, the dam weight, food and water consumption and total litter weight were recorded every two days from L0 to L11, and every day from L11 to L18. Pup weight was calculated as litter weight divided by litter size (12) and weight gain by subtracting weight al L0 from daily weight.
Milk flow was measured by the water turnover method as previously described [14,15]. Briefly, at L11, after 4%, isoflurane anesthesia, mothers received an injection of 4.92 ± 0.10 g/kg body weight D2O (99.9 mole% D2-enrichment, Sigma-Aldrich, Lyon, France) into a tail vein. Plasma samples were collected from dams by tail snip from L11 to L15 and pooled urine samples from their own whole litters were collected from L12 to L18 by stimulating lower belly with an iced cotton bud. The D2O enrichment of both plasma and urine samples was measured using the Fourier Transform infrared spectrophotometer α II® (Brucker, Rheinstetten, Germany). Milk flow calculation was performed using a bi-compartmental model [15] as no significant intra-litter sexual dimorphism was observed in previous experiments [14]. Flow constants of the model (h−1) were then determined with the SAAM II® software (The Epsilon Group, Charlottesville, Virginia, US) and the dams’ total body water (g) using the intercept of dams D2O concentration curve. The water flow, from dams to their own litter (g/h), was calculated as the product of total body water by flow constant from dam to the litter and was expressed in g/day by multiplying by 24.

2.1.4. Milk, Plasma and Tissue Sampling

After 20 min dam/pups’ separation and intraperitoneal injection of oxytocin (1 unit of Syntocinon®; Sigma-Tau, Ivry-sur-Seine, France) to stimulate milk ejection, dams were anaesthetized with 4% of isoflurane, and milk was manually collected and stored at −20 °C until analysis. Blood samples were collected before animal sacrifice via intra-cardiac puncture and placed into Ethylene Diamine Tetraacetic Acid (EDTA) tubes (Pfizer-Centravet, Plancoët, France), centrifuged at 1132 g for 15 min at 4 °C, and plasma were stored at −20 °C until analysis. Dams were sacrificed by intra-cardiac injection of 0.5 mL Exagon® (Richter pharma, Wels, Austria). Left inguinal mammary gland and pituitary gland were removed, sampled and immediately frozen in liquid nitrogen before storage at −80 °C.

2.2. Determination of Gene Expression in Mammary and Pituitary Glands Using RT-qPCR

2.2.1. RNA Extraction and Purification

The entire pituitary gland (weight 19 ± 5 mg) or 28 ± 8 mg (mean ± standard deviation (SD)) of the inguinal mammary gland were placed into 2 mL Eppendorf tubes with glass beads in carbonic ice, and were then crushed using Precellys Evolution Homogenizer® (Ozyme, Saint-Cyr l’Ecole, France) at 4000 rpm for 1 min. Total RNA was isolated from each tissue sample and purified following the NucleoSpin® RNA/Protein (Marchery-Nagel, Düren, Germany) extraction/clean up protocol. RNA was eluted in 60 or 100 µL of RNase-free water. RNA concentration was measured at 260 nm and sample quality determined by ratios of 260/280 and 260/230 nm (Supplementary Table S1) using a NanoVue Plus® (GE Healthcare, Little Chalfont, UK). As both ratios were in the range of 2.0–2.3, this guaranteed of sufficient pure RNA with low contamination by proteins and extraction solvents [31].

2.2.2. Reverse Transcription (RT)

Complementary DNA (cDNA) was prepared from 1.5 µg of purified total RNA using SuperScript® IV reverse transcriptase (Invitrogen, Villebon-Sur-Yvette, France) according to the manufacturer’s instructions. Moreover, some samples were randomly chosen to perform negative RT (RT) by replacing SuperScript® IV with water, to verify the absence of non-specific cDNA amplification in samples. Reverse transcription was performed with a SimplyAmp® thermal cycler (Applied Biosystem, Villebon-Sur-Yvette, France) with thermal protocol of 23 °C for 10 min, 50 °C for 10 min and 80 °C for 10 min. Finally, the cDNA obtained were diluted to 1:40 before quantitative analysis.

2.2.3. Primers Design and Validation

A total of 54 genes linked to milk constituents secretion and its regulation and lactogenic hormones secretion were studied [19,32,33] (Appendix A, Table A1). Primer pairs used for qPCR were designed based on the sequence obtained from the online gene section of National Center for Biotechnology Information (NCBI) (https://www.ncbi.nlm.nih.gov/gene/) and using open-source PerlPrimer v1.1.21 software (http://perlprimer.sourceforge.net.) [34] according to the following parameters: primer melting temperature ranging from 58 to 62 °C with a maximal difference of 2 °C, amplicon size ranging from 100 to 150 bp, primer length ranging from 20 to 24 bp, span intron/exon boundary and overlap intron/exon boundary by 7 bases to avoid the possibility of genomic DNA contamination. The selected primers had, if possible, no expandable dimer and a total dimerization with the lowest possible force (dG < 3). Then, to check for their selectivity and the absence of potential genomic DNA amplification, selected primers were blasted using Primer-BLAST of NCBI (https://www.ncbi.nlm.nih.gov/tools/primer-blast/index.cgi), against Rattus norvegicus “Refseq mRNA” and “Refseq representative genome”. Finally, all the primers were validated by measuring their efficiency (E) to amplify mammary gland or pituitary gland cDNA and by ensuring they did not amplify RT. Efficiency was measured by preparing a pool of all samples of 1:40 dilution of cDNA which was then serially diluted 5 times to 1:2. The curve of cycle quantification value (Cq) function of log2(dilution) was linearly fitted and PCR efficiency (E) was calculated according to the following formula:
E (%) = (2(−1/slope) − 1) × 100
Sample cDNA amplifications were compared to the five RT amplifications by calculating ΔCq(RT-) = mean Cq(RT-)—mean Cq(sample), setting a Cq value of 50 assigned in case of no amplification (Supplementary Table S1). All genes with their official symbol (NCBI), main functions, primer sequences, amplicon length and efficiency are listed in Appendix A Table A1. Overall, the mean amplicon size was 124.7 ± 28.6 (mean ± SD). For mammary and pituitary glands, efficiencies were greater than 90 and ΔCq(RT-) greater than 10, indicating good amplification capacity and negligible genomic DNA amplification.

2.2.4. Quantitative Polymerase Chain Reaction (qPCR) Analysis

The qPCR was executed in Hard-Shell® 96-well PCR plates (Bio-Rad, Marne-la-Coquette, France) on a CFX connectTM Real-Time PCR detection instrument (Bio-Rad). Reactions were performed with a total volume of 15 µL, including 5 µL of 1:40 dilution of cDNA, 250 nM of forward and reverse gene-specific primers and iTAQ Universal SYBR® Green Supermix (Bio-Rad). The qPCR conditions were as follows: initial denaturation at 95 °C for 5 min followed by 40 cycles of 95 °C for 10 s, 60 °C for 30 s and 72 °C for 10 s. To check the specificity of PCR products, a melting curve was performed by increasing temperature from 65 to 95 °C with a 0.5 °C increment and 10 s per step.
Relative gene expression was calculated using the 2−ΔΔCq method as previously described [35]. For mammary gland, arithmetic mean Cq of three housekeeping genes (HKG): Actb, Uxt and Rps9, was used to calculate ΔCq (CqGene of interest—CqHousekeeping genes). Actb is a classically used HKG while Uxt and Rps9 are known to be very stable genes in lactating mammary gland [36,37]. For pituitary gland, arithmetic mean Cq of Actb, Vcp and Rps9 was used as HKG to calculate ΔCq. Vcp was shown to be very stable in the brain in an RNAseq study of the lab (unpublished data) and the Cq values of the three genes were strongly correlated (r from 0.68 to 0.81). ΔΔCq values (ΔCqTarget group—ΔCqReference group) were calculated using the CTL diet at L12 as a reference group to highlight the gene expression evolution over the lactation period. Values of −ΔΔCq were considered to be representative to the Log2(Fold change) assuming that mean primer efficiency was close to 100% and relatively similar between genes (CV of 4.7% and 5.9% in mammary and pituitary glands, respectively). Finally, fold change expression of the FEN diet was calculated for each lactation period with 2−ΔΔCq formula using, for each day, the CTL diet as a reference group.

2.3. Enzyme-Linked Immunosorbent Assay (ELISA) of Lactaogenic Hormones in Dam Plasma

Insulin (Rat Insulin ELISA kit®, ALPCO, Salem, NH, USA), IGF-1 (ELISA kit for Insulin Like Growth factor 1, Cloud-Clone Corp., Katy, TX, USA), prolactin (Prolactin rat ELISA, Demeditec Diagnosis GmbH, Kiel, Germany) and leptin (Rat Leptin ELISA Kit, Merck Milliport, Burlington, MA, USA) were measured in dams’ plasma, following manufacturers’ instructions. Plasma was diluted to 1:10 for the prolactin assay and to 1:100 for the IGF-1 assay. Optical density was read using a microplate reader Varioskan Lux® (ThermoFisher Scientific, Waltham, MA, USA).

2.4. Statistical Analysis

To study the global impact of fenugreek on genes responsible for milk synthesis and regulation in the mammary gland, multivariate analysis was performed, using SIMCA P® version 15.02 (Umetrics AB, Kinnelon, NJ, USA). The unsupervised Principal Component Analysis (PCA) and the supervised Partial Least Squares Discriminant Analysis (PLS-DA) were used [38] to cluster the mammary gland samples based on the selected gene expression profiles (−ΔΔCq values). PCA reduced the large set of variables (43 genes) into two principal components (PCA 1 and 2). PLS-DA enhanced the separation between the dietary groups (CTL and FEN) by summarizing the data into a few latent variables that maximized covariance between the response (dietary group) and the predictors (gene expression). The performance of the PLS-DA models was evaluated by the proportion of the total variance of the variables explained by the model (R2(X)), the proportion of the total variance of the response variable (dietary group) explained by the model (R2(Y)), the prediction ability of the model reflected by both a 7-fold cross-validation of the data (Q2) and the reliability of the PLS-DA model based on an analysis of variance (ANOVA) assessment of the cross-validatory (CV) predictive residuals (p-value of CV-ANOVA) of the model. The corresponding loading plot was used to determine the genes most responsible for separation in the PLS-DA score plot. Based on the PLS-DA results, genes were plotted according to their importance in separating the dietary groups in PLS-DA score plot and each gene received a value called the variable of importance in the projection (VIP). The variables with the highest VIP values (above 1) were the most powerful group of discriminators involved in the separation of CTL and FEN groups. Finally, in order to highlight diet-specific effect on mammary gland gene expression, lactation time effect was masked by building new PCA and PLS-DA models on a global matrix of normalized variables obtained using mean centering and standardization of variables by lactation point.
For univariate analysis, parametric tests were favored to maximize statistical power, such as the Student’s test used for diet comparison. Their validity was admitted as the residual distribution of variables was not significantly different from normal distribution according to the Shapiro–Wilk test and variance was homogenous according to the Brown–Forsythe test. Relative genes’ expressions in tissues and plasma hormone concentrations were analyzed using two way ANOVA with diet and period factors followed by Tukey’s post-hoc test for period pairwise comparisons (3 levels) and Sidak’s post-hoc test for diet pairwise comparisons (2 levels), as suggested by Kim [39]. Values of −ΔΔCq were chosen for statistical analysis of gene expression because distribution of −ΔΔCq values, unlike that of 2−ΔΔCq values, was similar to normal distribution that enabled the use of parametric tests [40,41]. To determine the strength of the link between two variables, Pearson’s correlation test was used. All univariate tests were performed with the GraphPad prism® software (San Diego, CA, USA), version 6. In all tests, p < 0.05 was considered as statistically significant.

3. Results

3.1. Fenugreek Supplementation Enhances Lactation Performances in a Model of Rat Nursing a Large Litter

Lactation performance was measured in experiments 1 and 2 (Xp1 and Xp2). As no significant interaction effect was found between experiments and diet effects using an ANOVA, data from Xp1 and Xp2 were pooled. Dam water intake was similar in control diet (CTL) and fenugreek-supplemented diet (FEN) groups throughout the lactation period. Conversely, maternal food intake, pup final weight gain and milk flow from mother to pups all increased significantly, by 10.0%, 7.1% and 15.3%, respectively (Table 1).

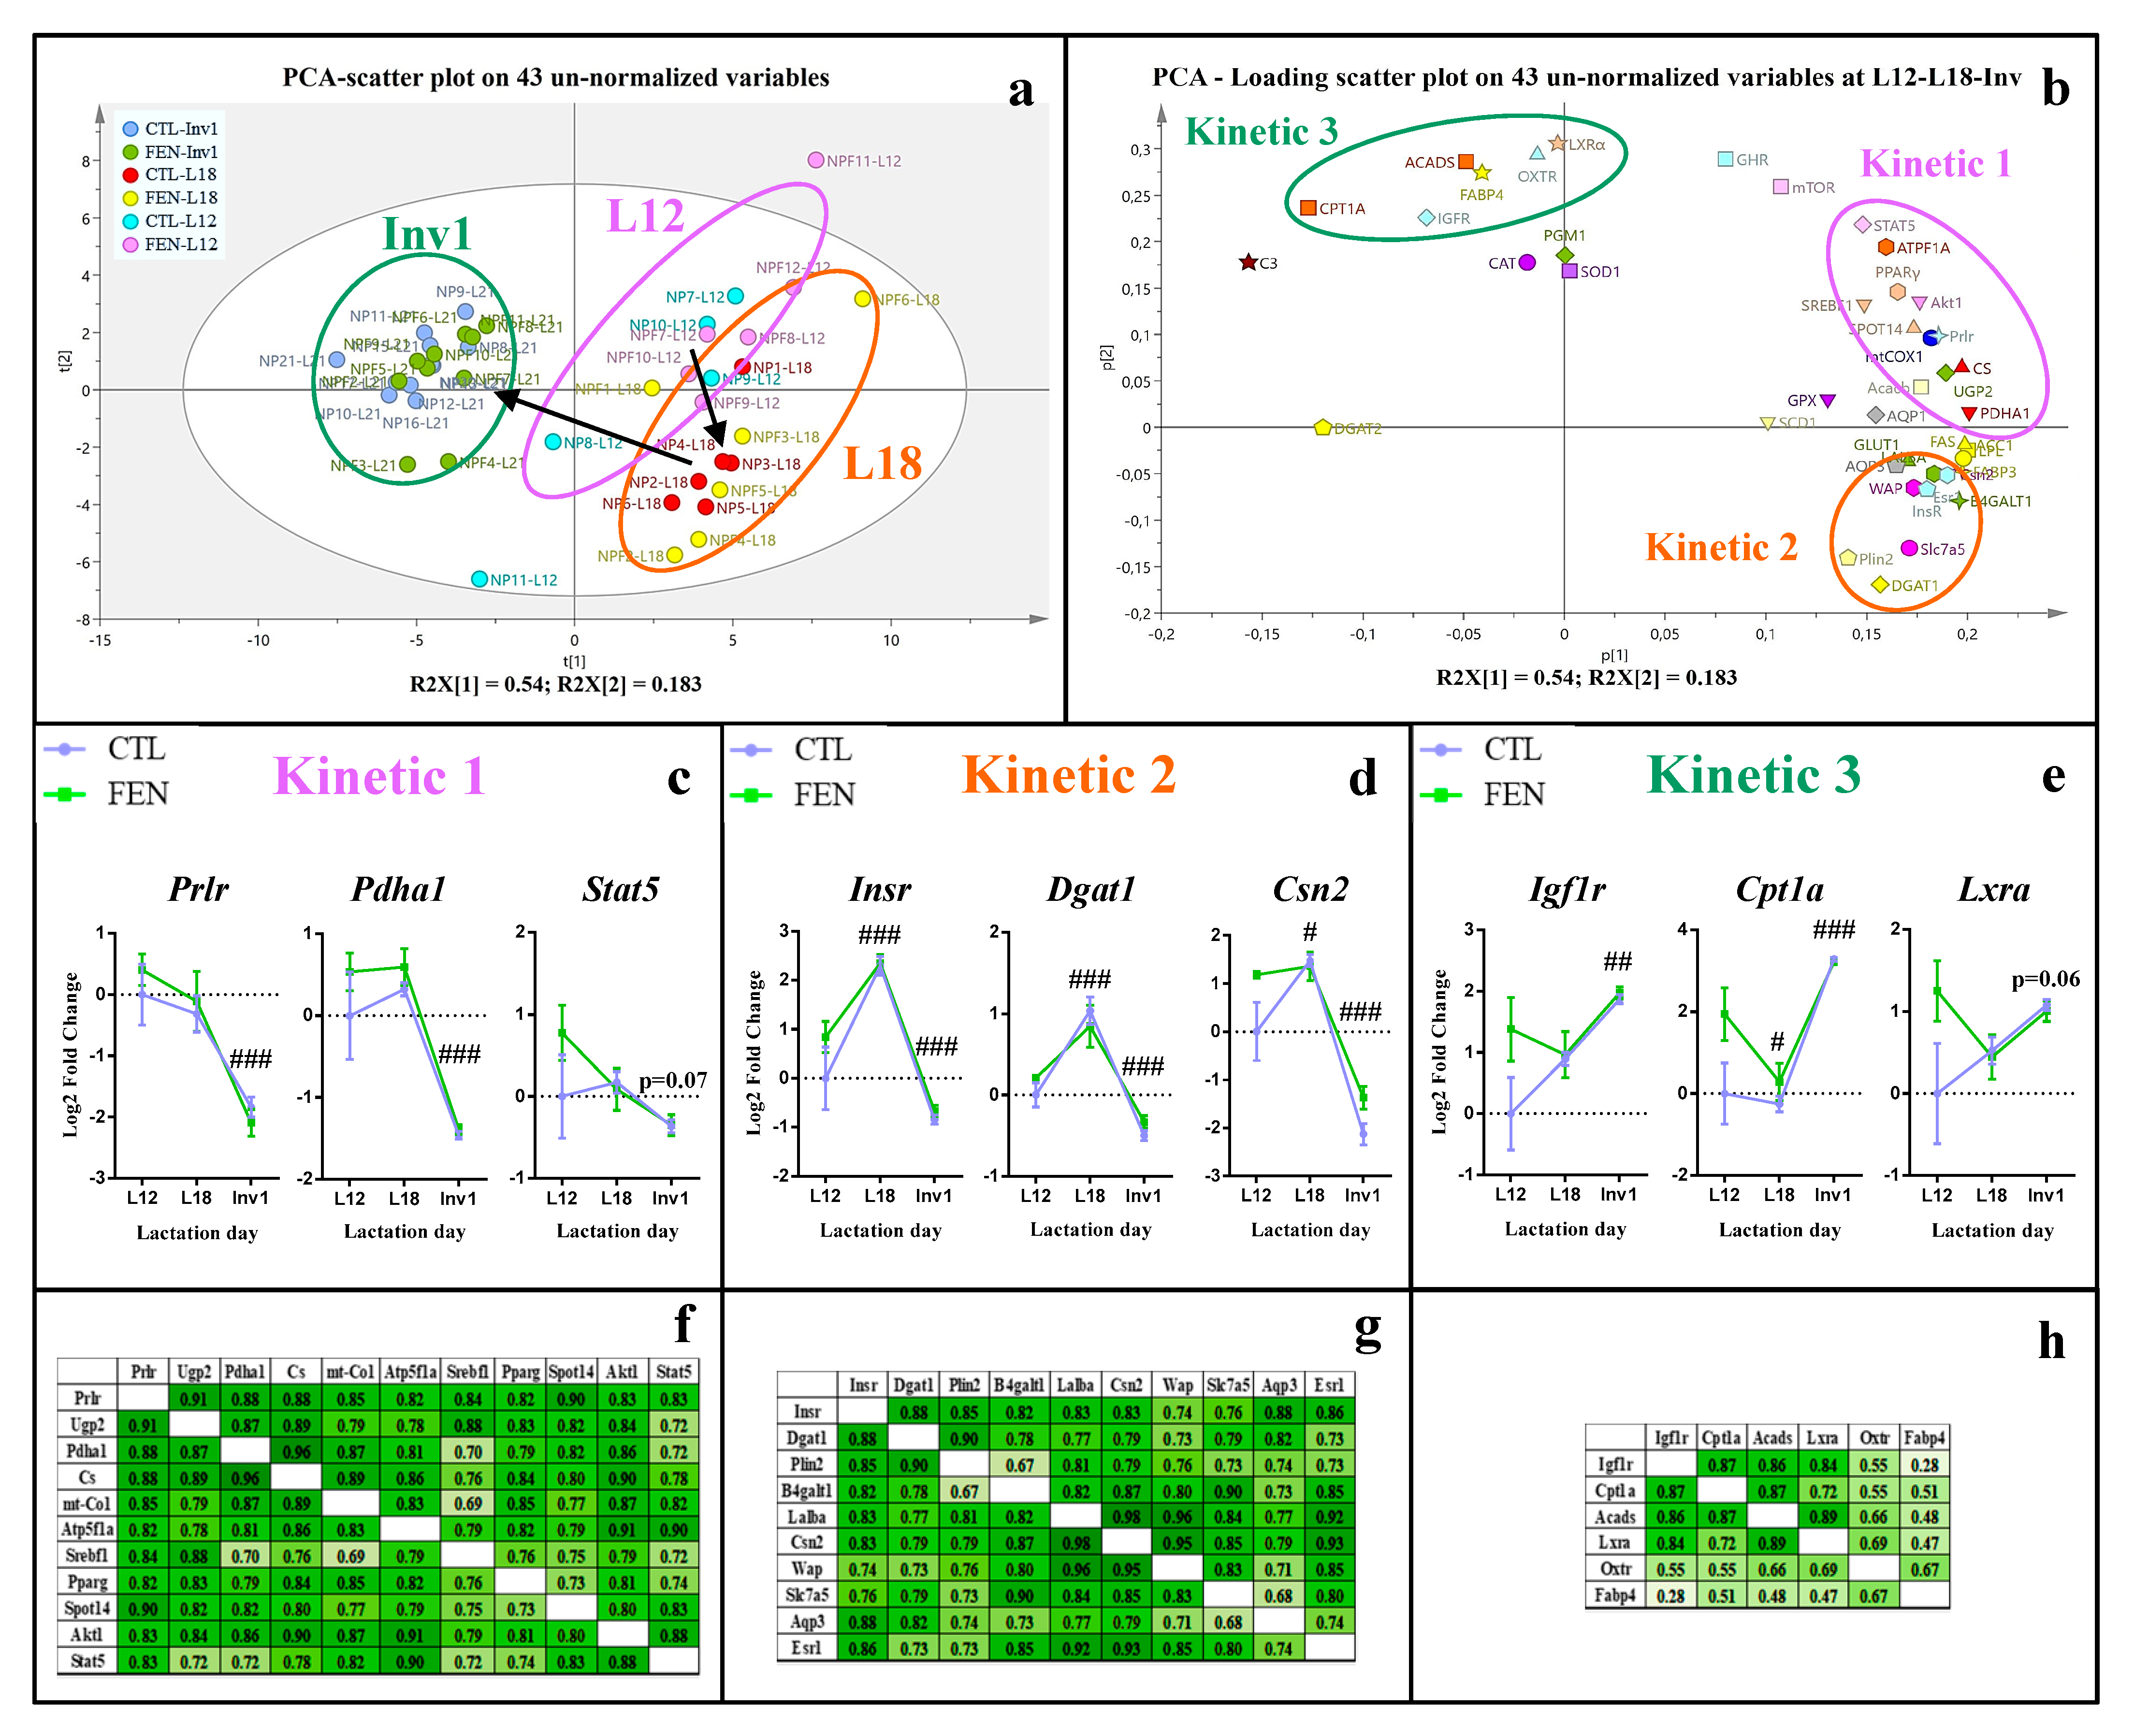
3.2. Different Patterns of Gene Expression in the Mammary and Pituitary Glands and of Plasma Hormone Concentration throughout Lactation and Involution

Multivariate and univariate statistical analysis were performed to investigate the temporal pattern in gene expression in mammary gland from mid-lactation to the beginning of involution.
The genes with the highest expression in mammary gland were Csn2, Wap, Mtco1 and Lalba with ΔCq ≤ −6 and codes for major milk proteins and actors of mitochondrial oxidative phosphorylation (Table 2 and Table 3). Plin2 and Fas, two genes involved in lipid synthesis, were also strongly expressed in the mammary gland with ΔCq < −1. Conversely, Cpt1a, Acads, Mtor, Igf1r Esr1, Insr, Lxra, Scd1, Pgm1 and Dgat2 were the least expressed genes in mammary gland over the entire lactation period, with ΔCq > 4 (Table 2, Table 3, Table 4 and Table 5). In pituitary gland, Prl and Gh1 were both very intensively expressed, with ΔCq < −6 highlighting the high level of secretion of prolactin and GH during lactation (Table 6). In contrast, Oxt, Trhr and Vipr2 were the less expressed genes with ΔCq > 4.
Following the unsupervised Principal Component Analysis (PCA) on the un-normalized complete set of 43 genes, the PCA score plot, on components 1 and 2, revealed natural longitudinal classification with differences corresponding to the three lactation time points and a clear-cut separation between involution (Inv1) and lactation period (L12 and L18) (Figure 2a). The PCA loading scatter plot (Figure 2b) reflected relationships between variables in this model, deciphering three clusters that we labelled “kinetics 1, 2 and 3”. In agreement with this longitudinal pattern, the univariate statistical analysis showed that expression of all genes evolves significantly between the middle and end of lactation, except for Ghr and Mtor (Table 4 and Table 5).
Most of the genes studied exhibited a significant decrease in their expression between L18 and Inv1 ranging from 1.46-fold (p = 0.010) for Atp5f1a to 36.91-fold (p < 0.001) for Fasn and belonged to “kinetic 1” and “kinetic 2” patterns.
In the “kinetic 1” pattern, genes similarly expressed or only slightly modulated between L12 and L18, suggesting they had reached peak expression in this interval (Figure 2c). This pattern was represented mostly by genes coding for regulation of milk nutrient synthesis, energy metabolism, and galactose uptakes (Stat5, Akt1, Spot14, Pparg, Prlr, Pdha1, Acacb, Mtco1, Cs, Ugp2 and Atp5f1a). All these genes were highly correlated with each other, as validated by Pearson’s test (Figure 2f and Supplementary Figure S1) and mainly with Prlr (r ≥ 0.8), considered as the barycenter of the “kinetic 1” cluster in the PCA-loading scatter plot (Figure 2b). If not in the “kinetic 1” ellipse in the PCA (Figure 2b) genes related to de novo fatty acid synthesis and glucose uptake such as Lpl, Fasn, Acaca, Fabp3 and Glut1 were also strongly correlated with Prlr (r ≥ 0.7) (Supplementary Figure S2).
In “kinetic 2”, overall gene expression rose from 1.70-fold (p = 0.042) for Csn2 to 2.62-fold for Aqp3 (p = 0.001) between L12 and L18, suggesting that peak expression of these genes occurred closer to L18 than L12 (Figure 2d). This cluster mainly included genes related to milk constituent secretion (Slc7a5, Wap, Csn2, B4galt1, Lalba, Plin 2, Aqp3, InsR, Esr and Dgat1) as illustrated in Figure 2b,d,g, with Insr, closest to the barycenter of the “kinetic 2” cluster (Figure 2b), and strongly correlated with all these genes (Figure 2g). Otherwise, Esr1 was probably linked to protein expression as its expression was very strongly correlated with all main milk protein genes (r ≥ 0.85).
In “kinetic 3”, contrary to other clusters, genes were significantly overexpressed at Inv1 compared to L18 (Figure 2e), with a rise ranging from 1.37-fold (p < 0.001) for Pgm1 to 9.44-fold (p < 0.001) for Cpt1a. Several of these genes involved in fatty acid oxidation pathway (Cpt1a, Acads, Lxra and Igf1r) presented high correlation between each other (Figure 2h).
In the pituitary gland, the peak of expression was around L12 for Drd2, between L12 and L18 for Ghrhr and Prl, around L18 for Vipr2 and Trhr and around Inv1 for Esr1 (Table 6).
Insulin, IGF-1 and leptin maternal plasma concentrations exhibited the same time course (Figure 3) with a significant decline between L12 and L18 (−65.9%, p = 0.030; −48.5%, p < 0.001; −79.7%, p < 0.001, respectively) followed by a sharp rise between L18 and Inv1 (+392.5%, p < 0.001; +156.9%, p < 0.001; +325.0%, p < 0.001, respectively), regardless of maternal diet. Plasma prolactin concentration decreased by 64.0% (p = 0.012) between L12 and L18. Finally, plasma estrogen concentration rose 37.1% (p = 0.029) between L18 and Inv1.

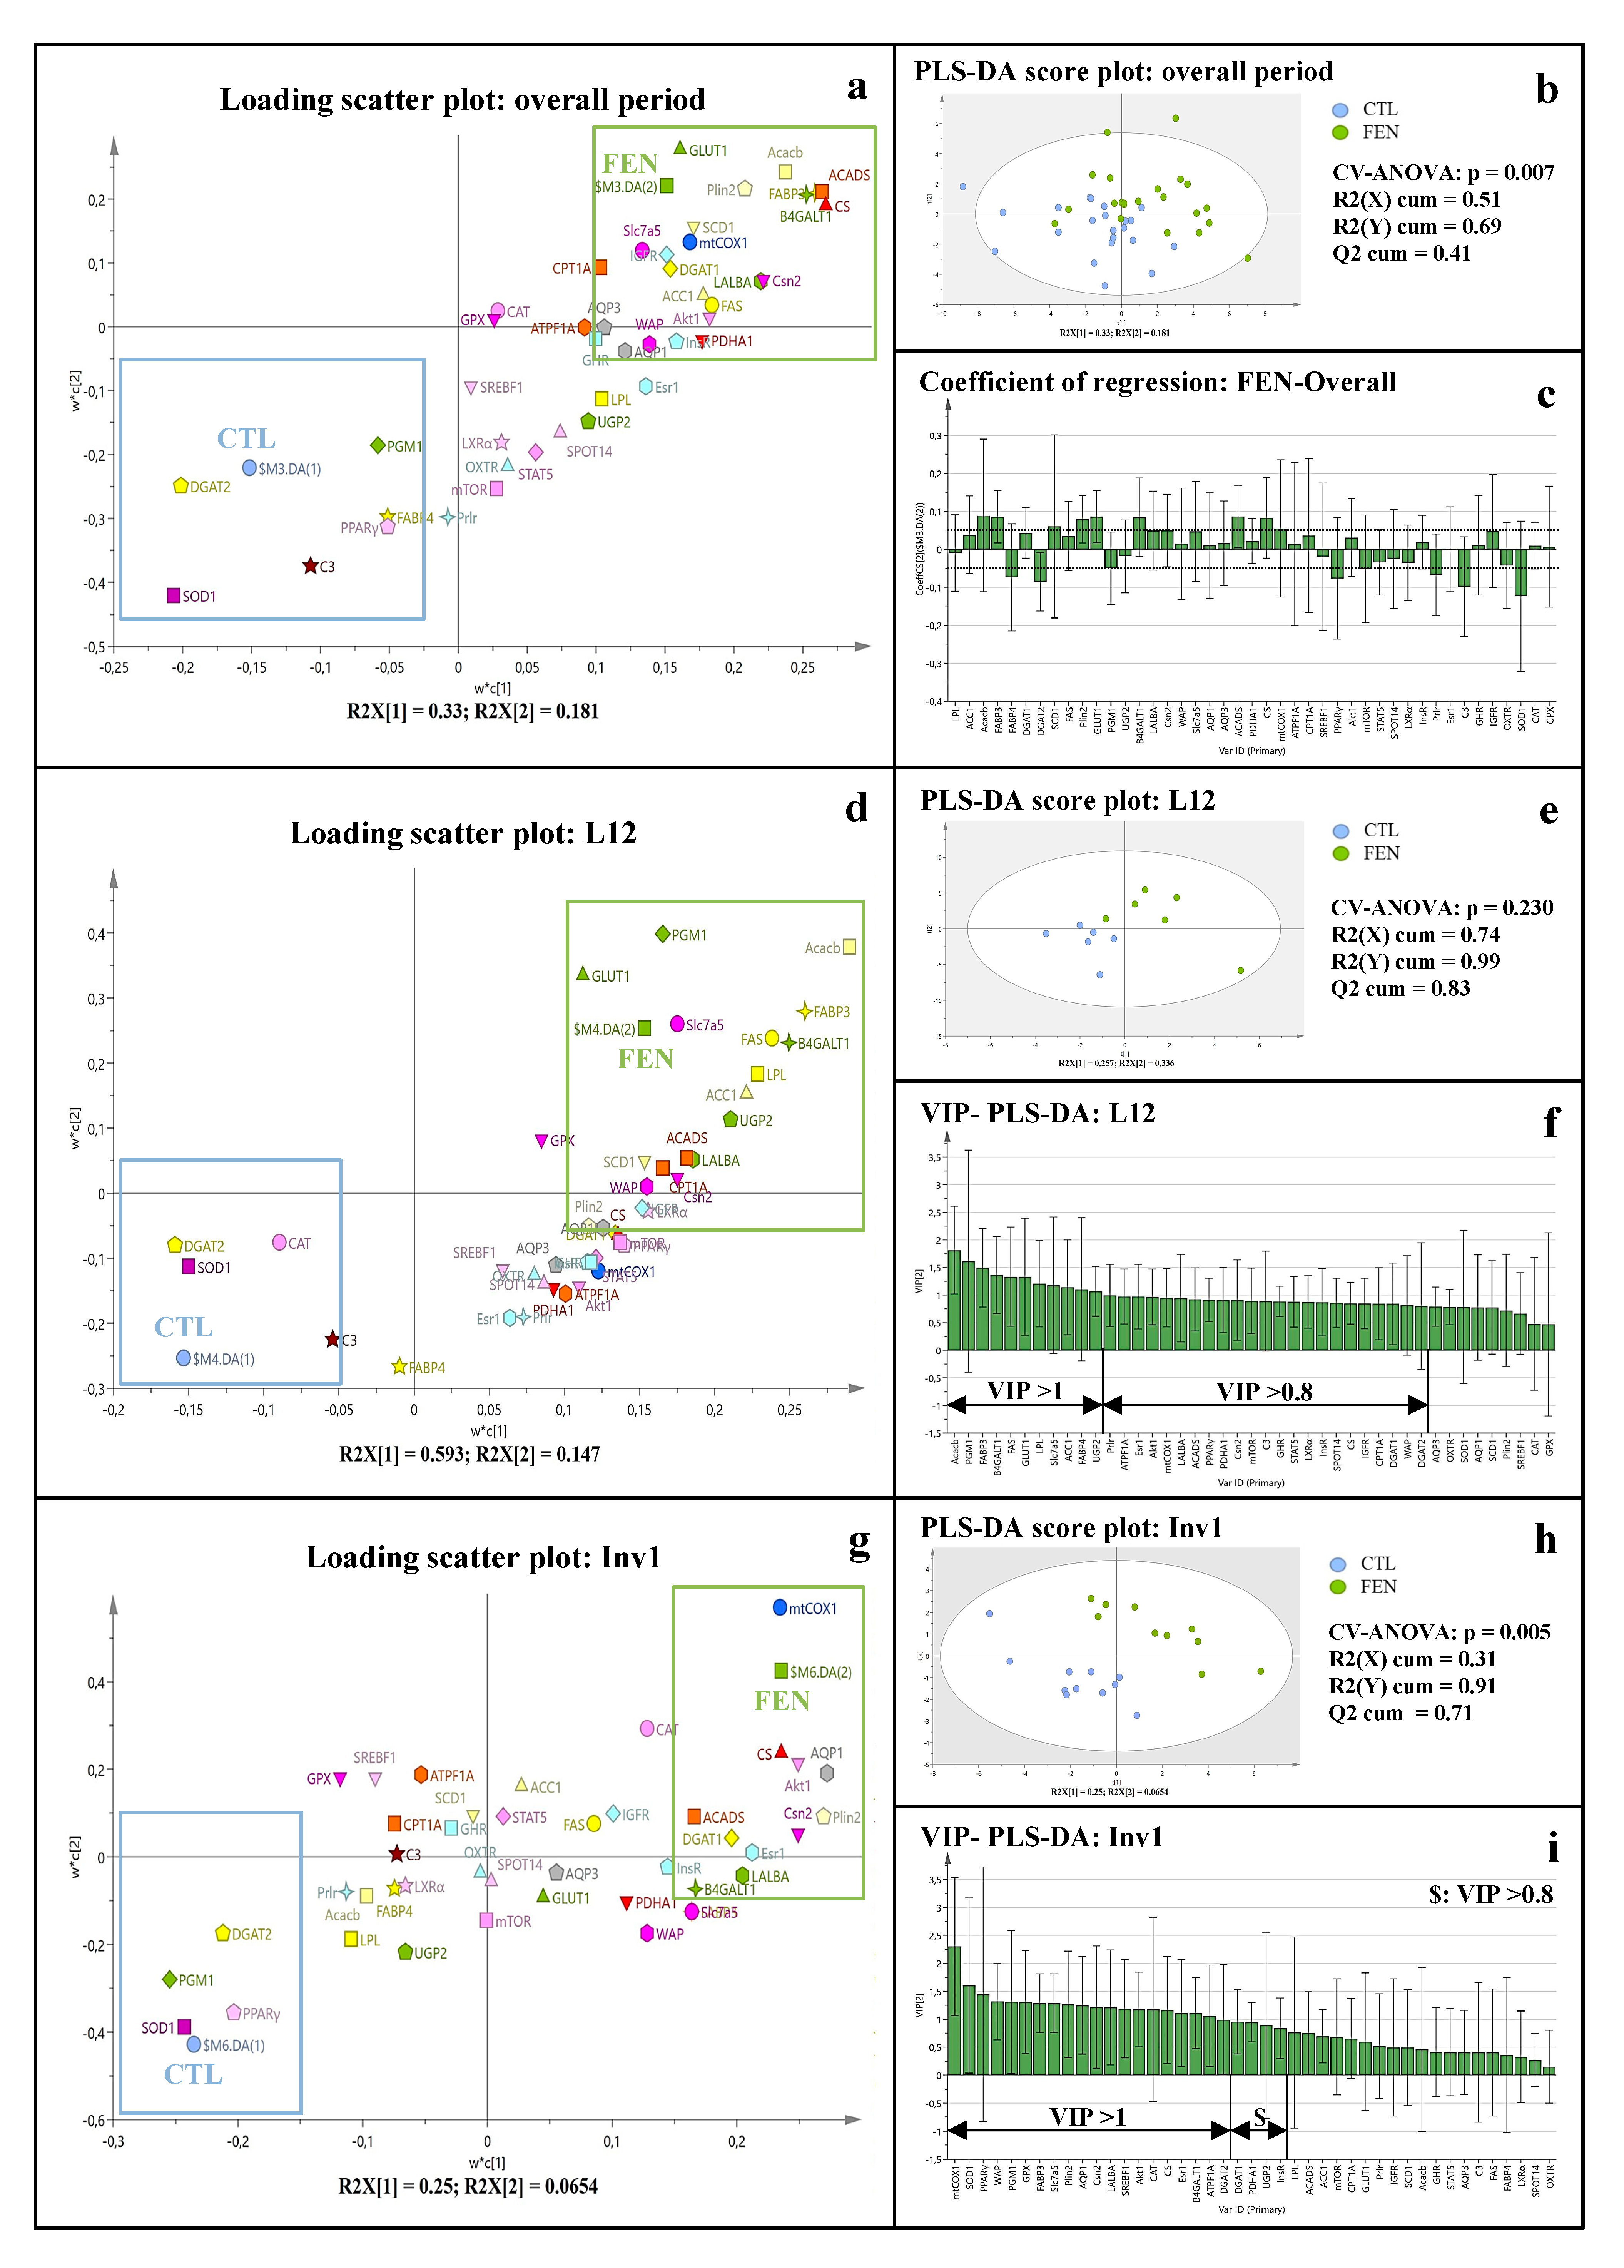
3.3. Fenugreek Supplementation Impacts Mammary Gland Metabolic Pathways Differently during Lactation and at Involution

A supervised Partial Least Squares-Discriminate Analysis (PLS-DA), built on the same original dataset as PCA, showed that the stage of lactation had more impact than diet on the first two components (Supplementary Figure S1). Thus, a mean-centering and standardization by lactation stage of all variables was performed to assess the effect of diet per se. The resulting PLS-DA score plot revealed a clear-cut separation of diet groups (Figure 4b) overall. Most of the genes studied contributed to diet separation with a VIP over 0.8. Acacb, Fabp3, Plin2, Glut1, B4galt1, Acads, Cs, Scd1, Lalba, Csn2, Slc7a5, Mtco1 and Igf1r were the genes the most associated to the FEN diet while Sod1, Fabp4, Dgat2, Pparg, Prlr, C3 and Pgm1 were the most associated to the CTL diet (Figure 4a,c).
Fenugreek modulated mammary gland gene expression mostly at L12 and Inv1. By focusing on each lactation time point with the PLS-DA, the predictive ability of the L12- (Figure 4e) and Inv1 (Figure 4h)-PLS-DA models was more important (R2(Y) cum and Q2 cum values above 0.9 and 0.7, respectively) than that of L18-PLS-DA model (Q2 cum = 0.39). At L12, the genes contributing the most to the separation of diets were Acacb, Fabp3, Fasn, Glut1, Pgm1, B4galt1, Slc7a5, associated with the FEN diet, but also Fabp4, Dgat2 and C3 associated to the CTL diet (VIP > 0.8, Figure 4d,f). Moreover, most of the genes overexpressed in the FEN diet at L12 were related to the synthesis of milk constituents, energy metabolism and the regulation of milk secretion (Table 2, Table 3, Table 4 and Table 5). At Inv1, some genes contribute strongly to the separation of both diets such as Mtco1, Cs, Aqp1, Akt1, Cat, Plin2 and Csn2 associated with the FEN diet, but also Lpl, Dgat2, Pgm1, Ugp2, Pparg and Sod1 associated with the CTL diet (Figure 4g,i). Genes associated with the FEN diet were mostly related to milk secretion and energy metabolism.
At L18, diets were poorly separated from each other by PLS-DA and no difference was observed in mammary gene expression between CTL and FEN diets.

3.3.1. Fenugreek Supplementation Increases the Expression of Mammary Genes Involved in Lipid, Lactose and Protein Synthesis

The effect of fenugreek was studied individually on genes involved in the synthesis of milk constituents (Table 2). The FEN diet significantly increased the overall expression of genes related to milk lipid synthesis (Lpl, Fas, Acaca, Fabp3), lactose synthesis (Glut1, Ugp2, B4galt1, Lalba) and protein synthesis (Lalba and Csn2) (Table 2). Moreover, Acacb, Fabp3, Plin2, Glut1, B4galt1, Scd1, Lalba, Csn2 and Slc7a5 were strongly associated with the FEN diet in the overall PLS-DA (VIP > 1, Figure 4a,c) and highly predictive of FEN group (regression coefficient ≥ 0.5).

3.3.2. Fenugreek Supplementation Increases Expression of Genes Involved in Fuel Metabolism, Particularly Fatty Acid β-Oxidation

The overall expression of Cpt1a, Acads and Cs was significantly increased with the FEN diet compared to the CTL diet, with a particular overexpression of lipid β-oxidation-related genes, Cpt1a and Acads, at L12: 3.84-fold and 2.77-fold (p < 0.001), respectively (Table 3). Moreover, Acads, Cs and Mtco1 were among the most powerful discriminators associated with the FEN diet in the overall PLS-DA (VIP > 0.8, Figure 4a,c).

3.3.3. Fenugreek Increases the Expression of Regulatory Factors Involved in Protein and Lipid Metabolism

The FEN diet had no significant overall effect on the gene expression of factors regulating milk protein and lipid synthesis (Table 4) but induced an early transitory significant overexpression of Lxra and Mtor at L12 (2.38-fold, p = 0.01 and 1.84-fold, p = 0.032, respectively) contributing, with Pparg, to discrimination of the FEN diet group in the PLS-DA model at L12 (VIP > 0.8, Figure 4d,f) Additionally, Pparg and Akt1 were significantly upregulated at L12 compared to L18 (1.85-fold, p = 0.046 and 1.62-fold, p = 0.035, respectively) in the FEN diet, whereas similar expression was observed for the CTL diet (p ≥ 0.98).

3.3.4. Fenugreek Upregulates the Expression of Insulin, GH and IGF-1 Receptors

The effect of fenugreek was studied on receptors of the main lactogenic hormones (Table 5). Igf1r expression was the most enhanced by the FEN diet throughout lactation (p = 0.033; Figure 4a,c), specifically at L12 (2.60-fold; p = 0.012 and VIP > 0.8, Figure 4d), with a similar trend observed for Insr and Ghr expressions (VIP > 0.8, Figure 4d). Interestingly, normalized gene expression of Igf1r was strongly correlated with those of Ghr and Insr overall lactation (r = 0.76 and 0.71 respectively, Supplementary Figure S3).

3.4. Fenugreek Stimulates Oxytocin Expression at the Pituitary Level

The FEN diet increased the overall expression of Oxt, C3 and Trhr, mostly at L18 for Oxt and C3 (p = 0.029 and p = 0.004, respectively), and tended to increase the expression of Vipr2. In addition, Drd2 was overexpressed in the FEN group at Inv1 (p = 0.050), whereas it was on average under-expressed in this group during lactation (interaction: p = 0.040).

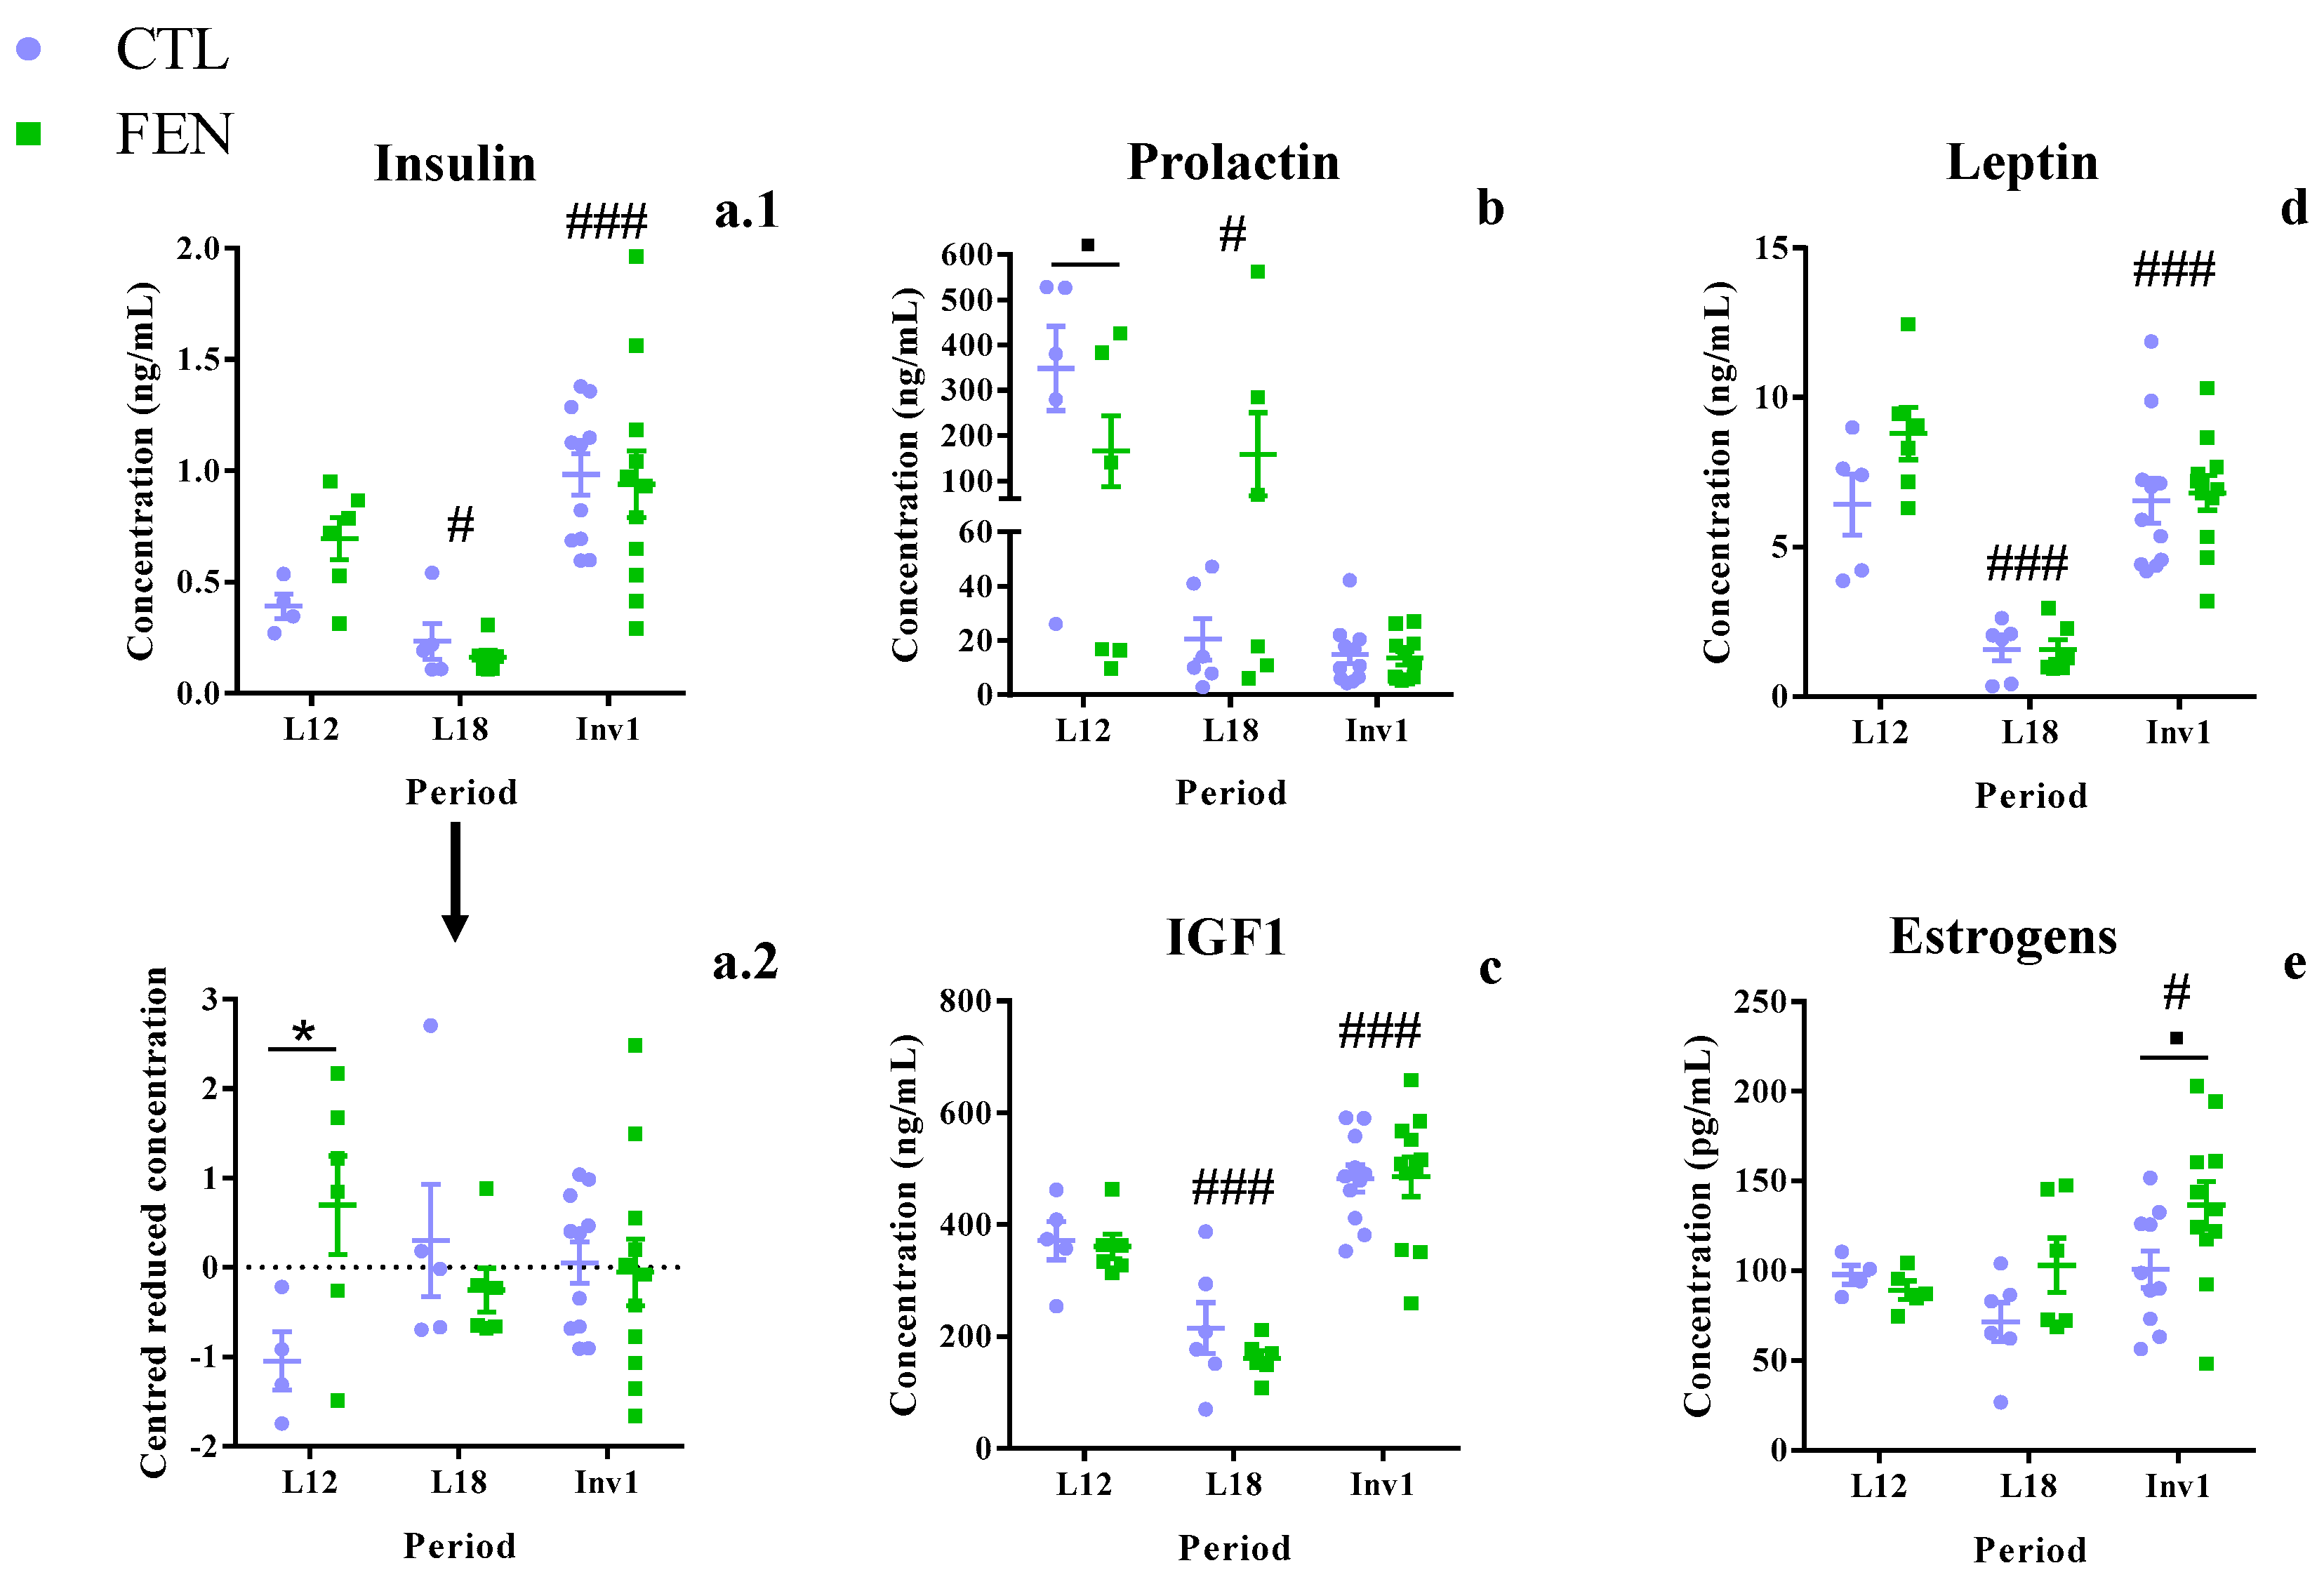
3.5. Fenugreek Supplementation Increases Plasma Insulin Concentration

The FEN diet had no significant overall impact on the concentration of these hormones (Figure 4). However, plasma estrogen concentration tended to be higher in the FEN compared to CTL group (p = 0.082), particularly at Inv1 (+35.5%, p = 0.056). Moreover, variation of insulin concentration was not homogenous between lactation and involution (p = 0.035 for the Brown–Forsythe test), impairing our ability to detect any effect of supplementation during lactation. By centering and reducing insulin concentration by time period, a rise in insulin concentration was observed in the FEN group at L12 (+77.1%, p = 0.043), whereas no difference was observed at L18 and Inv1 (interaction: p = 0.040). Finally, a significant interaction was observed for prolactin concentration explained by the precipitous drop between L12 and L18 in the CTL group (94.1%, p < 0.001), whereas it remained steady in the FEN group (p = 0.995). However, the large prolactin concentration variations observed during lactation (mean CV of 102.1% and interval of (2.87; 528.2) ng/mL) makes it difficult to draw any conclusion from these values.

4. Discussion

The findings of the current study confirm that fenugreek increases milk production in a model of rat nursing a large litter. They further demonstrate that the impact of dietary fenugreek supplementation on milk production is associated with a stimulation of milk macronutrient synthesis and mammary fuel metabolism. These effects were mainly observed at L12 and Inv1 but not at L18, suggesting that fenugreek promotes an earlier peak of lactation and maintains milk production longer, whereas it does not seem to have further beneficial effect on milk macronutrient synthesis once peak lactation is reached. Our findings finally suggest that the effect of fenugreek on milk production at mid-lactation may be mediated by a stimulation of insulin secretion and a modulation of the insulin/GH/IGF-1 axis, while its action on maintaining lactation until the first day of mammary involution could be due to its estrogenic effect.

4.1. The Time Course of the Gene Expression in Mammary Gland and Lactogenic Hormones Suggests Peak Lactation Is Closer to L18

A noticeable result is the importance of lactation stage on mammary gland gene expression, as illustrated by the clear-cut separation of lactation time points in both PCA and PLS-DA models (Figure 2a and Supplementary Figure S1). The first day of involution (Inv1) presented clearly different gene expression pattern from those at mid- and late-lactation.
Most genes, particularly those following kinetics 1 and 2 (Figure 2c,d), were downregulated during involution, implying they were overexpressed at mid- and late-lactation, highlighting their central role for milk production and regulation [32]. Genes following kinetic 1 were related to the first steps of milk lipid and lactose synthesis [19], such as glucose and fatty acid uptake (Glut1, Lpl), fatty acid de novo synthesis (Fasn, Acaca) and galactose synthesis (Ugp2), to mammary energetic metabolism (Cs, Mtco1) and to milk synthesis regulatory factors (Stat5, Akt1, Pparg). These genes reached their peak expression between mid- and late-lactation and were probably under primary regulation of Prlr whose expression was highly correlated with all (r > 0.8). Genes following kinetic 2 were associated with the final steps of milk constituent secretion [19], such as triglyceride synthesis (Scd1, Dgat1), lipid droplet formation (Plin2), lactose synthesis (B4galt1, Lalba), main milk protein synthesis (Csn2, Wap) and water inflow (Aqp1, Aqp3). They seemed to be mostly controlled by Insr (r ≥ 0.75 with all) but also Esr1, mainly for milk protein genes (r ≥ 0.85). To the contrary, genes following kinetic 3 (Figure 2e) were upregulated at Inv1, suggesting that their expression was repressed during lactation. These genes are related to metabolic pathways repressed during lactation such as mitochondrial β-oxidation (Acads, Cpt1a) [32,33,42] or have a secondary role on regulation (Igf1r, Lxra) [33,43,44] or on lipid synthesis (Fabp4, Dgat2) [33,45] compared to other regulatory factors (Prlr, Srebf1) or other family members (Fabp3, Dgat1). Moreover, in the present study, the drop in the expression of de novo fatty acid synthesis genes at involution is correlated (Supplementary Figure S2) with the concomitant increase in the expression of β-oxidation genes likely related to energy requirements for mammary tissue remodeling. Finally, Oxtr was overexpressed in involuting mammary gland probably because myoepithelial cells were preserved longer than lactocytes and contracted to facilitate removal of degenerating epithelial cells [46].
Interestingly, genes related to milk constituent secretion followed the kinetic 2 pattern, and as such, were overexpressed at L18 compared to L12. These genes are probably the more strongly correlated with actual milk secretion, suggesting that, among the three periods studied, milk production was likely at its maximum at L18. This is consistent with (i) the time course of plasma insulin, leptin and IGF-1, which all declined to their minimal concentration at L18. Indeed, the plasma concentration of these hormones is known to decline during lactation partly due to increased hormone extraction by the mammary gland [47,48,49] and they are negatively correlated with milk production [50]. (ii) The highest milk consumption by rat pups reported to occur at L15-L16 as they only start to consume solid food significantly at L17 and drinking water at L19 [51].

4.2. Fenugreek Supplementation Stimulates Milk Macronutrient Synthesis

Dietary fenugreek supplementation increased the overall expression of genes involved in fatty acid uptake (Lpl), de novo synthesis (Fasn, Acaca, Acacb), transport (Fabp3) and, to a lesser extent, lipid secretion (Plin2). Fenugreek also stimulated the expression of genes involved in glucose uptake (Glut1), galactose (Pgm1, Ugp2) and lactose (B4galt1, Lalba) synthesis. Finally, fenugreek increased the expression of amino acid transporters (Slc7a5) and main milk proteins (Csn2, Lalba). These results suggest an increase in the synthesis of the 3 macronutrients of milk namely lipid, lactose and protein in the mammary gland [19] and are consistent with the stimulating effect of fenugreek on milk flow by 16% reported in our earlier study [15] and 15.3% in this study. More specifically, genes involved at every step of protein and lactose synthesis were significantly overexpressed, whereas only genes involved in the fatty acid synthesis were dramatically overexpressed for lipid synthesis. The expression of genes involved in triglyceride synthesis and lipid secretion was not or only slightly affected. This relative lack of conversion of fatty acids to triglycerides may account for the decrease in milk lipid concentration found in some fenugreek supplementation studies [52,53,54]. Otherwise, the stimulation by fenugreek of genes involved in mitochondrial energy metabolism (Cs, Atp5f1a, Mtco1) and particularly those involved in β-oxidation (Cpt1a, Acads) suggests that increased ATP synthesis took place in the mammary gland to meet the increased energy requirements associated with increased milk production [22]. Nevertheless, contrary to Liu et al. [55], we were unable to observe a significant increase in water inflow in response to galactagogue even though mean Aqp1 and Aqp3 expressions were increased at L12 and L21.

4.3. Fenugreek Supplementation Advances Peak Lactation and Maintains Milk Production

The lack of separation according to diet on the PLS-DA plot, and the lack of any difference in the expression of genes related to milk constituent synthesis and fuel metabolism in FEN and CTL groups at L18, suggests that the milk synthesis peak observed at late-lactation mainly in control dams was not impacted by fenugreek supplementation. However, the time course of some genes from L12 to L18 differed between diets: either the gene expression increased in the CTL diet and did not change in the FEN diet (Lpl, B4galt1, Slc7a5, Csn2 and Aqp1), or the expression did not change in the CTL diet and decreased in the FEN diet (Acaca, Fabp3, Ugp2, Cpt1a, Acads). In both cases, gene expression was higher earlier in the FEN group. This is consistent with the clear separation between both diets observed in the PLS-DA model built on gene expression at L12 (Figure 4d) and the fact that greater overexpression was observed at L12 for most of the genes in the FEN group. Finally, the PLS-DA model built on gene expression at Inv1 also properly separated both diets and the expression of the genes Lalba, Csn2, Plin2, Slc7a5, Aqp1 and Esr1 was maintained to a slightly greater level in the FEN diet. Together these results suggest that fenugreek supplementation advanced the peak of milk production, observed near L18 for control, around L12 and maintain it to a level similar to control at L18. Thus, fenugreek supplementation may enable the dam to maintain a milk production slightly higher than control during involution.

4.4. Fenugreek Stimulates Milk Production Mainly by Modulating Insulin and Oxytocin Secretion

The main effect of fenugreek on the expression of genes related to milk synthesis was observed at L12. During the same period, fenugreek supplementation increased dams’ plasma insulin by 77.1% and the expression of Insr by 1.79-fold, suggesting an effect of fenugreek on insulin secretion and its action in mammary gland. Receptors to GH and IGF-1 (GHR and IGF1R) were also remarkably overexpressed in the mammary gland at L12 (Table 5). These 3 hormones are closely linked by the insulin/GH/IGF-1 axis [56]. Briefly, GH is secreted by pituitary gland and stimulates IGF-1 secretion in the liver [56,57], which shares strong homology with insulin. Both hormones can bind to IGF1R and insulin receptors (INSR) and to hybrid formed by both receptors with more or less affinity. These receptors act through similar pathway mainly by activating the AKT/mTOR pathway [56]. In addition, insulin stimulates expression of GH receptor in peripheral tissues [58] but also modulates the expression of IGF1R and INSR [59,60].
We therefore hypothesize that fenugreek acts mainly by increasing insulin secretion by maternal pancreas β-cells. This is consistent with the hypoglycemic effect of fenugreek and its capacity to stimulate insulin secretion through the potential action of trigonelline and 4-hydroxyisoleucin [23,24]. Together with a potential direct action of fenugreek compounds [24], the rise in plasma insulin under lactation-specific conditions, i.e., hypo-insulinemia and insulin-resistance in peripheral tissues except mammary gland, could explain the Igf1r, Insr and Ghr overexpression in the mammary gland [58,60,61]. The increase of IGF-1 and insulin binding to their receptor and to their hybrid receptor leads to an activation of the AKT/mTOR pathway, as suggested by overexpression of Mtor at L12 (by 1.84-fold) and of Akt1 to a lesser extent (Table 4) and results in activation of lactose and protein synthesis [19]. GHR could also act secondarily on protein and lactose synthesis through the JAK2/STAT5 pathway [62]. Concerning lipid metabolism, Lxra and Pparg are the most overexpressed regulatory factors with fenugreek supplementation (Table 4). Both are stimulated by insulin [63,64,65] and likely IGF-1, and Lxra expression is also stimulated by GH [64]. Lxra has been shown to stimulate de novo fatty acid in the mammary gland [66] independently of SREBF1 but not fatty acid desaturation and triglyceride synthesis [44], which is consistent with fenugreek effect found only for fatty acid uptake and de novo synthesis. Lxra was also related to activation of lipolysis in adipocyte [63,64] and may be responsible for the maintenance of β-oxidation-related genes at L12, as suggested by the strong correlation with Acads and Cpt1a (r > 0.7, Figure 2e). Pparg had a secondary milk lipid regulatory role in rodent compared to ruminant [19] but promote de novo fatty acid synthesis, triglyceride synthesis and lipid secretion [19,45,65]. Finally, Igf1 is known to be an important activator of fatty acid β-oxidation [56] that could counteract insulin inhibitory effect [20,42] on this pathway and notably at involution. It may act independently on the maintenance of Acads and Cpt1a expression, as suggested by the very strong correlation between Igf1r, Acads and Cpt1a expressions (r ≥ 0.84, Figure 2e). Suggested mechanisms associated to the galactologue effect of fenugreek are summarized in Figure 5.
Another mechanism by which fenugreek could increase milk flow may be its capacity to favor milk ejection by stimulating oxytocin secretion [22]. Indeed, fenugreek is a well-known oxytocic agent used to promote uterine contractions at delivery [23,25] and oxytocin expression was overexpressed in the pituitary gland during lactation in the fenugreek-supplemented diet, particularly at L18 (1.88-fold). Even if Oxtr expression was not significantly increased in mammary gland, fenugreek might maintain greater milk flow at L18 by promoting milk ejection (Figure 5).
Nevertheless, we could not observe increase in mother prolactin, as suggested in previous studies [26,53], because of strong variability in plasmatic prolactin concentration. These variations were probably due to the too-short dam/pup separation time before sacrifice (60 min) [67], which made prolactin concentration more likely representative to the time since last suckling.

4.5. Fenugreek Stimulates Estrogenic Activity at the End of Lactation and Increased Energy Availability for Milk Production

At L18 and Inv1, fenugreek-supplemented dams tended to have higher plasma estrogens, and in the pituitary, had higher expression of C3, which is known to be a strong estrogenic biomarker in the uterus [68]. Moreover, Esr1 tended to be upregulated in the mammary gland at L21 (Figure 3g) and was strongly correlated with genes overexpressed at this period (r ≥ 0.74 with Csn2, Lalba, Aqp1, Plin2 and Akt1, Figure 2g and Supplementary Figure S1). As fenugreek is known to contain several estrogenic compounds [23,27], those might contribute to maintaining the expression of milk secretory genes at Inv1 partly through the mediation of Akt1 [69].
Finally, fenugreek supplementation increased global food consumption of dams by 10%, in line with earlier studies [52,70,71], principally at mid-lactation (Supplementary Figure S4) that could partly account for fenugreek lactogenic effect. Indeed, lactation is a period of high energy requirement characterized by an important hyperphagia, in particular in small animals where food intake can be increased by 450% [72]. Rats have little lipid storage during lactation and energy requirement for milk production almost exclusively comes from increased food consumption [22,73]. Thus, by enhancing food consumption, fenugreek might enhance energy availability for milk production. This increase in food intake observed after fenugreek supplementation might be mediated (i) by a family of its bioactive compounds, steroid saponins, that stimulate eating motivation [74,75] and could act directly on the hypothalamus or through stimulation of prolactin, or (ii) by a greater peak of prolactin during suckling, as suggested by overexpression of receptors of prolactin secretion activators in the pituitary gland (thyrotropin releasing hormone and vasoactive intestinal peptide) [76]. Indeed, lactation hyperphagia is under the primary control of prolactin which decreases leptin secretion in adipocytes and, in the hypothalamus, stimulates orexigenic neuropeptide Y secretion and decreases its sensitivity to leptin [22]. Moreover, milk production is also known as an important determinant of food intake in rat [72,77]. Indeed, greater milk yield leads to higher dam’s energy expenditure and likely, enhanced suckling stimulus, as mammary gland was reported to be emptied at each feeding for a rodent litter-size model of 12 pups [78], resulting in greater food intake. This is in accordance with the peak dietary intake observed when fenugreek dams started their peak milk production.
Otherwise, we observed higher leptin and insulin level in plasma of fenugreek-supplemented dams likely caused by fenugreek stimulation of insulin secretion [79]. Yet, these hormones are known to exhibit important anorexigenic effect under normal physiological conditions [80]. However, during lactation, because of central resistance to their signals [22], insulin and leptin had only secondary roles in regulating lactation-associated hyperphagia compared to suckling stimulus and prolactin action [77,81]. Moreover, under normal conditions, orexigenic effect of fenugreek was observed despite an increase of plasma insulin [74]. Thus, effect of fenugreek on food intake was probably not related to the increase of both insulin and leptin plasma concentrations.
Whatever the cause, overall food increase in fenugreek-supplemented dams was of 10% and only of 5.3% (p = 0.041) related to dams’ body weight, so it cannot alone account for the 15% increase in milk production observed in our study.

5. Conclusions

The current study confirms the ability of dietary fenugreek supplementation to promote milk production, and sheds light into its action at the molecular level. Indeed, milk flow was increased by 15.3% and most of the genes related to milk lipid, lactose and protein synthesis as well as energy metabolism were overexpressed. Moreover, our findings suggest that fenugreek may act by extending the duration of peak lactation until the beginning of involution rather than intensifying it. According to our data, the main mechanism of action of fenugreek on milk production is likely through activation of the insulin/GH/IGF-1 axis, which leads to a greater mammary sensitivity to these hormones. Consequently, milk protein and lactose synthesis could be mainly activated by the AKT/mTOR pathway, while milk lipid synthesis and energetic metabolism could be stimulated by LXRα, PPARγ and probably IGF1R itself. Moreover, fenugreek would stimulate milk ejection by an increase of pituitary oxytocin secretion. However, data from gene expression must be confirmed by proteomic and histologic analysis.

Supplementary Materials

The following are available online at https://www.mdpi.com/2073-4425/11/10/1208/s1, Figure S1: PLS-DA score plot on non-normalized mammary gene expression separating groups according to the diet and the lactation period. Figure S2: Pearson correlation table between all mammary gland genes’ expressions on row data. Figure S3: Pearson correlation table between all mammary gland genes’ expressions on data normalized by the period of lactation. Figure S4: Food intake of dams supplemented or not with 1 g/kg/day fenugreek during lactation. Table S1: Validation of RNA extraction and primer design.

Author Contributions

Conceptualization, T.S., M.-C.A.-G., D.D. and C.-Y.B.; data curation, T.S. and M.-C.A.-G.; formal analysis, T.S.; funding acquisition, M.-C.A.-G., D.D. and C.-Y.B.; investigation, T.S., A.G. and I.G.; methodology, P.d.C.; project administration, C.-Y.B.; supervision, M.-C.A.-G. and C.-Y.B.; writing—original draft, T.S.; writing—review and editing, T.S., M.-C.A.-G., D.D., P.d.C. and C.-Y.B. All authors have read and agreed to the published version of the manuscript.

Funding

This research was funded by Laboratoire FRANCE Bébé Nutrition (Laval, France), grant number Cifre 2017.0004.

Acknowledgments

The authors want to thank specifically Blandine Castellano (PhAN, Nantes, France), Sandrine Suzanne and Amandine Lefebvre (UTE, Nantes, France) for their precious help during the animal experiments. We also thank Anthony Pagniez (PhAN, Nantes, France) for his appropriate help with RT-qPCR experiments. Finally, we thank Patrick Nguyen (ONIRIS, Nantes, France) for giving us access to the infrared spectrometer that allowed us to carry out milk production measurements.

Conflicts of Interest

Thomas Sevrin received financial support through grants from FRANCE Bébé Nutrition. The founding sponsors had no role in the design of the study; in the collection, analyses, or interpretation of data; in the writing of the manuscript, and they agreed with the decision to publish the results. The authors declare no conflict of interest.

Abbreviations

GH: growth hormone; IGF-1: insulin-like growth factor 1; GHR: GH receptor; IGF1R: IGF-1 receptor; INSR: insulin receptor; PCA: principal component analysis; PLS-DA: partial least square discriminant analysis; AKT: serine/threonine kinase; mTOR: mechanistic target of rapamycin.

Appendix A. List of the Primers’ Sequences

Table A1. List of the primers’ sequences used to measure each gene by qPCR with the amplicon size and the efficiency.
Gene NameGene SymbolFunctionAccession NumberPrimer Sequences (5′ to 3′)Amplicon (pb)Efficiency (%)
Lipoprotein lipaseLplTriglyceride hydrolysis and mediation of lipoprotein uptakesNM_012598F: AACTGCCACTTCAACCACAGC
R: CATACATTCCTGTCACCGTCCA
7095.8
Fatty acid synthaseFasnFatty acid biosynthesis, mainly palmitate and long chain fatty acid synthesisNM_017332F: CGCCGTGGTGCTGGAGATTG
R: CTTGCCGAGGTTGGTGAGGAAG
14298.3
Acetyl-CoA carboxylase αAcaca,
Acc1
Catalyze the rate limiting step in fatty acid biosynthesis: malonyl-CoA synthesisNM_022193F: CGATTCCCATCCGCCTCTTCC
R: GGTCCCTGCTTGTCTCCATACG
12792.3
Acetyl-CoA carboxylase βAcacbFatty acid biosynthesis, involved in inhibition of fatty acid oxidationNM_053922F: GACGCCAGCAACATCACTTCG
R: GCCTCTCGGTCCACCTTACG
10785.5
Fatty acid binding protein 3Fabp3Uptake, intracellular metabolism and transport of fatty acidsNM_024162F: ACAGGAAGGTCAAGTCGGTC
R: ATGGGTGAGAGTCAGGATGAG
12793.3
Fatty acid binding protein 4Fabp4Lipid binding protein involved in fatty acid trafficking, main adipocyte FABPNM_053365F: TGTGGGGACCTGGAAACTCGT
R: CGAAGCCAACTCCCACTTCTTT
7192.9
Stearoyl-CoA desaturaseScd,
Scd1
Fatty acid desaturation, biosynthesis of oleic acid.NM_139192F: GTTGGGTGCCTTATCGCTTTCC
R: CTCCAGCCAGCCTCTTGTCTA
11497.8
Diacylglycerol
O-acyltransferase 1
Dgat1Catalyzes the synthesis of triglyceride from diglyceride and acyl-CoANM_053437F: GGCATCATACTCCATCATCTTC
R: CCCACTGACCTTCTTCCC
11597.1
Diacylglycerol
O-acyltransferase 2
Dgat2Catalyzes the synthesis of triglyceride from diglyceride and acyl-CoANM_001012345F: GGTCATCTCAGTCCTACAG
R: CTATCAGCCAGCAGTCAG
10188.6
Perilipin 2Plin2Coating of intracellular lipid droplets and milk fat globules, involved in milk lipid secretion.NM_001007144F: CTTCTTCATTGACCTGCGAC
R: CACCCTTACCTTAAGTTTCTCCT
10897.1
Solute carrier family 2, facilitated glucose transporter member 1Slc2a1, Glut1One of major glucose transporters, located in the cell membraneNM_138827F: CCAATATGTGGAGCAACTGTG
R: GGAAGCGATCTCATCGAAGG
129108.2
Phosphoglucomutase 1Pgm1Interconvert glucose-1-phosphate and glucose-6-phosphateNM_017033F: CCCTTCACAGTGGAGATCGT
R: GTCGATGCGGATCTTCAGTC
12296.1
UDP-glucose pyrophosphorylase 2Ugp2Convert glucose-1-phosphate to UDP-glucoseNM_001024743F: CGGAAGATTCGATTCAACCC
R: GTTCCCAAACCACCATTGAG
11193.0
β-1,4-
galactosyltransferase 1
B4galt1Catalytic subunit of lactose synthase complex, convert UDP-galactose and glucose into lactoseNM_053287F: CGCTTTGTGTTCAGTGATGTGG
R: AACGTAAGGCAGGCTAAACC
122100.7
Lacatlbumin αLalbaRegulatory subunit of lactose synthase complex, one of the main milk proteinsNM_012594F: CTTGCTTGAATGGACCTGTG
R: GCTACTCTTGCACCAATTTCTG
12692.7
Casein βCsn2Principal milk protein and primary source of essential amino acids for sucking youngNM_017120F: AAACATCCAGCCTATTGCTC
R: CATCTGTTTGTGCTTGGGAA
11896.6
Whey acidic proteinWapWhey protein associated with mammary gland, a major constituent of milkNM_053751F: CATGTCTTCAACTCAGTTCAGTCC
R: CATGTCATTCTGGGCACACTC
10495.8
Solute carrier family 7 member 5Slc7a5Amino acid transporter, mediate the uptake of large neutral amino acids (branch-chain, aromatic)NM_017353F: GGGAAAGGACATAGGACAAGG
R: TCAGATAGTTCCATCCTCCGT
13694.5
Aquaporin 1Aqp1Integral membrane protein, allow the passive transport of water along osmotic gradient.NM_012778F: GGCATTGAGATCATTGGCAC
R: GTGTAGTCAATGGCCAGCAG
14297.8
Aquaporin 3Aqp3Passive water transporter located in the basolateral cell membrane NM_031703F: GGGCTCTACTATGATGCAATCTG
R: GCTGCTGTGCCTATGAACTG
14895.5
Carnitine palmitoyltransferase 1ACpt1aInitiate β-oxidation by translocating long chain fatty acids across mitochondrial inner membrane NM_031559F: TGCCTGCCAGTTCCATTAAGC
R: GTCTCACTCCTCTTGCCAACAG
14390.1
Acyl-CoA dehydrogenase short chainAcadsCatalyze the first step of mitochondrial fatty acid β-oxidationNM_022512F: CGGCAGAACAAGGGTATCAG
R: AAGATGAGGTTAGCTGTAGATGAG
11599.1
Pyruvate dehydrogenase E1 subunit α 1Pdha1Subunit of the pyruvate dehydrogenase complex that convert pyruvate to acetyl-CoA and CO2NM_001004072F: CACGGACCATCTCATCACTG
R: CTCCTCTTCGTCCTGTTAATTCTG
10091.2
Citrate synthaseCsKrebs cycle enzyme that catalyzes the synthesis of citrate from oxaloacetate and acetyl-CoANM_130755F: GCTATAGTATCCCTGAGTGCCA
R: AGAGCCAAGAGACCTGTTCC
12891.1
Cytochrome c oxidase I, mitochondrialMtco1,
mtCox1
Subunit of the cytochrome c oxidase, catalyzes reduction of oxygen to water for oxidative phosphorylation YP_665631F: GCCTAGATGTAGACACCCGAG
R: TATTTCCTCCATGTAGTGTAGCGA
10797.0
ATP synthase F1 subunit αAtp5f1aSubunit of the mitochondrial ATP synthase, catalyzes the ATP synthesis during oxidative phosphorylationNM_023093F: AGCGTTTCAATGATGGGACTG
R: GTACTTCATGGCATCTGCGTC
12494.3
Sterol regulatory element binding transcription factor 1Srebf1Nuclear transcription factor that bind to the sterol regulatory element 1, regulates the transcription of genes important for sterol biosynthesis and lipogenesisNM_001276707F: GCAGCTGATGGAGACAGGGA
R: CGACAGCGTCAGAACAGCTA
7699.3
Peroxisome proliferator activated receptor γ (PPARγ)PpargTranscription factor that regulate expression of genes involved in lipid metabolismNM_001145366F: CCGTTCACAAGAGCTGACCC
R: TCGCACTTTGGTATTCTTGGAGC
7394.7
Thyroid hormone responsiveThrsp,
Spot14
Play a role in regulation of lipogenesis and specially triglycerides with medium-chain fatty acids.NM_012703F: CACATCCTTACCCACCTGAC
R: CGTGTAAAGTGATCTTCCATAGAG
10988.5
Nuclear receptor subfamily 1, group H, member 3 (LXRα)Nr1h3,
Lxra
Nuclear oxysterol receptor that regulate inflammation and homeostasis of lipids and cholesterolNM_031627F: CAGAGCCTACAGAACTTCGT
R: CAGCTCAGCACATTGTAATGG
123101.0
AKT serine/threonine kinase 1 (AKT)Akt1Key signaling pathway protein notably linked to mTOR signaling, regulate metabolism, proliferationNM_033230F: CTACTATGCCATGAAGATCCTC
R: CTACTATGCCATGAAGATCCTC
12493.9
Mechanistic target of rapamycin kinase (mTOR)MtorCentral regulator of cell metabolism, growth and survival, mediate nutrient and energy signal, key regulator of mRNA translationNM_019906F: ACCAATTATACTCGCTCCCTG
R: CATAGCAACCTCAAAGCAGTC
14790.9
Signal transducer and activator of transcription 5A (STAT5)Stat5a,
Stat5
Involved in signal transduction and transcription activation in response to cytokine, growth factors and prolactinNM_017064F: AGAACACCCGCAATGATTACAG
R: GTGACATGTTTCTGAAGTGGG
12997.8
Prolactin receptorPrlrProlactin binding and signaling mainly through JAK2/STAT5 and Akt/mTOR pathwaysNM_001034111F: GAAATGCCAAATGACTTCACCT
R: TATAGCCCTTCAAAGCCACTG
11191.5
Insulin receptorInsrInsulin binding and signaling mainly through AKT/mTOR and MAPK pathwaysNM_017071F: TTCATTCAGGAAGACCTTCGA
R: CAGGCCAGAGATGACAAGTGAC
25995.4
Oxytocin receptorOxtrG-protein coupled receptor binding oxytocin, activate PIP3-Ca2+ pathwayNM_012871F: TTCATTCAGGAAGACCTTCGA
R: GAGTTCGTGGAAGAGGTGAC
14688.3
Growth hormone receptorGhrGrowth hormone binding and signaling mainly through JAK2/STAT5 pathwayNM_017094F: TTCTTCGTGCAGATGTGGAG
R: ATGGAAACCGGAAATCTTCTTCAC
115102.1
Insulin-like growth factor 1 receptorIgf1rIGF-1 binding and signaling mainly through AKT/mTOR and MAPK pathways.NM_052807F: CCATAGAAAGAGGAATAACAGCAG
R: TACCTCCCATTCATCAGGCA
10888.9
Estrogen receptor 1Esr1,
Esrα
Nuclear receptor binding estrogens, act as a regulator of DNA transcriptionNM_012689F: CCACGATCAAGTTCACCTTCTG
R: CACATTTACCTTGATTCCTGTCCA
13686.8 (MG)
92.1 (PG)
Complement C3C3Involved in innate immune response; central role in activating the complement systemNM_000064F: CTTCTTCATTGACCTGCGAC
R: CACCCTTACCTTAAGTTTCTCCT
12294.6 (MG)
98.4 (PG)
Superoxide dismutase 1Sod1Convert superoxide to hydrogen peroxide and oxygen, involved in response to oxidative stressNM_017050F: TACACAAGGCTGTACCACTG
R: CACACGATCTTCAATGGACAC
150101.4
CatalaseCatKey antioxidant enzyme that convert hydrogen peroxide to water and oxygen, limit oxidative stressNM_012520F: CATAGCCAGAAGAGAAACCC
R:GAACAAGAAAGTAACCTGATGGAG
10493.7
Glutathione peroxidase 1Gpx1Catalyze the reduction of hydroperoxides and H2O2 by glutathione to protect cells against oxidative damagesNM_030826F: GTTCGGACATCAGGAGAATGG
R: GAAGGTAAAGAGCGGGTGAG
14495.7
ProlactinPrlPituitary hormone that primarily promote lactation. Play a role as growth regulator and in cell survivalNM_012629F: AAACAGTATGTCCAAGATCGTGAG
R: ACTTCCGGAGGGACTTTCTG
11299.8
GhGh1Pituitary hormone playing major role in growth control. Stimulate IGF1-1 secretion by the liverNM_001034848F: ACCTACAAAGAGTTCGAGCGT
R: GAAGCAATTCCATGTCAGTTCTC
14794.2
Oxytocin/neurophysin I prepropeptideOxtHormone involved in contraction of smooth muscle during parturition and lactationNM_012996F: GGATATGCGCAAGTGTCTTCC
R: GAGGGCAGGTAGTTCTCCTC
140106.8
Dopamine receptor D2Drd2G-protein coupled receptor of dopamine which inhibit adenylyl-cyclase and notably prolactin secretionNM_012547F: CCACTCAAGGGCAACTGTACC
R: ATGGGGCTATACCGGGTCC
17991.5
Thyrotropin releasing hormone receptorTrhrG-protein coupled receptor of TRH that activate PIP3-Ca2+ pathway, promote release of prolactinNM_013047F: CAGACCGCTTTAGCACAGAG
R: ACTGGGTCCATTCTTCTCGG
11290.1
Vasoactive intestinal peptide receptor 2Vipr2G-protein coupled receptor of VIP which activate adenylyl-cyclase and notably prolactin secretionNM_017238F: GCAGCCAAATGGAGAATCAC
R: TTTGCTTATGTTTCCTGGTCTG
145104.0
Growth hormone releasing hormone receptorGhrhrG-protein coupled receptor of GHRH that activate adenylyl-cyclase and stimulate GH transcription and secretionNM_012850F: GCTGTTTGCTACTTTCATCCT
R: CCTTGCACAGAATAGTGGAC
10997.9
Adrogen receptorArSteroid hormone activated transcription factor, involved in cell proliferation and differentiationNM_012502F: CTCTGCCTCTGAAGTGTGGT
R: TACTGTCCAAACGCATGTCC
13691.5
Actin βActbHighly conserved proteins that are involved in cell motility, structure, integrity and signalingNM_031144F: CTATCGGCAATGAGCGGTTCC
R: GCACTGTGTTGGCATAGAGGTC
15093.2 (PG)
Ubiquitously expressed, prefoldin-like chaperoneUxtCofactor that modulates AR-dependent transcription, and also plays a critical role in TNF-induced apoptosisNM_001006982F: ATTGACCGAAAGAGTTCCCT
R: GTAGTTCTCTAAGTCCCTCTAGCA
10891.3 (MG)
87.2 (PG)
Ribosomal protein S9Rps9One of 40S ribosomal subunit proteinNM_031108F: GCTAAAGTTGATTGGAGAGTATGG
R: AGAGCGTTGCCTTCAAACAG
14699.0 (MG)
89.5 (PG)
Valosin-containing proteinVcpATP binding protein involved in vesicle transport and fusion and endoplasmic reticulum functionNM_053864F: TCAAGCGAGAGGATGAGGAG
R: TCACACCAATTGCCTTAAAGAG
14092.3
Official name of each gene with official symbol given by NCBI gene (first symbol) as well as the most common symbol used if different. Functions were given by NCBI gene or GeneCards. Primers of Actb, Lpl, Fasn, Acaca, Acacb, Scd1, Dgat1, Dgat2, Fabp4, Cpt1a, Srebf1, Pparg, Akt1, mTOR, Insr and Drd2 were already designed and validated in the lab, whereas other primers were designed using PerlPrimer. All primers were tested for efficiency and specificity (RT-) in mammary gland or/and pituitary gland. MG and PG: efficiency measured in mammary gland and pituitary gland respectively, if genes’ expression was measured in both tissues.

References

  1. World Health Organization. Indicators for Assessing Infant and Young Child Feeding Practices; World Health Organization: Geneva, Switzerland, 2007. [Google Scholar]
  2. Breastfeeding, S.O. Breastfeeding and the Use of Human Milk. Pediatrics 2012, 129, e827–e841. [Google Scholar] [CrossRef] [PubMed] [Green Version]
  3. Mosca, F.; Giannì, M.L. Human milk: Composition and health benefits. Pediatr. Med. Chir. 2017, 39, 155. [Google Scholar] [CrossRef] [PubMed] [Green Version]
  4. Victora, C.G.; Bahl, R.; Barros, A.J.D.; A França, G.V.; Horton, S.; Krasevec, J.; Murch, S.; Sankar, M.J.; Walker, N.; Rollins, N.C. Breastfeeding in the 21st century: Epidemiology, mechanisms, and lifelong effect. Lancet 2016, 387, 475–490. [Google Scholar] [CrossRef] [Green Version]
  5. Thulier, D.; Mercer, J. Variables Associated With Breastfeeding Duration. J. Obstet. Gynecol. Neonatal Nurs. 2009, 38, 259–268. [Google Scholar] [CrossRef] [PubMed]
  6. Gatti, L. Maternal Perceptions of Insufficient Milk Supply in Breastfeeding. J. Nurs. Scholarsh. 2008, 40, 355–363. [Google Scholar] [CrossRef] [PubMed] [Green Version]
  7. Giannì, M.L.; Bettinelli, M.E.; Manfra, P.; Sorrentino, G.; Bezze, E.; Plevani, L.; Cavallaro, G.; Raffaeli, G.; Crippa, B.L.; Colombo, L.; et al. Breastfeeding Difficulties and Risk for Early Breastfeeding Cessation. Nutrients 2019, 11, 2266. [Google Scholar] [CrossRef] [Green Version]
  8. Hillervik-Lindquist, C. Studies on Perceived Breast Milk Insufficiency A Prospective Study in a Group of Swedish Women. Acta Paediatr. 1991, 80, 1–29. [Google Scholar] [CrossRef]
  9. Giugliani, E.R. Common problems during lactation and their management. Jornal de Pediatria 2004, 80, S147–S154. [Google Scholar] [CrossRef] [Green Version]
  10. Bazzano, A.N.; Hofer, R.; Thibeau, S.; Gillispie, V.; Jacobs, M.; Theall, K.P. A Review of Herbal and Pharmaceutical Galactagogues for Breast-Feeding. Ochsner J. 2016, 16, 511–524. [Google Scholar]
  11. Sim, T.F.; Sherriff, J.L.; Hattingh, H.L.; Parsons, R.; Tee, L.B. The use of herbal medicines during breastfeeding: A population-based survey in Western Australia. BMC Complement. Altern. Med. 2013, 13, 317. [Google Scholar] [CrossRef] [Green Version]
  12. Abascal, K.; Yarnell, E. Botanical Galactagogues. Altern. Complement. Ther. 2008, 14, 288–294. [Google Scholar] [CrossRef]
  13. Forinash, A.B.; Yancey, A.M.; Barnes, K.N.; Myles, T.D. The Use of Galactogogues in the Breastfeeding Mother. Ann. Pharmacother. 2012, 46, 1392–1404. [Google Scholar] [CrossRef]
  14. Sevrin, T.; Alexandre-Gouabau, M.-C.; Darmaun, M.; Palvadeau, A.; André, A.; Nguyen, P.; Ouguerram, K.; Boquien, C.-Y. Use of water turnover method to measure mother’s milk flow in a rat model: Application to dams receiving a low protein diet during gestation and lactation. PLoS ONE 2017, 12, e0180550. [Google Scholar] [CrossRef] [Green Version]
  15. Sevrin, T.; Alexandre-Gouabau, M.-C.; Castellano, B.; Aguesse, A.; Ouguerram, K.; Nguyen, P.; Darmaun, D.; Boquien, C.-Y.; Gouabau, A. Impact of Fenugreek on Milk Production in Rodent Models of Lactation Challenge. Nutrients 2019, 11, 2571. [Google Scholar] [CrossRef] [PubMed] [Green Version]
  16. Foong, S.C.; Tan, M.L.; Foong, W.C.; A Marasco, L.; Ho, J.J.; Ong, J.H. Oral galactagogues (natural therapies or drugs) for increasing breast milk production in mothers of non-hospitalised term infants. Cochrane Database Syst. Rev. 2020. [Google Scholar] [CrossRef]
  17. Truchet, S.; Honvo-Houéto, E. Physiology of milk secretion. Best Pract. Res. Clin. Endocrinol. Metab. 2017, 31, 367–384. [Google Scholar] [CrossRef]
  18. E Grzeskowiak, L.; Wlodek, M.E.; Geddes, D.T. What Evidence Do We Have for Pharmaceutical Galactagogues in the Treatment of Lactation Insufficiency?-A Narrative Review. Nutrients 2019, 11, 974. [Google Scholar] [CrossRef] [Green Version]
  19. Osorio, J.S.; Lohakare, J.; Bionaz, M. Biosynthesis of milk fat, protein, and lactose: Roles of transcriptional and posttranscriptional regulation. Physiol. Genom. 2016, 48, 231–256. [Google Scholar] [CrossRef] [Green Version]
  20. Vernon, R.G. Lipid metabolism during lactation: A review of adipose tissue-liver interactions and the development of fatty liver. J. Dairy Res. 2005, 72, 460–469. [Google Scholar] [CrossRef]
  21. Hull, K.; Harvey, S.; Hull, K.L. Growth hormone: Roles in female reproduction. J. Endocrinol. 2001, 168, 1–23. [Google Scholar] [CrossRef]
  22. Anderson, S.M.; MacLean, P.S.; McManaman, J.L.; Neville, M.C. Lactation and its hormonal control. In Knobil and Neill’s Physiology of Reproduction, 4th ed.; Elsevier: New York, NY, USA, 2015; pp. 2055–2105. [Google Scholar]
  23. Bahmani, M.; Shirzad, H.; Mirhosseini, M.; Mesripour, A.; Rafieian-Kopaei, M. A Review on Ethnobotanical and Therapeutic Uses of Fenugreek (Trigonella foenum-graceum L). J. Evid.-Based Integr. Med. 2015, 21, 53–62. [Google Scholar] [CrossRef] [Green Version]
  24. Fuller, S.; Stephens, J.M. Diosgenin, 4-Hydroxyisoleucine, and Fiber from Fenugreek: Mechanisms of Actions and Potential Effects on Metabolic Syndrome. Adv. Nutr. 2015, 6, 189–197. [Google Scholar] [CrossRef] [PubMed] [Green Version]
  25. Wani, S.A.; Kumar, P. Fenugreek: A review on its nutraceutical properties and utilization in various food products. J. Saudi Soc. Agric. Sci. 2018, 17, 97–106. [Google Scholar] [CrossRef] [Green Version]
  26. Abdou, R.M.; Fathey, M. Evaluation of early postpartum fenugreek supplementation on expressed breast milk volume and prolactin levels variation. Egypt. Pediatr. Assoc. Gaz. 2018, 66, 57–60. [Google Scholar] [CrossRef]
  27. Anju, V.S.; Sreeharshan, S. In vitro estrogenic activities of fenugreek Trigonella foenum graecum seeds. Indian J. Med. Res. 2010, 131, 814–819. [Google Scholar]
  28. Al-Chalabii, I.M.S. Diosgenin effect on rats and mice ovaries. J. Fac. Med. Baghdad 2005, 47, 296–301. [Google Scholar]
  29. Kandhare, A.D.; Bandyopadhyay, D.; Thakurdesai, P.A. Low molecular weight galactomannans-based standardized fenugreek seed extract ameliorates high-fat diet-induced obesity in mice via modulation of FASn, IL-6, leptin, and TRIP-Br2. RSC Adv. 2018, 8, 32401–32416. [Google Scholar] [CrossRef] [Green Version]
  30. Shim, S.H.; Lee, E.J.; Kim, J.S.; Kang, S.S.; Ha, H.; Lee, H.Y.; Kim, C.; Lee, J.-H.; Son, K.H. Rat Growth-Hormone Release Stimulators from Fenugreek Seeds. Chem. Biodivers. 2008, 5, 1753–1761. [Google Scholar] [CrossRef]
  31. Koetsier, G.; Cantor, E. A Practicle Guide to Analysing Nucleic Acid Concentration and Purity with Microvolume Spectrophotometer; New England Biolabs Inc.: Ipswich, MA, USA, 2019. [Google Scholar]
  32. Rudolph, M.C.; McManaman, J.L.; Hunter, L.; Phang, T.; Neville, M.C. Functional Development of the Mammary Gland: Use of Expression Profiling and Trajectory Clustering to Reveal Changes in Gene Expression During Pregnancy, Lactation, and Involution. J. Mammary Gland Biol. Neoplasia 2003, 8, 287–307. [Google Scholar] [CrossRef]
  33. Rudolph, M.C.; McManaman, J.L.; Phang, T.; Russell, T.; Kominsky, D.J.; Serkova, N.J.; Stein, T.; Anderson, S.M.; Neville, M.C. Metabolic regulation in the lactating mammary gland: A lipid synthesizing machine. Physiol. Genom. 2007, 28, 323–336. [Google Scholar] [CrossRef]
  34. Marshall, O.J. PerlPrimer: Cross-platform, graphical primer design for standard, bisulphite and real-time PCR. Bioinformatics 2004, 20, 2471–2472. [Google Scholar] [CrossRef] [PubMed] [Green Version]
  35. Kasperczyk, A.; Machnik, G.; Dobrakowski, M.; Sypniewski, D.; Birkner, E.; Kasperczyk, S. Gene expression and activity of antioxidant enzymes in the blood cells of workers who were occupationally exposed to lead. Toxicology 2012, 301, 79–84. [Google Scholar] [CrossRef] [PubMed]
  36. Bionaz, M.; Loor, J.J. Identification of reference genes for quantitative real-time PCR in the bovine mammary gland during the lactation cycle. Physiol. Genom. 2007, 29, 312–319. [Google Scholar] [CrossRef] [PubMed]
  37. Kaur, R.; Sodhi, M.; Sharma, A.; Sharma, V.L.; Verma, P.; Swami, S.K.; Kumari, P.; Mukesh, M. Selection of suitable reference genes for normalization of quantitative RT-PCR (RT-qPCR) expression data across twelve tissues of riverine buffaloes (Bubalus bubalis). PLoS ONE 2018, 13, e0191558. [Google Scholar] [CrossRef] [PubMed] [Green Version]
  38. Agnoux, A.M.; Antignac, J.-P.; Boquien, C.-Y.; David, A.; Desnots, E.; Ferchaud-Roucher, V.; Darmaun, D.; Parnet, P.; Alexandre-Gouabau, M.-C. Perinatal protein restriction affects milk free amino acid and fatty acid profile in lactating rats: Potential role on pup growth and metabolic status. J. Nutr. Biochem. 2015, 26, 784–795. [Google Scholar] [CrossRef]
  39. Kim, H.-Y. Statistical notes for clinical researchers:post-hocmultiple comparisons. Restor. Dent. Endod. 2015, 40, 172–176. [Google Scholar] [CrossRef]
  40. Hellemans, J.; Vandesompele, J. qPCR data analysis – unlocking the secret to successful results. In PCR Troubleshooting and Optimization: The Essential Guide; Caister Academic Press: Edinburgh, UK, 2011. [Google Scholar]
  41. Yuan, J.S.; Reed, A.; Chen, F.; Stewart, J.C.N. Statistical analysis of real-time PCR data. BMC Bioinform. 2006, 7, 85. [Google Scholar] [CrossRef] [Green Version]
  42. McManaman, J.L. Formation of milk lipids: A molecular perspective. Clin. Lipidol. 2009, 4, 391–401. [Google Scholar] [CrossRef] [Green Version]
  43. Modha, G.; Blanchard, A.; Iwasiow, B.; Mao, X.J.; Troup, S.; Adeyinka, A.; Watson, P.; Shiu, R.; Myal, Y. Developmental Changes in Insulin-like Growth Factor I Receptor Gene Expression in the Mouse Mammary Gland. Endocr. Res. 2004, 30, 127–140. [Google Scholar] [CrossRef]
  44. Oppi-Williams, C.; Suagee, J.; Corl, B. Regulation of lipid synthesis by liver X receptor α and sterol regulatory element-binding protein 1 in mammary epithelial cells. J. Dairy Sci. 2013, 96, 112–121. [Google Scholar] [CrossRef]
  45. Bionaz, M.; Loor, J. Gene networks driving bovine milk fat synthesis during the lactation cycle. BMC Genom. 2008, 9, 366. [Google Scholar] [CrossRef] [PubMed] [Green Version]
  46. Soloff, M.S. Oxytocin Receptors and Mammary Myoepithelial Cells. J. Dairy Sci. 1982, 65, 326–337. [Google Scholar] [CrossRef]
  47. Bionaz, M.; Loor, J.J. Gene Networks Driving Bovine Mammary Protein Synthesis during the Lactation cycle. Bioinform. Biol. Insights 2011, 5, BBI-S7003. [Google Scholar] [CrossRef]
  48. Jones, R.G.; Ilic, V.; Williamson, D.H. Physiological significance of altered insulin metabolism in the conscious rat during lactation. Biochem. J. 1984, 220, 455–460. [Google Scholar] [CrossRef] [PubMed]
  49. Brogan, R.S.; Mitchell, S.E.; Trayhurn, P.; Smith, M.S. Suppression of Leptin During Lactation: Contribution of the Suckling Stimulus Versus Milk Production 1. Endocrinology 1999, 140, 2621–2627. [Google Scholar] [CrossRef]
  50. Walsh, D.S.; Vesely, J.; Mahadevan, S. Relationship between Milk Production and Circulating Hormones in Dairy Cows. J. Dairy Sci. 1980, 63, 290–294. [Google Scholar] [CrossRef]
  51. Ošt’ádalová, I.; Babický, A. Periodization of the early postnatal development in the rat with particular attention to the weaning period. Physiol. Res. 2012, 61, S1–S7. [Google Scholar]
  52. Al-Sherwany, D.A.O. Feeding effects of fenugreek seeds on intake, milk yield, chemical composition of milk and some biochemical parameters in Hamdani ewes. Al-Anbar J. Vet. Sci. 2015, 8, 49–54. [Google Scholar]
  53. Mahgoub, A.A.; Sallam, M.T. Effect of Extract Crushed Fenugreek Seeds as Feed Additive on some Blood Parameters, Milk Yield and Its Composition of Lactating Egyptian Buffaloes. J. Anim. Poult. Prod. 2016, 7, 269–273. [Google Scholar] [CrossRef]
  54. Alamer, M.A.; Basiouni, G.F. Feeding effect of Fenugreek seed (Trigonella foenum-graecum L.) on lactation performance, some plasma constituent and growth hormone level in goats. Pak. J. Biol. Sci. 2005, 8, 1553–1556. [Google Scholar]
  55. Liu, H.; Hua, Y.; Luo, H.; Shen, Z.; Tao, X.; Zhu, X. An Herbal Galactagogue Mixture Increases Milk Production and Aquaporin Protein Expression in the Mammary Glands of Lactating Rats. Evid.-Based Complement. Altern. Med. 2015, 2015, 1–6. [Google Scholar] [CrossRef] [PubMed] [Green Version]
  56. Aguirre, G.A.; Ita, J.R.-D.; De La Garza, R.G.; Castilla-Cortázar, I. Insulin-like growth factor-1 deficiency and metabolic syndrome. J. Transl. Med. 2016, 14, 1–23. [Google Scholar] [CrossRef] [Green Version]
  57. Qiu, H.; Yang, J.-K.; Chen, C. Influence of insulin on growth hormone secretion, level and growth hormone signalling. Sheng Li Xue Bao Acta Physiol. Sin. 2017, 69, 541–556. [Google Scholar]
  58. Birzniece, V.; Sata, A.; Ho, K.K.Y. Growth hormone receptor modulators. Rev. Endocr. Metab. Disord. 2008, 10, 145–156. [Google Scholar] [CrossRef]
  59. Chi, M.M.-Y.; Schlein, A.L.; Moley, K.H. High Insulin-Like Growth Factor 1 (IGF-1) and Insulin Concentrations Trigger Apoptosis in the Mouse Blastocyst via Down-Regulation of the IGF-1 Receptor**This work was supported in part by NIH through Grants RO1-HD-38061–01A1 (to K.H.M.), P60-DK-30579 (to K.H.M.), and the Washington University Clinical Nutrition Research Unit Center Grant P30-DK-56341 (to K.H.M.); and by the Burroughs Wellcome Fund through a Career Award in the Biomedical Sciences (to K.H.M.). Endocrinology 2000, 141, 4784–4792. [Google Scholar] [CrossRef]
  60. Payankaulam, S.; Raicu, A.-M.; Arnosti, D.N. Transcriptional Regulation of INSR, the Insulin Receptor Gene. Genes 2019, 10, 984. [Google Scholar] [CrossRef] [Green Version]
  61. Rhodes, C.J.; White, M.F.; Leahy, J.L.; Kahn, S.E. Direct Autocrine Action of Insulin on β-Cells: Does It Make Physiological Sense? Diabetes 2013, 62, 2157–2163. [Google Scholar] [CrossRef] [Green Version]
  62. Akers, R.M. Major Advances Associated with Hormone and Growth Factor Regulation of Mammary Growth and Lactation in Dairy Cows. J. Dairy Sci. 2006, 89, 1222–1234. [Google Scholar] [CrossRef]
  63. Steffensen, K.R.; Gustafsson, J.-Å. Putative Metabolic Effects of the Liver X Receptor (LXR). Diabetes 2004, 53, S36–S42. [Google Scholar] [CrossRef] [Green Version]
  64. Cruz-Garcia, L.; Sanchez-Gurmaches, J.; Gutiérrez, J.; Navarro, I.; Alvarez, I.N. Role of LXR in trout adipocytes: Target genes, hormonal regulation, adipocyte differentiation and relation to lipolysis. Comp. Biochem. Physiol. Part A: Mol. Integr. Physiol. 2012, 163, 120–126. [Google Scholar] [CrossRef] [PubMed]
  65. Bionaz, M.; Chen, S.; Khan, M.J.; Loor, J. Functional Role of PPARs in Ruminants: Potential Targets for Fine-Tuning Metabolism during Growth and Lactation. PPAR Res. 2013, 2013, 1–28. [Google Scholar] [CrossRef] [PubMed] [Green Version]
  66. Li, J.; Luo, J.; Zhu, J.; Sun, Y.; Yao, D.; Shi, H.; Wang, W. Regulation of the fatty acid synthase promoter by liver X receptor α through direct and indirect mechanisms in goat mammary epithelial cells. Comp. Biochem. Physiol. Part B Biochem. Mol. Biol. 2015, 184, 44–51. [Google Scholar] [CrossRef] [PubMed]
  67. Wehrenberg, W.B.; Gaillard, R.C. Neuroendocrine Mechanisms Regulating Growth Hormone and Prolactin Secretion during Lactation. Endocrinology 1989, 124, 464–467. [Google Scholar] [CrossRef]
  68. Christoffel, J.; Rimoldi, G.; Wuttke, W. Effects of 8-prenylnaringenin on the hypothalamo-pituitary-uterine axis in rats after 3-month treatment. J. Endocrinol. 2006, 188, 397–405. [Google Scholar] [CrossRef] [Green Version]
  69. Lee, Y.-R.; Park, J.; Yu, H.-N.; Kim, J.-S.; Youn, H.J.; Jung, S.H. Up-regulation of PI3K/Akt signaling by 17β-estradiol through activation of estrogen receptor-α, but not estrogen receptor-β, and stimulates cell growth in breast cancer cells. Biochem. Biophys. Res. Commun. 2005, 336, 1221–1226. [Google Scholar] [CrossRef]
  70. Degirmencioglu, T.; Unal, H.; Ozbilgin, S.; Kuraloglu, H. Effect of ground fenugreek seeds (Trigonella foenum-graecum) on feed consumption and milk performance in Anatolian water buffaloes. Arch. Anim. Breed. 2016, 59, 345–349. [Google Scholar] [CrossRef] [Green Version]
  71. El-Nor, S.A.; Khattab, H.; Al-Alamy, H.; Salem, F.; Abdo, M. Effect of Some Medicinal Plants Seeds in the Rations on the Productive Performance of Lactating Buffaloes. Int. J. Dairy Sci. 2007, 2, 348–355. [Google Scholar] [CrossRef]
  72. Hirscbberg, A.L. Hormonal regulation of appetite and food intake. Ann. Med. 1998, 30, 7–20. [Google Scholar] [CrossRef]
  73. Hanwell, A.; Malcolm, P. Physiological effects of lactation on the mother. Symp. Zool. Soc. Lond. 1977, 41, 297–312. [Google Scholar]
  74. Petit, P.; Sauvaire, Y.; Ponsin, G.; Manteghetti, M.; Fave, A.; Ribes, G. Effects of a fenugreek seed extract on feeding behaviour in the rat: Metabolic-endocrine correlates. Pharmacol. Biochem. Behav. 1993, 45, 369–374. [Google Scholar] [CrossRef]
  75. Petit, P.R.; Sauvaire, Y.D.; Hillaire-Buys, D.M.; Leconte, O.M.; Baissac, Y.G.; Ponsin, G.R.; Ribes, G.R. Steroid saponins from fenugreek seeds: Extraction, purification, and pharmacological investigation on feeding behavior and plasma cholesterol. Steroids 1995, 60, 674–680. [Google Scholar] [CrossRef]
  76. Matsushita, N.; Kato, Y.; Shimatsu, A.; Katakami, H.; Yanaihara, N.; Imura, H. Effects of VIP, TRH, GABA and dopamine on prolactin release from superfused rat anterior pituitary cells. Life Sci. 1983, 32, 1263–1269. [Google Scholar] [CrossRef]
  77. Xu, J.; Kirigiti, M.A.; Grove, K.L.; Smith, M.S. Regulation of Food Intake and Gonadotropin-Releasing Hormone/Luteinizing Hormone during Lactation: Role of Insulin and Leptin. Endocrinology 2009, 150, 4231–4240. [Google Scholar] [CrossRef] [Green Version]
  78. Morag, M.; Popliker, F.; Yagil, R. Effect of litter size on milk yield in the rat. Lab. Anim. 1975, 9, 43–47. [Google Scholar] [CrossRef] [PubMed]
  79. Inui, A.; Tsai, M.; Amitani, H.; Asakawa, A. Stimulation of leptin secretion by insulin. Indian J. Endocrinol. Metab. 2012, 16, 543–548. [Google Scholar] [CrossRef]
  80. Pliquett, R.; Fuhrer, D.; Falk, S.; Zysset, S.; Von Cramon, D.; Stumvoll, M. The Effects of Insulin on the Central Nervous System—Focus on Appetite Regulation. Horm. Metab. Res. 2006, 38, 442–446. [Google Scholar] [CrossRef] [PubMed] [Green Version]
  81. Denis, R.G.P.; Williams, G.; Vernon, R.G. Regulation of serum leptin and its role in the hyperphagia of lactation in the rat. J. Endocrinol. 2003, 176, 193–203. [Google Scholar] [CrossRef] [Green Version]
Figure 1. Experimental design: three series of animal experiments (Xp1, 2 and 3) were carried out, all with dams receiving either control (CTL) or fenugreek-supplemented diet (FEN), with different period of sampling for each experiment. G, L, PND and Inv correspond to the day of gestation, lactation, post-natal and involution days, respectively. Milk flow was measured by the deuterated water enrichment method [14,15] between L11 and L18. Tissues sampled were mammary and pituitary glands.
Genes 11 01208 g001
Figure 2. Temporal pattern of mammary gland gene expression in CTL and FEN groups through lactation and until involution. (a) Score plot on the first two dimensions of the PCA, accounting for 71% of the total variance for 43 un-normalized data (genes), (b) PCA loading plot presented clusters of variables highly associated to L12- and L18-groups (kinetic 1 and 2 clusters) or to Inv1 group (kinetic 3 cluster). Temporal pattern expression of representative genes of kinetic 1 (c), kinetic 2 (d) and kinetic 3 (e) clusters. Values were mean ± SEM and were analyzed with 2-way ANOVA followed by Tukey’s post-hoc tests. #: p < 0.05, ##: p < 0.01, ###: p < 0.001 for comparison with previous period. Correlations between gene expression in cluster 1 (f), 2 (g) and 3 (h) were analyzed with Pearson tests. The shade of green corresponds to the strength of the correlation between the variables with a light green for a weak correlation and a dark green for a strong correlation. CTL: control diet group and FEN: fenugreek-supplemented diet group throughout the lactation period. L12 and L18: post-natal day of lactation 12 and 18, InV1: first day of involution
Genes 11 01208 g002
Figure 3. Effect of fenugreek on the concentration of insulin (a.1,a.2), prolactin (b), IGF-1 (c), leptin (d) and estrogens (e) in maternal plasma along the lactation period. Figure 3a.2 represents insulin concentration centered and reduced by period. Values are mean ± SEM with n = 4–6 at L12 and L18 and n = 11 at Inv1. Data were analyzed with 2-way ANOVA followed by Sidak’s post-hoc test for diet effect and Tukey’s post-hoc test for period effect: p < 0.1 and *: p < 0.05 for diet comparison; #: p < 0.05, and ###: p < 0.001 for comparison between a given period and the immediately preceding period. CTL: control diet group and FEN: fenugreek-supplemented diet group throughout the lactation period. L12 and L18: post-natal day of lactation 12 and 18, InV1: first day of involution.
Genes 11 01208 g003
Figure 4. Fenugreek supplementation impacts mammary gland gene expression in CTL and FEN groups, regardless of lactation stage. PLS-DA score plot (on the first two components) built on all normalized variables (that have been mean-centered and scaled by lactation time point), revealed an effect of fenugreek supplementation on mammary gland gene expression during the entire period of lactation (b), at L12 (e) and Invl (h). PLS-DA loading plot presented clusters of variables highly associated to FEN and CTL groups’ overall lactation (a), at L12 (d) and Invl (g) with high regression coefficient (i.e., high prediction vector) for FEN class overall lactation (c) or high VIP scores on the two first PLS-DA components, at L12 (f) and Inv1 (i). CTL: control diet group and FEN: fenugreek-supplemented diet group throughout the lactation period. L12 and L18: post-natal day of lactation 12 and 18, InV1: first day of involution.
Genes 11 01208 g004
Figure 5. Suggested mechanisms of action of fenugreek on milk synthesis and secretion. Green arrows denote positive activation, bold and thin arrows represent main and secondary fenugreek action pathways, respectively. Dotted lines represent hypothetical pathway of action. Dark and light green boxes represent significant or trend increase respectively of gene expression or plasma concentration overall for upper box and at each lactation period for lower boxes. White boxes depict the lack of modulation by fenugreek.
Genes 11 01208 g005
Table 1. Effect of fenugreek supplementation on dams’ lactation performances.
GroupsNDam Water Intake (g/day)Dam Food Intake (g/day)Pup Total Weight Gain (g)Milk Flow (g/day)
CTL1753.93 ± 1.1249.71 ± 0.7936.19 ± 0.7455.90 ± 2.36
FEN1655.22 ± 1.1154.66 ± 1.0038.75 ± 0.8564.45 ± 2.35
p-value0.422<0.0010.0290.016
Values are mean ± SEM (standard error of the mean) and were analyzed with Student’s test. Data were obtained from pooled Xp1 and Xp2 experiments. CTL: control diet group and FEN: fenugreek-supplemented diet group throughout the lactation period. The values in bold correspond to significant p-values (<0.05).
Table 2. Effect of fenugreek supplementation on relative expression of milk constituent synthesis genes in mammary gland along lactation period.
Log2 (Fold Change)
CTL at L12 as Reference
Fold Change
CTL as Reference
2-Way ANOVA
GenesPeriod
CTLFENInterPeriodDiet
Milk lipid synthesis
L12 (n = 6)0.00 ± 0.27 a,10.97 ± 0.11 b,11.95
LplL18 (n = 6)0.52 ± 0.13 10.90 ± 0.43 11.310.034<0.0010.045
Inv1 (n = 11)−2.63 ± 0.16 2−2.83 ± 0.16 20.87
L120.00 ± 0.27 a,11.10 ± 0.13 b,12.14
FasnL180.21 ± 0.17 10.25 ± 0.37 11.030.192<0.0010.049
Inv1−5.10 ± 0.23 2−4.84 ± 0.29 21.19
L120.00 ± 0.32 a,11.08 ± 0.14 b,12.12
AcacaL18−0.18 ± 0.14 10.16 ± 0.41 21.260.078<0.0010.012
Inv1−4.24 ± 0.14 2−4.19 ± 0.18 31.04
L120.00 ± 0.16 10.31 ± 0.08 11.24
AcacbL180.52 ± 0.20 10.43 ± 0.31 10.940.480<0.0010.965
Inv1−2.12 ± 0.18 2−2.37 ± 0.26 20.84
L120.00 ± 0.27 a,11.84 ± 0.23 b,13.59
Fabp3L180.51 ± 0.16 10.67 ± 0.38 21.120.009<0.001<0.001
Inv1−4.37 ± 0.16 2−3.95 ± 0.26 31.34
L120.00 ± 0.24 1−0.03 ± 0.17 10.98
Fabp4L18−1.73 ± 0.29 2−1.75 ± 0.48 20.990.959<0.0010.759
Inv1−0.30 ± 0.16 1−0.44 ± 0.16 10.91
L120.00 ± 0.711.19 ± 0.16 1,22.28
Scd1L181.10 ± 0.182.10 ± 0.41 12.000.3990.0130.122
Inv10.04 ± 0.52−0.03 ± 0.56 20.95
L120.00 ± 0.15 10.21 ± 0.03 11.16
Dgat1L181.04 ± 0.17 20.85 ± 0.26 20.880.273<0.0010.564
Inv1−0.50 ± 0.06 3−0.33 ± 0.08 31.12
L120.00 ± 0.36 1,2−0.74 ± 0.20 10.60
Dgat2L18−0.33 ± 0.10 1−0.25 ± 0.42 1-21.050.0680.0050.322
Inv10.65 ± 0.17 20.12 ± 0.23 20.69
L120.00 ± 0.43 10.50 ± 0.08 11.41
Plin2L181.51 ± 0.16 21.43 ± 0.26 20.950.267<0.0010.069
Inv1−0.37 ± 0.13 10.16 ± 0.16 11.44
Milk lactose synthesis
L120.00 ± 0.37 10.49 ± 0.21 11.40
Glut1L18−0.52 ± 0.14 1−0.06 ± 0.29 11.380.310<0.0010.031
Inv1−2.08 ± 0.07 2−2.04 ± 0.08 21.03
L120.00 ± 0.10 10.33 ± 0.06 11.26
Pgm1L18−0.61 ± 0.11 2−0.60 ± 0.18 21.010.032<0.0010.591
Inv1−0.05 ± 0.05 1−0.26 ± 0.08 30.86
L120.00 ± 0.35 a,11.03 ± 0.13 b,12.05
Ugp2L18−0.67 ± 0.24 1−0.48 ± 0.44 21.140.042<0.0010.039
Inv1−2.49 ± 0.11 2−2.56 ± 0.06 30.95
L120.00 ± 0.26 a,11.23 ± 0.13 b,12.35
B4galt1L180.74 ± 0.33 20.88 ± 0.27 11.110.009<0.0010.001
Inv1−3.22 ± 0.06 3−3.06 ± 0.09 21.11
L120.00 ± 0.58 a,11.28 ± 0.12 b,12.42
LalbaL181.65 ± 0.15 21.64 ± 0.30 10.990.166<0.0010.019
Inv1−1.44 ± 0.28 3−0.86 ± 0.25 21.49
Milk protein synthesis
L120.00 ± 0.41 10.83 ± 0.11 11.78
Slc7a5L181.12 ± 0.25 20.74 ± 0.24 10.770.086<0.0010.164
Inv1−1.73 ± 0.16 3−1.31 ± 0.26 21.34
L120.00 ± 0.60 11.18 ± 0.06 b,12.27
Csn2L181.48 ± 0.12 21.36 ± 0.30 10.920.104<0.0010.013
Inv1−2.13 ± 0.22 3−1.37 ± 0.24 21.69
L120.00 ± 0.90 11.47 ± 0.11 12.77
WapL181.58 ± 0.05 11.48 ± 0.28 10.930.329<0.0010.156
Inv1−2.29 ± 0.54 2−1.91 ± 0.42 21.30
Lactocyte water inflow
L120.00 ± 0.45 10.58 ± 0.111.50
Aqp1L181.24 ± 0.10 20.57 ± 0.260.630.006<0.0010.458
Inv1−0.39 ± 0.10 10.05 ± 0.141.36
L120.00 ± 0.38 10.63 ± 0.48 11.55
Aqp3L181.64 ± 0.35 21.82 ± 0.28 11.130.751<0.0010.240
Inv1−0.91 ± 0.30 1−0.75 ± 0.17 21.12
Log2 (fold change) corresponded to −ΔΔCq values calculated with mean of 3 housekeeping genes (Actb, Uxt, Rps9) and with CTL at L12 as a reference group. Fold change correspond to 2−ΔΔCq values and were calculated each day for FEN diet with CTL of the day as a reference. Log2 (fold change) values were mean ± SEM, n = 5–6 at L12 and L18 and 10–11 at Inv1. Log2 (fold change) values were analyzed with 2-way ANOVA (p-values of diet, period and interaction effects reported in the last columns) followed by Sidak’s post-hoc test for diet effect and Tukey’s post-hoc test for period effect. Different letters and numbers represent significant difference (p < 0.05) between diets for each period and between periods for each diet, respectively. Green boxes represent significant overexpression in FEN group compared to CTL group at a given day. CTL: control diet group and FEN: fenugreek-supplemented diet group throughout the lactation period. L12 and L18: post-natal day of lactation 12 and 18, InV1: first day of involution. The values in bold correspond to significant p-values (<0.05).
Table 3. Effect of fenugreek supplementation on relative expression of genes involved in energy metabolism and antioxidant activity in mammary gland along lactation period.
Log2 (Fold Change)
CTL at L12 as Reference
Fold Change)
CTL as Reference
2-Way ANOVA
GenesPeriod
CTLFENInterPeriodDiet
Lipid β-oxidation
L12 (n = 6)0.00 ± 0.75 a,11.94 ± 0.64 b,13.84
Cpt1aL18 (n = 6)−0.26 ± 0.53 10.29 ± 0.46 21.460.021<0.0010.007
Inv1 (n = 11)3.28 ± 0.05 23.22 ± 0.08 30.96
L120.00 ± 0.52 a,11.47 ± 0.40 b,12.77
AcadsL180.19 ± 0.08 10.39 ± 0.13 21.150.007<0.0010.002
Inv11.28 ± 0.06 21.41 ± 0.07 11.09
Krebs cycle initiation
L120.00 ± 0.53 10.53 ± 0.23 11.45
Pdha1L180.32 ± 0.08 10.59 ± 0.22 11.210.465<0.0010.071
Inv1−1.46 ± 0.05 2−1.39 ± 0.06 21.05
L120.00 ± 0.40 10.70 ± 0.25 11.62
CsL180.10 ± 0.07 10.32 ± 0.20 11.160.246<0.0010.013
Inv1−1.20 ± 0.04 2−1.03 ± 0.07 21.12
Oxidative phosphorylation
L120.00 ± 0.53 10.74 ± 0.25 11.68
Mtco1L180.52 ± 0.17 10.35 ± 0.18 10.890.148<0.0010.099
Inv1−0.90 ± 0.07 2−0.61 ± 0.12 21.22
L120.00 ± 0.500.55 ± 0.23 11.47
Atp5f1aL18−0.24 ± 0.150.07 ± 0.18 11.240.251<0.0010.073
Inv1−0.61 ± 0.03−0.64 ± 0.07 20.98
Antioxidant enzymes
L120.00 ± 0.12 1−0.24 ± 0.080.85
Sod1L18−0.55 ± 0.14 2−0.48 ± 0.181.050.2850.0120.142
Inv1−0.22 ± 0.08 1,2−0.48 ± 0.080.83
L120.00 ± 0.18−0.18 ± 0.100.88
CatL18−0.85 ± 0.13−0.85 ± 0.211.000.4580.0210.726
Inv1−0.51 ± 0.28−0.11 ± 0.231.32
L120.00 ± 0.180.20 ± 0.13 11.14
Gpx1L180.14 ± 0.130.38 ± 0.23 11.180.310<0.0010.680
Inv1−0.47 ± 0.17−0.71 ± 0.17 20.85
Log2 (fold change) corresponded to −ΔΔCq values calculated with mean of 3 housekeeping genes (Actb, Uxt, Rps9) and with CTL at L12 as a reference group. Fold change correspond to 2−ΔΔCq values and are calculated each day for FEN diet with CTL of the day as a reference. Log2 (fold change) values are mean ± SEM, n = 5–6 at L12 and L18 and 10–11 at Inv1. Log2 (fold change) values were analyzed with 2-way ANOVA (p-values of diet, period and interaction effects reported in the last columns) followed by Sidak’s post-hoc test for diet effect and Tukey’s post-hoc test for period effect. Different letters and numbers represent significant difference (p < 0.05) between diets for each period and between periods for each diet, respectively. Green boxes represent significant overexpression in FEN group compared to CTL group at a given day. CTL: control diet group and FEN: fenugreek-supplemented diet group throughout the lactation period. L12 and L18: post-natal day of lactation 12 and 18, InV1: first day of involution. The values in bold correspond to significant p-values (<0.05).
Table 4. Effect of fenugreek on relative expression of genes related to milk synthesis regulatory factors in the mammary gland along lactation period.
Log2 (Fold Change)
CTL at L12 as Reference
Fold Change
CTL as Reference
2-Way ANOVA
GenesPeriod
CTLFENInterPeriodDiet
Lipid metabolism regulatory factors
L12 (n = 6)0.00 ± 0.37 10.40 ± 0.52 11.32
Srebf1L18 (n = 6)−2.11 ± 0.29 2−1.76 ± 0.62 21.270.605<0.0010.543
Inv1 (n = 11)−3.03 ± 0.18 2−3.24 ± 0.21 30.87
L120.00 ± 0.46 10.77 ± 0.24 11.71
PpargL18−0.07 ± 0.28 1−0.12 ± 0.39 20.970.097<0.0010.432
Inv1−0.93 ±0.10 2−1.19 ± 0.10 30.84
L120.00 ± 0.49 10.55 ± 0.38 11.46
Spot14L18−0.03 ± 0.40 10.23 ± 0.39 11.190.698<0.0010.324
Inv1−1.28 ± 24 2−1.28 ± 0.18 21.00
L120.00 ± 0.61 a,11.24 ± 0.37 b2.38
LxraL180.52 ± 0.17 1-20.44 ± 0.270.950.0240.0530.086
Inv11.08 ± 0.07 21.00 ± 0.130.95
Protein synthesis regulatory factors
L120.00 ± 0.48 10.59 ± 0.24 11.51
Akt1L18−0.02 ± 0.08 1−0.10 ± 0.18 20.940.209<0.0010.128
Inv1−0.81 ± 0.05 2−0.65 ± 0.05 21.05
L120.00 ± 0.56 a0.88 ± 0.23 b,11.84
MtorL180.34 ± 0.13 0.09 ± 0.27 20.840.0400.1890.223
Inv10.06 ± 0.05 0.06 ± 0.04 21.00
L120.00 ± 0.510.78 ± 0.34 11.71
Stat5L180.17 ± 0.130.09 ± 0.26 1,20.940.1640.0040.212
Inv1−0.36 ± 0.08−0.35 ± 0.13 21.01
Log2 (fold change) corresponded to −ΔΔCq values calculated with mean of 3 housekeeping genes (Actb, Uxt, Rps9) and with CTL at L12 as a reference group. Fold change correspond to 2−ΔΔCq values and are calculated each day for FEN diet with CTL of the day as a reference. Log2 (fold change) values are mean ± SEM, n = 5–6 at L12 and L18 and 10–11 at Inv1. Log2 (fold change) values were analyzed with 2-way ANOVA (p-values of diet, period and interaction effects reported in the last columns) followed by Sidak’s post-hoc test for diet effect and Tukey’s post-hoc test for period effect. Different letters and numbers represent significant difference (p < 0.05) between diets for each period and between periods for each diet, respectively. Green boxes represent significant overexpression in FEN group at a given day. CTL: control diet group and FEN: fenugreek-supplemented diet group throughout the lactation period. L12 and L18: post-natal day of lactation 12 and 18, InV1: first day of involution. The values in bold correspond to significant p-values (<0.05).
Table 5. Effect of fenugreek on relative expression of genes of lactogenic hormone receptors in mammary gland along lactation period.
Log2 (Fold Change)
CTL at L12 as Reference
Fold Change
CTL as Reference
2-Way ANOVA
GenesPeriod
CTLFENInterPeriodDiet
Lactogenic hormone receptors
L12 (n = 6)0.00 ± 0.49 10.40 ± 0.26 11.32
PrlrL18 (n = 6)−0.32 ± 0.30 1−0.11 ± 0.49 11.150.499<0.0010.642
Inv1 (n = 11)−1.84 ± 0.16 2−2.09 ± 0.22 20.84
L120.00 ± 0.64 10.84 ± 0.32 11.79
InsrL182.29 ± 0.19 22.35 ± 0.18 21.040.283<0.0010.082
Inv1−0.85 ± 0.09 3−0.67 ± 0.11 31.13
L120.00 ± 0.62 10.79 ± 0.69 11.72
OxtrL18−0.52 ± 0.37 1−0.58 ± 0.87 10.960.6490.0250.557
Inv10.75 ± 0.22 10.73 ± 0.26 10.99
L120.00 ± 0.560.89 ± 0.431.86
GhrL18−0.14 ±0.230.34 ± 0.431.400.2860.4050.097
Inv10.07 ±0.180.01 ± 0.180.96
L120.00 ± 0.59 a,11.37 ± 0.52 b,1,22.60
Igf1rL180.89 ± 0.11 10.96 ± 0.38 11.050.057<0.0010.033
Inv11.87 ± 0.19 21.97 ± 0.10 21.07
L120.00 ± 0.54 10.34 ± 0.18 11.27
Esr1L181.57 ± 0.14 21.09 ± 0.32 10.720.204<0.0010.547
Inv1−2.02 ± 0.24 3−1.44 ±0.17 21.49
Log2 (fold change) corresponded to −ΔΔCq values calculated with mean of 3 housekeeping genes (Actb, Uxt, Rps9) and with CTL at L12 as a reference group. Fold change correspond to 2−ΔΔCq values and are calculated each day for FEN diet with CTL of the day as a reference. Log2 (fold change) values are mean ± SEM, n = 5–6 at L12 and L18 and 10–11 at Inv1. Log2 (fold change) values were analyzed with 2-way ANOVA (p-values of diet, period and interaction effects reported in the last columns) followed by Sidak’s post-hoc test for diet effect and Tukey’s post-hoc test for period effect. Different letters and numbers represent significant difference (p < 0.05) between diets for each period and between periods for each diet, respectively. Green boxes represent significant overexpression in FEN group compared to CTL group at a given day. CTL: control diet group and FEN: fenugreek-supplemented diet group throughout the lactation period. L12 and L18: post-natal day of lactation 12 and 18, InV1: first day of involution. The values in bold correspond to significant p-values (<0.05).
Table 6. Effect of fenugreek on relative expression of lactogenic hormone-related genes in pituitary gland along lactation period.
Log2 (Fold Change)
CTL at L12 as Reference
Fold Change
CTL as Reference
2-Way ANOVA
GenesPeriod
CTLFENInterPeriodDiet
Pituitary lactogenic hormones
L12 (n = 5)0.00 ± 0.06 1−0.15 ± 0.20 10.90
PrlL18 (n = 5)−0.14 ± 0.15 1−0.20 ± 0.11 10.950.291<0.0010.652
Inv1 (n = 10)−1.18 ± 0.06 2−0.93 ± 0.14 21.19
L120.00 ± 0.25−0.34 ± 0.05 10.79
Gh1L180.02 ± 0.190.21 ± 0.19 21.140.1430.1100.925
Inv1−0.24 ± 0.09−0.06 ± 0.10 1-21.14
L120.00 ± 0.480.70 ± 0.121.62
OxtL180.16 ± 0.44 a1.08 ± 0.10 b1.880.0500.4690.007
Inv10.42 ± 0.08 0.38 ± 0.12 0.97
Receptors of lactogenic hormone activators
L120.00 ± 0.05 1−0.13 ± 0.06 10.91
Drd2L18−0.39 ± 0.04 2−0.45 ± 0.07 20.960.040<0.0010.984
Inv1−0.46 ± 0.06 a,2−0.27 ± 0.06 b,1,21.14
L120.00 ± 0.16 10.42 ± 0.21 11.34
TrhrL180.78 ± 0.10 20.99 ± 0.10 21.150.551<0.0010.035
Inv10.55 ± 0.13 20.67 ± 0.07 1-21.09
L120.00 ± 0.250.35 ± 0.11 11.27
Vipr2L180.65 ± 0.161.07 ± 0.07 21.340.375<0.0010.061
Inv10.22 ± 0.150.25 ± 0.14 11.02
L120.00 ± 0.16 1−0.65 ± 0.44 10.64
GhrhrL180.46 ± 0.33 11.20 ± 0.21 21.680.069<0.0010.382
Inv1−2.31 ± 0.15 2−1.77 ± 0.27 31.45
L120.00 ± 0.080.11 ± 0.091.08
ArL180.27 ± 0.080.18 ± 0.090.940.4200.1520.565
Inv10.11 ± 0.040.19 ± 0.071.06
L120.00 ± 0.14 10.26 ± 0.35 11.20
Esr1L180.56 ± 0.12 1-20.69 ± 0.09 1-21.090.508<0.0010.823
Inv11.35 ± 0.16 21.10 ± 0.27 20.84
Estrogenic effect biomarker
L120.00 ± 0.29−0.09 ± 0.35 10.94
C3L180.24 ± 0.18 a1.31 ± 0.15 b,22.100.0170.0060.006
Inv10.61 ± 0.261.00 ± 0.13 21.31
Log2 (fold change) corresponded to −ΔΔCq values calculated with mean of 3 housekeeping genes (Actb, Uxt, Rps9) and with CTL at L12 as a reference group. Fold change correspond to 2−ΔΔCq values and are calculated each day for FEN diet with CTL of the day as a reference. Log2 (fold change) values are mean ± SEM, n = 4–5 at L12 and L18 and 9–10 at Inv1 (for ESR1 n = 4 for CTL at L12). Log2 (fold change) values were analyzed with 2-way ANOVA (p-values of diet, period and interaction effects reported in the last columns) followed by Sidak’s post-hoc test for diet effect and Tukey’s post-hoc test for period effect. Different letters and numbers represent significant difference (p < 0.05) between diets for each period and between periods for each diet, respectively. Green boxes represent significant overexpression in FEN group compared to CTL group at a given day. CTL: control diet group and FEN: fenugreek-supplemented diet group throughout the lactation period. L12 and L18: post-natal day of lactation 12 and 18, InV1: first day of involution. The values in bold correspond to significant p-values (<0.05).
Publisher’s Note: MDPI stays neutral with regard to jurisdictional claims in published maps and institutional affiliations.

