Genome-Wide Association Study and Subsequent Exclusion of ATCAY as a Candidate Gene Involved in Equine Neuroaxonal Dystrophy Using Two Animal Models

 , ,
, ,  , and
, and 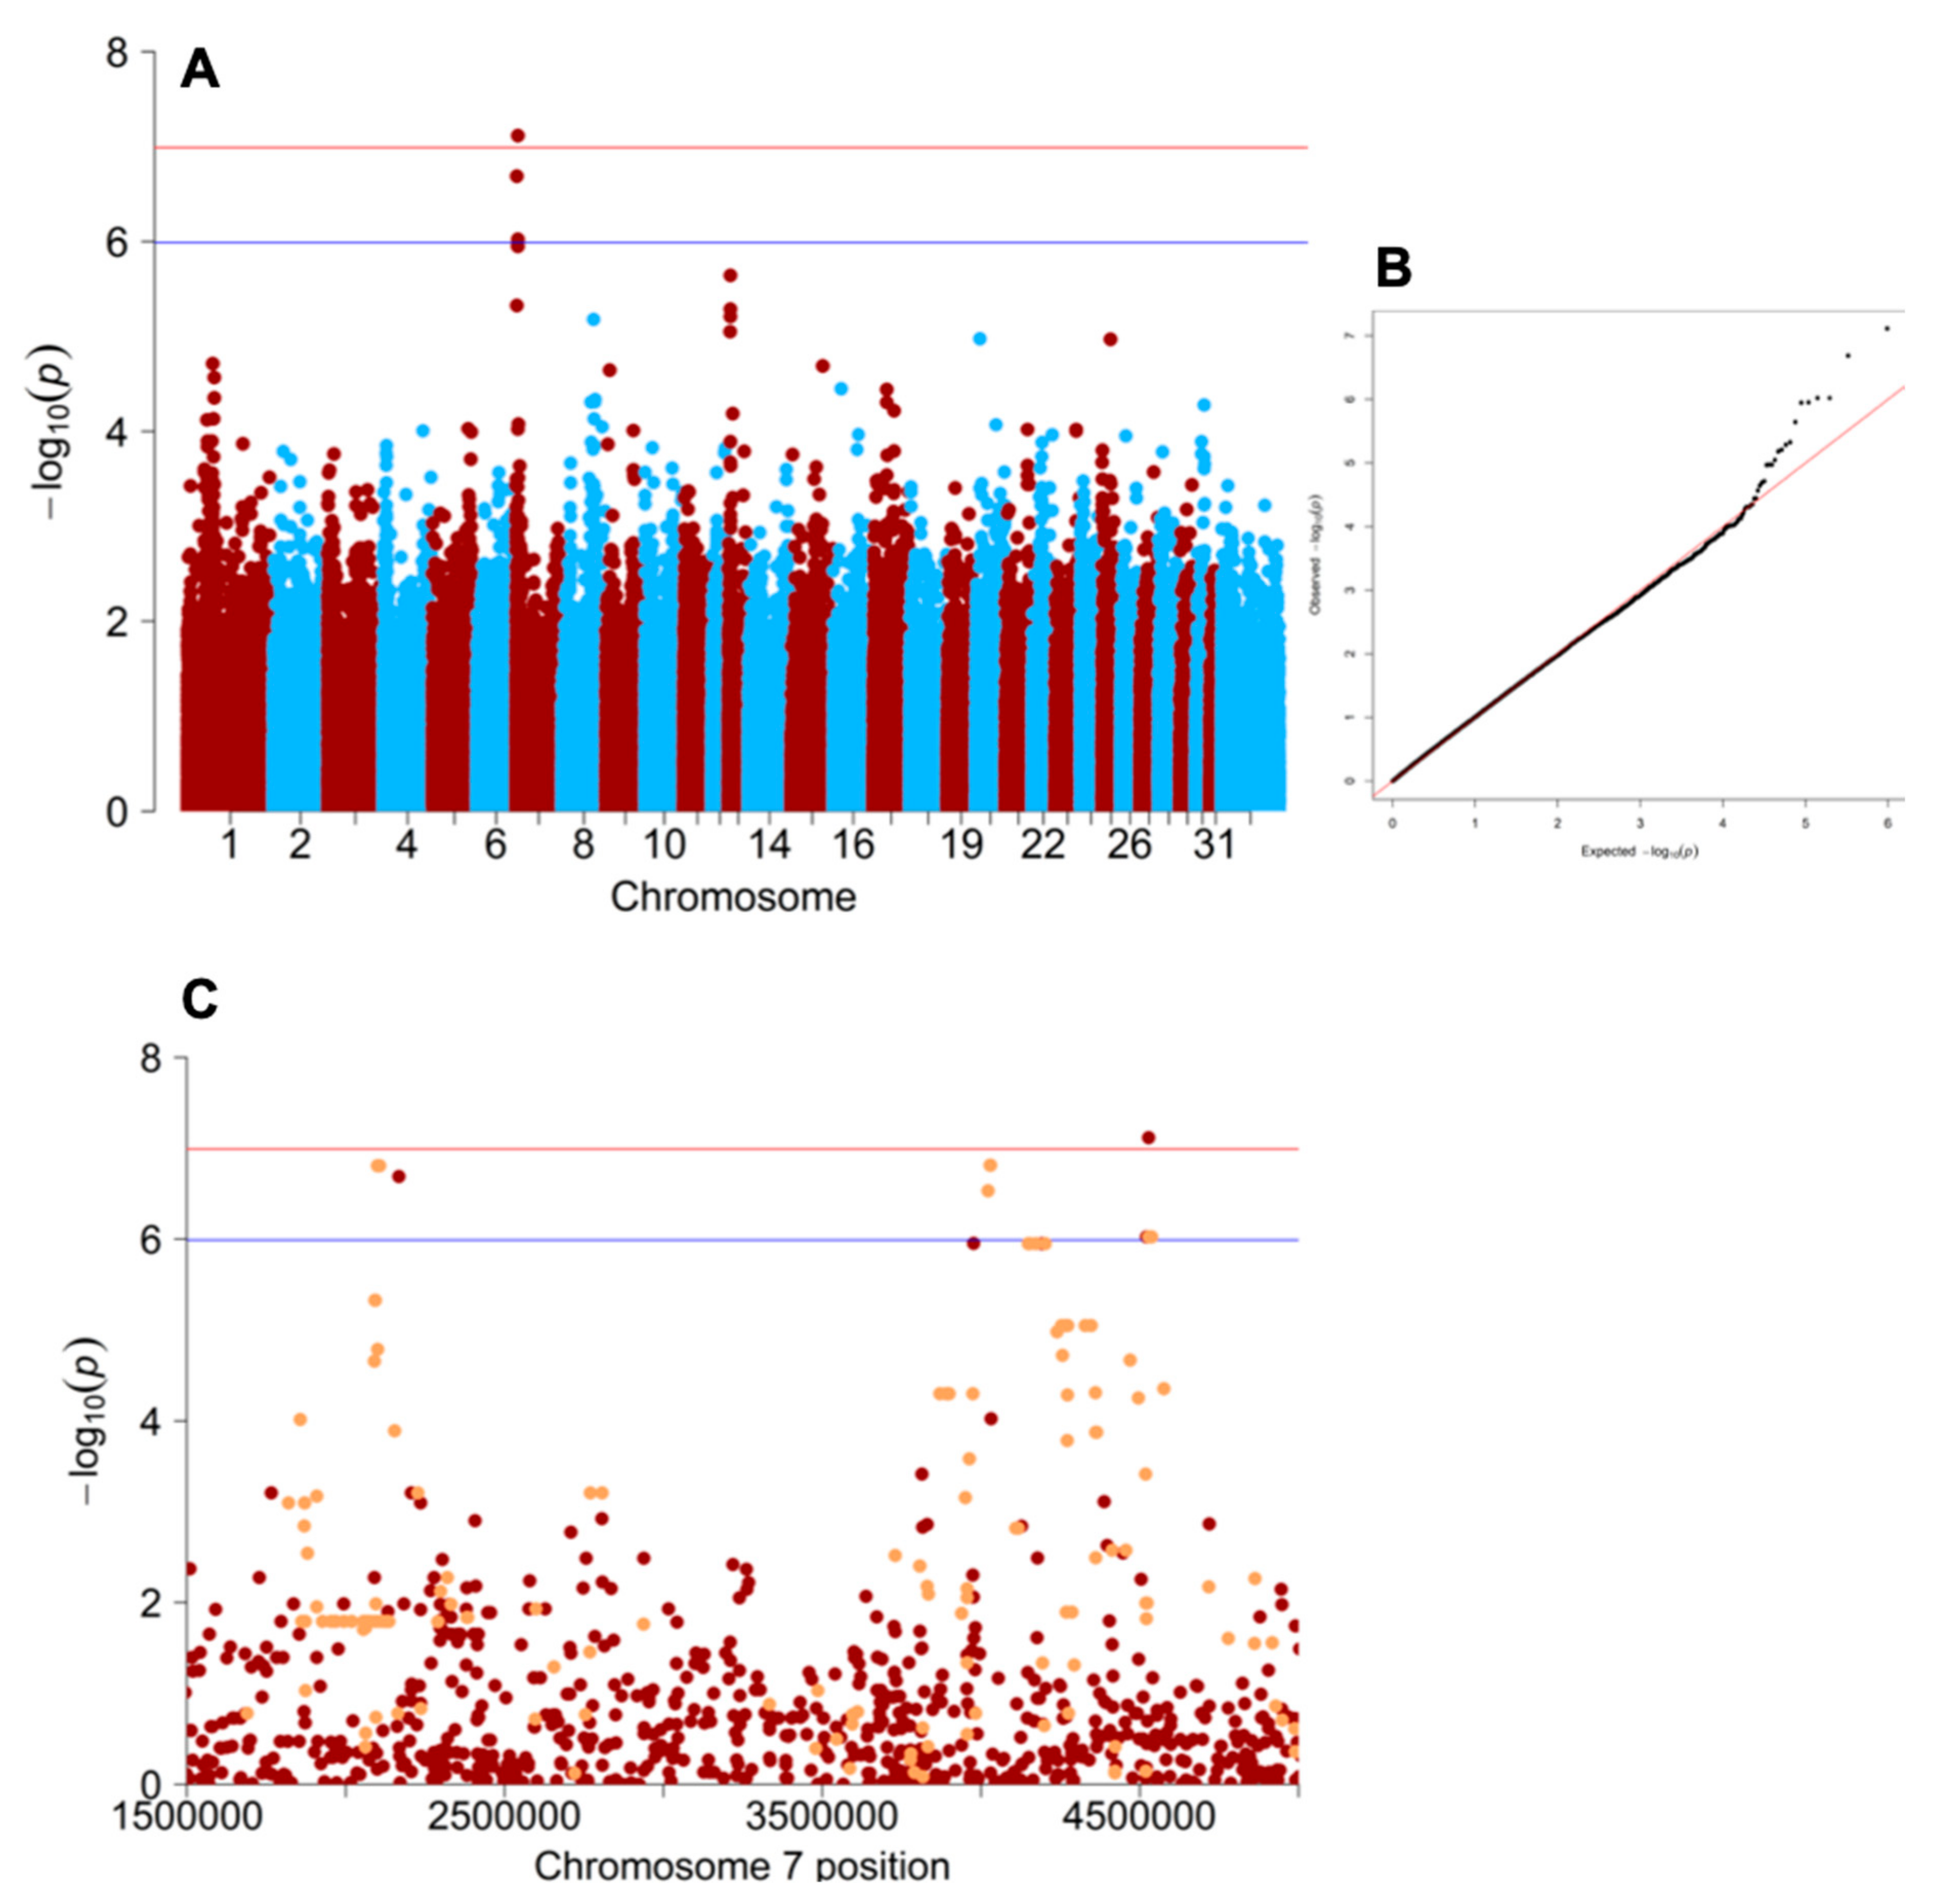
Abstract
1. Introduction
2. Materials and Methods
2.1. Genome Wide Association Study
2.2. Candidate Gene Identification
2.3. Putative Causal Variant Genotyping
2.4. ATCAY Expression Quantification
2.5. Rederived Atcayji-hes Mice
2.6. Atcayji-hes Genotyping
2.7. Atcayji-hes Phenotyping
2.8. Statistical Analysis
2.9. Central Nervous System Histopathology
3. Results
3.1. Genome-Wide Association Study
3.2. Equine ATCAY Genotyping
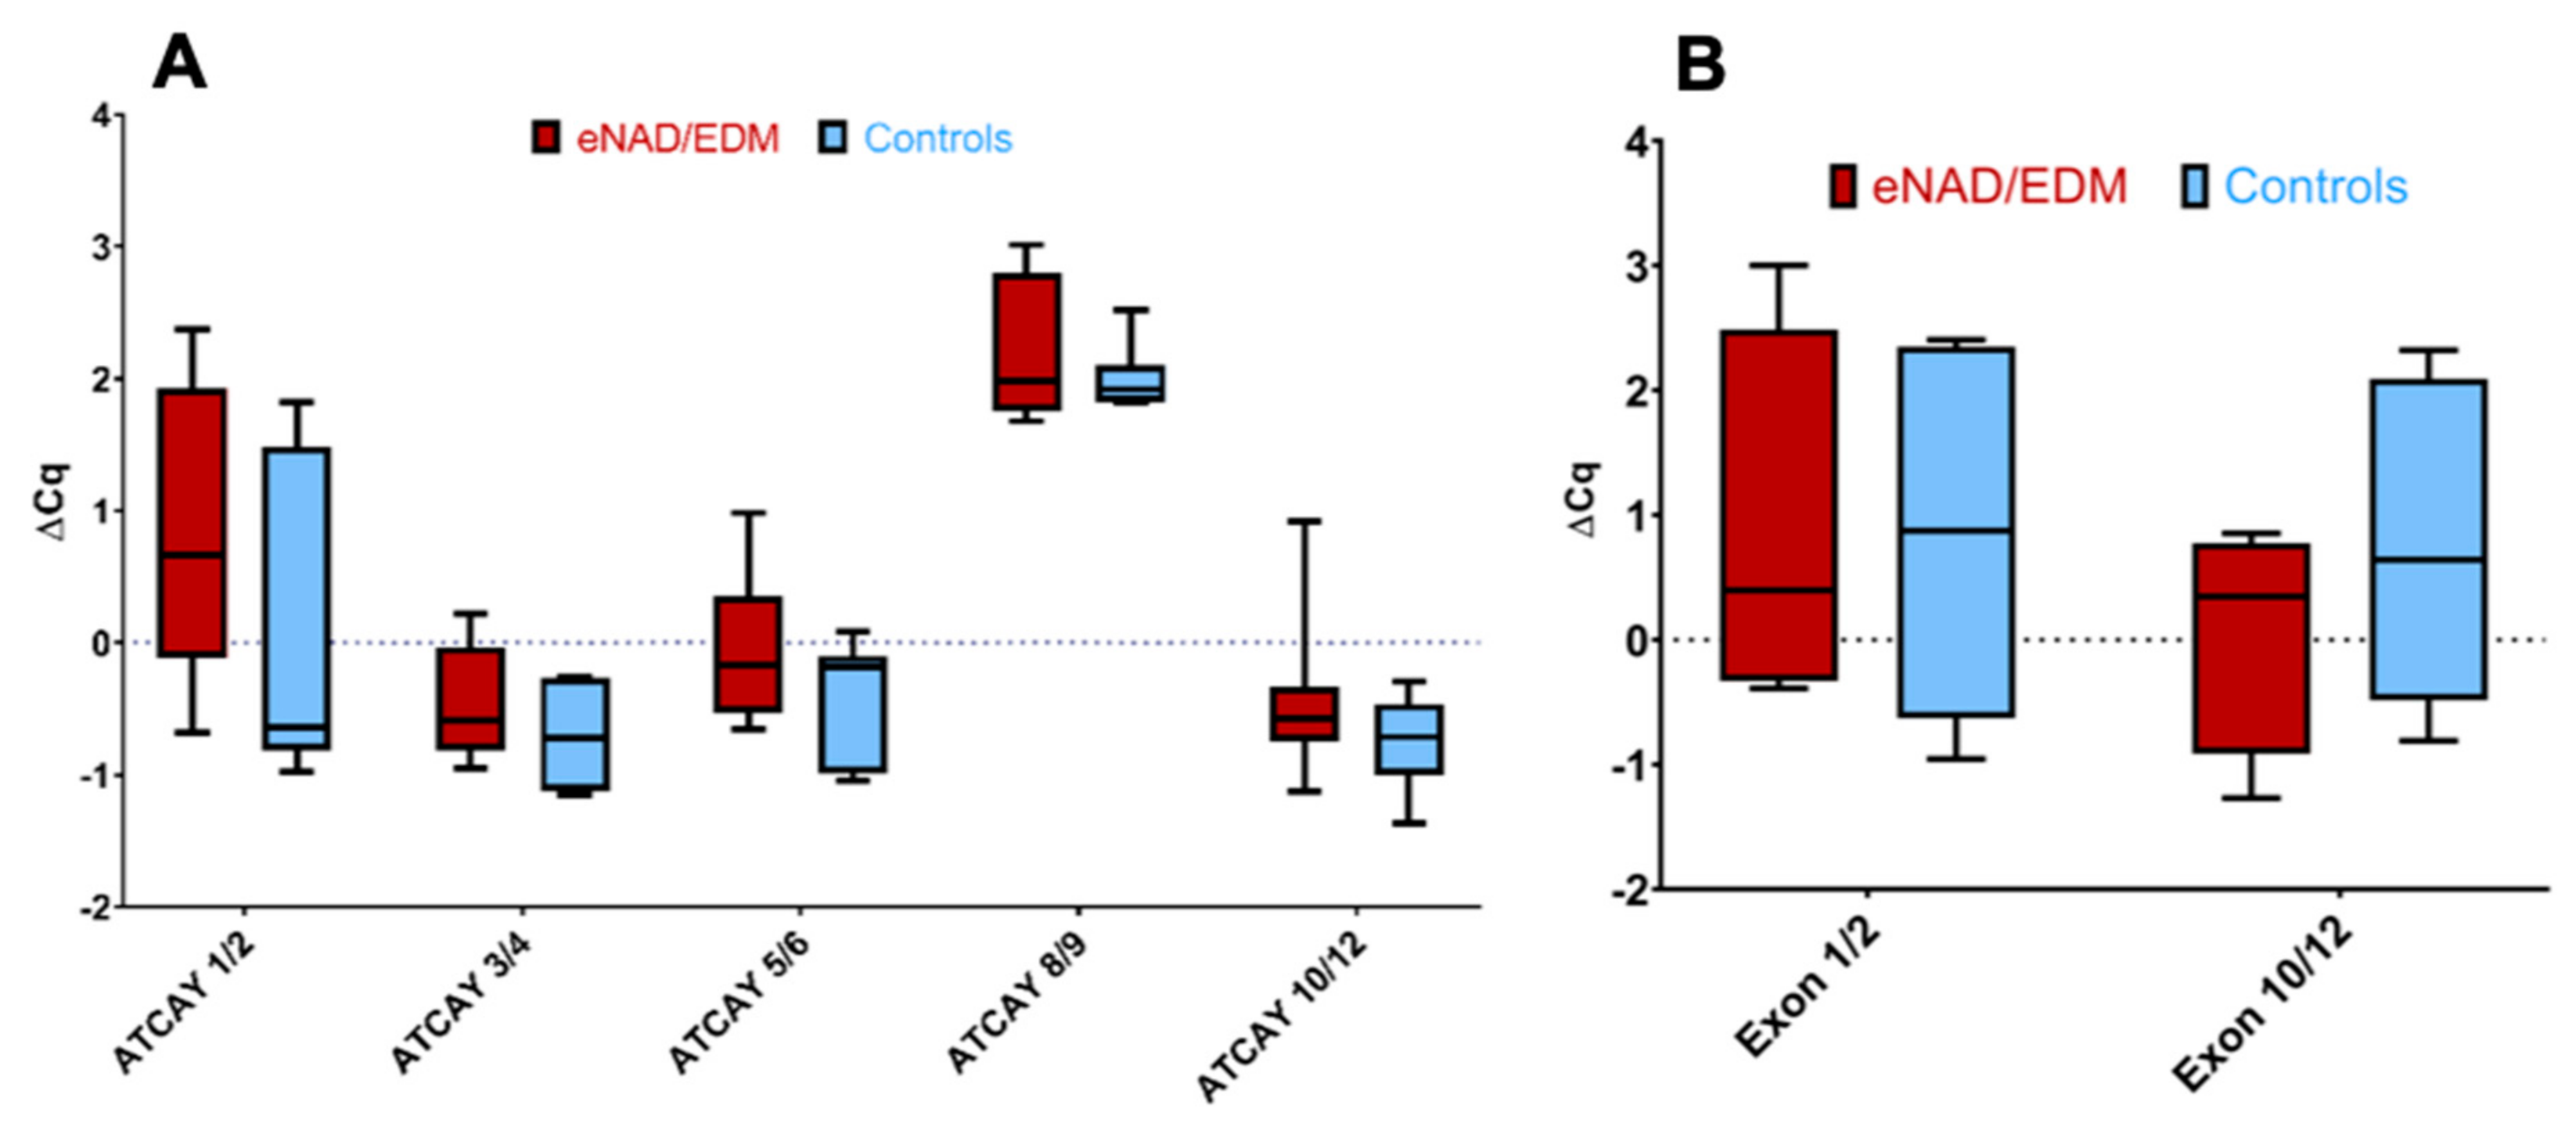
3.3. Equine ATCAY Expression Quantification
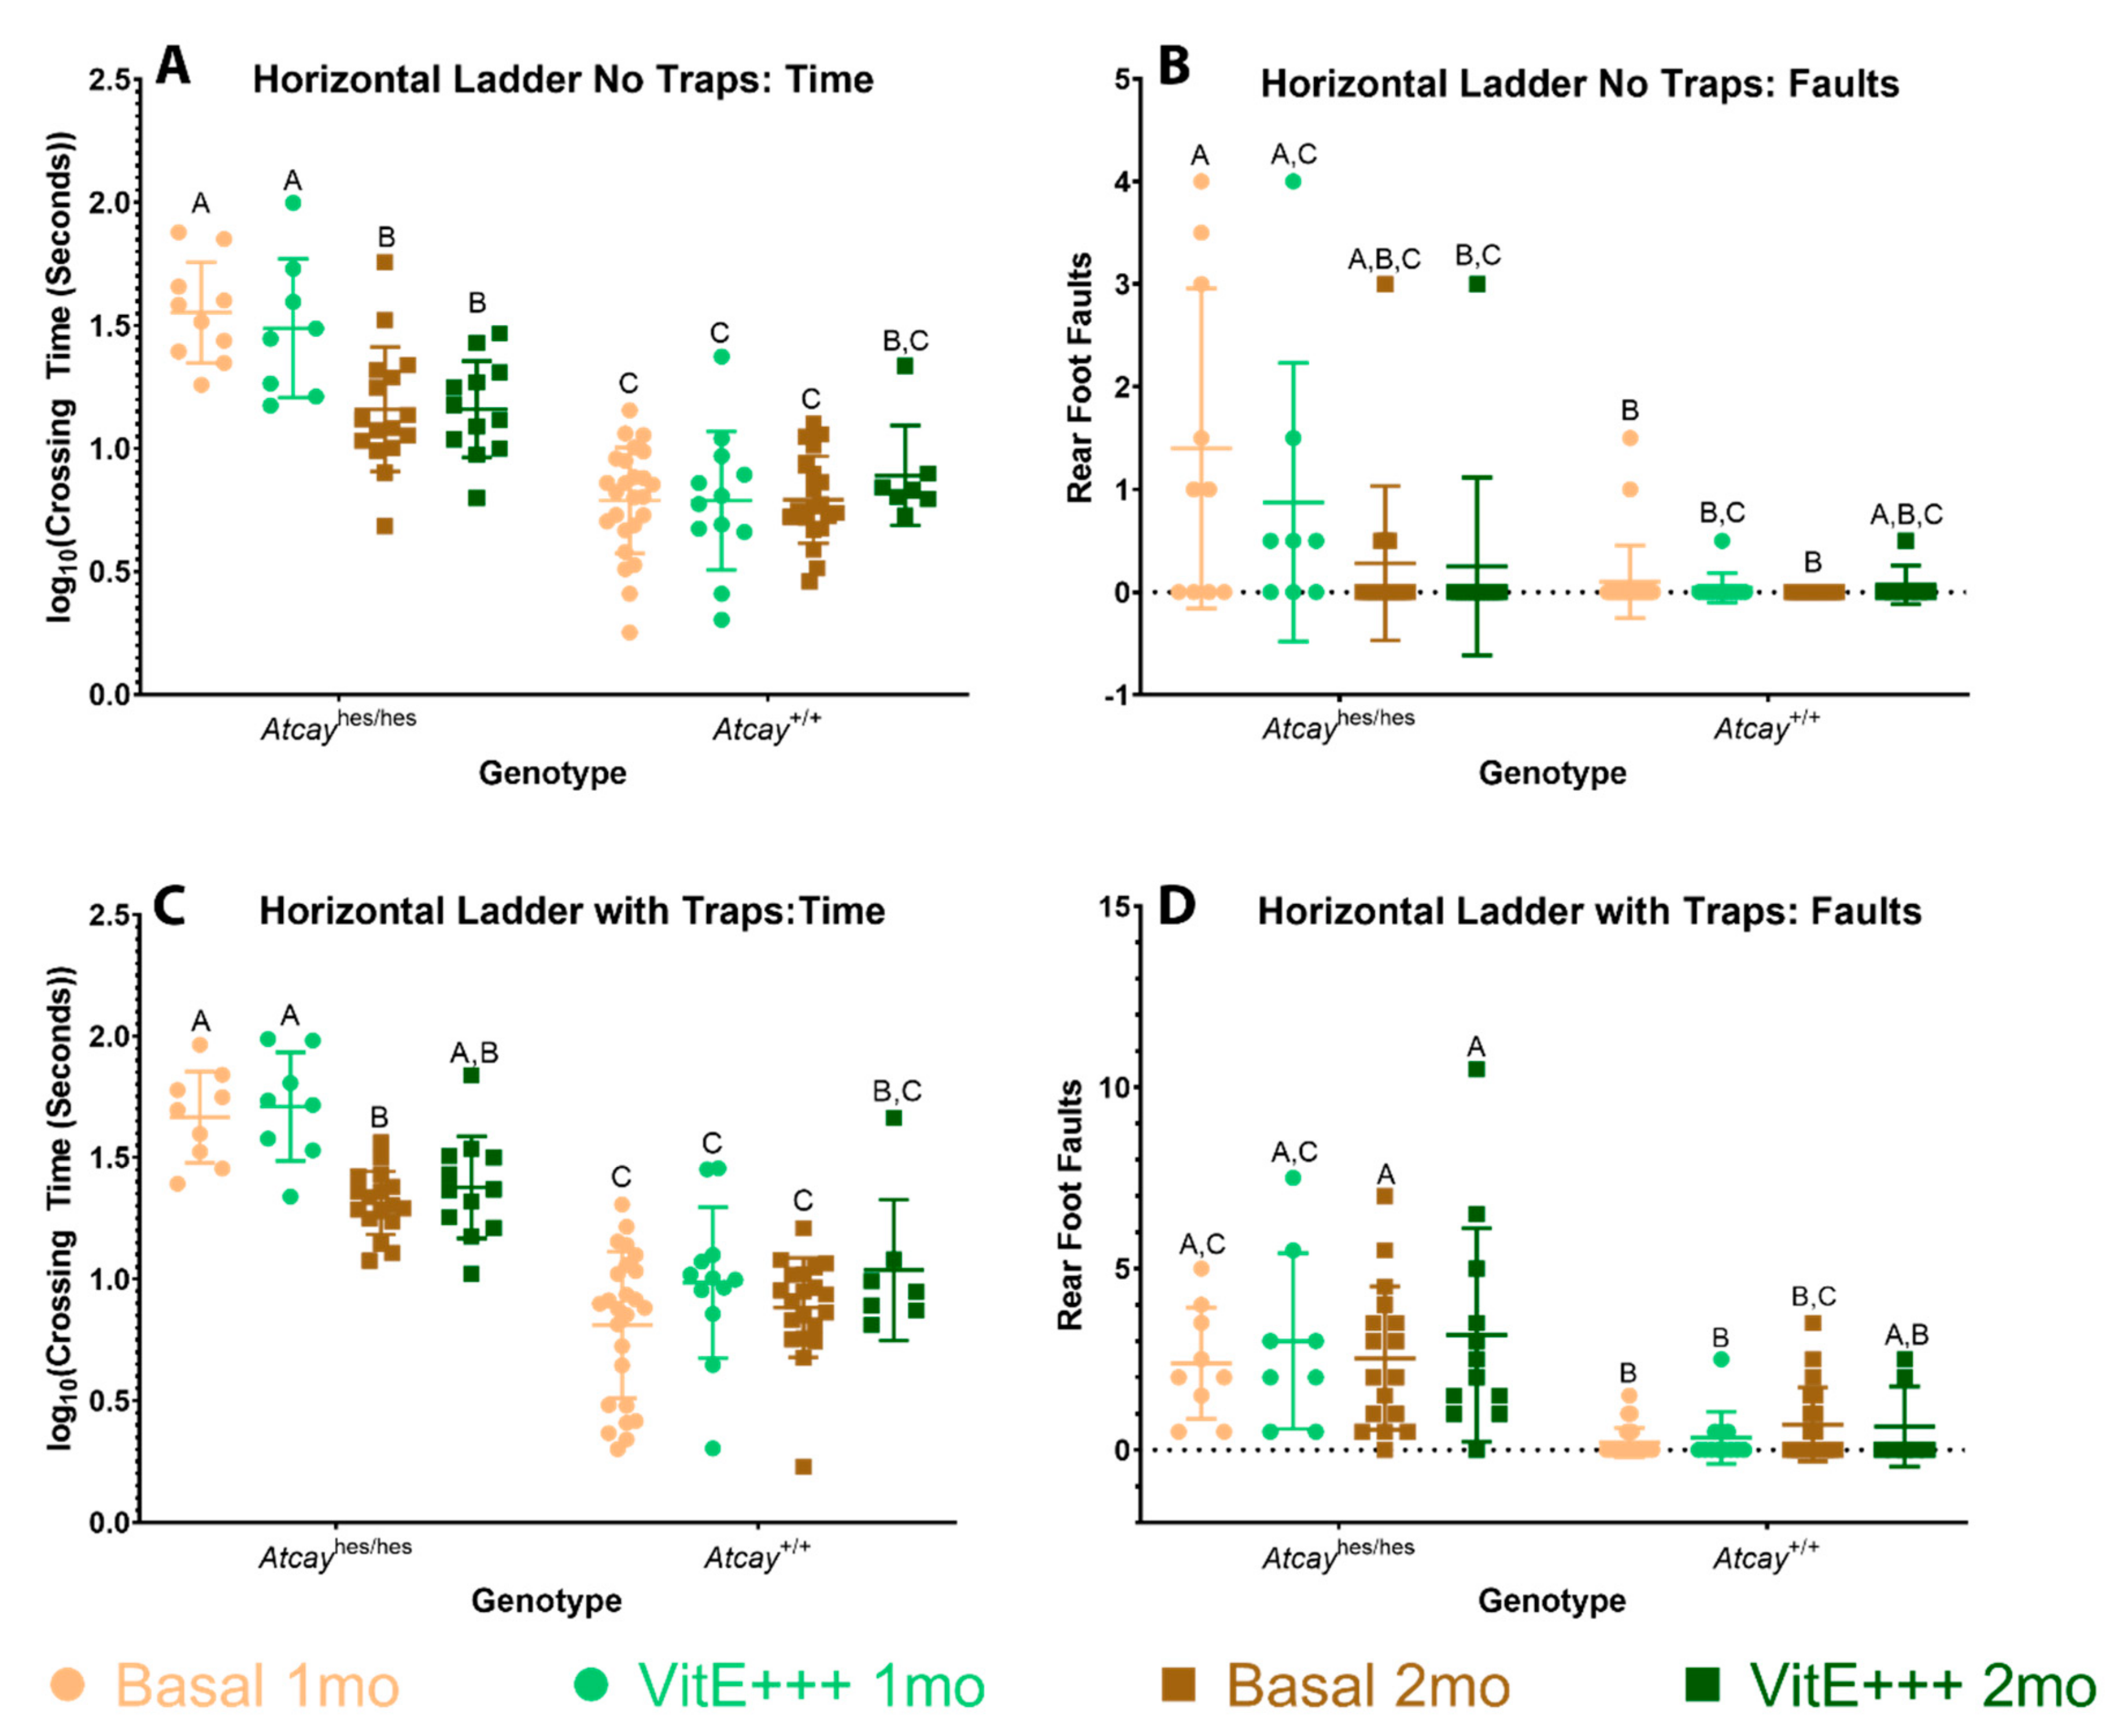
3.4. Phenotype of Atcayji-hes Mice
3.5. Atcayji-hes Histology
4. Discussion
Supplementary Materials
Author Contributions
Funding
Conflicts of Interest
References
- BVSc, I.G.M.; Brown, C.M.; Stowe, H.D.; Trapp, A.L.; Derksen, F.J.; Clement, S.F. Equine degenerative myeloencephalopathy: A vitamin E deficiency that may be familial. J. Vet. Intern. Med. 1987, 1, 45–50. [Google Scholar] [CrossRef] [PubMed]
- Finno, C.J.; Famula, T.; Aleman, M.; Higgins, R.J.; Madigan, J.E.; Bannasch, D.L. Pedigree analysis and exclusion of alpha-tocopherol transfer protein (TTPA) as a candidate gene for neuroaxonal dystrophy in the American quarter horse. J. Vet. Intern. Med. 2013, 27, 177–185. [Google Scholar] [CrossRef] [PubMed]
- Aleman, M.; Finno, C.J.; Higgins, R.J.; Puschner, B.; Gericota, B.; Gohil, K.; LeCouteur, R.A.; Madigan, J.E. Evaluation of epidemiological, clinical, and pathological features of neuroaxonal dystrophy in Quarter Horses. J. Am. Vet. Med. Assoc. 2011, 239, 823–833. [Google Scholar] [CrossRef] [PubMed]
- Finno, C.J.; Higgins, R.J.; Aleman, M.; Ofri, R.; Hollingsworth, S.R.; Bannasch, D.L.; Reilly, C.M.; Madigan, J.E. Equine degenerative myeloencephalopathy in Lusitano horses. J. Vet. Intern. Med. 2011, 25, 1439–1446. [Google Scholar] [CrossRef] [PubMed]
- Mayhew, I.G.; de Lahunta, A.; Whitlock, R.; Geary, J.C. Equine degenerative myeloencephalopathy. J. Am. Vet. Med. Assoc. 1977, 170, 195–201. [Google Scholar]
- Finno, C.J.; Valberg, S.J.; Shivers, J.; D’Almeida, E.; Armién, A.G. Evidence of the primary afferent tracts undergoing neurodegeneration in horses with equine degenerative myeloencephalopathy based on calretinin immunohistochemical localization. Vet. Pathol. 2016, 53, 77–86. [Google Scholar] [CrossRef]
- Burns, E.N.; Finno, C.J. Equine degenerative myeloencephalopathy: Prevalence, impact, and management. Vet. Med. Res. Reports 2018, 9, 63–67. [Google Scholar] [CrossRef]
- Ouahchi, K.; Arita, M.; Kayden, H.; Hentati, F.; Hamida, M.B.; Sokol, R.; Arai, H.; Inoue, K.; Mandel, J.-L.; Koenig, M. Ataxia with isolated vitamin E deficiency is caused by mutations in the α–tocopherol transfer protein. Nat. Genet. 1995, 9, 141–145. [Google Scholar] [CrossRef]
- Finno, C.J.; Aleman, M.; Higgins, R.J.; Madigan, J.E.; Bannasch, D.L. Risk of false positive genetic associations in complex traits with underlying population structure: A case study. Vet. J. 2014, 202, 543–549. [Google Scholar] [CrossRef]
- Schaefer, R.J.; Schubert, M.; Bailey, E.; Bannasch, D.L.; Barrey, E.; Bar-Gal, G.K.; Brem, G.; Brooks, S.A.; Distl, O.; Fries, R.; et al. Developing a 670k genotyping array to tag ~2M SNPs across 24 horse breeds. BMC Genomics 2017, 18, 1–18. [Google Scholar] [CrossRef]
- Zhou, X.; Stephens, M. Genome-wide efficient mixed-model analysis for association studies. Nat. Genet. 2012, 44, 821–824. [Google Scholar] [CrossRef] [PubMed]
- Bomar, J.M.; Benke, P.J.; Slattery, E.L.; Puttagunta, R.; Taylor, L.P.; Seong, E.; Nystuen, A.; Chen, W.; Albin, R.L.; Patel, P.D.; et al. Mutations in a novel gene encoding a CRAL-TRIO domain cause human Cayman ataxia and ataxia/dystonia in the jittery mouse. Nat. Genet. 2003, 35, 264–269. [Google Scholar] [CrossRef] [PubMed]
- Kapfhamer, D.; Sweet, H.O.; Sufalko, D.; Warren, S.; Johnson, K.R.; Burmeister, M. The neurological mouse mutations jittery and hesitant are allelic and map to the region of mouse Chromosome 10 homologous to 19p13.3. Genomics 1996, 35, 533–538. [Google Scholar] [CrossRef] [PubMed]
- Aoyama, T.; Hata, S.; Nakao, T.; Tanigawa, Y.; Oka, C.; Kawaichi, M. Cayman ataxia protein caytaxin is transported by kinesin along neurites through binding to kinesin light chains. J. Cell Sci. 2009, 122, 4177–4185. [Google Scholar] [CrossRef] [PubMed]
- Pan, C.Q.; Low, B.C. Functional plasticity of the BNIP-2 and Cdc42GAP Homology (BCH) domain in cell signaling and cell dynamics. FEBS Lett. 2012, 586, 2674–2691. [Google Scholar] [CrossRef][Green Version]
- Sikora, K.M.; Nosavanh, L.M.; Kantheti, P.; Burmeister, M.; Hortsch, M. Expression of caytaxin protein in cayman ataxia mouse models correlates with phenotype severity. PLoS One 2012, 7, 1–12. [Google Scholar] [CrossRef]
- Luna-Cancalon, K.; Sikora, K.M.; Pappas, S.S.; Singh, V.; Wulff, H.; Paulson, H.L.; Burmeister, M.; Shakkottai, V.G. Alterations in cerebellar physiology are associated with a stiff-legged gait in Atcayji-hes mice. Neurobiol. Dis. 2014, 67, 140–148. [Google Scholar] [CrossRef]
- Lakes, E.H.; Allen, K.D. Gait analysis methods for rodent models of arthritic disorders: Reviews and recommendations. Osteoarthr. Cartil. 2016, 24, 1837–1849. [Google Scholar] [CrossRef]
- Cummings, B.J.; Engesser-cesar, C.; Anderson, A.J. Adaptation of a ladder beam walking task to assess locomotor recovery in mice following spinal cord injury Adaptation of a ladder beam walking task to assess locomotor recovery in mice. Brain 2007, 177, 232–241. [Google Scholar]
- Chang, C.C.; Chow, C.C.; Tellier, L.C.A.M.; Vattikuti, S.; Purcell, S.M.; Lee, J.J. Second-generation PLINK: Rising to the challenge of larger and richer datasets. Gigascience 2015, 4, 1–16. [Google Scholar] [CrossRef]
- Beeson, S.K.; Schaefer, R.J.; Mason, V.C.; McCue, M.E. Robust remapping of equine SNP array coordinates to EquCab3. Anim. Genet. 2018, 50, 114–115. [Google Scholar] [CrossRef] [PubMed]
- Turner, S.D. qqman: An R package for visualizing GWAS results using Q-Q and manhattan plots. Am. J. Hum. Genet. 2014. [Google Scholar] [CrossRef]
- Vuckovic, D.; Gasparini, P.; Soranzo, N.; Iotchkova, V. MultiMeta: An R package for meta-analyzing multi-phenotype genome-wide association studies. Bioinformatics 2015, 31, 2754–2756. [Google Scholar] [CrossRef] [PubMed]
- Mi, H.; Muruganujan, A.; Ebert, D.; Huang, X.; Thomas, P.D. PANTHER version 14: More genomes, a new PANTHER GO-slim and improvements in enrichment analysis tools. Nucleic Acids Res. 2019, 47, D419–D426. [Google Scholar] [CrossRef]
- Manley, G. Animal models of dystonia: Lessons from a mutant Rat. Neurobiol. Dis. 2013, 71, 233–236. [Google Scholar]
- Li, H.; Durbin, R. Fast and accurate long-read alignment with Burrows-Wheeler transform. Bioinformatics 2010, 26, 589–595. [Google Scholar] [CrossRef]
- Marth, G.; Garrison, E. Haplotype-based variant detection from short-read sequencing. arXiv 2012, arXiv:1207.3907. [Google Scholar]
- Cingolani, P.; Patel, V.M.; Coon, M.; Nguyen, T.; Land, S.J.; Ruden, D.M.; Lu, X. Using Drosophila melanogaster as a model for genotoxic chemical mutational studies with a new program, SnpSift. Front. Genet. 2012, 3, 1–9. [Google Scholar] [CrossRef]
- Cingolani, P.; Platts, A.; Wang, L.L.; Coon, M.; Nguyen, T.; Wang, L.; Land, S.J.; Ruden, D.M.; Lu, X. A program for annotating and predicting the effects of single nucleotide polymorphisms, SnpEff. Fly (Austin). 2012, 6, 80–92. [Google Scholar] [CrossRef]
- Untergasser, A.; Nijveen, H.; Rao, X.; Bisseling, T.; Geurts, R.; Leunissen, J.A.M. Primer3Plus, an enhanced web interface to Primer3. Nucleic Acids Res. 2007, 35, 71–74. [Google Scholar] [CrossRef]
- Finno, C.J.; Bordbari, M.H.; Valberg, S.J.; Lee, D.; Herron, J.; Hines, K.; Monsour, T.; Scott, E.; Bannasch, D.L.; Mickelson, J.; et al. Transcriptome profiling of equine vitamin E deficient neuroaxonal dystrophy identifies upregulation of liver X receptor target genes. Free Radic. Biol. Med. 2016, 101, 261–271. [Google Scholar] [CrossRef] [PubMed]
- Finno, C.J.; Bordbari, M.H.; Gianino, G.; Ming-Whitfield, B.; Burns, E.; Merkel, J.; Britton, M.; Durbin-Johnson, B.; Sloma, E.A.; McMackin, M.; et al. An innate immune response and altered nuclear receptor activation defines the spinal cord transcriptome during alpha-tocopherol deficiency in Ttpa-null mice. Free Radic. Biol. Med. 2018, 120, 289–302. [Google Scholar] [CrossRef] [PubMed]
- Hayakawa, Y.; Itoh, M.; Yamada, A.; Mitsuda, T.; Nakagawa, T. Expression and localization of Cayman ataxia-related protein, Caytaxin, is regulated in a developmental- and spatial-dependent manner. Brain Res. 2007. [Google Scholar] [CrossRef] [PubMed]
- Beare, J.E.; Morehouse, J.R.; DeVries, W.H.; Enzmann, G.U.; Burke, D.A.; Magnuson, D.S.K.; Whittemore, S.R. Gait analysis in normal and spinal contused mice using the TreadScan system. J. Neurotrauma 2009, 26, 2045–2056. [Google Scholar] [CrossRef]
- Finno, C.J.; Estell, K.E.; Katzman, S.; Winfield, L.; Rendahl, A.; Textor, J.; Bannasch, D.L.; Puschner, B. Blood and cerebrospinal fluid α-tocopherol and selenium concentrations in neonatal foals with neuroaxonal dystrophy. J. Vet. Intern. Med. 2015, 29, 1667–1675. [Google Scholar] [CrossRef]
- Sun, J.; Pan, C.Q.; Chew, T.W.; Liang, F.; Burmeister, M.; Low, B.C. BNIP-H recruits the cholinergic machinery to neurite terminals to promote acetylcholine signaling and neuritogenesis. Dev. Cell 2015, 34, 555–568. [Google Scholar] [CrossRef]
- Ito-Smith, K.M. Characterization of Caytaxin Protein in Animal Models of cerebellar dysfunction. PhD Thesis, University of Michigan, Ann Arbor, MI, USA, 2012. [Google Scholar]
- Gago, S.; Overton, N.L.D.; Ben-Ghazzi, N.; Novak-Frazer, L.; Read, N.D.; Denning, D.W.; Bowyer, P. Lung colonization by Aspergillus fumigatus is controlled by ZNF77. Nat. Commun. 2018, 9, 3835. [Google Scholar] [CrossRef]
- Pei, Z.; Jia, Z.; Watkins, P.A. The second member of the human and murine “Bubblegum” family is a testis- and brainstem-specific Acyl-CoA synthetase. J. Biol. Chem. 2006, 281, 6632–6641. [Google Scholar] [CrossRef]
- Sisó, S.; Ferrer, I.; Pumarola, M. Abnormal synaptic protein expression in two Arabian horses with equine degenerative myeloencephalopathy. Vet. J. 2003, 166, 238–243. [Google Scholar] [CrossRef]
- Finno, C.J.; Kaese, H.J.; Miller, A.D.; Gianino, G.; Divers, T.; Valberg, S.J. Pigment retinopathy in warmblood horses with equine degenerative myeloencephalopathy and equine motor neuron disease. Vet. Ophthalmol. 2017, 20, 304–309. [Google Scholar] [CrossRef]


© 2020 by the authors. Licensee MDPI, Basel, Switzerland. This article is an open access article distributed under the terms and conditions of the Creative Commons Attribution (CC BY) license (http://creativecommons.org/licenses/by/4.0/).
Share and Cite
Hales, E.N.; Esparza, C.; Peng, S.; Dahlgren, A.R.; Peterson, J.M.; Miller, A.D.; Finno, C.J. Genome-Wide Association Study and Subsequent Exclusion of ATCAY as a Candidate Gene Involved in Equine Neuroaxonal Dystrophy Using Two Animal Models. Genes 2020, 11, 82. https://doi.org/10.3390/genes11010082
Hales EN, Esparza C, Peng S, Dahlgren AR, Peterson JM, Miller AD, Finno CJ. Genome-Wide Association Study and Subsequent Exclusion of ATCAY as a Candidate Gene Involved in Equine Neuroaxonal Dystrophy Using Two Animal Models. Genes. 2020; 11(1):82. https://doi.org/10.3390/genes11010082
Chicago/Turabian StyleHales, Erin N, Christina Esparza, Sichong Peng, Anna R Dahlgren, Janel M Peterson, Andrew D Miller, and Carrie J Finno. 2020. "Genome-Wide Association Study and Subsequent Exclusion of ATCAY as a Candidate Gene Involved in Equine Neuroaxonal Dystrophy Using Two Animal Models" Genes 11, no. 1: 82. https://doi.org/10.3390/genes11010082
APA StyleHales, E. N., Esparza, C., Peng, S., Dahlgren, A. R., Peterson, J. M., Miller, A. D., & Finno, C. J. (2020). Genome-Wide Association Study and Subsequent Exclusion of ATCAY as a Candidate Gene Involved in Equine Neuroaxonal Dystrophy Using Two Animal Models. Genes, 11(1), 82. https://doi.org/10.3390/genes11010082