Genome-Wide Tiling Array Analysis of HPV-Induced Warts Reveals Aberrant Methylation of Protein-Coding and Non-Coding Regions


Abstract
1. Introduction
2. Materials and Methods
2.1. Study Population and DNA Extraction
2.2. Infinium MethylationEPIC BeadChip
2.3. Data Processing
2.4. Differential Methylation and Statistical Analysis
2.5. Locus Overlap Analysis (LOLA) for Enrichment of Genomic Ranges
2.6. Signaling Pathway Analysis
3. Results
3.1. Differential Methylation of Genome-Tiling Regions
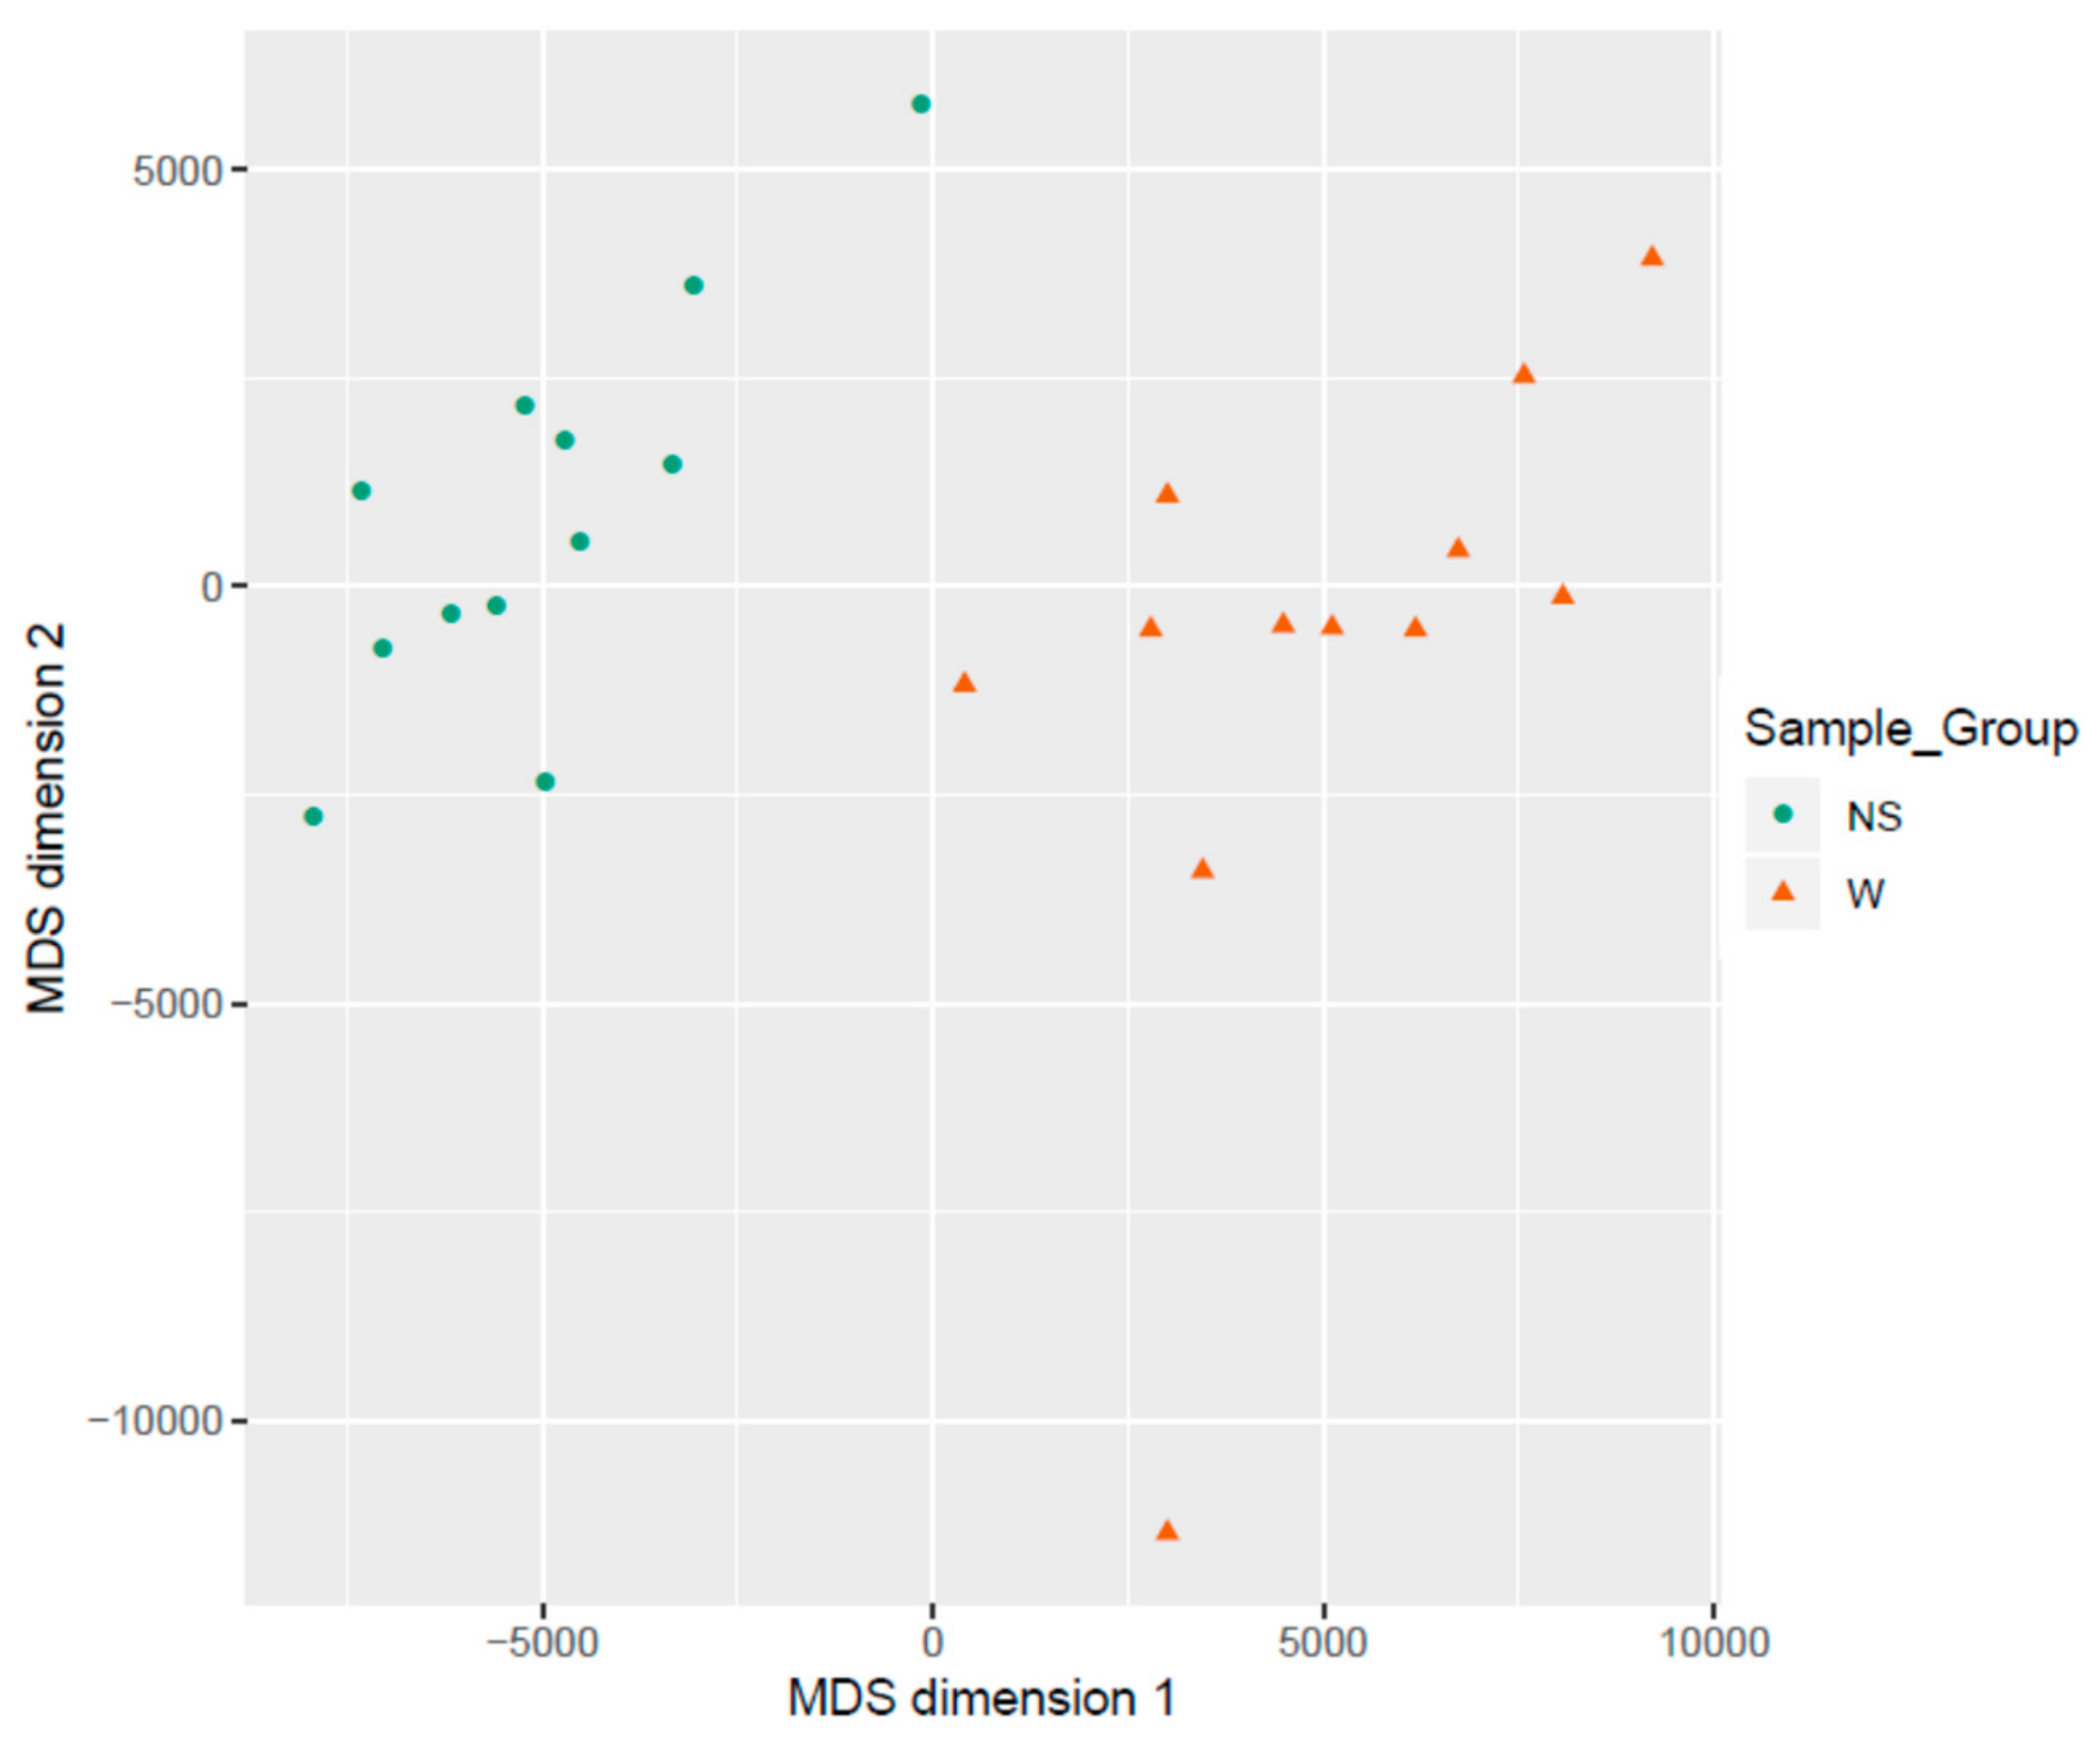
3.2. Clustering of Samples
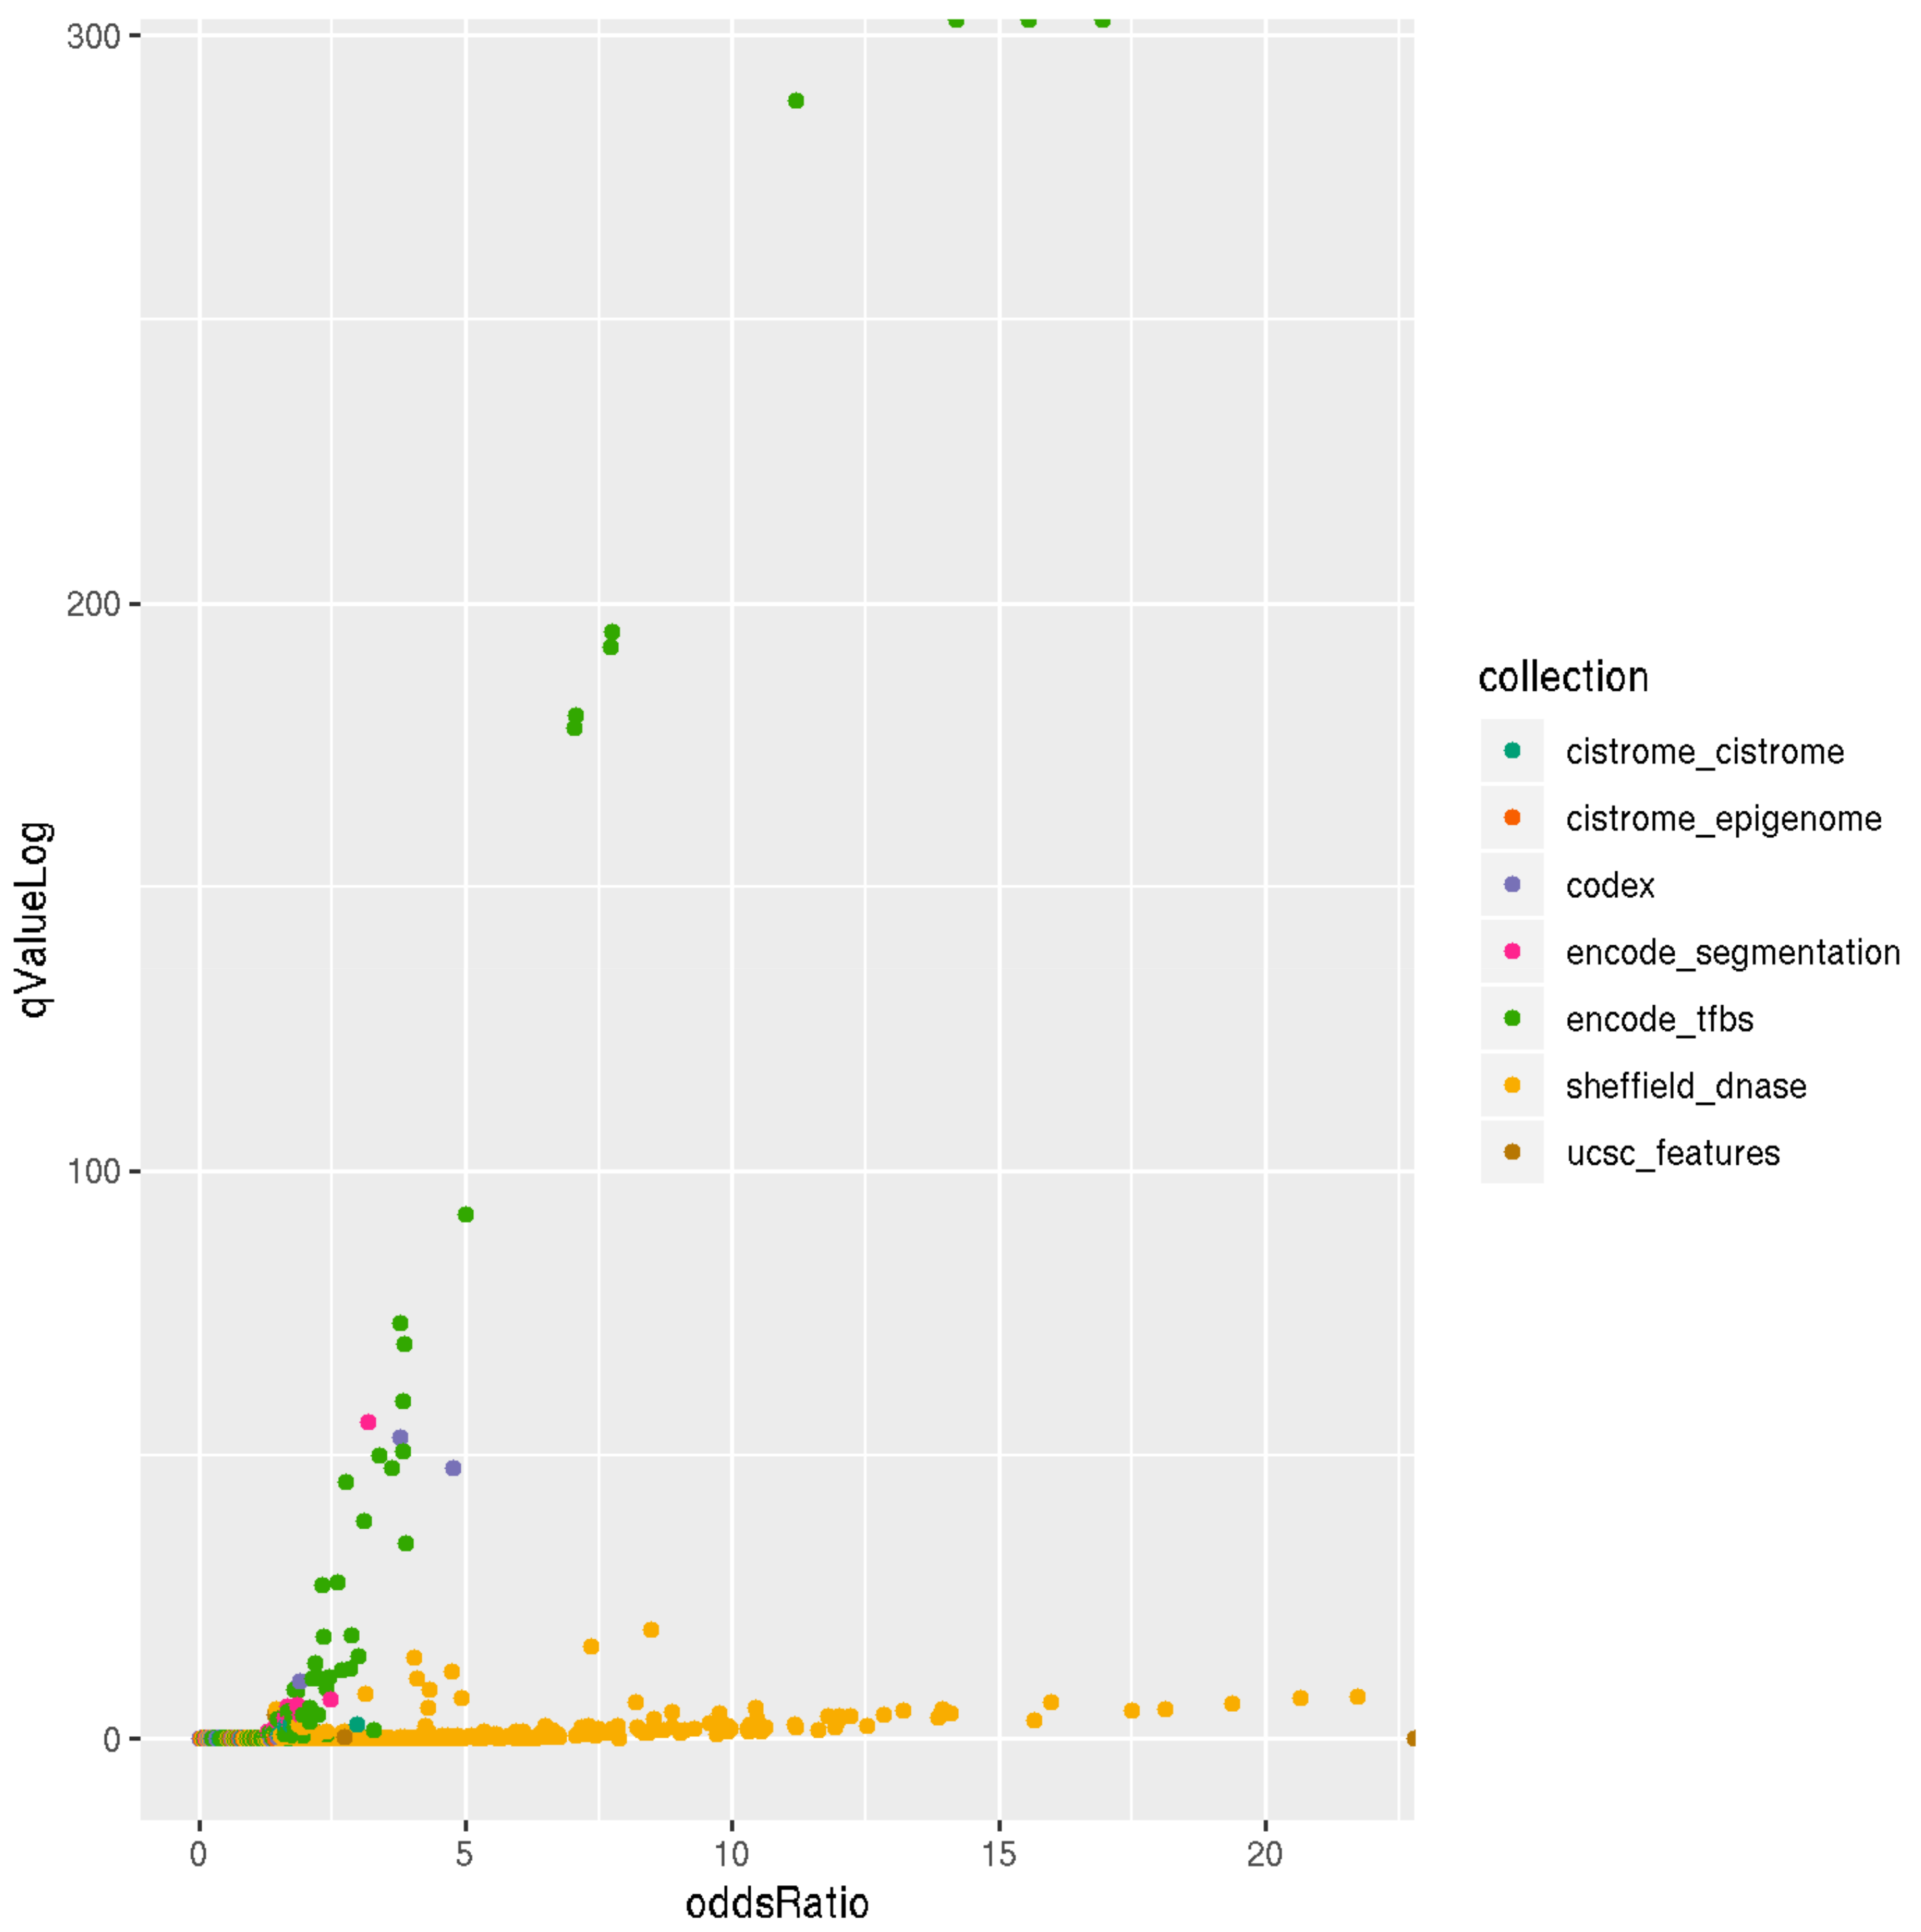
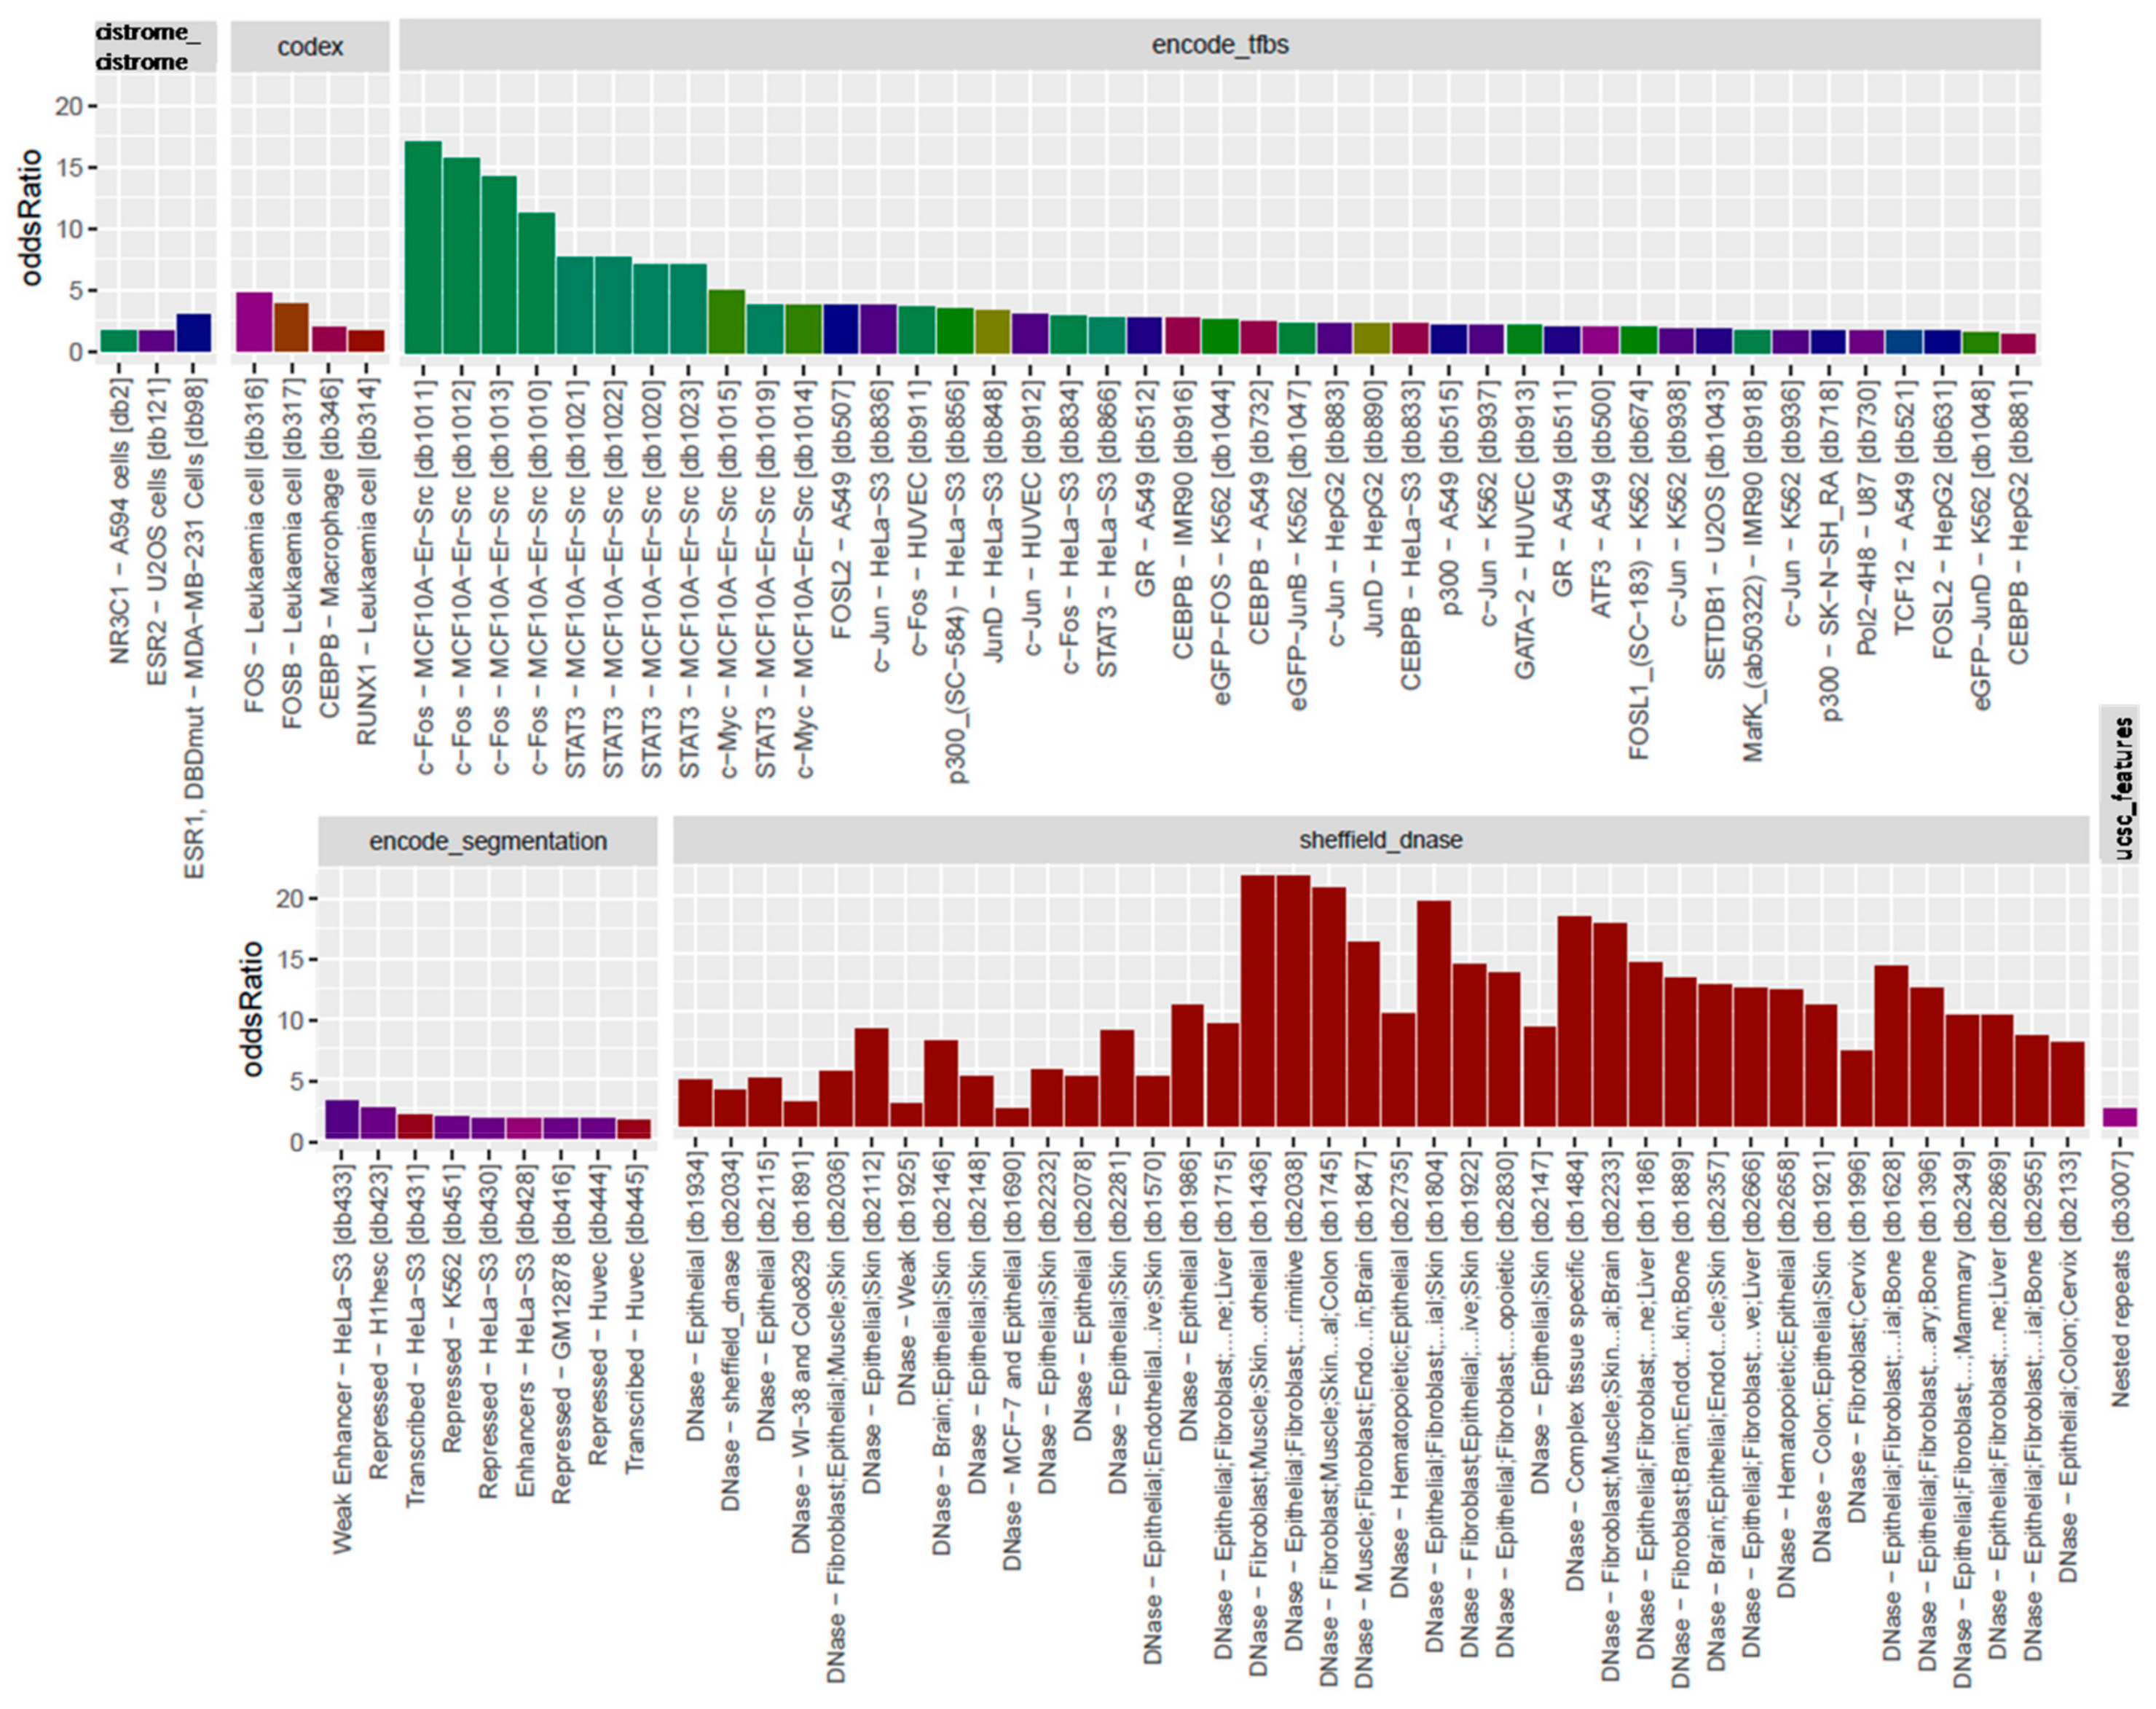
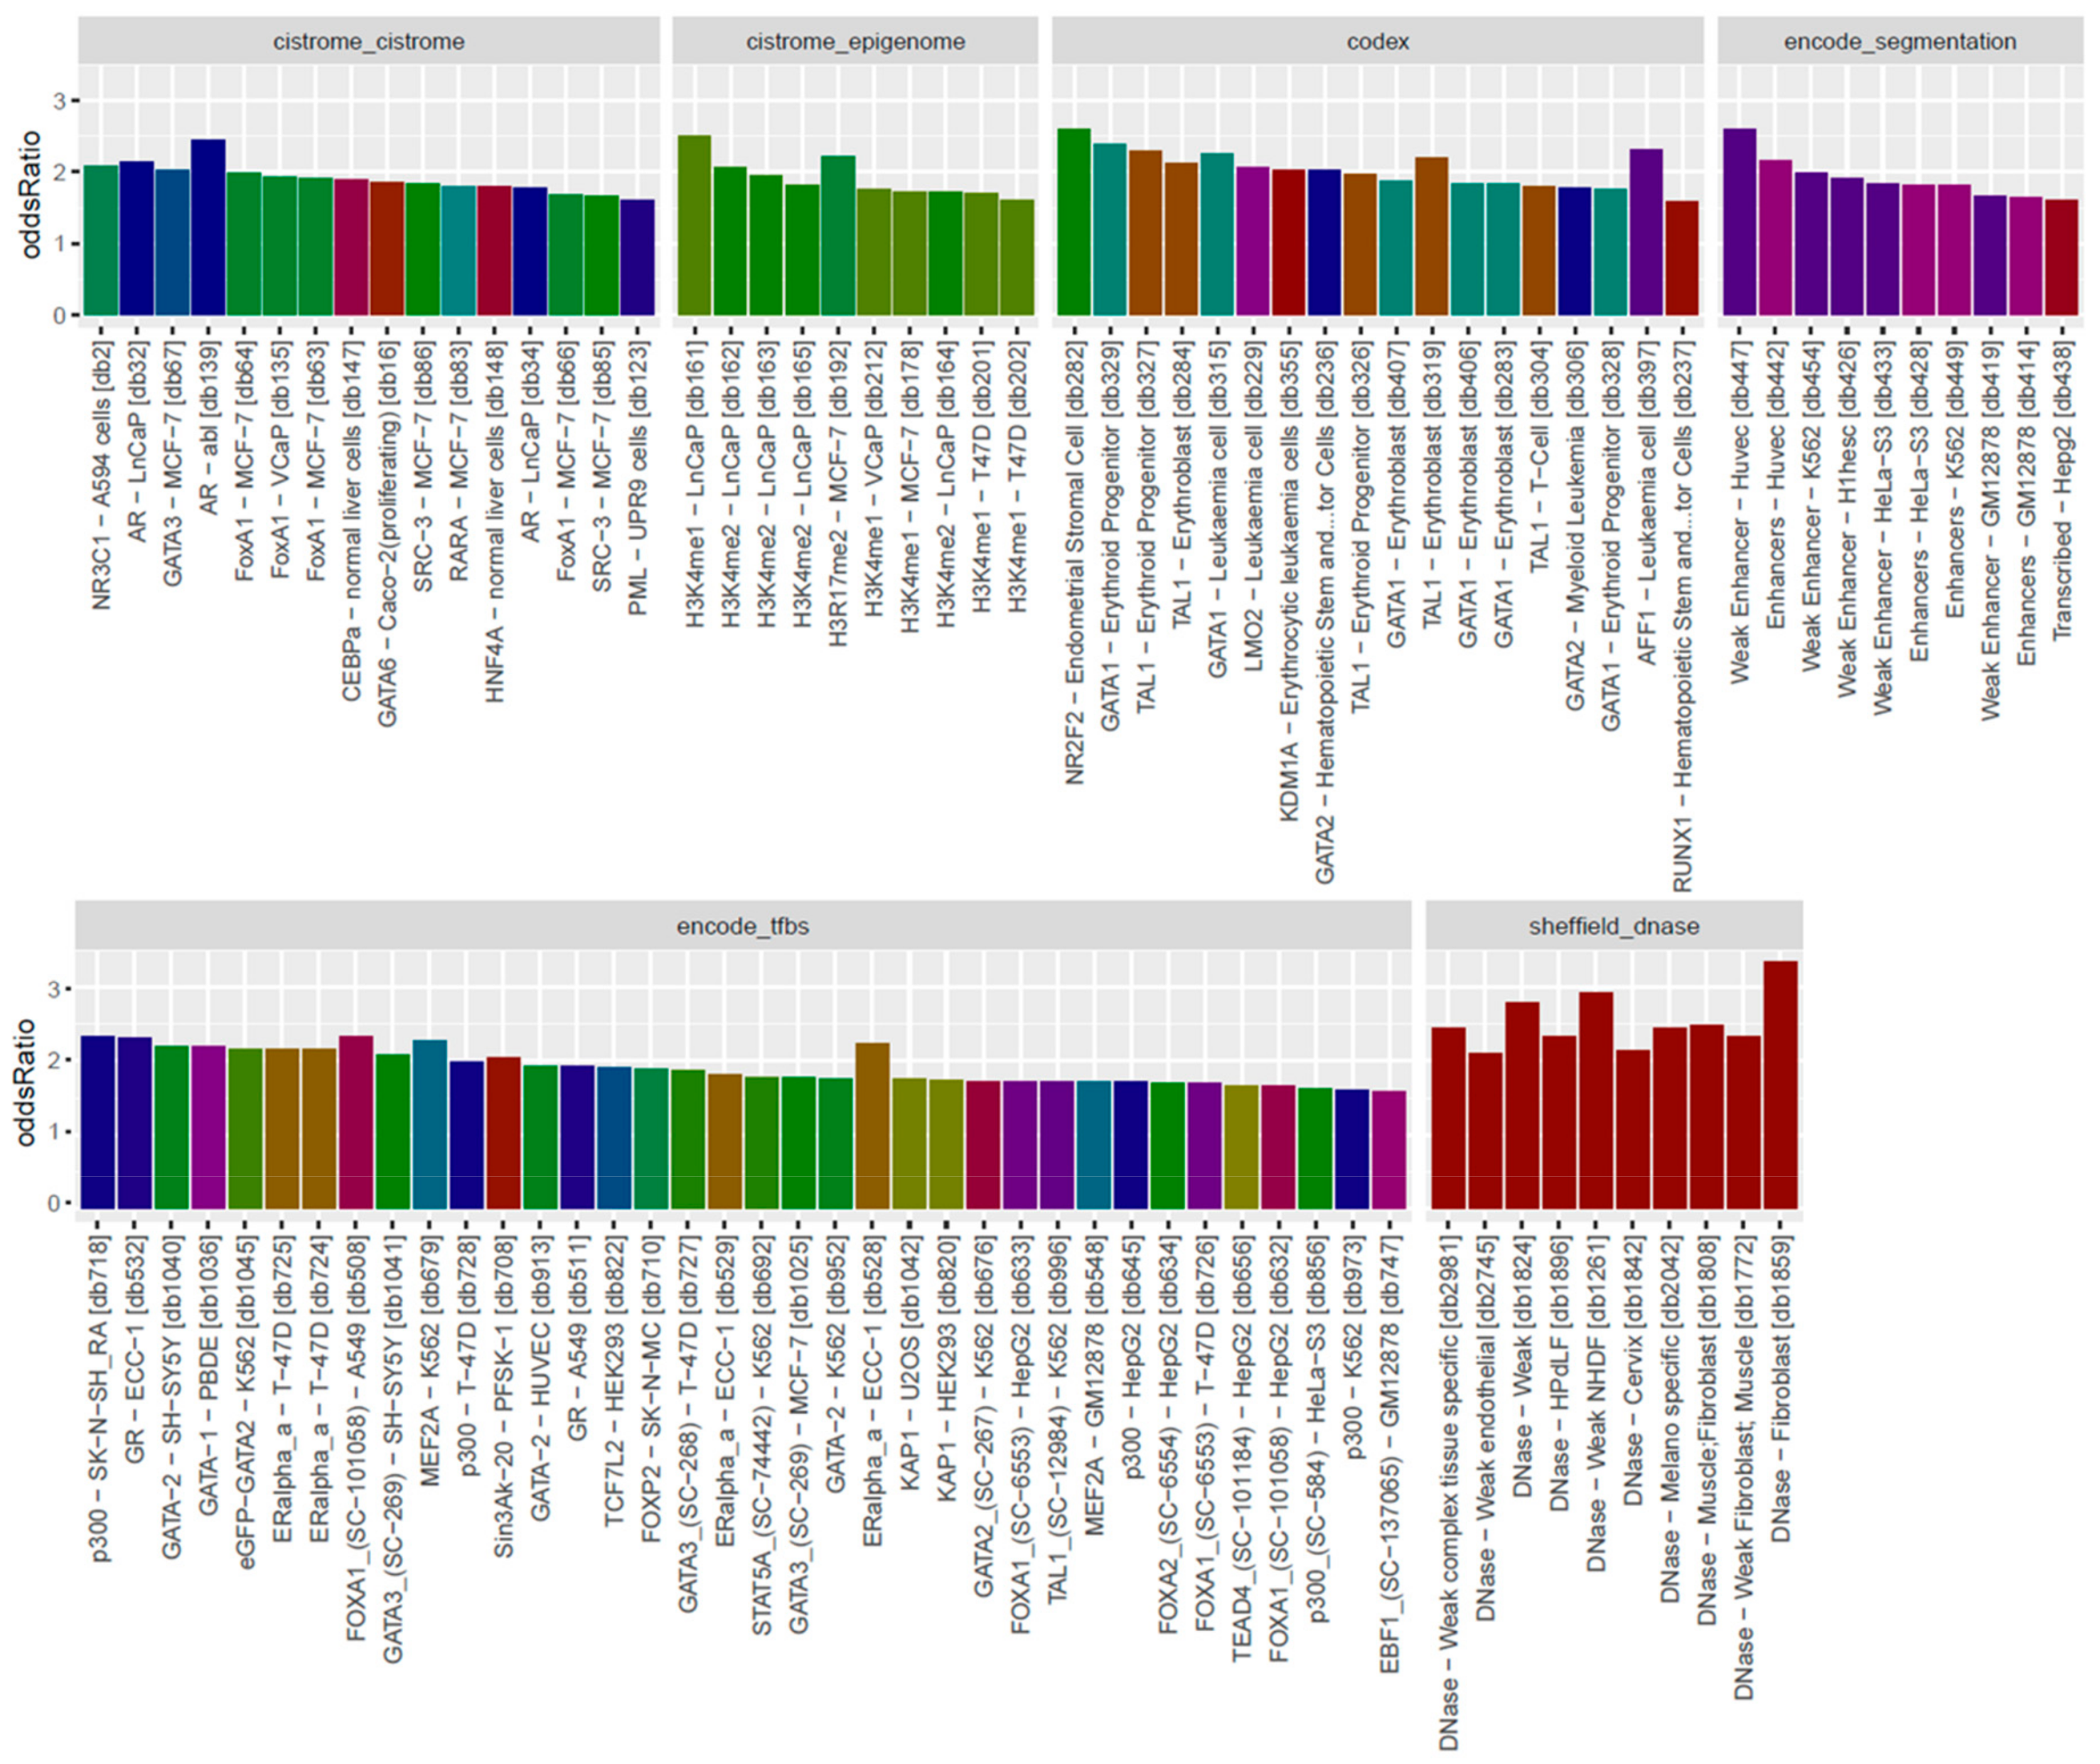
3.3. Locus Overlap Analysis (LOLA) for Enrichment of Genomic Ranges
3.4. Pathway Analysis
4. Discussion
4.1. Aberrant Methylation of Protein-coding Genes
4.2. Aberrant Methylation of Non-Coding Genes
4.3. Genomic Hypermethylation
4.4. Genomic Hypomethylation
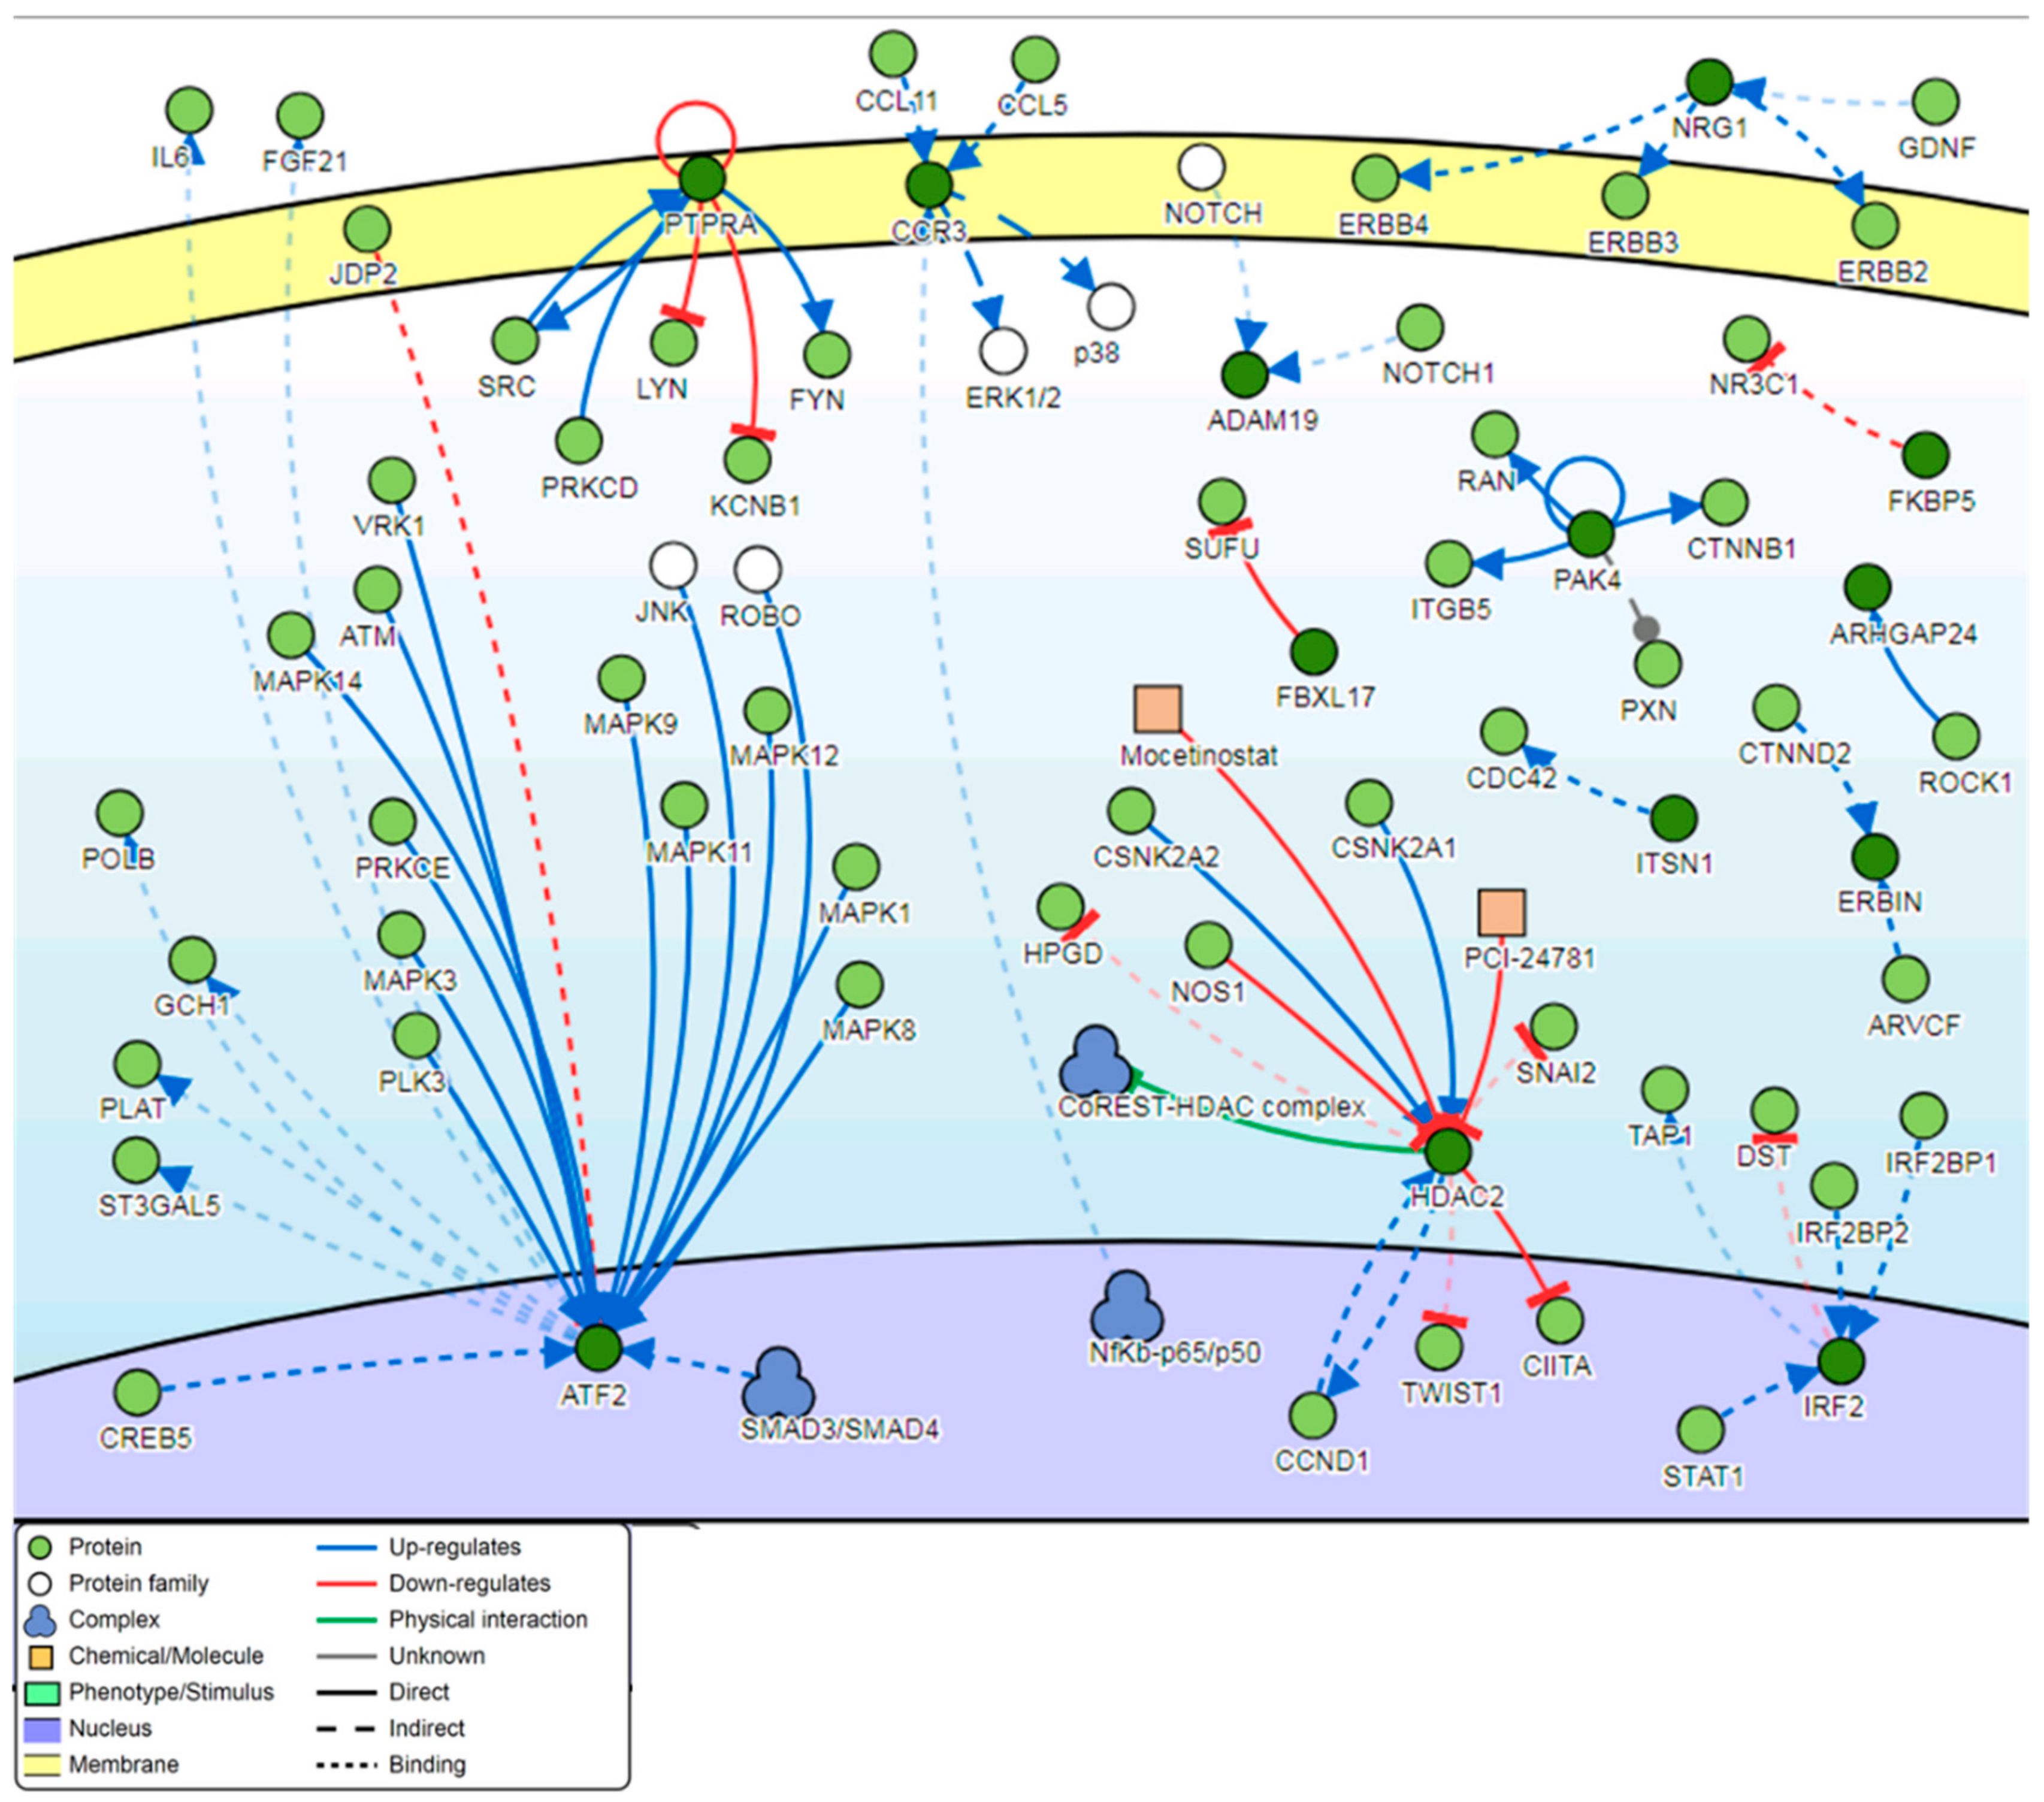
4.5. Genes Involved in the Signaling Network Pathway
4.6. Anatomical Location of Warts
5. Conclusions
Author Contributions
Funding
Acknowledgments
Conflicts of Interest
References
- Stanley, M.A. Epithelial cell responses to infection with human papillomavirus. Clin. Microbiol. Rev. 2012, 25, 215–222. [Google Scholar] [CrossRef] [PubMed]
- Sabeena, S.; Bhat, P.; Kamath, V.; Arunkumar, G. Possible non-sexual modes of transmission of human papilloma virus. J. Obstet. Gynaecol. Res. 2017, 43, 429–435. [Google Scholar] [CrossRef] [PubMed]
- Ljubojevic, S.; Skerlev, M. HPV-associated diseases. Clin. Dermatol. 2014, 32, 227–234. [Google Scholar] [CrossRef] [PubMed]
- Doorbar, J.; Egawa, N.; Griffin, H.; Kranjec, C.; Murakami, I. Human papillomavirus molecular biology and disease association. Rev. Med. Virol. 2015, 25, 2–23. [Google Scholar] [CrossRef] [PubMed]
- Egawa, N.; Doorbar, J. The low-risk papillomaviruses. Virus Res. 2017, 231, 119–127. [Google Scholar] [CrossRef] [PubMed]
- Loo, S.K.F.; Tang, W.Y.M. Warts (non-genital). BMJ Clin. Evid. 2014, 2014. [Google Scholar]
- Bacelieri, R.; Johnson, S.M. Cutaneous warts: An evidence-based approach to therapy. Am. Fam. Phys. 2005, 72, 647–652. [Google Scholar]
- Dall’Oglio, F.; D’Amico, V.; Nasca, M.R.; Micali, G. Treatment of Cutaneous Warts. Am. J. Clin. Dermatol. 2012, 13, 73–96. [Google Scholar] [CrossRef]
- Bruggink, S.C.; de Koning, M.N.C.; Gussekloo, J.; Egberts, P.F.; ter Schegget, J.; Feltkamp, M.C.W.; Bavinck, J.N.B.; Quint, W.G.V.; Assendelft, W.J.J.; Eekhof, J.A.H. Cutaneous wart-associated HPV types: Prevalence and relation with patient characteristics. J. Clin. Virol. 2012, 55, 250–255. [Google Scholar] [CrossRef]
- Mulhem, E.; Pinelis, S. Treatment of nongenital cutaneous warts. Am. Fam. Phys. 2011, 84, 288–293. [Google Scholar]
- Bacaj, P.; Burch, D. Human Papillomavirus Infection of the Skin. Arch. Pathol. Lab. Med. 2018, 142, 700–705. [Google Scholar] [CrossRef] [PubMed]
- Rodriguez, A.C.; Schiffman, M.; Herrero, R.; Wacholder, S.; Hildesheim, A.; Castle, P.E.; Solomon, D.; Burk, R. Proyecto Epidemiológico Guanacaste Group Rapid Clearance of Human Papillomavirus and Implications for Clinical Focus on Persistent Infections. JNCI J. Natl. Cancer Inst. 2008, 100, 513–517. [Google Scholar] [CrossRef] [PubMed]
- Di Domenico, M.; Giovane, G.; Kouidhi, S.; Iorio, R.; Romano, M.; De Francesco, F.; Feola, A.; Siciliano, C.; Califano, L.; Giordano, A. HPV epigenetic mechanisms related to Oropharyngeal and Cervix cancers. Cancer Biol. Ther. 2018, 19, 850–857. [Google Scholar] [CrossRef] [PubMed]
- Von Knebel Doeberitz, M.; Prigge, E.-S. Role of DNA methylation in HPV associated lesions. Papillomavirus Res. 2019, 7, 180–183. [Google Scholar] [CrossRef]
- Milavetz, B.I.; Balakrishnan, L. Viral Epigenetics. Methods Mol Biol. 2015, 1238, 569–596. [Google Scholar]
- Schübeler, D. Function and information content of DNA methylation. Nature 2015, 517, 321–326. [Google Scholar] [CrossRef]
- Jin, J.; Lian, T.; Gu, C.; Yu, K.; Gao, Y.Q.; Su, X.-D. The effects of cytosine methylation on general transcription factors. Sci. Rep. 2016, 6, 29119. [Google Scholar] [CrossRef]
- Lister, R.; Pelizzola, M.; Dowen, R.H.; Hawkins, R.D.; Hon, G.; Tonti-Filippini, J.; Nery, J.R.; Lee, L.; Ye, Z.; Ngo, Q.-M.; et al. Human DNA methylomes at base resolution show widespread epigenomic differences. Nature 2009, 462, 315–322. [Google Scholar] [CrossRef]
- Yang, X.; Han, H.; DeCarvalho, D.D.; Lay, F.D.; Jones, P.A.; Liang, G. Gene body methylation can alter gene expression and is a therapeutic target in cancer. Cancer Cell 2014, 26, 577–590. [Google Scholar] [CrossRef]
- Jones, P.A. The DNA methylation paradox. Trends Genet. 1999, 15, 34–37. [Google Scholar] [CrossRef]
- Moore, L.D.; Le, T.; Fan, G. DNA methylation and its basic function. Neuropsychopharmacology 2013, 38, 23–38. [Google Scholar] [CrossRef] [PubMed]
- Neri, F.; Rapelli, S.; Krepelova, A.; Incarnato, D.; Parlato, C.; Basile, G.; Maldotti, M.; Anselmi, F.; Oliviero, S. Intragenic DNA methylation prevents spurious transcription initiation. Nature 2017, 543, 72–77. [Google Scholar] [CrossRef]
- Wade, J.T.; Grainger, D.C. Spurious transcription and its impact on cell function. Transcription 2018, 9, 182–189. [Google Scholar] [CrossRef] [PubMed]
- Lokk, K.; Modhukur, V.; Rajashekar, B.; Märtens, K.; Mägi, R.; Kolde, R.; Koltšina, M.; Nilsson, T.K.; Vilo, J.; Salumets, A.; et al. DNA methylome profiling of human tissues identifies global and tissue-specific methylation patterns. Genome Biol. 2014, 15, r54. [Google Scholar] [CrossRef] [PubMed]
- Zhang, C.; Zhao, H.; Li, J.; Liu, H.; Wang, F.; Wei, Y.; Su, J.; Zhang, D.; Liu, T.; Zhang, Y. The Identification of Specific Methylation Patterns across Different Cancers. PLoS ONE 2015, 10, e0120361. [Google Scholar] [CrossRef]
- Wang, Y.; Liu, D.; Jin, X.; Song, H.; Lou, G. Genome-wide characterization of aberrant DNA methylation patterns and the potential clinical implications in patients with endometrial cancer. Pathol. Res. Pract. 2019, 215, 137–143. [Google Scholar] [CrossRef]
- Sen, P.; Ganguly, P.; Ganguly, N. Modulation of DNA methylation by human papillomavirus E6 and E7 oncoproteins in cervical cancer (Review). Oncol. Lett. 2017, 15, 11–22. [Google Scholar] [CrossRef]
- Clarke, M.A.; Gradissimo, A.; Schiffman, M.; Lam, J.; Sollecito, C.C.; Fetterman, B.; Lorey, T.; Poitras, N.; Raine-Bennett, T.R.; Castle, P.E.; et al. Human Papillomavirus DNA Methylation as a Biomarker for Cervical Precancer: Consistency across 12 Genotypes and Potential Impact on Management of HPV-Positive Women. Clin. Cancer Res. 2018, 24, 2194–2202. [Google Scholar] [CrossRef]
- Assenov, Y.; Müller, F.; Lutsik, P.; Walter, J.; Lengauer, T.; Bock, C. Comprehensive analysis of DNA methylation data with RnBeads. Nat. Methods 2014, 11, 1138–1140. [Google Scholar] [CrossRef]
- Ritchie, M.E.; Phipson, B.; Wu, D.; Hu, Y.; Law, C.W.; Shi, W.; Smyth, G.K. limma powers differential expression analyses for RNA-sequencing and microarray studies. Nucleic Acids Res. 2015, 43, e47. [Google Scholar] [CrossRef]
- Sheffield, N.C.; Bock, C. LOLA: Enrichment analysis for genomic region sets and regulatory elements in R and Bioconductor. Bioinformatics 2016, 32, 587–589. [Google Scholar] [CrossRef] [PubMed]
- Perfetto, L.; Briganti, L.; Calderone, A.; Cerquone Perpetuini, A.; Iannuccelli, M.; Langone, F.; Licata, L.; Marinkovic, M.; Mattioni, A.; Pavlidou, T.; et al. SIGNOR: A database of causal relationships between biological entities. Nucleic Acids Res. 2016, 44, D548–D554. [Google Scholar] [CrossRef] [PubMed]
- Laramie, J.M.; Wilk, J.B.; Williamson, S.L.; Nagle, M.W.; Latourelle, J.C.; Tobin, J.E.; Province, M.A.; Borecki, I.B.; Myers, R.H. Polymorphisms near EXOC4 and LRGUK on chromosome 7q32 are associated with Type 2 Diabetes and fasting glucose; The NHLBI Family Heart Study. BMC Med. Genet. 2008, 9, 46. [Google Scholar] [CrossRef] [PubMed]
- Mukerji, J.; Olivieri, K.C.; Misra, V.; Agopian, K.A.; Gabuzda, D. Proteomic analysis of HIV-1 Nef cellular binding partners reveals a role for exocyst complex proteins in mediating enhancement of intercellular nanotube formation. Retrovirology 2012, 9, 33. [Google Scholar] [CrossRef] [PubMed]
- Sapp, M.; Bienkowska-Haba, M. Viral entry mechanisms: Human papillomavirus and a long journey from extracellular matrix to the nucleus. FEBS J. 2009, 276, 7206–7216. [Google Scholar] [CrossRef] [PubMed]
- Schiller, J.T.; Day, P.M.; Kines, R.C. Current understanding of the mechanism of HPV infection. Gynecol. Oncol. 2010, 118, S12–S17. [Google Scholar] [CrossRef] [PubMed]
- Zhang, P.; Monteiro Da Silva, G.; Deatherage, C.; Burd, C. Cell-Penetrating Peptide Mediates Intracellular Membrane Passage of Human Papillomavirus L2 Protein to Trigger Retrograde Trafficking In Brief A conserved cell-penetrating peptide (CPP) encoded by the HPV genome enables viral protein passage across the endosomal membrane into the cytoplasm and drives non-enveloped viral entry during infection. Cell 2018, 175, 1465–1476. [Google Scholar]
- Santi, C.M.; Martínez-López, P.; de la Vega-Beltrán, J.L.; Butler, A.; Alisio, A.; Darszon, A.; Salkoff, L. The SLO3 sperm-specific potassium channel plays a vital role in male fertility. FEBS Lett. 2010, 584, 1041–1046. [Google Scholar] [CrossRef]
- Pardo, L.A.; Stühmer, W. The roles of K + channels in cancer. Nat. Rev. Cancer 2014, 14, 39–48. [Google Scholar] [CrossRef]
- Shi, Q.; Ge, Y.; He, W.; Hu, X.; Yan, R. RTN1 and RTN3 protein are differentially associated with senile plaques in Alzheimer’s brains. Sci. Rep. 2017, 7, 6145. [Google Scholar] [CrossRef]
- Fan, Y.; Xiao, W.; Li, Z.; Li, X.; Chuang, P.Y.; Jim, B.; Zhang, W.; Wei, C.; Wang, N.; Jia, W.; et al. RTN1 mediates progression of kidney disease by inducing ER stress. Nat. Commun. 2015, 6, 7841. [Google Scholar] [CrossRef] [PubMed]
- Diaz, A.; Wang, X.; Ahlquist, P. Membrane-shaping host reticulon proteins play crucial roles in viral RNA replication compartment formation and function. Proc. Natl. Acad. Sci. USA 2010, 107, 16291–16296. [Google Scholar] [CrossRef] [PubMed]
- Zhu, Y.-H.; Liu, H.; Zhang, L.-Y.; Zeng, T.; Song, Y.; Qin, Y.-R.; Li, L.; Liu, L.; Li, J.; Zhang, B.; et al. Downregulation of LGI1 promotes tumor metastasis in esophageal squamous cell carcinoma. Carcinogenesis 2014, 35, 1154–1161. [Google Scholar] [CrossRef] [PubMed][Green Version]
- Wang, Y.; Liu, D.-P.; Chen, P.-P.; Koeffler, H.P.; Tong, X.-J.; Xie, D. Involvement of IFN Regulatory Factor (IRF)-1 and IRF-2 in the Formation and Progression of Human Esophageal Cancers. Cancer Res. 2007, 67, 2535–2543. [Google Scholar] [CrossRef] [PubMed]
- Toruner, G.A.; Ulger, C.; Alkan, M.; Galante, A.T.; Rinaggio, J.; Wilk, R.; Tian, B.; Soteropoulos, P.; Hameed, M.R.; Schwalb, M.N.; et al. Association between gene expression profile and tumor invasion in oral squamous cell carcinoma. Cancer Genet. Cytogenet. 2004, 154, 27–35. [Google Scholar] [CrossRef]
- Wang, Z.; Liu, N.; Shi, S.; Liu, S.; Lin, H. The Role of PIWIL4, an Argonaute Family Protein, in Breast Cancer. J. Biol. Chem. 2016, 291, 10646–10658. [Google Scholar] [CrossRef]
- Bamezai, S.; Mulaw, M.M.; Zhou, F.; Rohde, C.; Muller-Tidow, C.; Dohner, K.; Dohner, H.; Buske, M.F.; Buske, C.; Rawat, V.P. Knockdown of the Piwi—Like Protein 4 (PIWIL4) Delays Leukemic Growth and Is Associated with Gross Changes in the Global Histone Methylation Marks in Human MLL—Rearranged AML. Blood 2013, 122, 597. [Google Scholar] [CrossRef]
- Li, W.; Wong, C.C.; Zhang, X.; Kang, W.; Nakatsu, G.; Zhao, Q.; Chen, H.; Go, M.Y.Y.; Chiu, P.W.Y.; Wang, X.; et al. CAB39L elicited an anti-Warburg effect via a LKB1-AMPK-PGC1α axis to inhibit gastric tumorigenesis. Oncogene 2018, 37, 6383–6398. [Google Scholar] [CrossRef]
- Stebbing, J.; Lit, L.C.; Zhang, H.; Darrington, R.S.; Melaiu, O.; Rudraraju, B.; Giamas, G. The regulatory roles of phosphatases in cancer. Oncogene 2014, 33, 939–953. [Google Scholar] [CrossRef]
- Sagwal, S.K.; Pasqual-Melo, G.; Bodnar, Y.; Gandhirajan, R.K.; Bekeschus, S. Combination of chemotherapy and physical plasma elicits melanoma cell death via upregulation of SLC22A16. Cell Death Dis. 2018, 9, 1179. [Google Scholar] [CrossRef]
- Ota, K.; Ito, K.; Akahira, J.; Sato, N.; Onogawa, T.; Moriya, T.; Unno, M.; Abe, T.; Niikura, H.; Takano, T.; et al. Expression of Organic Cation Transporter SLC22A16 in Human Epithelial Ovarian Cancer. Int. J. Gynecol. Pathol. 2007, 26, 334–340. [Google Scholar] [CrossRef] [PubMed]
- Reddy, K.R.K.; Dasari, C.; Duscharla, D.; Supriya, B.; Ram, N.S.; Surekha, M.V.; Kumar, J.M.; Ummanni, R. Dimethylarginine dimethylaminohydrolase-1 (DDAH1) is frequently upregulated in prostate cancer, and its overexpression conveys tumor growth and angiogenesis by metabolizing asymmetric dimethylarginine (ADMA). Angiogenesis 2018, 21, 79–94. [Google Scholar] [CrossRef] [PubMed]
- Ye, J.; Xu, J.; Li, Y.; Huang, Q.; Huang, J.; Wang, J.; Zhong, W.; Lin, X.; Chen, W.; Lin, X. DDAH1 mediates gastric cancer cell invasion and metastasis via Wnt/β-catenin signaling pathway. Mol. Oncol. 2017, 11, 1208–1224. [Google Scholar] [CrossRef] [PubMed]
- Hulin, J.-A.; Tommasi, S.; Elliot, D.; Mangoni, A.A. Small molecule inhibition of DDAH1 significantly attenuates triple negative breast cancer cell vasculogenic mimicry in vitro. Biomed. Pharmacother. 2019, 111, 602–612. [Google Scholar] [CrossRef] [PubMed]
- Friedman, J.S.; Ray, J.W.; Waseem, N.; Johnson, K.; Brooks, M.J.; Hugosson, T.; Breuer, D.; Branham, K.E.; Krauth, D.S.; Bowne, S.J.; et al. Mutations in a BTB-Kelch Protein, KLHL7, Cause Autosomal-Dominant Retinitis Pigmentosa. Am. J. Hum. Genet. 2009, 84, 792–800. [Google Scholar] [CrossRef]
- Palazzo, A.F.; Lee, E.S. Non-coding RNA: What is functional and what is junk? Front. Genet. 2015, 6, 2. [Google Scholar] [CrossRef]
- Kolenda, T.; Guglas, K.; Ryś, M.; Bogaczyńska, M.; Teresiak, A.; Bliźniak, R.; Łasińska, I.; Mackiewicz, J.; Lamperska, K.M. Biological role of long non-coding RNA in head and neck cancers. Rep. Pract. Oncol. Radiother. 2017, 22, 378–388. [Google Scholar] [CrossRef]
- Sui, J.; Xu, S.-Y.; Han, J.; Yang, S.-R.; Li, C.-Y.; Yin, L.-H.; Pu, Y.-P.; Liang, G.-Y. Integrated analysis of competing endogenous RNA network revealing lncRNAs as potential prognostic biomarkers in human lung squamous cell carcinoma. Oncotarget 2017, 8, 65997–66018. [Google Scholar] [CrossRef]
- Li, J.; Li, P.; Zhao, W.; Yang, R.; Chen, S.; Bai, Y.; Dun, S.; Chen, X.; Du, Y.; Wang, Y.; et al. Expression of long non-coding RNA DLX6-AS1 in lung adenocarcinoma. Cancer Cell Int. 2015, 15, 48. [Google Scholar] [CrossRef]
- Kim, S.T.; Sohn, I.; Do, I.-G.; Jang, J.; Kim, S.H.; Jung, I.H.; Park, J.O.; Park, Y.S.; Talasaz, A.; Lee, J.; et al. Transcriptome analysis of CD133-positive stem cells and prognostic value of survivin in colorectal cancer. Cancer Genom. Proteom. 2014, 11, 259–266. [Google Scholar] [CrossRef]
- Wang, X.; Liu, Z.; Tong, H.; Peng, H.; Xian, Z.; Li, L.; Hu, B.; Xie, S. Linc01194 acts as an oncogene in colorectal carcinoma and is associated with poor survival outcome. Cancer Manag. Res. 2019, 11, 2349–2362. [Google Scholar] [CrossRef] [PubMed]
- Zhang, Z.; Wang, S.; Liu, W. EMT-related long non-coding RNA in hepatocellular carcinoma: A study with TCGA database. Biochem. Biophys. Res. Commun. 2018, 503, 1530–1536. [Google Scholar] [CrossRef] [PubMed]
- Tian, W.; Jiang, C.; Huang, Z.; Xu, D.; Zheng, S. Comprehensive analysis of dysregulated lncRNAs, miRNAs and mRNAs with associated ceRNA network in esophageal squamous cell carcinoma. Gene 2019, 696, 206–218. [Google Scholar] [CrossRef] [PubMed]
- Saez, E.; Rutberg, S.E.; Mueller, E.; Oppenheim, H.; Smoluk, J.; Yuspa, S.H.; Spiegelman, B.M. c-fos is required for malignant progression of skin tumors. Cell 1995, 82, 721–732. [Google Scholar] [CrossRef]
- Briso, E.M.; Guinea-Viniegra, J.; Bakiri, L.; Rogon, Z.; Petzelbauer, P.; Eils, R.; Wolf, R.; Rincón, M.; Angel, P.; Wagner, E.F. Inflammation-mediated skin tumorigenesis induced by epidermal c-Fos. Genes Dev. 2013, 27, 1959–1973. [Google Scholar] [CrossRef]
- Mils, V.; Piette, J.; Barette, C.; Veyrune, J.; Tesnière, A.; Escot, C.; Guilhou, J.-J.; Basset-Séguin, N. The proto-oncogene c-fos increases the sensitivity of keratinocytes to apoptosis. Oncogene 1997, 14, 1555–1561. [Google Scholar] [CrossRef][Green Version]
- Delcuratolo, M.; Fertey, J.; Schneider, M.; Schuetz, J.; Leiprecht, N.; Hudjetz, B.; Brodbeck, S.; Corall, S.; Dreer, M.; Schwab, R.M.; et al. Papillomavirus-Associated Tumor Formation Critically Depends on c-Fos Expression Induced by Viral Protein E2 and Bromodomain Protein Brd4. PLOS Pathog. 2016, 12, e1005366. [Google Scholar] [CrossRef]
- Yuan, Z.-L.; Guan, Y.-J.; Wang, L.; Wei, W.; Kane, A.B.; Chin, Y.E. Central role of the threonine residue within the p+1 loop of receptor tyrosine kinase in STAT3 constitutive phosphorylation in metastatic cancer cells. Mol. Cell. Biol. 2004, 24, 9390–9400. [Google Scholar] [CrossRef]
- Sano, S.; Chan, K.S.; Di Giovanni, J. Impact of Stat3 activation upon skin biology: A dichotomy of its role between homeostasis and diseases. J. Dermatol. Sci. 2008, 50, 1–14. [Google Scholar] [CrossRef]
- Calautti, E.; Avalle, L.; Poli, V. Psoriasis: A STAT3-Centric View. Int. J. Mol. Sci. 2018, 19, 171. [Google Scholar] [CrossRef]
- Lu, R.; Zhang, Y.-G.; Sun, J. STAT3 activation in infection and infection-associated cancer. Mol. Cell. Endocrinol. 2017, 451, 80–87. [Google Scholar] [CrossRef]
- Sen, N.; Che, X.; Rajamani, J.; Zerboni, L.; Sung, P.; Ptacek, J.; Arvin, A.M. Signal transducer and activator of transcription 3 (STAT3) and survivin induction by varicella-zoster virus promote replication and skin pathogenesis. Proc. Natl. Acad. Sci. USA 2012, 109, 600–605. [Google Scholar] [CrossRef] [PubMed]
- Morgan, E.L.; Wasson, C.W.; Hanson, L.; Kealy, D.; Pentland, I.; McGuire, V.; Scarpini, C.; Coleman, N.; Arthur, J.S.C.; Parish, J.L.; et al. STAT3 activation by E6 is essential for the differentiation-dependent HPV18 life cycle. PLOS Pathog. 2018, 14, e1006975. [Google Scholar] [CrossRef] [PubMed]
- Morgan, E.L.; Macdonald, A. Autocrine STAT3 activation in HPV positive cervical cancer through a virus-driven Rac1—NFκB—IL-6 signalling axis. PLOS Pathog. 2019, 15, e1007835. [Google Scholar] [CrossRef] [PubMed]
- Chen, H.; Liu, H.; Qing, G. Targeting oncogenic Myc as a strategy for cancer treatment. Signal Transduct. Target. Ther. 2018, 3, 5. [Google Scholar] [CrossRef]
- Watt, F.M.; Frye, M.; Benitah, S.A. MYC in mammalian epidermis: How can an oncogene stimulate differentiation? Nat. Rev. Cancer 2008, 8, 234–242. [Google Scholar] [CrossRef]
- Nascimento, E.M.; Cox, C.L.; MacArthur, S.; Hussain, S.; Trotter, M.; Blanco, S.; Suraj, M.; Nichols, J.; Kübler, B.; Benitah, S.A.; et al. The opposing transcriptional functions of Sin3a and c-Myc are required to maintain tissue homeostasis. Nat. Cell Biol. 2011, 13, 1395–1405. [Google Scholar] [CrossRef]
- Oskarsson, T.; Essers, M.A.G.; Dubois, N.; Offner, S.; Dubey, C.; Roger, C.; Metzger, D.; Chambon, P.; Hummler, E.; Beard, P.; et al. Skin epidermis lacking the c-Myc gene is resistant to Ras-driven tumorigenesis but can reacquire sensitivity upon additional loss of the p21Cip1 gene. Genes Dev. 2006, 20, 2024–2029. [Google Scholar] [CrossRef]
- Abba, M.C.; Laguens, R.M.; Dulout, F.N.; Golijow, C.D. The c-myc activation in cervical carcinomas and HPV 16 infections. Mutat. Res. Toxicol. Environ. Mutagen. 2004, 557, 151–158. [Google Scholar] [CrossRef]
- Heemers, H.V.; Tindall, D.J. Androgen Receptor (AR) Coregulators: A Diversity of Functions Converging on and Regulating the AR Transcriptional Complex. Endocr. Rev. 2007, 28, 778–808. [Google Scholar] [CrossRef]
- Lai, J.-J.; Chang, P.; Lai, K.-P.; Chen, L.; Chang, C. The role of androgen and androgen receptor in skin-related disorders. Arch. Dermatol. Res. 2012, 304, 499–510. [Google Scholar] [CrossRef] [PubMed]
- Noël, J.-C.; Bucella, D.; Fayt, I.; Simonart, T.; Buxant, F.; Anaf, V.; Simon, P. Androgen Receptor Expression in Cervical Intraepithelial Neoplasia and Invasive Squamous Cell Carcinoma of the Cervix. Int. J. Gynecol. Pathol. 2008, 27, 437–441. [Google Scholar] [CrossRef] [PubMed]
- Pereira, F.A.; Qiu, Y.; Zhou, G.; Tsai, M.-J.; Tsai, S.Y. The orphan nuclear receptor COUP-TFII is required for angiogenesis and heart development. Genes Dev. 1999, 13, 1037–1049. [Google Scholar] [CrossRef] [PubMed]
- Zhou, C.; Xiong, Q.; Zhu, X.; Du, W.; Deng, P.; Li, X.; Jiang, Y.; Zou, S.; Wang, C.; Yuan, Q. AFF1 and AFF4 differentially regulate the osteogenic differentiation of human MSCs. Bone Res. 2017, 5, 17044. [Google Scholar] [CrossRef] [PubMed]
- Gao, G.; Zhang, X.-F.; Hubbell, K.; Cui, X. NR2F2 regulates chondrogenesis of human mesenchymal stem cells in bioprinted cartilage. Biotechnol. Bioeng. 2017, 114, 208–216. [Google Scholar] [CrossRef] [PubMed]
- Hu, S.; Wilson, K.D.; Ghosh, Z.; Han, L.; Wang, Y.; Lan, F.; Ransohoff, K.J.; Burridge, P.; Wu, J.C. MicroRNA-302 Increases Reprogramming Efficiency via Repression of NR2F2. Stem Cells 2013, 31, 259–268. [Google Scholar] [CrossRef] [PubMed]
- Tamai, H.; Miyake, K.; Yamaguchi, H.; Takatori, M.; Dan, K.; Inokuchi, K.; Shimada, T. Resistance of MLL–AFF1-positive acute lymphoblastic leukemia to tumor necrosis factor-alpha is mediated by S100A6 upregulation. Blood Cancer J. 2011, 1, e38. [Google Scholar] [CrossRef]
- Fan, M.; Pfeffer, S.R.; Lynch, H.T.; Cassidy, P.; Leachman, S.; Pfeffer, L.M.; Kopelovich, L.; Fan, M.; Pfeffer, S.R.; Lynch, H.T.; et al. Altered transcriptome signature of phenotypically normal skin fibroblasts heterozygous for CDKN2A in familial melanoma: Relevance to early intervention. Oncotarget 2013, 4, 128–141. [Google Scholar] [CrossRef]
- Watson, G.; Ronai, Z.A.; Lau, E. ATF2, a paradigm of the multifaceted regulation of transcription factors in biology and disease. Pharmacol. Res. 2017, 119, 347–357. [Google Scholar] [CrossRef]
- Papassava, P.; Gorgoulis, V.G.; Papaevangeliou, D.; Vlahopoulos, S.; van Dam, H.; Zoumpourlis, V. Overexpression of Activating Transcription Factor-2 Is Required for Tumor Growth and Progression in Mouse Skin Tumors. Cancer Res. 2004, 64, 8573–8584. [Google Scholar] [CrossRef]
- Leslie, M.C.; Bar-Eli, M. Regulation of gene expression in melanoma: New approaches for treatment. J. Cell. Biochem. 2005, 94, 25–38. [Google Scholar] [CrossRef]
- LeBoeuf, M.; Terrell, A.; Trivedi, S.; Sinha, S.; Epstein, J.A.; Olson, E.N.; Morrisey, E.E.; Millar, S.E. Hdac1 and Hdac2 Act Redundantly to Control p63 and p53 Functions in Epidermal Progenitor Cells. Dev. Cell 2010, 19, 807–818. [Google Scholar] [CrossRef] [PubMed]
- Banerjee, N.S.; Moore, D.W.; Broker, T.R.; Chow, L.T. Vorinostat, a pan-HDAC inhibitor, abrogates productive HPV-18 DNA amplification. Proc. Natl. Acad. Sci. USA 2018, 115, E11138–E11147. [Google Scholar] [CrossRef] [PubMed]
- Kita, R.; Fraser, H.B. Local Adaptation of Sun-Exposure-Dependent Gene Expression Regulation in Human Skin. PLoS Genet. 2016, 12, e1006382. [Google Scholar] [CrossRef] [PubMed]
- Degli Esposti, D.; Sklias, A.; Lima, S.C.; Beghelli-de la Forest Divonne, S.; Cahais, V.; Fernandez-Jimenez, N.; Cros, M.-P.; Ecsedi, S.; Cuenin, C.; Bouaoun, L.; et al. Unique DNA methylation signature in HPV-positive head and neck squamous cell carcinomas. Genome Med. 2017, 9, 33. [Google Scholar] [CrossRef] [PubMed]


| Gene | Category | Chromosome | Start | End | Mean.mean β Value (NS) | Mean.mean β Value (W) | Mean.mean β Value Difference (W-NS) | Mean.mean. quot.log2 | Comb.p.val | Comb.p.adj.fdr | Combined Rank |
|---|---|---|---|---|---|---|---|---|---|---|---|
| 10 | 104555001 | 104560000 | 0.113 | 0.585 | 0.472 | 2.275 | 6.818 × 10⁻¹⁶ | 8.614 × 10⁻¹¹ | 8 | ||
| AZIN1-AS1 | RNA gene (ncRNA) | 8 | 102975001 | 102980000 | 0.157 | 0.603 | 0.446 | 1.878 | 2.736 × 10⁻¹⁴ | 4.816 × 10⁻¹⁰ | 32 |
| EXOC4 | Protein coding | 7 | 133390001 | 133395000 | 0.642 | 0.134 | −0.509 | −2.184 | 2.139 × 10⁻¹³ | 1.386 × 10⁻⁹ | 39 |
| 10 | 4280001 | 4285000 | 0.125 | 0.538 | 0.412 | 2.031 | 6.565 × 10⁻¹⁵ | 2.074 × 10⁻¹⁰ | 48 | ||
| KCNU1 | Protein coding | 8 | 36840001 | 36845000 | 0.583 | 0.147 | −0.436 | −1.914 | 9.147 × 10⁻¹³ | 3.350 × 10⁻⁹ | 69 |
| SVIL2P | Pseudogene | 10 | 30675001 | 30680000 | 0.617 | 0.163 | −0.454 | −1.859 | 1.342 × 10⁻¹² | 4.403 × 10⁻⁹ | 77 |
| RTN1 | Protein coding | 14 | 59720001 | 59725000 | 0.151 | 0.538 | 0.387 | 1.768 | 2.738 × 10⁻¹⁵ | 1.730 × 10⁻¹⁰ | 95 |
| 4 | 62330001 | 62335000 | 0.561 | 0.118 | −0.443 | −2.153 | 2.391 × 10⁻¹² | 5.796 × 10⁻⁹ | 104 | ||
| TBC1D22A | Protein coding | 22 | 47045001 | 47050000 | 0.098 | 0.479 | 0.381 | 2.180 | 3.913 × 10⁻¹⁵ | 1.732 x 10⁻¹⁰ | 110 |
| PIWIL4, AP000943.3 | Protein coding, RNA gene | 11 | 94610001 | 94615000 | 0.609 | 0.162 | −0.446 | −1.843 | 3.742 × 10⁻¹² | 7.253 × 10⁻⁹ | 130 |
| LINC02008 | RNA gene (ncRNA) | 3 | 82205001 | 82210000 | 0.524 | 0.137 | −0.387 | −1.863 | 3.998 × 10⁻¹² | 7.488 10−9 | 134 |
| LGI1 | Protein coding | 10 | 93770001 | 93775000 | 0.514 | 0.135 | −0.379 | −1.856 | 4.742 × 10⁻¹² | 8.207 × 10⁻⁹ | 146 |
| VPS16, PTPRA | Protein coding | 20 | 2865001 | 2870000 | 0.499 | 0.134 | −0.364 | −1.819 | 5.040 × 10⁻¹³ | 2.318 × 10⁻⁹ | 151 |
| 5 | 115915001 | 115920000 | 0.513 | 0.132 | −0.381 | −1.879 | 6.570 × 10⁻¹² | 9.941 × 10⁻⁹ | 167 | ||
| DPCD | Protein coding | 10 | 101590001 | 101595000 | 0.579 | 0.170 | −0.409 | −1.758 | 6.785 × 10⁻¹² | 1.005 × 10⁻⁸ | 170 |
| 12 | 105855001 | 105860000 | 0.497 | 0.126 | −0.370 | −1.893 | 6.837 × 10⁻¹² | 1.005 × 10⁻⁸ | 171 | ||
| MGC27382 | RNA gene (ncRNA) | 1 | 78295001 | 78300000 | 0.185 | 0.586 | 0.402 | 1.615 | 1.534 × 10⁻¹³ | 1.211 × 10⁻⁹ | 177 |
| IRF2 | Protein coding | 4 | 184410001 | 184415000 | 0.483 | 0.125 | −0.357 | −1.864 | 4.053 × 10⁻¹² | 7.531 × 10⁻⁹ | 182 |
| SLC22A16 | Protein coding | 6 | 110460001 | 110465000 | 0.475 | 0.118 | −0.357 | −1.916 | 2.021 × 10⁻¹² | 5.283 × 10⁻⁹ | 186 |
| 2 | 152330001 | 152335000 | 0.171 | 0.536 | 0.365 | 1.593 | 7.112 × 10⁻¹⁴ | 8.169 × 10⁻¹⁰ | 195 | ||
| CAB39L | Protein coding | 13 | 49365001 | 49370000 | 0.563 | 0.095 | −0.467 | −2.441 | 9.568 × 10⁻¹² | 1.229 × 10⁻⁸ | 195 |
| 2 | 220830001 | 220835000 | 0.650 | 0.197 | −0.454 | −1.677 | 1.176 × 10⁻¹¹ | 1.363 × 10⁻⁸ | 218 | ||
| 3 | 24080001 | 24085000 | 0.218 | 0.684 | 0.466 | 1.607 | 1.218 × 10⁻¹¹ | 1.406 × 10⁻⁸ | 219 | ||
| NRG1 | Protein coding | 8 | 32280001 | 32285000 | 0.171 | 0.530 | 0.360 | 1.580 | 1.266 × 10⁻¹¹ | 1.434 × 10⁻⁸ | 223 |
| FAAHP1 | Pseudogene | 1 | 46465001 | 46470000 | 0.507 | 0.159 | −0.348 | −1.613 | 5.414 × 10⁻¹² | 9.001 × 10⁻⁹ | 228 |
| L3HYPDH, AL121694.1, JKAMP | Protein coding, RNA gene, Protein coding | 14 | 59480001 | 59485000 | 0.494 | 0.139 | −0.355 | −1.756 | 1.410 × 10⁻¹¹ | 1.543 × 10⁻⁸ | 231 |
| BPIFA4P | Pseudogene | 20 | 33205001 | 33210000 | 0.785 | 0.243 | −0.543 | −1.655 | 1.472 × 10⁻¹¹ | 1.569 × 10⁻⁸ | 237 |
| CUZD1 | Protein coding | 10 | 122835001 | 122840000 | 0.124 | 0.469 | 0.346 | 1.843 | 1.675 × 10⁻¹² | 4.809 × 10⁻⁹ | 242 |
| LINC02241 | RNA gene (ncRNA) | 5 | 20675001 | 20680000 | 0.506 | 0.148 | −0.358 | −1.707 | 1.547 × 10⁻¹¹ | 1.608 × 10⁻⁸ | 243 |
| 6 | 14050001 | 14055000 | 0.530 | 0.136 | −0.394 | −1.889 | 1.587 × 10⁻¹¹ | 1.630 × 10⁻⁸ | 246 | ||
| FER1L6, FER1L6-AS1 | Protein coding, RNA gene (ncRNA) | 8 | 123990001 | 123995000 | 0.503 | 0.160 | −0.344 | −1.596 | 2.420 × 10⁻¹² | 5.796 × 10⁻⁹ | 251 |
| DDAH1, AC092807.3 | Protein coding, RNA gene | 1 | 85555001 | 85560000 | 0.549 | 0.143 | −0.407 | −1.873 | 1.752 × 10⁻¹¹ | 1.710 × 10⁻⁸ | 258 |
| 15 | 86070001 | 86075000 | 0.172 | 0.515 | 0.342 | 1.526 | 8.259 × 10⁻¹² | 1.116 × 10⁻⁸ | 266 | ||
| 1 | 232655001 | 232660000 | 0.421 | 0.080 | −0.341 | −2.263 | 5.031 × 10⁻¹² | 8.532 × 10⁻⁹ | 269 | ||
| KLHL7 | Protein coding | 7 | 23135001 | 23140000 | 0.525 | 0.150 | −0.375 | −1.738 | 1.938 × 10⁻¹¹ | 1.814 × 10⁻⁸ | 270 |
| TANGO6 | Protein coding | 16 | 69070001 | 69075000 | 0.614 | 0.208 | −0.406 | −1.519 | 4.213 × 10⁻¹⁴ | 6.654 × 10⁻¹⁰ | 273 |
| LINC01090 | RNA gene (ncRNA) | 2 | 188220001 | 188225000 | 0.569 | 0.193 | −0.376 | −1.510 | 3.271 × 10⁻¹² | 6.621 × 10⁻⁹ | 285 |
| CASC2 | RNA gene (ncRNA) | 10 | 118190001 | 118195000 | 0.485 | 0.142 | −0.343 | −1.700 | 2.307 × 10⁻¹¹ | 1.971 × 10⁻⁸ | 295 |
| 20 | 5040001 | 5045000 | 0.685 | 0.236 | −0.450 | −1.500 | 2.152 × 10⁻¹¹ | 1.915 × 10⁻⁸ | 298 | ||
| ARHGAP24 | Protein coding | 4 | 85610001 | 85615000 | 0.500 | 0.153 | −0.346 | −1.640 | 2.522 × 10⁻¹¹ | 2.096 × 10⁻⁸ | 304 |
| CCR3 | Protein coding | 3 | 46235001 | 46240000 | 0.542 | 0.188 | −0.354 | −1.480 | 8.227 × 10⁻¹² | 1.116 × 10⁻⁸ | 322 |
| THOC2 | Protein coding | X | 123630001 | 123635000 | 0.652 | 0.208 | −0.444 | −1.603 | 3.058 × 10⁻¹¹ | 2.321 × 10⁻⁸ | 333 |
| FBXL17 | Protein coding | 5 | 108135001 | 108140000 | 0.717 | 0.221 | −0.497 | −1.658 | 3.152 × 10⁻¹¹ | 2.351 × 10⁻⁸ | 338 |
| VPS13D, SNORA59A | Protein coding, RNA gene (snoRNA) | 1 | 12505001 | 12510000 | 0.190 | 0.517 | 0.328 | 1.576 | 2.859 × 10⁻¹⁴ | 4.816 × 10⁻¹⁰ | 346 |
| 5 | 141905001 | 141910000 | 0.491 | 0.166 | −0.326 | −1.513 | 3.232 × 10⁻¹² | 6.621 × 10⁻⁹ | 357 | ||
| 1 | 173115001 | 173120000 | 0.491 | 0.164 | −0.327 | −1.523 | 3.557 × 10⁻¹¹ | 2.495 × 10⁻⁸ | 358 | ||
| 5 | 57295001 | 57300000 | 0.576 | 0.174 | −0.401 | −1.669 | 3.617 × 10⁻¹¹ | 2.525 × 10⁻⁸ | 362 | ||
| ERBIN | Protein coding | 5 | 66010001 | 66015000 | 0.495 | 0.161 | −0.334 | −1.563 | 3.822 × 10⁻¹¹ | 2.592 × 10⁻⁸ | 371 |
| AC105758.1 | Pseudogene | 4 | 126105001 | 126110000 | 0.468 | 0.145 | −0.324 | −1.628 | 1.828 × 10⁻¹¹ | 1.743 × 10⁻⁸ | 374 |
| 17 | 25850001 | 25855000 | 0.206 | 0.573 | 0.367 | 1.431 | 1.336 × 10⁻¹³ | 1.206 × 10⁻⁹ | 410 | ||
| FAM76B | Protein coding | 11 | 95775001 | 95780000 | 0.226 | 0.623 | 0.397 | 1.429 | 2.820 × 10⁻¹³ | 1.738 × 10⁻⁹ | 415 |
| 1 | 209490001 | 209495000 | 0.635 | 0.201 | −0.434 | −1.614 | 5.365 × 10⁻¹¹ | 3.172 × 10⁻⁸ | 426 | ||
| EFCAB13, AC040934.1 | Protein coding, RNA gene | 17 | 47415001 | 47420000 | 0.092 | 0.410 | 0.317 | 2.034 | 9.620 × 10⁻¹² | 1.229 × 10⁻⁸ | 430 |
| PHC2 | Protein coding | 1 | 33405001 | 33410000 | 0.515 | 0.186 | −0.329 | −1.422 | 2.189 10−12 | 5.477 × 10⁻⁹ | 435 |
| AGO4 | Protein coding | 1 | 35835001 | 35840000 | 0.203 | 0.559 | 0.356 | 1.418 | 4.086 × 10⁻¹¹ | 2.675 × 10⁻⁸ | 443 |
| AC079160.1 | RNA gene | 4 | 84235001 | 84240000 | 0.503 | 0.163 | −0.341 | −1.572 | 5.979 × 10⁻¹¹ | 3.410 × 10⁻⁸ | 443 |
| PAK4 | Protein coding | 19 | 39160001 | 39165000 | 0.180 | 0.498 | 0.318 | 1.417 | 1.745 × 10⁻¹⁴ | 4.009 × 10⁻¹⁰ | 448 |
| AP003100.2 | RNA gene | 11 | 112700001 | 112705000 | 0.510 | 0.185 | −0.325 | −1.413 | 2.551 × 10⁻¹¹ | 2.114 × 10⁻⁸ | 456 |
| CLEC4C | Protein coding | 12 | 7750001 | 7755000 | 0.433 | 0.119 | −0.314 | −1.777 | 2.365 × 10⁻¹¹ | 1.998 × 10⁻⁸ | 456 |
| 12 | 92635001 | 92640000 | 0.222 | 0.614 | 0.392 | 1.429 | 6.703 × 10⁻¹¹ | 3.642 × 10⁻⁸ | 465 | ||
| 6 | 164210001 | 164215000 | 0.475 | 0.137 | −0.337 | −1.717 | 6.867 × 10⁻¹¹ | 3.716 × 10⁻⁸ | 467 | ||
| METTL15 | Protein coding | 11 | 28160001 | 28165000 | 0.724 | 0.267 | −0.456 | −1.404 | 3.133 × 10⁻¹³ | 1.885 × 10⁻⁹ | 477 |
| RTKN2 | Protein coding | 10 | 62205001 | 62210000 | 0.158 | 0.474 | 0.315 | 1.522 | 7.807 × 10⁻¹¹ | 4.119 × 10⁻⁸ | 479 |
| LINC00824 | RNA gene (ncRNA) | 8 | 128535001 | 128540000 | 0.439 | 0.127 | −0.312 | −1.709 | 3.343 × 10⁻¹² | 6.660 × 10⁻⁹ | 482 |
| MSANTD3-TMEFF1, TMEFF1 | Protein coding | 9 | 100550001 | 100555000 | 0.564 | 0.209 | −0.355 | −1.392 | 1.378 × 10⁻¹² | 4.408 × 10⁻⁹ | 500 |
| MBNL1 | Protein coding | 3 | 152310001 | 152315000 | 0.121 | 0.447 | 0.326 | 1.804 | 9.367 × 10⁻¹¹ | 4.669 × 10⁻⁸ | 507 |
| AC092106.2 | Pseudogene | 2 | 106205001 | 106210000 | 0.486 | 0.170 | −0.316 | −1.461 | 9.531 × 10⁻¹¹ | 4.677 × 10⁻⁸ | 515 |
| 13 | 106570001 | 106575000 | 0.424 | 0.113 | −0.311 | −1.822 | 9.607 × 10⁻¹¹ | 4.705 × 10⁻⁸ | 516 | ||
| FKBP5 | Protein coding | 6 | 35690001 | 35695000 | 0.219 | 0.605 | 0.386 | 1.424 | 1.015 × 10⁻¹⁰ | 4.858 × 10⁻⁸ | 528 |
| ARFGAP3 | Protein coding | 22 | 42805001 | 42810000 | 0.243 | 0.647 | 0.405 | 1.379 | 2.067 × 10⁻¹³ | 1.386 × 10⁻⁹ | 529 |
| DDAH1, AL078459.1 | Protein coding, RNA gene | 1 | 85370001 | 85375000 | 0.456 | 0.150 | −0.306 | −1.540 | 1.696 × 10⁻¹¹ | 1.689 × 10⁻⁸ | 540 |
| HDAC2 | Protein coding | 6 | 113930001 | 113935000 | 0.241 | 0.640 | 0.398 | 1.371 | 1.476 × 10⁻¹³ | 1.211 × 10⁻⁹ | 545 |
| 10 | 4925001 | 4930000 | 0.427 | 0.123 | −0.304 | −1.719 | 3.638 × 10⁻¹¹ | 2.533 × 10⁻⁸ | 555 | ||
| AC011287.1 | RNA gene | 7 | 13235001 | 13240000 | 0.429 | 0.125 | −0.304 | −1.699 | 1.148 × 10⁻¹⁰ | 5.173 × 10⁻⁸ | 562 |
| 8 | 92330001 | 92335000 | 0.476 | 0.164 | −0.312 | −1.479 | 1.154 × 10⁻¹⁰ | 5.173 × 10⁻⁸ | 564 | ||
| CD96 | Protein coding | 3 | 111620001 | 111625000 | 0.468 | 0.153 | −0.316 | −1.557 | 1.178 × 10⁻¹⁰ | 5.233 × 10⁻⁸ | 569 |
| 8 | 8945001 | 8950000 | 0.456 | 0.143 | −0.313 | −1.607 | 1.183 × 10⁻¹⁰ | 5.233 × 10⁻⁸ | 571 | ||
| MRPL33, BABAM2 | Protein coding | 2 | 27980001 | 27985000 | 0.467 | 0.165 | −0.302 | −1.449 | 1.378 × 10⁻¹¹ | 1.514 × 10⁻⁸ | 573 |
| TEX15 | Protein coding | 8 | 30855001 | 30860000 | 0.561 | 0.212 | −0.349 | −1.361 | 1.055 x 10⁻¹⁰ | 4.956 x 10⁻⁸ | 574 |
| 14 | 51125001 | 51130000 | 0.116 | 0.417 | 0.301 | 1.763 | 3.558 × 10⁻¹¹ | 2.495 × 10⁻⁸ | 581 | ||
| AC008676.3, ADAM19 | Protein coding | 5 | 157425001 | 157430000 | 0.598 | 0.160 | −0.437 | −1.835 | 1.322 × 10⁻¹⁰ | 5.680 × 10⁻⁸ | 588 |
| 4 | 184025001 | 184030000 | 0.433 | 0.133 | −0.300 | −1.634 | 8.532 × 10⁻¹¹ | 4.382 × 10⁻⁸ | 590 | ||
| COG2 | Protein coding | 1 | 230645001 | 230650000 | 0.409 | 0.087 | −0.323 | −2.117 | 1.358 × 10⁻¹⁰ | 5.756 × 10⁻⁸ | 596 |
| ATF2 | Protein coding | 2 | 175125001 | 175130000 | 0.414 | 0.115 | −0.300 | −1.767 | 4.230 × 10⁻¹² | 7.608 × 10⁻⁹ | 599 |
| 7 | 134975001 | 134980000 | 0.406 | 0.107 | −0.298 | −1.825 | 5.356 × 10⁻¹¹ | 3.172 × 10⁻⁸ | 610 | ||
| LINC01320 | RNA gene (ncRNA) | 2 | 34325001 | 34330000 | 0.525 | 0.156 | −0.369 | −1.691 | 1.510 × 10⁻¹⁰ | 6.206 × 10⁻⁸ | 615 |
| ADAMTS6 | 5 | 65405001 | 65410000 | 0.443 | 0.134 | −0.309 | −1.654 | 1.531 × 10⁻¹⁰ | 6.251 × 10⁻⁸ | 619 | |
| AC013356.1 | Pseudogene | 15 | 40480001 | 40485000 | 0.432 | 0.129 | −0.303 | −1.667 | 1.554 × 10⁻¹⁰ | 6.314 × 10⁻⁸ | 621 |
| AL050403.2 | RNA gene | 20 | 10735001 | 10740000 | 0.554 | 0.171 | −0.383 | −1.640 | 1.555 × 10⁻¹⁰ | 6.314 × 10⁻⁸ | 622 |
| MANSC1 | Protein coding | 12 | 12345001 | 12350000 | 0.482 | 0.172 | −0.310 | −1.434 | 1.571 × 10⁻¹⁰ | 6.354 × 10⁻⁸ | 625 |
| UAP1 | Protein coding | 1 | 162575001 | 162580000 | 0.410 | 0.114 | −0.296 | −1.762 | 6.338 × 10⁻¹² | 9.887 × 10⁻⁹ | 628 |
| AP000311.1, ITSN1 | Protein coding | 21 | 33710001 | 33715000 | 0.408 | 0.112 | −0.296 | −1.773 | 9.062 × 10⁻¹¹ | 4.580 × 10⁻⁸ | 630 |
| NRG1 | Protein coding | 8 | 32550001 | 32555000 | 0.421 | 0.125 | −0.296 | −1.675 | 1.996 × 10⁻¹² | 5.283 × 10⁻⁹ | 632 |
| LINC01470 | RNA gene (ncRNA) | 5 | 152940001 | 152945000 | 0.483 | 0.160 | −0.323 | −1.538 | 1.668 × 10⁻¹⁰ | 6.602 × 10⁻⁸ | 638 |
| FOXN3 | Protein coding | 14 | 89165001 | 89170000 | 0.566 | 0.208 | −0.359 | −1.404 | 1.672 × 10⁻¹⁰ | 6.602 × 10⁻⁸ | 640 |
| GPM6B | Protein coding | X | 13840001 | 13845000 | 0.528 | 0.152 | −0.376 | −1.730 | 1.729 × 10⁻¹⁰ | 6.795 × 10⁻⁸ | 643 |
| 7 | 158605001 | 158610000 | 0.200 | 0.519 | 0.319 | 1.333 | 3.342 × 10⁻¹¹ | 2.427 × 10⁻⁸ | 651 | ||
| 12 | 59475001 | 59480000 | 0.273 | 0.687 | 0.414 | 1.332 | 1.031 × 10⁻¹⁴ | 2.605 × 10⁻¹⁰ | 653 | ||
| FOXN3 | Protein coding | 14 | 89345001 | 89350000 | 0.479 | 0.131 | −0.348 | −1.796 | 1.893 × 10⁻¹⁰ | 7.201 × 10⁻⁸ | 664 |
| LINC01098 | RNA gene (ncRNA) | 4 | 177930001 | 177935000 | 0.609 | 0.212 | −0.397 | −1.478 | 1.914 × 10⁻¹⁰ | 7.261 × 10⁻⁸ | 666 |
© 2019 by the authors. Licensee MDPI, Basel, Switzerland. This article is an open access article distributed under the terms and conditions of the Creative Commons Attribution (CC BY) license (http://creativecommons.org/licenses/by/4.0/).
Share and Cite
AL-Eitan, L.N.; Alghamdi, M.A.; Tarkhan, A.H.; Al-Qarqaz, F.A. Genome-Wide Tiling Array Analysis of HPV-Induced Warts Reveals Aberrant Methylation of Protein-Coding and Non-Coding Regions. Genes 2020, 11, 34. https://doi.org/10.3390/genes11010034
AL-Eitan LN, Alghamdi MA, Tarkhan AH, Al-Qarqaz FA. Genome-Wide Tiling Array Analysis of HPV-Induced Warts Reveals Aberrant Methylation of Protein-Coding and Non-Coding Regions. Genes. 2020; 11(1):34. https://doi.org/10.3390/genes11010034
Chicago/Turabian StyleAL-Eitan, Laith N., Mansour A. Alghamdi, Amneh H. Tarkhan, and Firas A. Al-Qarqaz. 2020. "Genome-Wide Tiling Array Analysis of HPV-Induced Warts Reveals Aberrant Methylation of Protein-Coding and Non-Coding Regions" Genes 11, no. 1: 34. https://doi.org/10.3390/genes11010034
APA StyleAL-Eitan, L. N., Alghamdi, M. A., Tarkhan, A. H., & Al-Qarqaz, F. A. (2020). Genome-Wide Tiling Array Analysis of HPV-Induced Warts Reveals Aberrant Methylation of Protein-Coding and Non-Coding Regions. Genes, 11(1), 34. https://doi.org/10.3390/genes11010034