The Hot QTL Locations for Potassium, Calcium, and Magnesium Nutrition and Agronomic Traits at Seedling and Maturity Stages of Wheat under Different Potassium Treatments


Abstract
1. Introduction
2. Materials and Methods
2.1. Plant Materials
2.2. Experimental Design
2.2.1. Hydroponic Culture Trial
2.2.2. Field Trial
2.3. Trait Measurements
2.4. Data Analysis
2.5. Naming Method of QTLs
3. Results
3.1. Phenotypic Variation and Correlations Between Traits
3.2. Major Characteristics of the QTLs in Different Trials
3.2.1. Hydroponic Culture Trial
3.2.2. Field Trial
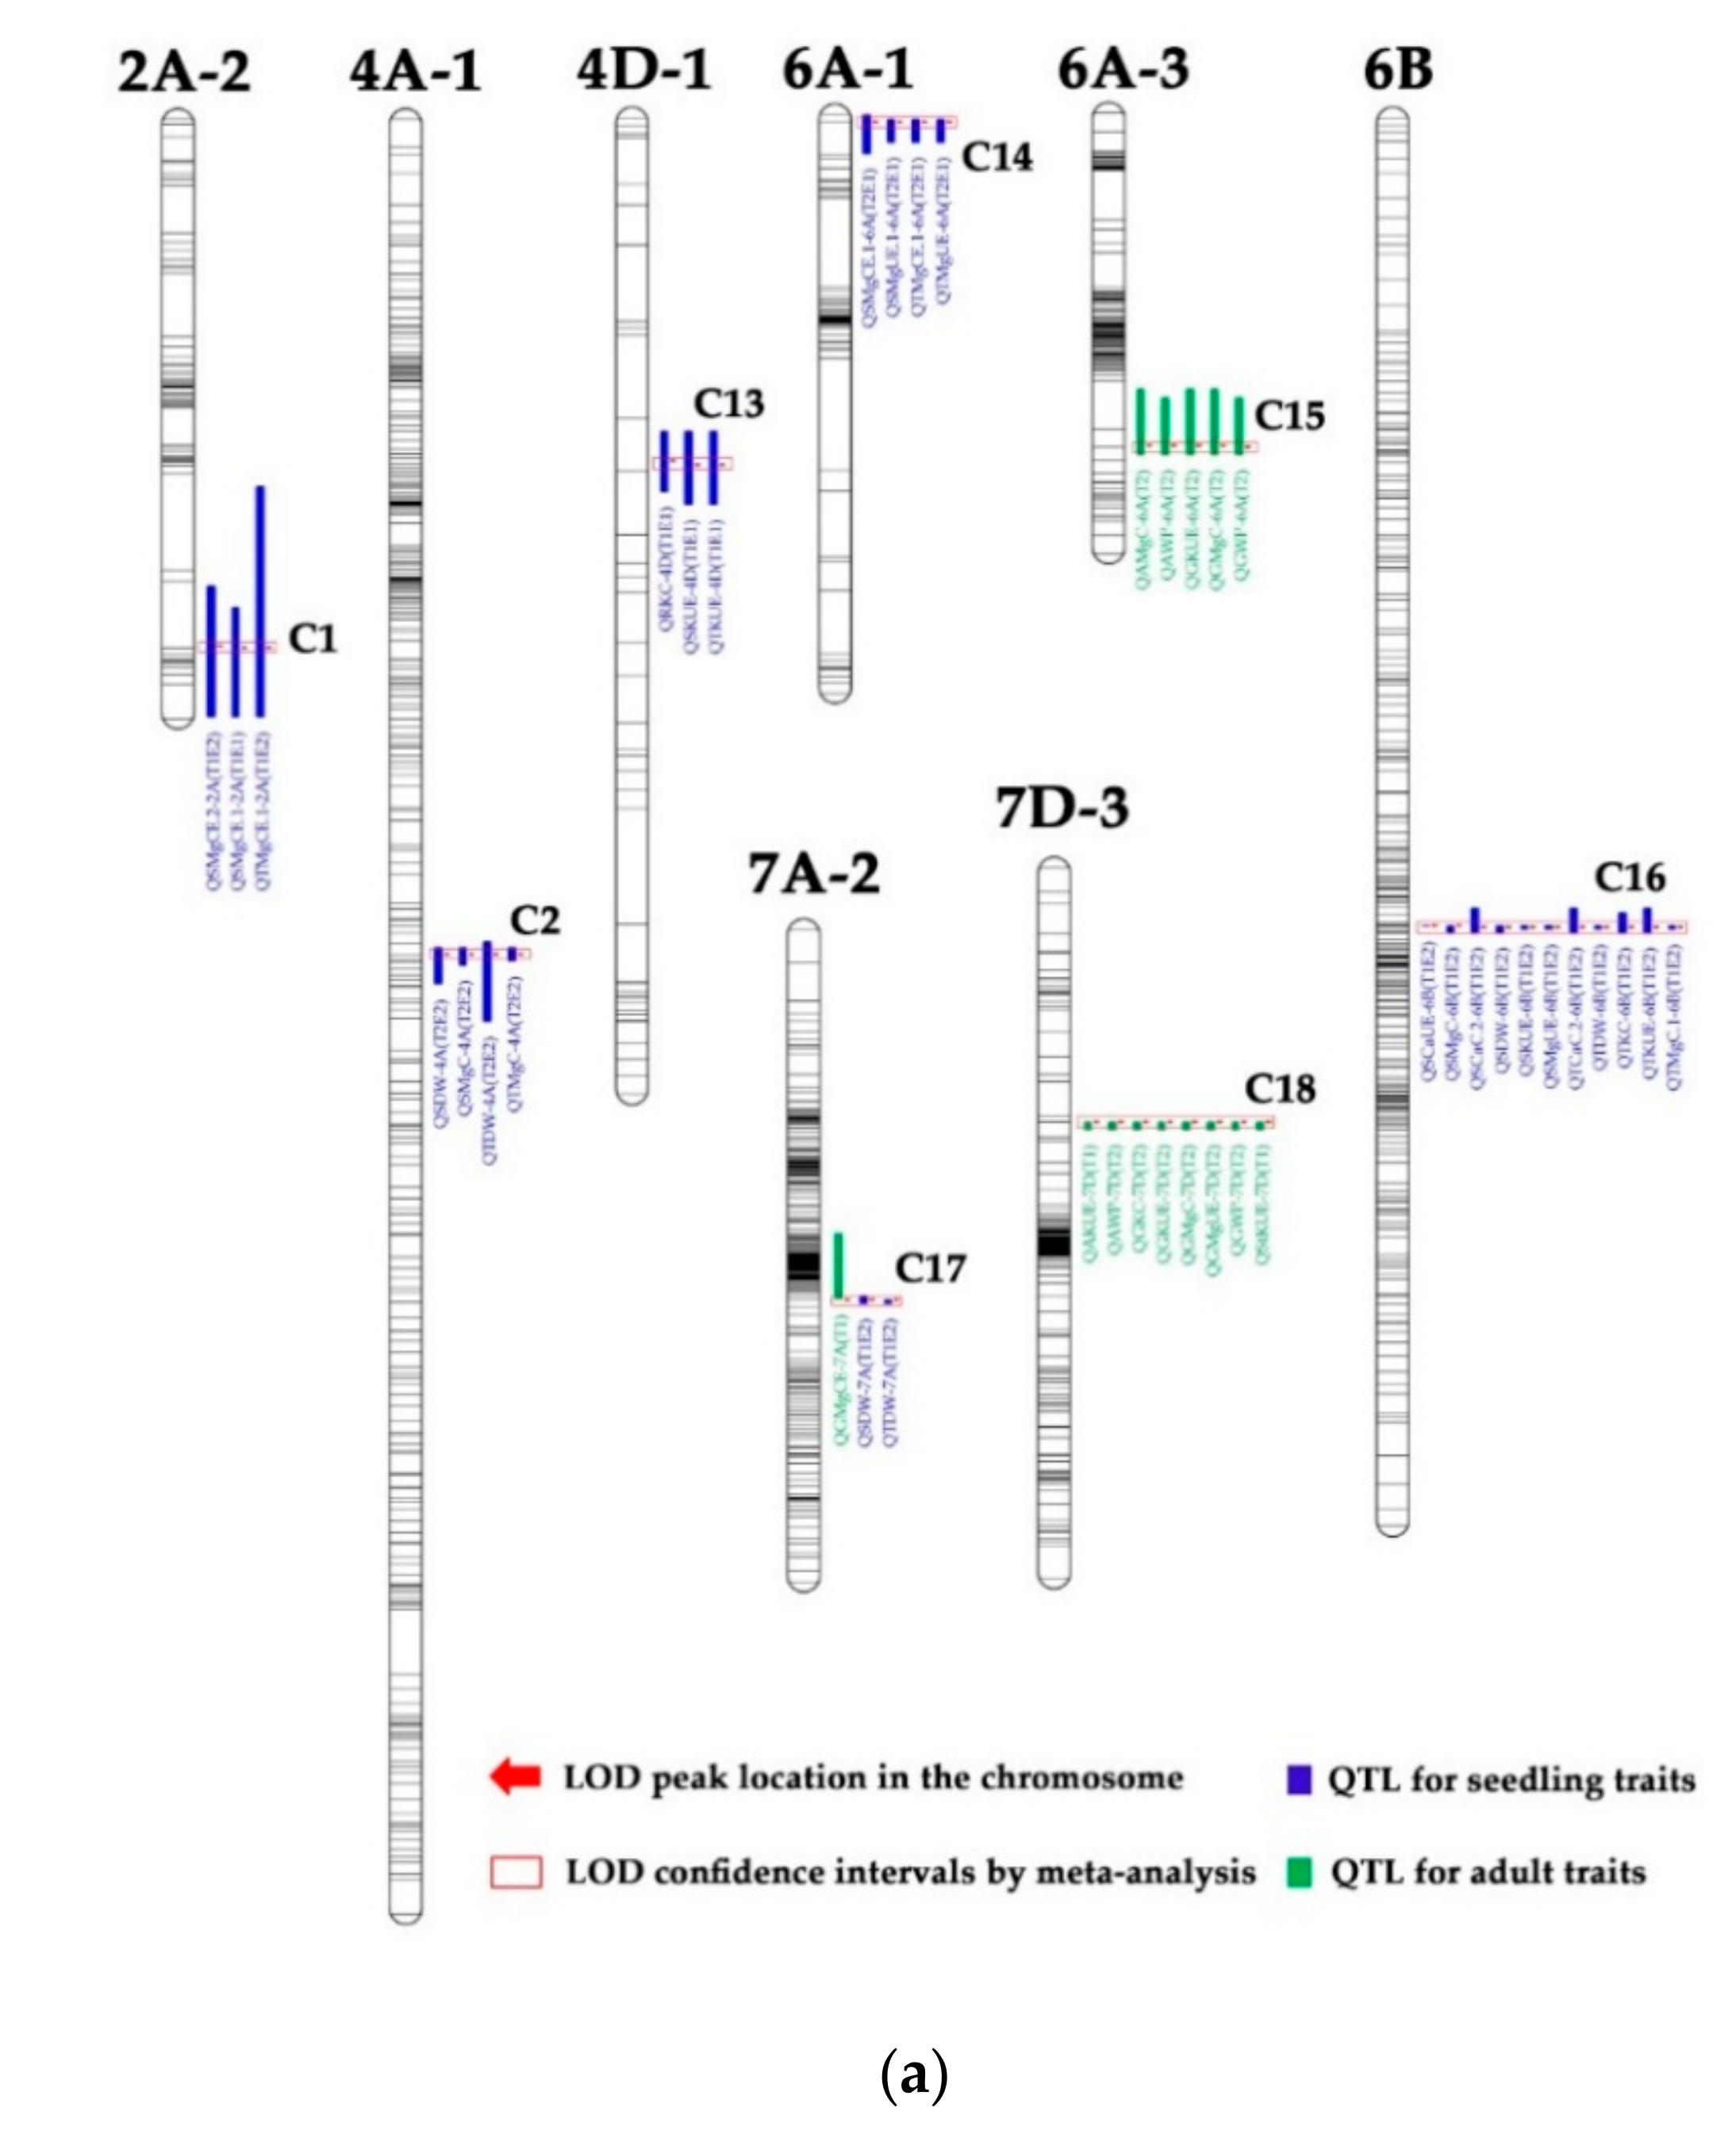
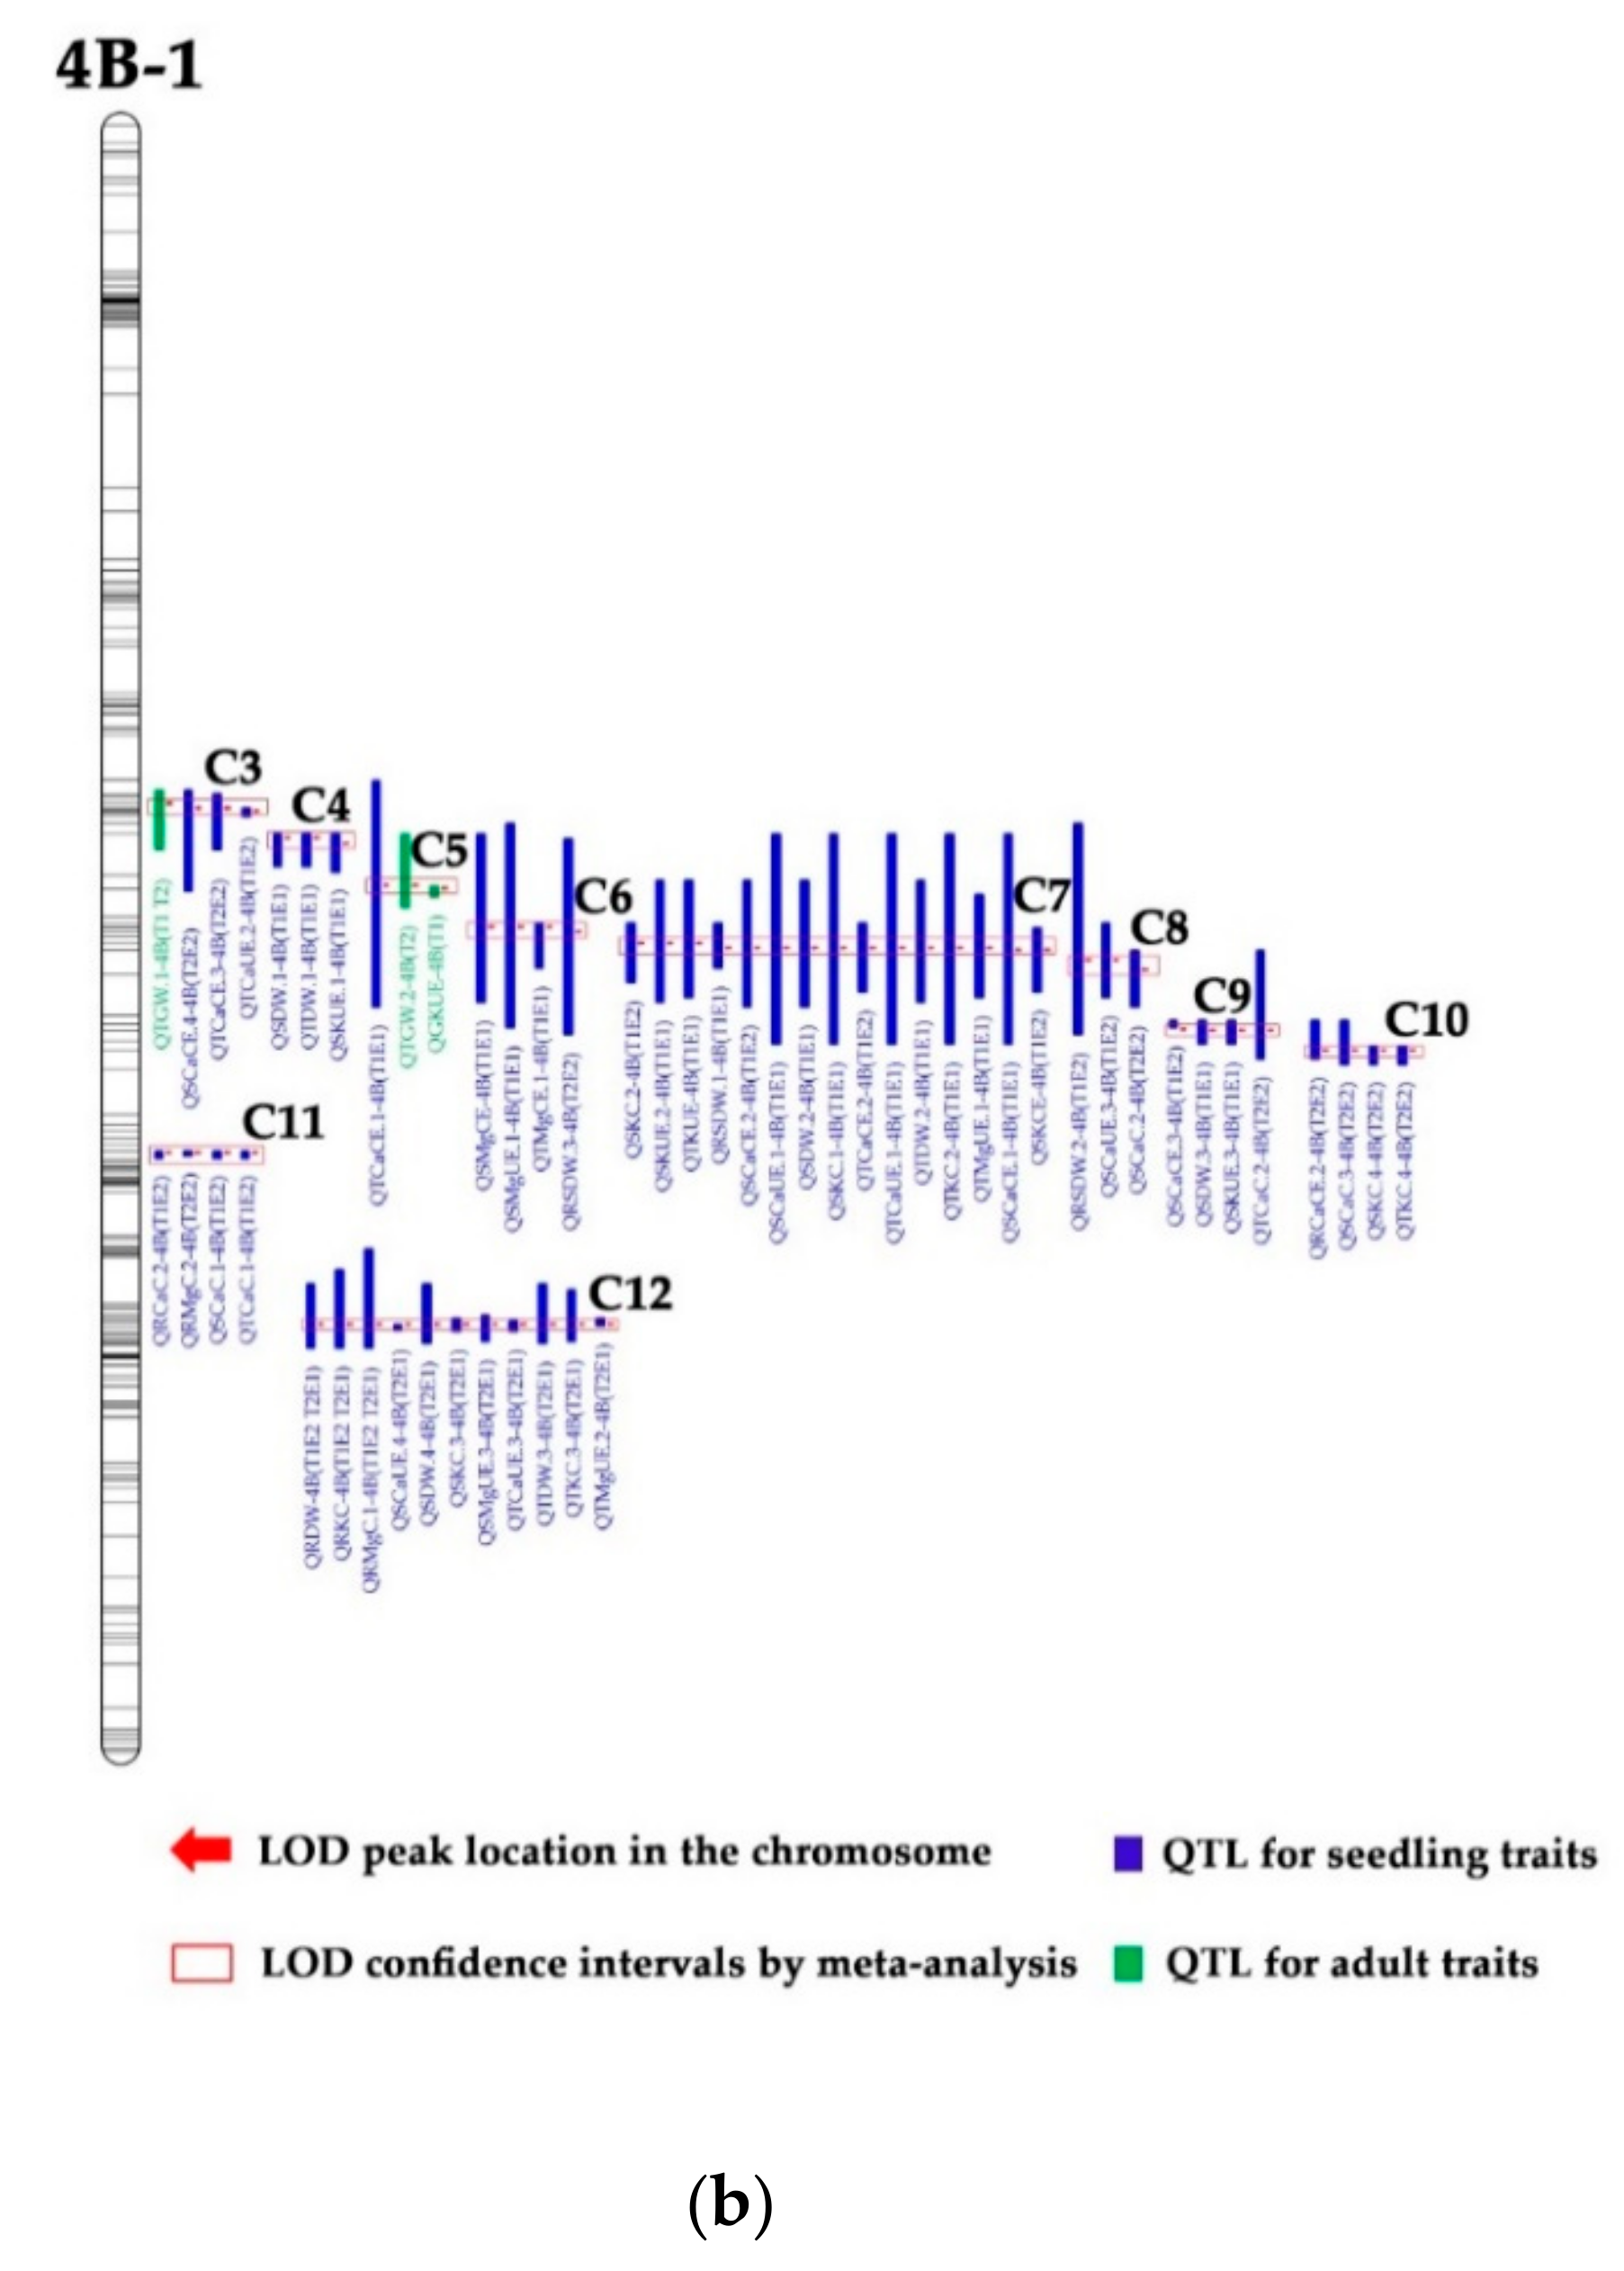
3.3. QTL Clusters
4. Discussion
4.1. K Effects on Biomass, K-, Ca-, and Mg-Related Traits of the RIL Population
4.2. K Effects on QTLs for K, Ca, and Mg Efficiency-Related Traits
4.3. Hot QTL Clusters for K, Ca, and Mg Efficiency-Related Traits
4.4. The Importance of the 4B Chromosome
Supplementary Materials
Author Contributions
Funding
Acknowledgments
Conflicts of Interest
References
- Wang, Y.; Wu, W.H. Genetic approaches for improvement of the crop potassium acquisition and utilization efficiency. Plant Biol. 2015, 25, 46–52. [Google Scholar] [CrossRef] [PubMed]
- Kettlewell, P.S.; Cook, J.W.; Parry, D.W. Evidence for an osmotic mechanism in the control of powdery mildew disease of wheat by foliar-applied potassium chloride. Eur. J. Plant Pathol. 2000, 106, 297–300. [Google Scholar] [CrossRef]
- Regmi, A.P.; Ladha, J.K.; Pasuquin, E.M.; Pathak, H.; Hobbs, P.R.; Shrestha, L.L.; Gharti, D.B.; Duveiller, E. The role of potassium in sustaining yields in a long-term rice-wheat experiment in the Indo-Gangetic plains of Nepal. Biol. Fert. Soils 2002, 36, 240–247. [Google Scholar] [CrossRef]
- Mann, R.L.; Kettlewell, P.S.; Jenkinson, P. Effect of foliar-applied potassium chloride on septoria leaf blotch of winter wheat. Plant Pathol. 2004, 53, 653–659. [Google Scholar] [CrossRef]
- Sharma, R.C.; Duveiller, E. Effect of helminthosporium leaf blight on performance of timely and late-seeded wheat under optimal and stressed levels of soil fertility and moisture. Field Crops Res. 2004, 89, 205–218. [Google Scholar] [CrossRef]
- Amtmann, A.; Troufflard, S.; Armengaud, P. The effect of potassium nutrition on pest and disease resistance in plants. Physiol. Plant. 2008, 133, 682–691. [Google Scholar] [CrossRef] [PubMed]
- Zhou, L.; He, H.L.; Liu, R.F.; Han, Q.; Shou, H.X.; Liu, B. Overexpression of GmAKT2 potassium channel enhances resistance to soybean mosaic virus. BMC Plant Biol. 2014, 14, 154. [Google Scholar] [CrossRef]
- Jan, A.U.; Hadi, A.; Midrarullah; Nawaz, M.A.; Rahman, K. Potassium and zinc increase tolerance to salt stress in wheat (Triticum aestivum L.). Plant Physiol. Bioc. 2017, 116, 139–149. [Google Scholar] [CrossRef]
- Christian, Z.R.; Mehmet, S.; Edgar, P. Potassium in agriculture--status and perspectives. J. Plant Physiol. 2014, 171, 656–669. [Google Scholar] [CrossRef]
- Duveiller, E. Controlling foliar blights of wheat in the rice-wheat systems of Asia. Plant Dis. 2004, 88, 552–556. [Google Scholar] [CrossRef]
- Heenan, D.P.; Campbell, L.C. Influence of potassium and manganese on growth and uptake of magnesium by soybeans (Glycine max (L.) Merr. cv. Bragg). Plant Soil. 1981, 61, 447–456. [Google Scholar] [CrossRef]
- Ohno, T.; Grunes, D.L. Potassium-magnesium interactions affecting nutrient uptake by wheat forage. Soil Sci. Soc. Am. J. 1985, 49, 685–690. [Google Scholar] [CrossRef]
- Ding, Y.; Luo, W.L.; Xu, G.H. Characterisation of magnesium nutrition and interaction of magnesium and potassium in rice. Ann. Appl. Biol. 2006, 149, 111–123. [Google Scholar] [CrossRef]
- Grauer, U.E.; Horst, W.J. Modeling cation amelioration of aluminum phytotoxicity. Soil Sci. Soc. Am. J. 1992, 56, 166–172. [Google Scholar] [CrossRef]
- Tomoaki, H.; Brodsky, D.E.; Alex, C.; Toshiyuki, K.; Fiorella, L.S.; Maki, K.; Schroeder, J.I. K+ transport by the OsHKT2;4 Transporter from rice with atypical Na+ transport properties and competition in permeation of K+ over Mg2+ and Ca2+ ions. Plant Physiol. 2011, 156, 1493–1507. [Google Scholar] [CrossRef]
- Wiesenberger, G.; Steinleitner, K.; Malli, R.; Graier, W.F.; Vormann, J.; Schweyen, R.J.; Stadler, J.A. Mg2+ deprivation elicits rapid Ca2+ uptake and activates Ca2+/calcineurin signaling in Saccharomyces cerevisiae. Eukaryot Cell 2007, 6, 592–599. [Google Scholar] [CrossRef] [PubMed]
- Grognet, P.; Lalucque, H.; Silar, P. The PaAlr1 magnesium transporter is required for ascospore development in Podospora anserina. Fungal Biol. 2012, 116, 1111–1118. [Google Scholar] [CrossRef] [PubMed]
- Frank, G.; Viets, F.G. Calcium and other polyvalent cations as accelerators of ion accumulation by excised barley roots. Plant Physiol. 1944, 19, 466–480. [Google Scholar] [CrossRef]
- Armengaud, P.; Breitling, R.; Amtmann, A. The potassium-dependent transcriptome of Arabidopsis reveals a prominent role of jasmonic acid in nutrient signaling. Plant Physiol. 2004, 136, 2556–2576. [Google Scholar] [CrossRef]
- Li, L.; Kim, B.G.; Cheong, Y.H.; Pandey, G.K.; Luan, S. A Ca2+ signaling pathway regulates a K+ channel for low-K response in Arabidopsis. Proc. Natl. Acad. Sci. USA 2006, 103, 12625–12630. [Google Scholar] [CrossRef]
- Xu, J.; Li, H.D.; Chen, L.Q.; Wang, Y.; Liu, L.L.; He, L.; Wu, W.H. A Protein kinase, interacting with two calcineurin B-like proteins, regulates K+ transporter AKT1 in Arabidopsis. Cell 2006, 125, 1347–1360. [Google Scholar] [CrossRef] [PubMed]
- Schachtman, D.P.; Schroeder, J.I. Structure and transport mechanism of a high-affinity potassium uptake transporter from higher plants. Nature 1994, 370, 655–658. [Google Scholar] [CrossRef] [PubMed]
- Doerge, R.W. Mapping and analysis of quantitative trait loci in experimental populations. Nat. Rev. Genet. 2002, 3, 43–52. [Google Scholar] [CrossRef] [PubMed]
- Amkul, K.; Laosatit, K.; Somta, P.; Shim, S.; Lee, S.H.; Tanya, P.; Srinives, P. Mapping of QTLs for seed phorbol esters, a toxic chemical in Jatropha curcas (L.). Genes 2017, 8, 205. [Google Scholar] [CrossRef] [PubMed]
- Kumar, S.; Hash, C.T.; Nepolean, T.; Mahendarkar, M.D.; Singh, G.; Satyavathi, C.T.; Rathore, A.; Gupta, R.; Yadav, R.S.; Srivastava, R.K. Mapping grain iron and zinc content QTLs in an iniadi-derived immortal population of pearl millet. Genes 2018, 9, 248. [Google Scholar] [CrossRef] [PubMed]
- Peleg, Z.; Cakmak, I.; Ozturk, L.; Yazici, A.; Jun, Y.; Budak, H.; Korol, A.B.; Fahima, T.; Saranga, Y. Quantitative trait loci conferring grain mineral nutrient concentrations in durum wheat × wild emmer wheat RIL population. Theor. Appl. Genet. 2009, 119, 353–369. [Google Scholar] [CrossRef]
- Fontaine, J.X.; Ravel, C.; Pageau, K.; Heumez, E.; Dubois, F.; Hirel, B.; Le Gouis, J. A quantitative genetic study for elucidating the contribution of glutamine synthetase, glutamate dehydrogenase and other nitrogen-related physiological traits to the agronomic performance of common wheat. Theor. Appl. Genet. 2009, 119, 645–662. [Google Scholar] [CrossRef]
- Kong, F.; Guo, Y.; Liang, X.; Wu, C.H.; Wang, Y.Y.; Zhao, Y.; Li, S.S. Potassium (K) effects and QTL mapping for K efficiency traits at seedling and adult stages in wheat. Plant Soil 2013, 373, 877–892. [Google Scholar] [CrossRef]
- Yuan, Y.Y.; Gao, M.G.; Zhang, M.X.; Zheng, H.H.; Zhou, X.W.; Guo, Y.; Zhao, Y.; Kong, F.M.; Li, S.S. QTL mapping for phosphorus efficiency and morphological traits at seedling and maturity stages in wheat. Front. Plant Sci. 2017, 8, 614. [Google Scholar] [CrossRef]
- Zhang, G.Z. Construction of High Density Genetic Linkage Map and QTL Analysis for Yield, Spike and Grain Size Traits in Wheat. Ph.D. Thesis, Shandong Agricultural University, Taian, China, 2014. (In Chinese with English abstract). [Google Scholar]
- Hoagland, D.R.; Arnon, D.I. The water-culture method for growing plants without soil. Calif. Agric. Exp. Stn. Circ. 1950, 347, 32. [Google Scholar] [CrossRef]
- Guo, Y.; Kong, F.M.; Xu, Y.F.; Zhao, Y.; Liang, X.; Wang, Y.Y.; An, D.G.; Li, S.S. QTL mapping for seedling traits in wheat grown under varying concentrations of N, P and K nutrients. Theor. Appl. Genet. 2012, 124, 851–865. [Google Scholar] [CrossRef] [PubMed]
- Wang, S.; Basten, C.; Zeng, Z. Windows QTL Cartographer 2.5; Department of Statistics, North Carolina State University: Raleigh, NC, USA, 2007. [Google Scholar]
- Churchill, G.A.; Doerge, R.W. Empirical threshold values for quantitative trait mapping. Genetics 1994, 138, 963–971. [Google Scholar] [CrossRef] [PubMed]
- Hermans, C.; Hammond, J.P.; White, P.J.; Verbruggen, N. How do plants respond to nutrient shortage by biomass allocation? Trends. Plant Sci. 2006, 11, 610–617. [Google Scholar] [CrossRef] [PubMed]
- Rengel, Z.; Damon, P. Crops and genotypes differ in efficiency of potassium uptake and use. Physiol. Plant. 2008, 133, 624–636. [Google Scholar] [CrossRef] [PubMed]
- Prince, A.L.; Zimmerman, M.; Bear, F.E. The magnesium supplying powers of 20 New Jersey soils. Soil Sci. 1947, 63, 69–78. [Google Scholar] [CrossRef]
- Fageria, N.K. Absorption of magnesium and its influence on the uptake of phosphorus, potassium, and calcium by intact groundnut plants. Plant Soil 1973, 40, 313–320. [Google Scholar] [CrossRef]
- Quarrie, S.A.; Steed, A.; Calestani, C.; Semikhodskii, A.; Lebreton, C.; Chinoy, C.; Steele, N.; Pljevljakusić, D.; Waterman, E.; Weyen, J.; et al. A high-density genetic map of hexaploid wheat (Triticum aestivum L.) from the cross Chinese Spring × SQ1 and its use to compare QTLs for grain yield across a range of environments. Theor. Appl. Genet. 2005, 110, 865–880. [Google Scholar] [CrossRef]
- An, D.G.; Su, J.Y.; Liu, Q.Y.; Zhu, Y.G.; Tong, Y.P.; Li, J.M.; Jing, R.L.; Li, B.; Li, Z.S. Mapping QTLs for nitrogen uptake in relation to the early growth of wheat (Triticum aestivum L.). Plant Soil 2006, 284, 73–84. [Google Scholar] [CrossRef]
- Habash, D.Z.; Stephanie, B.; Schondelmaier, J.; Jens, W.; Quarrie, S.A. The genetics of nitrogen use in hexaploid wheat: N utilisation, development and yield. Theor. Appl. Genet. 2007, 114, 403–419. [Google Scholar] [CrossRef]
- Laperche, A.; Gouis, J.L.; Hanocq, E.; Brancourt-Hulmel, M. Modelling nitrogen stress with probe genotypes to assess genetic parameters and genetic determinism of winter wheat tolerance to nitrogen constraint. Euphytica 2008, 161, 259–271. [Google Scholar] [CrossRef]


| Abbr. | Meaning | Units | Abbr. | Meaning | Units |
|---|---|---|---|---|---|
| Seedling Trait | Adult Trait | ||||
| RDW | Root dry weight per plant | mg·plant−1 | PH | Plant height | cm |
| SDW | Shoot dry weight per plant | mg·plant−1 | SN | Spike number | No. |
| RSDW | Ratio of root and shoot dry weight | GN | Grain number per spike | No. | |
| TDW | Total dry weight per plant | mg·plant−1 | TGW | Thousand grains weight | g |
| RKC | Root K content per plant | mg·plant−1 | GWP | Grain weight per plant | g/plant |
| SKC | Shoot K content per plant | mg·plant−1 | StWP | Straw weight per plant | g/plant |
| TKC | Total K content per plant | mg·plant−1 | AWP | Total aboveground weight per plant | g/plant |
| RCaC | Root Ca content per plant | mg·plant−1 | HI | Harvest index | |
| SCaC | Shoot Ca content per plant | mg·plant−1 | GKC | Grain K content per plant | mg/plant |
| TCaC | Total Ca content per plant | mg·plant−1 | StKC | Straw K content per plant | mg/plant |
| RMgC | Root Mg content per plant | mg·plant−1 | AKC | Aboveground K content per plant | mg/plant |
| SMgC | Shoot Mg content per plant | mg·plant−1 | GCaC | Grain Ca content per plant | mg/plant |
| TMgC | Total Mg content per plant | mg·plant−1 | StCaC | Straw Ca content per plant | mg/plant |
| RKCE | Concentration of root K | g/kg | ACaC | Aboveground Ca content per plant | mg/plant |
| SKCE | Concentration of shoot K | g/kg | GMgC | Grain Mg content per plant | mg/plant |
| TKCE | Concentration of total K | g/kg | StMgC | Straw Mg content per plant | mg/plant |
| RCaCE | Concentration of root Ca | g/kg | AMgC | Aboveground Mg content per plant | mg/plant |
| SCaCE | Concentration of shoot Ca | g/kg | GKCE | Concentration of grain K | g/kg |
| TCaCE | Concentration of total Ca | g/kg | StKCE | Concentration of straw K | g/kg |
| RMgCE | Concentration of root Mg | g/kg | AKCE | Concentration of aboveground K | g/kg |
| SMgCE | Concentration of shoot Mg | g/kg | GCaCE | Concentration of grain Ca | g/kg |
| TMgCE | Concentration of total Mg | g/kg | StCaCE | Concentration of straw Ca | g/kg |
| RKUE | Root K-use efficiency | mg/(µg·mg−1) | ACaCE | Concentration of aboveground Ca | g/kg |
| SKUE | Shoot K-use efficiency | mg/(µg·mg−1) | GMgCE | Concentration of grain Mg | g/kg |
| TKUE | Total K-use efficiency | mg/(µg·mg−1) | StMgCE | Concentration of straw Mg | g/kg |
| RCaUE | Root Ca-use efficiency | mg/(µg·mg−1) | AMgCE | Concentration of aboveground Mg | g/kg |
| SCaUE | Shoot Ca-use efficiency | mg/(µg·mg−1) | GKUE | Grain K-use efficiency | g/(mg·g−1) |
| TCaUE | Total Ca-use efficiency | mg/(µg·mg−1) | StKUE | Straw K-use efficiency | g/(mg·g−1) |
| RMgUE | Root Mg-use efficiency | mg/(µg·mg−1) | AKUE | Aboveground K-use efficiency | g/(mg·g−1) |
| SMgUE | Shoot Mg-use efficiency | mg/(µg·mg−1) | GCaUE | Grain Ca-use efficiency | g/(mg·g−1) |
| TMgUE | Total Mg-use efficiency | mg/(µg·mg−1) | StCaUE | Straw Ca-use efficiency | g/(mg·g−1) |
| ACaUE | Aboveground Ca-use efficiency | g/(mg·g−1) | |||
| GMgUE | Grain Mg-use efficiency | g/(mg·g−1) | |||
| StMgUE | Straw Mg-use efficiency | g/(mg·g−1) | |||
| AMgUE | Aboveground Mg-use efficiency | g/(mg·g−1) | |||
| KHI | K harvest index | ||||
| CaHI | Ca harvest index | ||||
| MgHI | Mg harvest index | ||||
| Treatment | Traits e | Average f | Traits e | Average f | Traits e | Average f |
|---|---|---|---|---|---|---|
| CKE1 | RKCE | 34.05a | RCaCE | 0.99b | RMgCE | 0.60a |
| LKE1 | g/kg | 15.99b | g/kg | 1.53a | g/kg | 0.59a |
| CKE2 | 26.95a | 1.45b | 0.77a | |||
| LKE2 | 5.10b | 2.06a | 0.78a | |||
| CKE1 | SKCE | 43.72a | SCaCE | 4.60b | SMgCE | 2.39b |
| LKE1 | g/kg | 21.42b | g/kg | 9.32a | g/kg | 2.98a |
| CKE2 | 43.66a | 7.38b | 2.53b | |||
| LKE2 | 12.27b | 10.32a | 3.79a | |||
| CKE1 | TKCE | 41.98a | TCaCE | 3.94b | TMgCE | 2.06b |
| LKE1 | g/kg | 20.11b | g/kg | 7.43a | g/kg | 2.41a |
| CKE2 | 39.92a | 6.04b | 2.13b | |||
| LKE2 | 10.41b | 8.18a | 3.02a | |||
| CKE1 | RKC | 0.67a | RCaC | 18.79b | RMgC | 11.83a |
| LKE1 | mg/plant | 0.30b | µg/plant | 27.91a | µg/plant | 11.09a |
| CKE2 | 0.58a | 30.62b | 16.46a | |||
| LKE2 | 0.10b | 38.08a | 14.80b | |||
| CKE1 | SKC | 3.90a | SCaC | 407.64b | SMgC | 211.81a |
| LKE1 | mg/plant | 1.25b | µg/plant | 543.87a | µg/plant | 174.41b |
| CKE2 | 3.20a | 535.38b | 183.47b | |||
| LKE2 | 0.67b | 556.82a | 205.70a | |||
| CKE1 | TKC | 4.57a | TCaC | 426.44b | TMgC | 223.64a |
| LKE1 | mg/plant | 1.55b | µg/plant | 571.11a | µg/plant | 185.59b |
| CKE2 | 3.78a | 566.00b | 199.93b | |||
| LKE2 | 0.77b | 594.85a | 220.53a | |||
| CKE1 | RKUE | 0.58b | RCaUE | 23.12a | RMgUE | 36.01a |
| LKE1 | mg/(µg∙mg−1) | 1.17a | mg/(µg∙mg−1) | 15.40b | mg/(µg∙mg−1) | 36.31b |
| CKE2 | 0.79b | 16.40a | 27.97a | |||
| LKE2 | 3.73a | 10.01b | 24.40b | |||
| CKE1 | SKUE | 2.07b | SCaUE | 20.54a | SMgUE | 38.84a |
| LKE1 | mg/(µg∙mg−1) | 2.76a | mg/(µg∙mg−1) | 6.51b | mg/(µg∙mg−1) | 20.12b |
| CKE2 | 1.70b | 10.30a | 29.56a | |||
| LKE2 | 4.56a | 5.43b | 14.48b | |||
| CKE1 | TKUE | 2.63b | TCaUE | 29.14a | TMgUE | 54.57a |
| LKE1 | mg/(µg∙mg−1) | 3.86a | mg/(µg∙mg−1) | 10.75b | mg/(µg∙mg−1) | 32.80b |
| CKE2 | 2.40b | 16.21a | 45.14a | |||
| LKE2 | 7.19a | 9.22b | 24.52b |
| Treatment | Traits e | Average f | Traits e | Average f | Traits e | Average f |
|---|---|---|---|---|---|---|
| CK | GKCE | 3.78a | GCaCE | 0.40a | GMgCE | 1.46b |
| LK | g/kg | 3.10b | g/kg | 0.41a | g/kg | 1.49a |
| CK | StKCE | 21.17a | StCaCE | 3.68b | StMgCE | 1.54b |
| LK | g/kg | 16.03b | g/kg | 4.39a | g/kg | 1.60a |
| CK | AKCE | 12.84a | ACaCE | 2.11b | AMgCE | 1.50b |
| LK | g/kg | 9.81b | g/kg | 2.48a | g/kg | 1.54a |
| CK | GKC | 73.00a | GCaC | 7.73a | GMgC | 28.12a |
| LK | mg/plant | 53.66b | mg/plant | 7.12b | mg/plant | 25.78b |
| CK | StKC | 450.24a | StCaC | 78.48a | StMgC | 32.76a |
| LK | mg/plant | 304.83b | mg/plant | 82.62a | mg/plant | 29.96b |
| CK | AKC | 523.68a | ACaC | 86.20a | AMgC | 60.84a |
| LK | mg/plant | 358.44b | mg/plant | 89.71a | mg/plant | 55.72b |
| CK | KHI | 0.14b | CaHI | 0.09a | MgHI | 0.47a |
| LK | 0.16a | 0.08b | 0.46a | |||
| CK | GKUE | 5.20b | GCaUE | 51.49a | GMgUE | 13.26a |
| LK | g/(mg·g−1) | 5.62a | g/(mg·g−1) | 48.53b | g/(mg·g−1) | 11.69b |
| CK | StKUE | 1.03b | StCaUE | 5.95a | StMgUE | 14.07a |
| LK | g/(mg·g−1) | 1.21a | g/(mg·g−1) | 4.46b | g/(mg·g−1) | 12.08b |
| CK | AKUE | 3.22b | ACaUE | 19.71a | AMgUE | 27.19a |
| LK | g/(mg·g−1) | 3.67a | g/(mg·g−1) | 15.28b | g/(mg·g−1) | 23.62b |
| Traits | QTLs | Treatment | Marker Intervals | Additive Effects | Contributions (%) | ||||
|---|---|---|---|---|---|---|---|---|---|
| Min | Max | Average | Min | Max | Average | ||||
| Hydroponic culture trial | |||||||||
| RMgC | QRMgC.1-4B (T1E2 T2E1) | CK, LK | Tdurum_contig37811_134 wsnp_RFL_Contig3236_3262140 | 1.21 | 1.25 | 1.23 | 7.44 | 10.32 | 8.88 |
| RKC | QRKC-4B (T1E2 T2E1) | CK, LK | Tdurum_contig37811_134 wsnp_RFL_Contig3236_3262140 | 0.03 | 0.05 | 0.04 | 9.43 | 11.56 | 10.50 |
| RDW | QRDW-4B (T1E2 T2E1) | CK, LK | Tdurum_contig37811_134 wsnp_RFL_Contig3236_3262140 | 1.53 | 2.44 | 1.98 | 7.76 | 17.42 | 12.59 |
| Field trial | |||||||||
| TGW | QTGW.1-4B(TI T2) | CK, LK | D−1098436-D−1103601 | 0.93 | 1.09 | 1.01 | 7.18 | 8.98 | 8.08 |
| Type | Code | Chromosome | Marker Intervals | No. of QTLs | QTLs for Seedling Traits | QTLs for Adult Traits | |||
|---|---|---|---|---|---|---|---|---|---|
| I | C1 | 2A-2 | wPt−1480-D-4008129 | 3 | QSMgCE.1-2A (T1E1) | QSMgCE.2-2A (T1E2) | QTMgCE.1-2A (T1E2) | ||
| C2 | 4A−1 | S-3957023-S−1073520 | 4 | QTDW-4A (T2E2) | QSDW-4A (T2E2) | QSMgC-4A (T2E2) | |||
| QTMgC-4A (T2E2) | |||||||||
| C4 | 4B−1 | D−111318-Ku_c63300_1309 | 3 | QSDW.1-4B (T1E1) | QTDW.1-4B (T1E1) | QSKUE.1-4B (T1E1) | |||
| C6 | 4B−1 | D-3940950-D−1673295 | 4 | QSMgUE.1-4B (T1E1) | QSMgCE-4B (T1E1) | QTMgCE.1-4B (T1E1) | |||
| QRSDW.3-4B (T2E2) | |||||||||
| C7 | 4B−1 | S-3941408-D−1138250 | 15 | QSKUE.2-4B (T1E1) | QTKUE-4B (T1E1) | QSKC.2-4B (T1E2) | |||
| QSCaUE.1-4B (T1E1) | QSKC.1-4B (T1E1) | QTCaUE.1-4B (T1E1) | |||||||
| QTKC.2-4B (T1E1) | QSCaCE.2-4B (T1E2) | QSDW.2-4B (T1E1) | |||||||
| QTDW.2-4B (T1E1) | QTMgUE.1-4B (T1E1) | QRSDW.1-4B (T1E1) | |||||||
| QTCaCE.2-4B (T1E2) | QSCaCE.1-4B (T1E1) | QSKCE-4B (T1E2) | |||||||
| C8 | 4B−1 | D-4008856-D-3943712 | 3 | QRSDW.2-4B (T1E2) | QSCaUE.3-4B (T1E2) | QSCaC.2-4B (T2E2) | |||
| C9 | 4B−1 | D−1302339-D-3024409 | 4 | QSCaCE.3-4B (T1E2) | QTCaC.2-4B (T2E2) | QSDW.3-4B (T1E1) | |||
| QSKUE.3-4B (T1E1) | |||||||||
| C10 | 4B−1 | D−1380792-D−1094306 | 4 | QRCaCE.2-4B (T2E2) | QSCaC.3-4B (T2E2) | QSKC.4-4B (T2E2) | |||
| QTKC.4-4B (T2E2) | |||||||||
| C11 | 4B−1 | wmc657-D−1666781 | 4 | QRCaC.2-4B (T1E2) | QRMgC.2-4B (T2E2) | QSCaC.1-4B (T1E2) | |||
| QTCaC.1-4B (T1E2) | |||||||||
| C12 | 4B−1 | Tdurum_contig37811_134- | 11 | QRMgC.1-4B (T1E2 T2E1) | QRKC-4B (T1E2 T2E1) | QRDW-4B (T1E2 T2E1) | |||
| wsnp _RFL_Contig3236_3262140 | QSDW.4-4B (T2E1) | QTDW.3-4B (T2E1) | QTKC.3-4B (T2E1) | ||||||
| QSMgUE.3-4B (T2E1) | QSKC.3-4B (T2E1) | QTMgUE.2-4B (T2E1) | |||||||
| QTCaUE.3-4B (T2E1) | QSCaUE.4-4B (T2E1) | ||||||||
| C13 | 4D−1 | wPt-732418-wmc825 | 3 | QRKC-4D (T1E1) | QSKUE-4D (T1E1) | QTKUE-4D (T1E1) | |||
| C14 | 6A−1 | S−1378596-D-3952397 | 4 | QSMgCE.1-6A (T2E1) | QSMgUE.1-6A (T2E1) | QTMgCE.1-6A (T2E1) | |||
| QTMgUE-6A (T2E1) | |||||||||
| C16 | 6B | D-3384656-D-3960242 | 11 | QSCaUE-6B (T1E2) | QSMgC-6B (T1E2) | QSCaC.2-6B (T1E2) | |||
| QTCaC.2-6B (T1E2) | QTKUE-6B (T1E2) | QTKC-6B (T1E2) | |||||||
| QSDW-6B (T1E2) | QSKUE-6B (T1E2) | QSMgUE-6B (T1E2) | |||||||
| QTDW-6B (T1E2) | QTMgC.1-6B (T1E2) | ||||||||
| II | C15 | 6A-3 | D-4329389-S−1091880 | 5 | QAMgC-6A (T2) | QAWP-6A (T2) | |||
| QGKUE-6A (T2) | QGMgC-6A (T2) | ||||||||
| QGWP-6A (T2) | |||||||||
| C18 | 7D-3 | D-3033829-D−1668160 | 8 | QAKUE-7D (T1) | QAWP-7D (T2) | ||||
| QGKC-7D (T2) | QGKUE-7D (T2) | ||||||||
| QGMgC-7D (T2) | QGMgUE-7D (T2) | ||||||||
| QGWP-7D (T2) | QStKUE-7D (T1) | ||||||||
| III | C3 | 4B−1 | D−1098436-D−1068778 | 4 | QSCaCE.4-4B (T2E2) | QTCaCE.3-4B (T2E2) | QTGW.1-4B (TI T2) | ||
| QTCaUE.2-4B (T1E2) | |||||||||
| C5 | 4B−1 | Ku_c63300_1309-D-3022151 | 3 | QTCaCE.1-4B (T1E1) | QTGW.2-4B (T2) | QGKUE-4B (T1) | |||
| C17 | 4B−1 | D-3025056-D-3956324 | 3 | QSDW-7A (T1E2) | QTDW-7A (T1E2) | QGMgCE-7A (T1) | |||
| Code/Type | Chromosomes | Marker Intervals | No. of QTLs | QTLs | |
|---|---|---|---|---|---|
| C3/II [29] | 4B−1 | D−1051883-D−1113185 | 3 | QSdw.1 | QTpute.1 |
| QGpute.1 | |||||
| C4/III | 4B−1 | D−1113185-Ku_c63300_1309 | 3 | QSDW.1-4B (T1E1) | QTDW.1-4B (T1E1) |
| QSKUE.1-4B (T1E1) | |||||
| C4/II [29] | 4B−1 | D-3022151-D−1040960 | 5 | QRspc.1 | QSn.2 |
| QSl | QGn.1 | ||||
| QRpc.2 | |||||
| C5/III | 4B−1 | Ku_c63300_1309-S−1040960 | 4 | QTCaCE.1-4B (T1E1) | QTGW.2-4B (T2) |
| QGKUE-4B (T1) | |||||
| C5/II [29] | 4B−1 | D−1083795-D-3940950 | 8 | QSdw.2 | QTdw |
| QRsdw | QSpute.2 | ||||
| QTpute.2 | QSn.3 | ||||
| QGwp | QGpute.2 | ||||
| C6/I | 4B−1 | D-3940950-D−1673295 | 4 | QSMgUE.1-4B (T1E1) | QSMgCE-4B (T1E1) |
| QTMgCE.1-4B (T1E1) | QRSDW.3-4B (T2E2) | ||||
| C6/II [29] | 4B−1 | D-4008856-D−1138250 | 4 | QGn.2 | QRspc.2 |
| QSdw.3 | QPh | ||||
| C7/I | 4B−1 | S-3941408 - D−1138250 | 15 | QSKUE.2-4B (T1E1) | QTKUE-4B (T1E1) |
| QSKC.2-4B (T1E2) | QSCaUE.1-4B (T1E1) | ||||
| QSKC.1-4B (T1E1) | QTCaUE.1-4B (T1E1) | ||||
| QTKC.2-4B (T1E1) | QSCaCE.2-4B (T1E2) | ||||
| QSDW.2-4B (T1E1) | QTDW.2-4B (T1E1) | ||||
| QTMgUE.1-4B (T1E1) | QRSDW.1-4B (T1E1) | ||||
| QTCaCE.2-4B (T1E2) | QSCaCE.1-4B (T1E1) | ||||
| QSKCE.-4B (T1E2) | |||||
© 2019 by the authors. Licensee MDPI, Basel, Switzerland. This article is an open access article distributed under the terms and conditions of the Creative Commons Attribution (CC BY) license (http://creativecommons.org/licenses/by/4.0/).
Share and Cite
Shen, X.; Yuan, Y.; Zhang, H.; Guo, Y.; Zhao, Y.; Li, S.; Kong, F. The Hot QTL Locations for Potassium, Calcium, and Magnesium Nutrition and Agronomic Traits at Seedling and Maturity Stages of Wheat under Different Potassium Treatments. Genes 2019, 10, 607. https://doi.org/10.3390/genes10080607
Shen X, Yuan Y, Zhang H, Guo Y, Zhao Y, Li S, Kong F. The Hot QTL Locations for Potassium, Calcium, and Magnesium Nutrition and Agronomic Traits at Seedling and Maturity Stages of Wheat under Different Potassium Treatments. Genes. 2019; 10(8):607. https://doi.org/10.3390/genes10080607
Chicago/Turabian StyleShen, Xing, Yapei Yuan, Han Zhang, Ying Guo, Yan Zhao, Sishen Li, and Fanmei Kong. 2019. "The Hot QTL Locations for Potassium, Calcium, and Magnesium Nutrition and Agronomic Traits at Seedling and Maturity Stages of Wheat under Different Potassium Treatments" Genes 10, no. 8: 607. https://doi.org/10.3390/genes10080607
APA StyleShen, X., Yuan, Y., Zhang, H., Guo, Y., Zhao, Y., Li, S., & Kong, F. (2019). The Hot QTL Locations for Potassium, Calcium, and Magnesium Nutrition and Agronomic Traits at Seedling and Maturity Stages of Wheat under Different Potassium Treatments. Genes, 10(8), 607. https://doi.org/10.3390/genes10080607