Abstract
Unfavourable environmental conditions, including soil salinity, lead to decreased rice (Oryza sativa L.) productivity, especially at the reproductive stage. In this study, we examined 30 rice varieties, which revealed significant differences in the photosynthetic performance responses under salt stress conditions during the reproductive stage, which ultimately affected yield components after recovery. In rice with a correlation between net photosynthetic rate (PN) and intercellular CO2 concentration (Ci) under salt stress, PN was found to be negatively correlated with filled grain number after recovery. Applying stringent criteria, we identified 130,317 SNPs and 15,396 InDels between two “high-yield rice” varieties and two “low-yield rice” varieties with contrasting photosynthesis and grain yield characteristics. A total of 2089 genes containing high- and moderate-impact SNPs or InDels were evaluated by gene ontology (GO) enrichment analysis, resulting in over-represented terms in the apoptotic process and kinase activity. Among these genes, 262 were highly expressed in reproductive tissues, and most were annotated as receptor-like protein kinases. These findings highlight the importance of variations in signaling components in the genome and these loci can serve as potential genes in rice breeding to produce a variety with salt avoidance that leads to increased yield in saline soil.
1. Introduction
Abiotic stresses, including high salinity, are major constraints to crop productivity [1]. Salinity is a term used to describe the presence of different salts, including sodium chloride (NaCl), in soil and water, which has been the subject of intense research [2]. The low water availability under salt stress due to the accumulation of salts such as Na+ and Cl− leads to a low water potential gradient between the external environment and the root under early-occurring unfavourable conditions (osmotic phase). Following the first phase, ion toxification caused by the uptake of Na+ and Cl− in large amounts by roots negatively affects plant growth by interfering with metabolic processes and decreasing photosynthetic efficiency (ionic stress). The reduction in photosynthesis under salt stress is attributed to either stomatal closure, which leads to a reduction in intercellular CO2 partial pressure, or non-stomatal factors including the reduction in chlorophyll synthesis, photosynthetic electron transport reaction, and ribulose-1,5-bisphosphate carboxylase/oxygenase (Rubisco) activity for carbon fixation [3,4,5,6]. Salt-driven photosynthesis reduction via stomatal closure has been studied in many plant species, including rice [7,8], since the closure of stomata under salinity is believed to be an important immediate response strategy for controlling water loss in plants [9]. Photosynthetic parameters, such as the photosynthetic rate, stomatal conductance, stomatal size, the transpiration rate, CO2 concentration, and water use efficiency, may directly affect the biomass and grain yields of crops under salt stress. Therefore, the relationships between photosynthesis-related parameters and crop yield are challenging points that need to be addressed under both favourable and unfavourable conditions [10,11,12].
Rice (Oryza sativa L.) is the main staple food crop worldwide. As the global population increases, the production of rice needs to increase. Furthermore, dramatic global environmental change poses a great threat to rice productivity [13]. Rice is categorized as a salt-susceptible species, and high salinity is one of the main constraints on its production [13]. Many strategies have been used to generate salt-tolerant rice varieties, such as marker-assisted selection or genetic engineering, by introducing salt-tolerance genes [14].
The published rice reference genome [15,16] and the advancement of high-throughput sequencing technologies known as next-generation sequencing (NGS) provide an opportunity for exploring the genetic diversity among various rice accessions and its utilization in genetic improvement [17,18]. Discovery of a very large number of sequence polymorphisms including single nucleotide polymorphisms (SNPs) and insertions/deletions (InDels) by NGS is one of the most important applications of this technology [19,20,21]. Polymorphism discovery related to functional changes in genes is important for investigating genomic loci responsible for phenotypic and physiological traits [17,18,22]. For identification of polymorphisms related to abiotic stress tolerance, comparative whole-genome analysis was performed on rice with contrasting phosphorus (P) deficiency phenotypes. Approximately 5.1 million polymorphisms were identified in P-sensitive and P-tolerant cultivars, which revealed potential variations in phosphate starvation-responsive genes and genes involved in root architecture [23]. In particular, genome-wide screening for variants in rice with contrasting salt stress tolerance (Pokkali and IR64) was conducted by Jain et al. [24]. Approximately 25% of the polymorphisms identified in this study were detected in genic regions and were nonsynonymous SNPs in 5968 genes, which mostly encode pentatricopeptide repeats, leucine-rich repeats, and protein kinase domains. Furthermore, the whole genome of a salt-tolerant rice cultivar, Godawee, was re-sequenced by the Illumina platform, in which ~2.2 million SNPs and ~480,000 InDels and nonsynonymous SNPs (192,249 SNPs) were identified in 31,287 genes. Twenty-eight salt tolerance-related genes were evaluated, and their coding regions contained 78 nonsynonymous SNPs and 76 synonymous SNPs. A sodium transporter gene, OsHKT2;1 (Os06g0701700), showed the maximum number of nonsynonymous SNPs (32 SNPs). In particular, the upstream regions of the salt tolerance genes OsAPx8 (Os02g0553200), OsMSR2 (Os01g0955100), OsTIR1 (Os05g0150500), OsHKT2;3 (Os01g0532600), OsHKT1;4 (Os04g0607600), and OsSOS1 (Os12g0641100) showed a high abundance of WRKY cis-acting regulatory elements that bind to WRKY transcription factors (TFs), a superfamily of plant TFs responsible for the regulation of genes responsive to many plant growth and developmental cues, as well as salt stress [25].
The effects of salt stress on the photosynthetic rate of rice have been reported in many studies [26,27,28]. The major cause of grain yield reduction under this stress is the limitation of carbohydrate production driven by photosynthesis and the transport of this biomolecule to spikelets. However, research focusing on the relationship between salt effects and photosynthesis at the reproductive stage, which is severely affected by salt stress in terms of yield productivity, has been limited [8,29,30]. To date, NGS technology has been widely used to identify polymorphisms in genes or loci associated with the complex trait of salt-stress responsiveness in rice. In this study, whole-genome sequences of rice varieties with contrasting yield production under salt stress at the reproductive stage, which were selected based on the correlation between photosynthesis parameters and grain yield when exposed to saline soil, were analysed. This analysis revealed numerous DNA polymorphisms controlling the trait, which can be used in combination with high-throughput genotyping in molecular breeding to improve rice salinity tolerance in future studies.
2. Materials and Methods
2.1. Plant Material and Experimental Design
Seeds of 30 rice (Oryza sativa L.) varieties were provided by the Pathum Thani Rice Research Center, Pathum Thani, Thailand. Twenty-nine varieties were local varieties originating in Thailand, and one local landrace (Pokkali) was from India, which was used as a salt-tolerant variety. The experiment was conducted, as described by Lekklar et al. [30] at the Nakhon Ratchasima Rice Research Center, Nakhon Ratchasima Province, Thailand. Rice seeds were soaked for 24 h and germinated on plastic mesh floating on water for 3 days. The seedlings were grown in containers with 1/2-strength modified WP no. 2 nutrient solution for 4 days before being cultured in full-strength nutrient solution for 14 days [31]. The 21-day-old seedlings were then transplanted into pots (four seedlings per pot) filled with 5 kg of soil. The pot soil was maintained under flooded conditions (2–3 cm of water above the soil surface) during the rice growth period. After 1 and 2 months, the plants were applied with 15-15-15 chemical fertilizer (Rabbit, Chia Tai Co., Ltd., Thailand). At the flowering stage, rice was treated by adding 150 mM NaCl solution to the soil (900 mL per pot) after water was drained out. The soil was submerged in NaCl solution, approximately 2 cm above the soil surface to reach the desired final soil electrical conductivity (EC) of ~8 dS/m for 9 days, whereas tap water was added for the normal condition. For recovery to normal conditions, tap water was added to the pot, and the pot was drained for a week until the EC in the soil equalled ~2 dS m−1. The crops were then harvested at maturity. Four replicate pots of each variety were planted in a randomized complete block design.
2.2. Photosynthetic Parameter and Grain Yield Measurement
Leaf photosynthesis characteristics were measured on the penultimate leaf (the 2nd leaf from the flag leaf) of the main tiller from 8.30 to 11.30 a.m. 0, 3, 6, and 9 days after treatment using a portable photosynthesis system (LI-COR 6400-XT, LI-COR, Nebraska, USA) with a red-blue light source and a 2 × 3 cm2 cuvette as described by Lekklar et al. [30]. The cuvette conditions were as follows: PAR, 1200 μmol m−2 s−1; flow rate, 500 μmol s−1; sample CO2, 380 μmol mol−1; and leaf temperature, 30 ± 5 °C, which equalled the ambient temperature. Photosynthetic parameters consisted of the net photosynthesis rate (PN), stomatal conductance (gs), the transpiration rate (E), and intercellular CO2 concentration (Ci). After rice plants recovered from salt stress conditions, the filled grain number (FG) was recorded from 4 plants of each of the 30 varieties.
2.3. Statistical Analysis
The experimental design was a randomized complete block design. The results were expressed as the mean ± standard error (SE). Analysis of variance (ANOVA) was used to evaluate the data for each parameter. Differences among the means were compared by Duncan’s multiple range test (DMRT). Differences were considered statistically significant when p-value < 0.05. The Pearson correlation coefficients (r) among photosynthetic parameters and yield components were determined using JMP software ver. 9 (SAS, Cary, NC, USA).
2.4. DNA Sequencing, Mapping and Variant Detection
The total DNA of each rice variety was extracted from young leaf tissue with a Genomic DNA Mini Kit (Plant) (Geneaid Biotech Ltd., Taiwan). Whole-genome library preparation was performed, as described by Lekklar et al. [30]. The IRGSP-1.0 [32] rice reference genome was downloaded from the Rice Genome Annotation Project web page (http://rice.plantbiology.msu.edu). We used the pipeline created by Missirian et al. [33] to demultiplex sequenced reads from different libraries. Raw reads were aligned to the reference genome using the Burrows-Wheeler Aligner (BWA version 0.5.7-1) [34]. Genome Analysis Toolkit (GATK; version 3.3–0) was employed with default parameters to identify variants (GATK; version 3.3–0) [35].
2.5. Variant Annotation
After variant calling, SNPs and InDels were further filtered to retain good-quality variants with a read depth ≥ 10 and genotype quality score ≥ 40. SnpEff was used to annotate SNPs and InDels [36], which annotates variants by sequence ontology, nucleotide substitution, and region on the rice genome.
2.6. Ontology Enrichment Analysis and Expression Profile of Candidate Genes
We used a web-based platform, Comprehensive Annotation of Rice Multi-Omics (CARMO) [37], to identify enriched gene ontologies, which were based on a 5% false discovery rate (FDR). The GO enrichment results were visualized by ‘ggplot2’ in R [38]. The same platform was also used to evaluate the tissue-specific expression of candidate genes.
3. Results
3.1. Variation in and Correlations between Photosynthetic Performance Parameters of 30 Rice Varieties
The photosynthetic parameters (PN, gs, Ci, and E) of 30 rice varieties (Table S1) at the flowering stage grown under normal and salt stress conditions for 3, 6, and 9 days are shown in Table S2. The results revealed significant differences in the photosynthetic performance responses of these rice genotypes under salt stress conditions. On day 9 of the treatment, under normal conditions, the PN in all varieties was in the range of 3.57–13.38 μmol CO2 m−2 s−1, while under salt stress conditions, the PN of these varieties was in the range of 0.4–712.57 μmol CO2 m−2 s−1. Salt stress substantially reduced the PN in all rice varieties by day 9 of treatment, except for ‘Sam Ahang’ rice, which had a higher PN under salt stress than under normal conditions. The results of the correlation analysis of the four photosynthetic parameters under normal and stress conditions on days 0, 3, 6, and 9 of the 30 rice varieties are presented in Figure 1. Under normal conditions, significant positive correlations were found between PN and gs, r = 0.786 (p-value < 0.001) (Figure 1A), and between PN and E, r = 0.796 (p-value < 0.001) (Figure 1E). Similarly, under salt stress conditions, significant positive correlations between PN and gs, r = 0.851 (p-value < 0.001) (Figure 1B), and PN and E, r = 0.878 (p-value < 0.001) (Figure 1F), which were stronger than those under normal conditions, were found. Interestingly, no correlation between PN and Ci was observed under normal conditions (Figure 1C). However, a significant negative correlation between these parameters was found under salt stress conditions, r = −0.216 (p-value < 0.001) (Figure 1D).
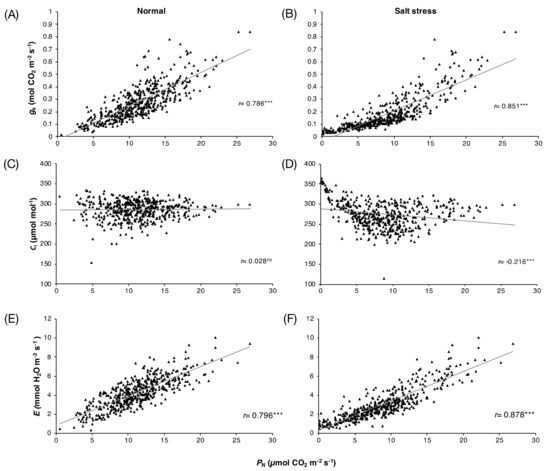
Figure 1.
Correlations among photosynthetic parameters of 30 rice varieties grown under normal and salt stress conditions for 0, 3, 6, and 9 days: PN and gs (A,B), PN and Ci (C,D) and PN and E (E,F).
3.2. Clustering Rice Varieties Using Differences in the Correlation between PN and Ci
The correlation of photosynthetic parameters varied among the varieties examined. The correlations between PN and gs, Ci or E in individual varieties under normal and salt stress conditions are presented in Table 1. Under normal condition, positive correlations between PN and gs were found in all varieties except ‘Sam Ahang’; between PN and E, positive correlations were found in all varieties except ‘Hahng Nahk’, ‘Sam Ahang’, ‘Mahk Yom’, and ‘Mahk Bid’. However, no correlation between PN and Ci was found in most varieties under normal conditions. Under salt stress conditions, significant correlations were found in all varieties between PN and gs, r = 0.70 (p-value < 0.001) to r = 0.96 (p-value < 0.001), as well as between PN and E (r = 0.57, p-value < 0.05 to -r = 0.97, p-value < 0.001). Interestingly, a correlation between PN and Ci under salt stress conditions was found in 10 rice varieties, namely, ‘Ma Yom’, ‘Tah Bahn’, ‘Khitom Khao’, ‘Leuang Dong’, ‘Mae Mai’, ‘Jao Khao’, ‘Di Si’, ‘Med Makham’, ‘Nahng Nuan’, and ‘Sew Mae Jan’. Therefore, based on the correlation between PN and Ci under salt stress conditions, 10 varieties were categorized as group I and the other varieties (20 varieties) that had no correlation between PN and Ci were categorized as group II to further examine the correlation between PN and yield components.

Table 1.
Correlation between PN and other photosynthetic parameters gs, Ci and E) in the penultimate leaves of each rice varieties at flowering stage grown under normal and salt stress condition for 0, 3, 6, and 9 days.
3.3. Correlation between PN and Grain Yield of the Rice Groups
Among group I rice, significant negative correlations between PN and grain yield under salt stress conditions were found at all time points examined: Day 3 (Figure 2A), day 6 (Figure 2B), and day 9 (Figure 2C), with r = −0.828 (p-value < 0.01), r = −0.835 (p-value < 0.01), and r = −0.768 (p-value < 0.01), respectively. Under normal conditions, weaker negative correlations on day 3 (Figure 2A) and day 9 (Figure 2C), with r = −0.640 (p-value < 0.05) and r = −0.709 (p-value < 0.05), respectively, and no correlation on day 6 (Figure 2B) were observed. For group II rice, under salt stress conditions, no correlation between these parameters on day 3 (Figure 2D) and day 9 (Figure 2F) and a relatively weak negative correlation on day 6, r = −0.452 (p-value < 0.05) (Figure 2E), were found. Under normal conditions, no correlation was observed for group II rice at any time point examined (Figure 2D–F).
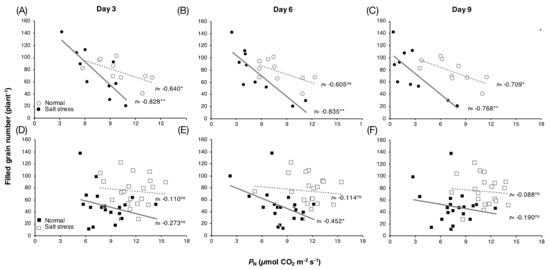
Figure 2.
Correlation between leaf PN and grain yield per plant of group I rice (A–C) and group II rice (D–F) grown under normal and salt stress conditions for 3, 6 and 9 days, respectively. *significant at p-value < 0.05, **significant at p-value < 0.01, and ns = not significant.
3.4. Whole-Genome Resequencing Analysis and Variant Discovery
Four rice varieties from group I, which exhibited correlations between PN and filled grain (Figure 2), were selected for whole-genome sequencing. We selected 2 salt-affected “low-yield rice (LYR)” varieties (‘Ma Yom’, MY, and ‘Khitom Khao’, KK) and 2 “high-yield rice (HYR)” varieties (‘Jao Khao’, JK, and ‘Nahng Nuan’, NN) [30]. The high-quality, 150-bp-long paired-end reads from each variety were aligned to the reference genome ‘Nipponbare’, separately. More than 30 million reads were obtained from each variety, and the resulting mapping rate ranged from 89.52%–95.07%. We found a total of 707,759, 678,820, 497,512, and 583,761 SNPs in ‘MY’, ‘KK’, ‘JK’, and ‘NN’, respectively. Furthermore, 89,400, 85,700, 61,385, and 73,471 InDels were identified in the 4 rice varieties, respectively (Table 2). For nucleotide substitution comparison, all SNPs were subdivided into transitions (Ts) and transversions (Tv). For Ts, G→A and C→T were found more frequently than A→G and T→A in all varieties (Figure 3A). For Tv, T→A was the most frequent, followed by A→T, G→T, and C→A, which were found at similar frequencies in all varieties, while G→C was the least frequent in all varieties. The range of the Ts/Tv ratio for all rice varieties was 2.40–2.42. These results suggest that the substitution patterns in these rice varieties were similar. The regions in which all polymorphisms were located in each rice variety are summarized in Table S3. The majority of SNPs in all rice varieties were located in upstream (~35%), downstream (~34%), or intergenic (~23%) regions. Similarly, we found a large number of InDels located in the upstream and downstream regions in all rice varieties (Table S3). Approximately 8% of SNPs and InDels were found in genes, approximately half of which were found in introns. In total, approximately 3% of SNPs and 2% of InDels were located in expressed regions.
Table 2.
Number of sequenced reads and frequency of single-nucleotide polymorphisms (SNPs) and insertions/deletions (InDels) detected in all rice varieties.
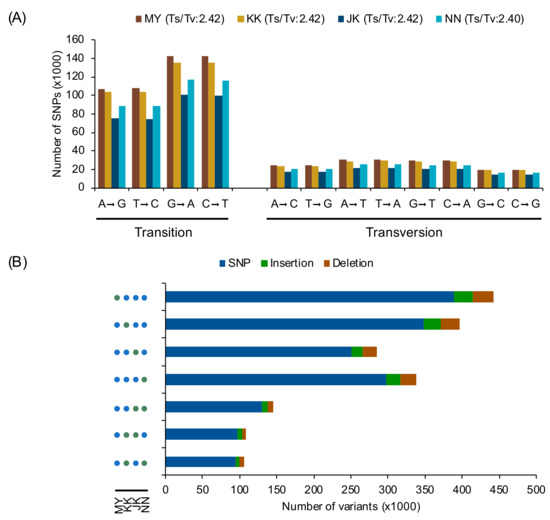
Figure 3.
(A) Nucleotide substitution frequency of each rice genome as determined by SnpEff [36]. (B) Number of variants in each LYR and HYR variety. Green and blue circles indicate that corresponding varieties share the variants. MY: Ma Yom, KK: Khitom Khao, JK: Jao Khao, NN: Nahng Nuan.
3.5. Structural and Functional Annotation of Variants between LYR and HYR
To compare the variant-sharing profiles of the four rice varieties, variants were analysed using the combined and selected variants function in GATK [35]. We grouped all positions of SNPs shared among the four varieties as variety-specific (defined as a variant not shared by other varieties) or shared by any two varieties. For variety-specific groups, the numbers of positions in the 2 LYR varieties (MY and KK) were larger than those in the 2 HYR varieties (JK and NN) (Figure 3B). For SNPs shared by any two varieties, the number of positions shared by LYR or by HYR was 145,713, which was larger than that shared by the other groups of two varieties (Figure 3B and Figure S1).
Moreover, we predicted the effects of variants on protein function, which were clustered into four types (high, moderate, low, and modifier) based on the predicted severity of each effect (Table S4). Most variants belonged to the modifier category, such as the 3′-UTR, 5′-UTR, synonymous SNP and intron variants, which were inferred to have only a weak impact. Nonetheless, numerous variants with high or moderate effects were found among the four varieties. Among those shared between two varieties, the number of SNPs shared by LYR and shared by HYR (MY/KK-JK/NN) was largest in all categories. In the high- or moderate-effect group, a total of 5842 positions were found in the MY/KK-JK/NN group, which was much larger than that found in the MY/JK-KK/NN and MY/NN-KK/JK groups (4133 and 3841, respectively) (Table S4).
3.6. Distribution of LYR- and HYR-Shared Variants Detected on Rice Chromosomes
The numbers of all variants including the HYR- and LYR-shared SNPs and InDels (MY/KK-JK/NN) were plotted across all rice chromosomes (Figure 4A). The largest numbers of SNPs (12,882) and InDels (1633) were detected on chromosome 1, which was found to be directly proportional to chromosome length. However, the highest densities of SNPs (42.8 SNPs/100 kb) and InDels (5.3 InDels/100 kb) were found on chromosome 9 (Table S5). Figure 4B represents the frequency of the HYR- and LYR-shared variants calculated within a 100-kb window size using VCFtools [39] and visualized by ClicO FS [40]. Surprisingly, the highest densities of HYR- and LYR-shared SNPs (566) and InDels (90) were identified on chromosome 4. For regions of hotspots, which contained ≥ 300 SNPs/100 kb or ≥ 40 InDels/100 kb for the HYR- and LYR-shared variants, 8 SNP hotspots were found on chromosomes 4, 6, 9, 10, and 11, and 8 InDel hotspots were found on chromosomes 2, 5, 6, 8, 9, and 11 (Figure 4B).
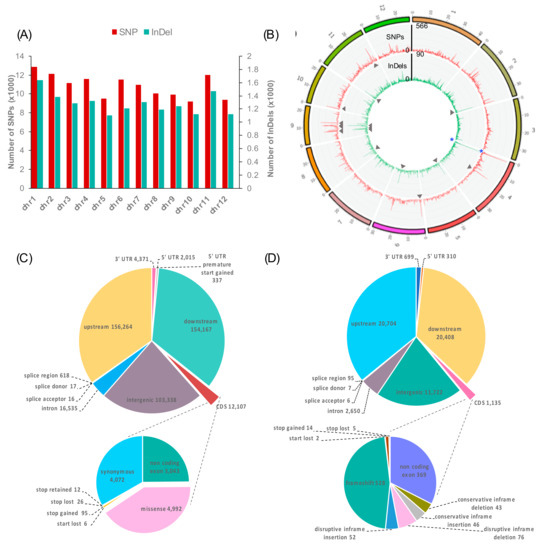
Figure 4.
Distribution (A) and density (B) of variants across rice chromosomes identified in MY/KK–JK/NN. Variant densities were computed within a 100-kb window. The outside and inside of the Circos diagram represent SNP density (red line) and InDel density (green), respectively. The grey arrowheads indicate variant hotspots. MY: Ma Yom, KK: Khitom Khao, JK: Jao Khao, NN: Nahng Nuan. Structural annotation of variants identified in MY/KK-JK/NN. Pie charts represent variant annotations and numbers of MY/KK-JK/NN SNPs (C) and InDels (D).
3.7. Characteristics of LYR- and HYR-Shared Variants
The majority of the LYR- and HYR-shared SNPs (MY/KK-JK/NN) were identified in upstream (156,264), downstream (154,167), and intergenic regions (103,338). Within genic regions, we identified 16,535 SNPs in introns, 6723 SNPs in UTRs, and 651 SNPs in splice sites. A total of 12,107 SNPs were located in coding sequences (CDSs), among which 4072 were synonymous SNPs and 4992 were missense (non-synonymous) SNPs, which are variants causing changes in amino acids in proteins. Notably, 95 stop-gained SNPs were identified, resulting in premature stop codons and leading to disrupted transcription of genes (Figure 4C).
In total, 20,704, 20,408, and 11,722 InDels were identified in upstream, downstream, and intergenic regions, respectively. Within genic regions, we identified 2650 InDels in introns, 1,009 InDels in UTRs, and 108 InDels in splice sites. A total of 1135 InDels were located in CDSs, among which 528 caused a frameshift; 52 caused disruptive in-frame insertion; and 76 caused disruptive in-frame deletion. These annotated variants caused disruption of the translational reading frame (Figure 4D).
3.8. GO Enrichment Analysis of Genes Containing High- and Moderate-Impact Variants
To explore potential variations in protein function, we focused on high- and moderate-impact variants of the HYR- and LYR-shared SNPs and InDels. A list of 2089 genes containing high- and moderate-impact variants is presented in Table S6. These genes were submitted to the ‘CARMO’ GO enrichment facility [37]. The significance level is based on Fisher’s exact test and multi-test adjustment using a 5% false positive detection (FDR) threshold (Table S7). The results revealed that in terms of biological process, there were 4 enriched GOs, namely, the apoptotic process (GO:0006915), defence response (GO:0006952), protein phosphorylation (GO:0006468), and gene silencing by RNA (GO:0031047) (Figure 5A). In terms of molecular function, there were 9 enriched GOs, namely, 4 GOs involving kinase activity (GO:0016301, GO:0004713, GO:0004672 and GO:0004674) and on each involving ADP binding (GO:0043531), transferase activity (GO:0016772), polysaccharide binding (GO:0030247), receptor activity (GO:0004872), and nucleoside-triphosphatase activity (GO:0017111). Notably, most genes containing high- and moderate-impact variants were over-represented by GO terms in kinase activity (Figure 5A).
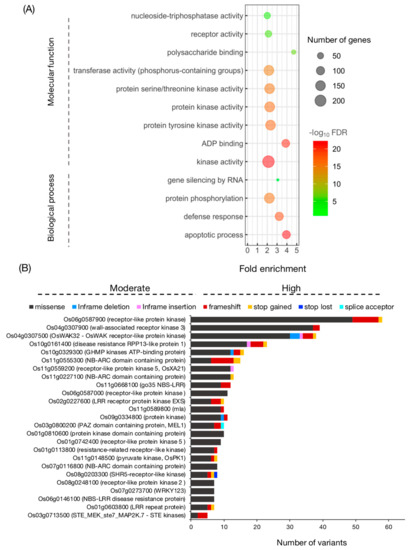
Figure 5.
Gene ontology enrichment analysis of genes containing high- and moderate-impact variants identified in MY/KK-JK/NN. Darker colours represent higher significance, and larger circles indicate more enriched genes in the group (A). Bar diagram showing genes containing the most high- and moderate-impact SNPs/InDels identified in MY/KK-JK/NN (B). MY: Ma Yom, KK: Khitom Khao, JK: Jao Khao, NN: Nahng Nuan.
3.9. Potential Genes Containing a Large Number of High- and Moderate-Impact Polymorphisms
From the GO enrichment analysis, we found that 378 genes containing high- and moderate-impact variants were enriched (Table S7). These genes were narrowed down to identify potential genes involved in salt tolerance during the reproductive stage by evaluating their expression profiles in reproductive tissues based on CARMO, a web-based platform [37]. The genes expressed in reproductive tissues, which included the post-emergence inflorescence, pre-emergence inflorescence, anther, and pistil and panicle, were evaluated as potential genes that may be involved in yield productivity during salt stress. We identified 262 genes highly expressed in these reproductive tissues (Figure S2 and Table S8). A list of the top 10 highest-expressing genes in any one of the reproductive tissues examined is shown in Table 3. A large number of variations were identified in OS01G0810600 (protein kinase domain-containing protein), OS03G0800200 (PAZ domain-containing protein, OsMEL1), OS05G0596600 (RecF/RecN/SMC N terminal domain-containing protein), OS11G0148500 (pyruvate kinase, OsPK1), and OS11G0227100 (NB-ARC domain-containing protein).
Table 3.
List of the top 10 highest-expressing genes in any one of the reproductive tissues.
Furthermore, Figure 5A shows the top 25 genes with the most high- and moderate-impact variants and that were highly expressed in reproductive tissues (Figure S2). Most of the identified genes belong to the receptor-like kinase (RLK) family. The largest number of variations was found in Os06g0587900 (receptor-like protein kinase), which harboured 49 missense SNPs, 8 frameshift InDels, and 1 stop-gained SNP. A total of 37 missense SNPs and 2 frameshift InDels were found in Os04g0307900 (wall-associated receptor kinase 3). In addition, 30 missense SNPs, 3 in-frame deletion InDels, 3 frameshift InDels, 1 in-frame insertion InDel, and 1 stop-gained InDel were identified in Os04g0307500 (OsWAK32).
Previous reports described the isolation and characterization of 3 genes found here, namely, OsXA21 (Os11g0559200), OsMEL1 (Os03g0800200), and OsPK1 (Os11g0148500) (Figure 5B). A total of 14 variants (12 missense SNPs, 1 in-frame deletion, and 1 in-frame insertion) were identified in OsXA21, which confers resistance to Xanthomonas oryzae pv. oryzae [41]. OsMEL1, a PAZ domain-containing protein, has been reported to be a key gene involved in meiosis in rice germ cells and involved in a gene-regulatory system via small RNA-mediated gene silencing in rice sexual reproduction [42]. This gene contained 7 missense SNPs, 1 splice acceptor SNP, and 2 frameshifts. Finally, a pyruvate kinase named OsPK1 showed 6 missense SNPs, 1 frameshift InDel, and 1 stop-gained SNP. Mutation of these genes causes dwarfism and panicle enclosure in rice [43] (Figure S3).
4. Discussion
4.1. Salt-Affected Photosynthetic Characteristics of Flowering Rice Exposed to Saline Soil
Upon salt stress, many major physiological processes are negatively affected, including photosynthesis, the key biochemical process through which CO2 and water are converted into O2 and through which the energy-rich sugar compounds that fuel plant growth are synthesized [3,4]. In rice, the severity of injury from salt stress depends on the growth stage, as the most sensitive periods are the seedling and reproductive stages [44,45]. In this study, we focused on the reproductive stage, in which photosynthetic capacity directly affects grain yield. The positive correlation between PN and gs found in all rice varieties under salt stress (Table 1) in rice exposed to salinity may be because salt is effective in mediating stomatal closure via the accumulation of abscisic acid (ABA), a plant phytohormone that accumulates in stressed roots in saline soil and is transported to the aerial part via xylem [46,47]. The observed relationship between PN and gs has been reported in rice cultivars in diverse growing environments, including upland and lowland rice during flowering time in the penultimate leaf of the main tiller, similar to this study [48]. Consistently, because gs directly controls the transpiration from leaf to the ambient air in plants [49,50], a positive correlation was found between PN and E in all varieties (Figure 1 and Table 1). However, only 10 varieties showed a correlation between PN and Ci under salt stress conditions. Most showed a negative correlation, except ‘Ma Yom’ and ‘Sew Mae Jan’, which showed a positive correlation between these parameters. Ci, the CO2 concentration in the intercellular airspace in a plant leaf, can reflect (1) the amount of ambient CO2 that diffuses to the stomatal pore on the leaf surface and (2) the activity of Rubisco enzyme for CO2 fixation under salt stress [4,51,52]. Furthermore, in C3 plants, including rice, mesophyll conductance to allow CO2 diffusion (gm) has been investigated as a key limiting factor of photosynthesis [53,54]. gm describes the movement of CO2 from intercellular space to mesophyll cells via the cell walls, plasma membrane, cytoplasm, and chloroplast envelope to the part of the chloroplast stroma where photosynthesis is taking place, which accounts for the CO2 in the chloroplast stroma [55,56]. This parameter was reported to be related to mesophyll structural traits in rice such as cell wall thickness (Tw) and mesophyll cell surface area exposed to intercellular air space per leaf area (Sm) [57,58]. In rice cultivars exposed to drought stress, Ouyang et al. [48] investigated the relationship between leaf anatomy and gm. Particularly, they found a positive correlation between gm and the ratio of the exposed chloroplast surface area (Sc) to Sm, suggesting the importance of these parameters in the relationships among photosynthetic parameters in response to abiotic stress in rice [59,60]. As many parameters are involved in photosynthetic performance in rice, in this study, two groups of rice varieties under salt stress, one with a relationship between PN and Ci and the other without, were observed, suggesting genotype-dependent differences in the observed phenotypic data between the two rice groups (Table 1 and Figure 2).
4.2. Prediction of Grain Yield by Photosynthetic Performance and Salt-Stressed Flowering Rice
Enhancement of plant photosynthesis to improve grain yield is an extensively accepted strategy for meeting the global food demand [10,61,62]. For rice, much evidence obtained by various procedures, such as canopy architecture modification, C4 pathway introduction and photorespiration manipulation, has revealed a strong relationship between enhanced photosynthesis and yield [63,64,65,66]. However, little attention has been given to the evaluation of high-photosynthetic-performance rice and its correlation between photosynthetic parameters and yield components under salt stress. In fact, salt-induced stress during the reproductive stage of rice can lead to a decline in yield parameters such as pollen viability, grain number, and grain weight (see the review by Hussain et al. [29]). While the response of rice photosynthesis to salt stress has been reported, only a few studies have evaluated photosynthetic performance together with grain yield. In these studies, the decrease in rice yield under salt stress, particularly due to inhibition of biomass accumulation, was reported to be associated with a decreasing rate of photosynthesis. However, rice cv. Bahia exhibited different physiological responses under salt stress at the reproductive stage. Under salinity, this cultivar had a similar PN to that under normal conditions, but exhibited salt-induced panicle sterility [67]. Therefore, the relationship between the photosynthetic rate and yield parameters of rice under salt stress is still unclear. Contrary to several previous studies, among rice groups based on Ci under salt stress in this study, a large filled grain number of rice plants was found in rice exhibiting a low PN, while a small filled grain number was found in rice exhibiting a high PN (Figure 2, Figure S4 and Figure S5). One possible physiological response-related explanation of this result is based on the transport of salt ions. Generally, salt ions are taken up from saline soil by roots and transported to the aerial parts of plants through the transpiration stream [68,69]. Therefore, restriction of Na+ accumulation in the shoot can presumably be achieved by reducing transpiration through stomatal movement regulation, as observed in the high-yield rice (HYR: Jao Khao, JK, and Nuang Nuan, NN), while the opposite was found in the low-yield rice (LYR: Ma Yom, MY, and Khitom Khao, KK) (Figures S4 and S5).
4.3. Validation of Genome-Wide Sequence Variants Revealed Potential Genes
To elucidate genome-wide DNA polymorphisms in the four rice varieties that exhibited contrasting photosynthetic performances and filled grain numbers under salt stress at flowering time, whole-genome sequencing of each rice variety was performed via the Illumina sequencing platform, resulting in an average of 34.6 × 10⁶ high-quality reads (150-bp paired-end reads). Overall, ~93% of the qualified reads were mapped to the reference genome (cv. Nipponbare). The variation in variant numbers across rice varieties appeared to correspond to the number of sequenced reads (Table 2). For nucleotide substitution analysis, the ratio of transitions to transversions (Ts ⁄ Tv) of ~2.4 (Figure 3A) was found. This phenomenon is known as ‘transition bias’, which has previously been reported in rice [70]. The Ts/Tv ratio observed here is higher than that in a previous study in rice [24,71,72]. A higher Ts/Tv ratio is indicative of a low level of genetic divergence. These ratios are expected to decline with increasing genetic distance between the compared genotypes with time; transversions erase the record of frequent transitions [23,73].
With an in-depth analysis of the potential polymorphisms responsible for filled grain number under salt stress of flowering rice, the annotation of polymorphisms observed in MY/KK-JK/NN revealed that only ~3% of SNPs and ~2% of InDels were detected in CDSs, whereas the remaining ~35% of SNPs and ~36% of InDels were detected in upstream regions (Figure 4C,D). The larger number of variations in regulatory regions other than genic regions found in this study corresponds to the results of previous studies in rice [74,75]. We identified 722 high-impact variants resulting in changes such as frameshifts, exon loss and stop loss and 5120 moderate-impact variants, such as missense variants (non-synonymous) (Table S4). Overall, a total of 2089 genes harbouring at least one large-effect SNP and/or InDel were identified (Figure 4C,D and Table S6). The genes encoding receptor-like kinases were most represented in this study (Table S6).
For GO enrichment analysis (Figure 5A), most of the genes enriched in apoptotic process (FDR < 1.86994 × 10⁻²²) encode NB-ARC (nucleotide-binding adaptor shared by APAF-1, R proteins) proteins and NBS-LRR (nucleotide-binding site leucine-rich repeat) proteins. While salt tolerance is an abiotic trait, Nejat and Mantri [76] suggested that plant innate immunity evolved to respond to the crosstalk between multiple biotic and abiotic stresses. NBS-LRR or NB-ABC domain-containing proteins may recognize pathogen-associated molecular patterns (PAMPs) during the abiotic stress response. The perception of PAMPs is crucial during pathogen attack [77], but plants may also sense abiotic stress by surface-localized pattern recognition receptors (PRRs) [78,79]. Kinase activity (FDR < 5.31095 × 10⁻²²) was the most significant GO term in the molecular function category, and almost all were described as receptor-like kinases (RLKs). It has been proposed that the diversity of the extracellular domains in plant RLKs reflects their importance in rapidly evolving to defend against an ever-changing population of ligands produced by abiotic stresses in plants [80]. Thus, the high variation detected in this study likely reflects variation between the LYR and HYR in signalling pathway components.
Among the genes that were enriched in GO terms, we found that a total of 250 genes were highly expressed in reproductive tissues, narrowing down the genes involved in grain yield in rice (Figure S2, Table S8). Notably, three genes were cloned and characterized, namely, OsXA21, OsMEL1, and OsPK1 (Figure S3), and two of these were also in the top 10 most highly expressed genes in any one of the reproductive tissues (Table 3). OsXA21, a member of the leucine-rich repeat receptor-like kinase (LRR-RLK) family, is responsible for resistance to Xanthomonas oryzae pv. oryzae (Xoo), which causes bacterial leaf blight [41,81]. This gene encodes an immune receptor kinase whose functions result in subsequent activation of an intracellular defence response. Additionally, a previous study found that silencing OsXA21 led to rice susceptibility to Xoo infection [82]. Recently, Ye et al. [80] reported that many RLKs are involved in responses to abiotic stresses, including the salt-stress response in plants. Approximately 1,000 RLK genes have been identified in rice, which can be classified into 16 sub-groups. The most abundant RLK in the rice genome is LRR-RLK [83,84]. Gao and Xue [83] reported that many of the rice RLK genes are regulated by salt stress. One example is a rice putative RLK gene, OsSIK1, which is mainly induced by salt, drought, and H2O2 treatments. Rice over-expressing OsSIK1 showed higher tolerance to salt via increased antioxidant capacity than WT (‘Nipponbare’) rice, an RNAi line and a mutant line. A total of 10 large-impact polymorphisms were identified in OsMEL1 (MEIOSIS ARRESTED AT LEPTOTENE1), which controls the cell division of premeiotic germ cells. This gene was previously demonstrated to be essential for sporogenesis in rice anthers and has been shown to associate preferentially with 21-nucleotide phased small-interfering RNAs (siRNAs). Loss of MEL1 function resulted in complete seed sterility [42,85]. The role of siRNAs in abiotic stress, including salt stress, in plants has been reported to involve epigenetic regulators of gene expression and post-transcriptional gene silencing. OsMEL1 is a PAZ domain-containing protein that interacts with the argonaute protein to form RISCs (RNA-induced silencing complexes), causing the silencing of the target gene by transcript cleavage or translational suppression [86,87,88]. Furthermore, OsPK1, a cytosolic pyruvate kinase, was identified to contain 6 missenses, one frameshift and one stop-gained variant. It is a key regulatory enzyme of the glycolytic pathway that catalyses the final step of glycolysis, converting ADP and phosphoenolpyruvate (PEP) to ATP. This biochemical reaction is irreversible transphosphorylation [89]. Moreover, its substrate, PEP, and product, pyruvate, are both involved in a variety of cellular metabolic fluxes controlling plant growth and development [90,91]. Mutation of OsPK1 causes dwarfism and panicle enclosure in rice. Furthermore, ospk1 mutant rice displayed higher levels of H2O2 in the flag leaf than the WT, suggesting that this gene is involved in the oxidative stress response [43]. However, the role of OsPK1 in the salt stress response has not been reported. Recently, the interaction between pyruvate kinase (PK) and ENO2 (enolase2) was reported in Arabidopsis. The eno2 mutant showed complete susceptibility to salt stress [92]. Moreover, ENO2 regulates the expression of PK under salt stress conditions, suggesting that the role of PK in the salt stress response may involve an interaction with ENO2, which is the second enzyme in the last step of glycolysis [93]. The demonstrated functions in response to high salinity help confirm the possible roles under the salt stress of genes in this list, which contain a high density of the identified high- and moderate-impact SNPs/InDels.
5. Conclusions
The present study examines different rice genotypes that lead to different photosynthetic performances under salt stress conditions during the reproductive stage, which ultimately affects yield components after recovery. Among rice for which the PN was correlated with Ci under salt stress, the HYR had a lower PN than the LYR, suggesting that HYR can inhibit salt accumulation to the aerial part via reduced transpiration. Moreover, the whole-genome polymorphisms revealed many genes that contain high- and moderate-impact variants that are over-represented in apoptotic process and kinase activity. Our list of genes that are highly variable and highly expressed in reproductive tissues can serve as a valuable resource for genetic and genomic studies of rice in response to salt stress.
Supplementary Materials
The followings are available online at https://www.mdpi.com/2073-4425/10/8/562/s1, Figure S1: Venn diagram showing the number of SNPs (A) and InDels (B) between LYR (MY and KK) and HYR (JK and NN)., Figure S2: Expression level of 378 enriched genes in the post-emergence inflorescence, pre-emergence inflorescence, anther, pistil and panicle of rice, Figure S3: Gene structures and locations of high- and moderate-impact SNPs/InDels identified in MY/KK-JK/NN of A) OsXA21 B) OsMEL1 and C) OsPK1. Brown and green boxes indicate 3′- or 5′-UTRs and CDSs, respectively., Figure S4: Photosynthetic parameters under normal (A, C, E, G) and salt stress (B, D, F, H) conditions of each rice variety at the flowering stage: net photosynthesis rate, PN (A, B); stomatal conductance, gs (C, D); intercellular CO2 concentration, Ci (E, F); and transpiration rate, E (G, H). Bar represents the standard error of four replicates. ANOVA was performed, followed by mean comparison with DMRT. Different letters above the bars show a statistically significant difference in means at p-value < 0.05. MY: Ma Yom, KK: Khitom Khao, JK: Jao Khao, NN: Nahng Nuan., Figure S5: Number of filled grains per plant under normal and salt stress conditions of each rice variety at the flowering stage. Bar represents the standard error of four replicates. ANOVA was performed, followed by mean comparison with DMRT. Different letters above the bars show a statistically significant difference in means at p-value < 0.05. MY: Ma Yom, KK: Khitom Khao, JK: Jao Khao, NN: Nahng Nuan. Table S1: List of rice varieties used in this study, Table S2: List of rice varieties and phenotypic data under normal and salt stress conditions of each rice variety at the flowering stage., Table S3: Number of SNPs and InDels identified in HYR and LYR varieties. SNPs and InDels were annotated based on their location, Table S4: Annotation of SNPs and InDels defined in specific, shared and common variants., Table S5: Frequency of SNPs and InDels identified in LYR and HYR that were detected on individual rice chromosomes., Table S6: List of 2089 genes identified in MY-KK/JK-NN containing high- and moderate-impact variants, Table S7: Summary of gene ontology enrichment analysis, Table S8: Variation in 262 genes identified in MY/KK-JK/NN to be expressed in reproductive tissues.
Author Contributions
Conceptualization, T.B. and S.C.; Funding acquisition, T.B.; Resources, Pathum Thani Rice Research Center, Thailand; Methodology, C.L., T.B. and M.P.; Investigation, C.L., D.S.-a., and B.K.; Supervision, L.C., S.C. and T.B.; Writing—Original draft preparation, C.L.; Writing—Review and Editing, S.C. and T.B.
Funding
This work was supported by the National Research Council of Thailand and the Agricultural Research Development Agency under the project Omics sciences for salt-tolerant studies in Thai rice (Oryza sativa L.), grant no. 2555NRCT512302. CL was supported by the 100th Anniversary Chulalongkorn University Fund for Doctoral Scholarship and an Overseas Research Experience Scholarship for Graduate Students from the Graduate School, Chulalongkorn University. Omics Sciences and Bioinformatics Center was supported under the Outstanding Research Performance Program: Chulalongkorn Academic Advancement into Its 2nd Century Project (CUAASC).
Acknowledgments
We thank Aumnart Chinpongpanich for technical support in genomic library preparation.
Conflicts of Interest
The authors declare no conflict of interest.
References
- Mittler, R. Abiotic stress, the field environment and stress combination. Trends Plant Sci. 2006, 11, 15–19. [Google Scholar] [CrossRef] [PubMed]
- Hoang, M.T.; Tran, N.T.; Nguyen, K.T.; Williams, B.; Wurm, P.; Bellairs, S.; Mundree, S. Improvement of salinity stress tolerance in rice: Challenges and opportunities. Agronomy 2016, 6, 54. [Google Scholar] [CrossRef]
- Munns, R.; Tester, M. Mechanisms of salinity tolerance. Annu. Rev. Plant Biol. 2008, 59, 651–681. [Google Scholar] [CrossRef] [PubMed]
- Chaves, M.M.; Flexas, J.; Pinheiro, C. Photosynthesis under drought and salt stress: Regulation mechanisms from whole plant to cell. Ann. Bot. 2009, 103, 551–560. [Google Scholar] [CrossRef] [PubMed]
- Delfine, S.; Alvino, A.; Zacchini, M.; Loreto, F. Consequences of salt stress on conductance to CO2 diffusion, rubisco characteristics and anatomy of spinach leaves. Funct. Plant Biol. 1998, 25, 395–402. [Google Scholar] [CrossRef]
- Megdiche, W.; Hessini, K.; Gharbi, F.; Jaleel, C.A.; Ksouri, R.; Abdelly, C. Photosynthesis and photosystem 2 efficiency of two salt-adapted halophytic seashore Cakile maritima ecotypes. Photosynthetica 2008, 46, 410–419. [Google Scholar] [CrossRef]
- Yeo, A.R.; Caporn, S.J.M.; Flowers, T.J. The effect of salinity upon photosynthesis in rice (Oryza sativa L.): Gas exchange by individual leaves in relation to their salt content. J. Exp. Bot. 1985, 36, 1240–1248. [Google Scholar] [CrossRef]
- Hussain, S.; Zhang, J.-H.; Zhong, C.; Zhu, L.-F.; Cao, X.-C.; Yu, S.-M.; Allen Bohr, J.; Hu, J.-J.; Jin, Q.-Y. Effects of salt stress on rice growth, development characteristics, and the regulating ways: A review. J. Integr. Agric. 2017, 16, 2357–2374. [Google Scholar] [CrossRef]
- Fricke, W.; Akhiyarova, G.; Veselov, D.; Kudoyarova, G. Rapid and tissue-specific changes in ABA and in growth rate in response to salinity in barley leaves. J. Exp. Bot. 2004, 55, 1115–1123. [Google Scholar] [CrossRef]
- Long, S.P.; Zhu, X.-G.; Naidu, S.L.; Ort, D.R. Can improvement in photosynthesis increase crop yields? Plant Cell Environ. 2006, 29, 315–330. [Google Scholar] [CrossRef]
- Mathan, J.; Bhattacharya, J.; Ranjan, A. Enhancing crop yield by optimizing plant developmental features. Development 2016, 143, 3283–3294. [Google Scholar] [CrossRef] [PubMed]
- Fahad, S.; Noor, M.; Adnan, M.; Khan, M.A.; Rahman, I.U.; Alam, M.; Khan, I.A.; Ullah, H.; Mian, I.A.; Hassan, S.; et al. Chapter 28—Abiotic stress and rice grain quality. In Advances in Rice Research for Abiotic Stress Tolerance; Hasanuzzaman, M., Fujita, M., Nahar, K., Biswas, J.K., Eds.; Woodhead Publishing: Cambridge, UK, 2019; pp. 571–583. [Google Scholar]
- Lobell, D.B.; Gourdji, S.M. The influence of climate change on global crop productivity. Plant Physiol. 2012, 160, 1686–1697. [Google Scholar] [CrossRef] [PubMed]
- Reddy, I.N.B.L.; Kim, B.-K.; Yoon, I.-S.; Kim, K.-H.; Kwon, T.-R. Salt tolerance in rice: Focus on mechanisms and approaches. Rice Sci. 2017, 24, 123–144. [Google Scholar] [CrossRef]
- Yu, J.; Hu, S.; Wang, J.; Wong, G.K.-S.; Li, S.; Liu, B.; Deng, Y.; Dai, L.; Zhou, Y.; Zhang, X.; et al. A draft sequence of the rice genome (Oryza sativa L. ssp. indica). Science 2002, 296, 79–92. [Google Scholar] [CrossRef] [PubMed]
- Goff, S.A.; Ricke, D.; Lan, T.-H.; Presting, G.; Wang, R.; Dunn, M.; Glazebrook, J.; Sessions, A.; Oeller, P.; Varma, H.; et al. A draft sequence of the rice genome (Oryza sativa L. ssp. japonica). Science 2002, 296, 92–100. [Google Scholar] [CrossRef] [PubMed]
- Li, Y.; Xiao, J.; Chen, L.; Huang, X.; Cheng, Z.; Han, B.; Zhang, Q.; Wu, C. Rice functional genomics research: Past decade and future. Mol. Plant 2018, 11, 359–380. [Google Scholar] [CrossRef] [PubMed]
- Huang, X.; Lu, T.; Han, B. Resequencing rice genomes: An emerging new era of rice genomics. Trends Genet. 2013, 29, 225–232. [Google Scholar] [CrossRef] [PubMed]
- Varshney, R.K.; Nayak, S.N.; May, G.D.; Jackson, S.A. Next-generation sequencing technologies and their implications for crop genetics and breeding. Trends Biotechnol. 2009, 27, 522–530. [Google Scholar] [CrossRef]
- Nielsen, R.; Paul, J.S.; Albrechtsen, A.; Song, Y.S. Genotype and SNP calling from next-generation sequencing data. Nat. Rev. Genet. 2011, 12, 443. [Google Scholar] [CrossRef] [PubMed]
- McCouch, S.R.; Zhao, K.; Wright, M.; Tung, C.-W.; Ebana, K.; Thomson, M.; Reynolds, A.; Wang, D.; DeClerck, G.; Ali, M.L.; et al. Development of genome-wide SNP assays for rice. Breed. Sci. 2010, 60, 524–535. [Google Scholar] [CrossRef]
- Fincher, G.; Paltridge, N.; Langridge, P. Functional genomics of abiotic stress tolerance in cereals. Brief. Funct. Genom. 2006, 4, 343–354. [Google Scholar]
- Mehra, P.; Pandey, B.K.; Giri, J. Genome-wide DNA polymorphisms in low phosphate tolerant and sensitive rice genotypes. Sci. Rep. 2015, 5, 13090. [Google Scholar] [CrossRef] [PubMed]
- Jain, M.; Moharana, K.C.; Shankar, R.; Kumari, R.; Garg, R. Genomewide discovery of DNA polymorphisms in rice cultivars with contrasting drought and salinity stress response and their functional relevance. Plant Biotechnol. J. 2014, 12, 253–264. [Google Scholar] [CrossRef] [PubMed]
- Singhabahu, S.; Wijesinghe, C.; Gunawardana, D.; Senarath-Yapa, M.D.; Kannangara, M.; Edirisinghe, R.; Dissanayake, H.W.V. Whole genome sequencing and analysis of Godawee, a salt tolerant indica rice variety. J. Res. Rice 2017, 5. [Google Scholar] [CrossRef]
- García Morales, S.; Trejo-Téllez, L.I.; Gómez Merino, F.C.; Caldana, C.; Espinosa-Victoria, D.; Herrera Cabrera, B.E. Growth, photosynthetic activity, and potassium and sodium concentration in rice plants under salt stress. Acta Scientiarum. Agron. 2012, 34, 317–324. [Google Scholar]
- Dionisio-Sese, M.L.; Tobita, S. Effects of salinity on sodium content and photosynthetic responses of rice seedlings differing in salt tolerance. J. Plant Physiol. 2000, 157, 54–58. [Google Scholar] [CrossRef]
- Bhaswati, G.; Nasim, A.-M.; Saikat, G. Response of rice under salinity stress: A review update. J. Res. Rice 2016, 4. [Google Scholar]
- Hussain, M.; Ahmad, S.; Hussain, S.; Lal, R.; Ul-Allah, S.; Nawaz, A. Chapter six—Rice in saline soils: Physiology, biochemistry, genetics, and management. In Advances in Agronomy; Sparks, D.L., Ed.; Academic Press: Cambridge, MA, USA, 2018; Volume 148, pp. 231–287. [Google Scholar]
- Lekklar, C.; Pongpanich, M.; Suriya-arunroj, D.; Chinpongpanich, A.; Tsai, H.; Comai, L.; Chadchawan, S.; Buaboocha, T. Genome-wide association study for salinity tolerance at the flowering stage in a panel of rice accessions from Thailand. BMC Genom. 2019, 20, 76. [Google Scholar] [CrossRef]
- Vajrabhaya, M.; Vajrabhaya, T. Somaclonal variation for salt tolerance in rice. In Biotechnology in Agriculture and Forestry; Bajaj, Y.P.S., Ed.; Springer-Verlag: Berlin/Heidelberg, Germany, 1991; pp. 368–382. [Google Scholar]
- Kawahara, Y.; Bastide, M.; Hamilton, J.P.; Kanamori, H.; McCombie, W.R.; Ouyang, S. Improvement of the Oryza sativa nipponbare reference genome using next generation sequence and optical map data. Rice 2013, 6. [Google Scholar] [CrossRef] [PubMed]
- Missirian, V.; Comai, L.; Filkov, V. Statistical mutation calling from sequenced overlapping DNA pools in tilling experiments. BMC Bioinform. 2011, 12, 287. [Google Scholar] [CrossRef] [PubMed]
- Li, H.; Durbin, R. Fast and accurate short read alignment with burrows–wheeler transform. Bioinformatics 2009, 25, 1754–1760. [Google Scholar] [CrossRef] [PubMed]
- McKenna, A.; Hanna, M.; Banks, E.; Sivachenko, A.; Cibulskis, K.; Kernytsky, A.; Garimella, K.; Altshuler, D.; Gabriel, S.; Daly, M.; et al. The genome analysis toolkit: A mapreduce framework for analyzing next-generation DNA sequencing data. Genome Res. 2010, 20, 1297–1303. [Google Scholar] [CrossRef] [PubMed]
- Cingolani, P.; Platts, A.; Wang, L.L.; Coon, M.; Nguyen, T.; Wang, L. A program for annotating and predicting the effects of single nucleotide polymorphisms, SNPeff: SNPs in the genome of Drosophila melanogaster strain w1118; iso-2; iso-3. Fly 2012, 6. [Google Scholar] [CrossRef] [PubMed]
- Wang, J.; Qi, M.; Liu, J.; Zhang, Y. Carmo: A comprehensive annotation platform for functional exploration of rice multi-omics data. Plant J. 2015, 83, 359–374. [Google Scholar] [CrossRef] [PubMed]
- Wickham, H. Ggplot2: Elegant Graphics for Data Analysis; Springer-Verlag: New York, NY, USA, 2016. [Google Scholar]
- Danecek, P.; Auton, A.; Abecasis, G.; Albers, C.A.; Banks, E.; DePristo, M.A.; Handsaker, R.E.; Lunter, G.; Marth, G.T.; Sherry, S.T.; et al. The variant call format and VCFtools. Bioinformatics 2011, 27, 2156–2158. [Google Scholar] [CrossRef]
- Cheong, W.-H.; Tan, Y.-C.; Yap, S.-J.; Ng, K.-P. Clico fs: An interactive web-based service of circos. Bioinformatics 2015, 31, 3685–3687. [Google Scholar] [CrossRef] [PubMed]
- Song, W.-Y.; Wang, G.-L.; Chen, L.-L.; Kim, H.-S.; Pi, L.-Y.; Holsten, T.; Gardner, J.; Wang, B.; Zhai, W.-X.; Zhu, L.-H.; et al. A receptor kinase-like protein encoded by the rice disease resistance gene, xa21. Science 1995, 270, 1804. [Google Scholar] [CrossRef]
- Nonomura, K.-I.; Morohoshi, A.; Nakano, M.; Eiguchi, M.; Miyao, A.; Hirochika, H.; Kurata, N. A germ cell–specific gene of the ARGONAUTE family is essential for the progression of premeiotic mitosis and meiosis during sporogenesis in rice. Plant Cell 2007, 19, 2583. [Google Scholar] [CrossRef]
- Zhang, Y.; Xiao, W.; Luo, L.; Pang, J.; Rong, W.; He, C. Downregulation of OsPK1, a cytosolic pyruvate kinase, by t-DNA insertion causes dwarfism and panicle enclosure in rice. Planta 2012, 235, 25–38. [Google Scholar] [CrossRef]
- Bouharmont, J.; Kinet, J.M.; Lutts, S. Changes in plant response to NaCl during development of rice (Oryza sativa L.) varieties differing in salinity resistance. J. Exp. Bot. 1995, 46, 1843–1852. [Google Scholar]
- Zeng, L.; Shannon, M.C.; Lesch, S.M. Timing of salinity stress affects rice growth and yield components. Agric. Water Manag. 2001, 48. [Google Scholar] [CrossRef]
- Waśkiewicz, A.; Beszterda, M.; Goliński, P. ABA: Role in plant signaling under salt stress. In Salt Stress in Plants: Signalling, Omics and Adaptations; Ahmad, P., Azooz, M.M., Prasad, M.N.V., Eds.; Springer: New York, NY, USA, 2013; pp. 175–196. [Google Scholar]
- Golldack, D.; Li, C.; Mohan, H.; Probst, N. Tolerance to drought and salt stress in plants: Unraveling the signaling networks. Front. Plant Sci. 2014, 5. [Google Scholar] [CrossRef]
- Ouyang, W.; Struik, P.C.; Yin, X.; Yang, J. Stomatal conductance, mesophyll conductance, and transpiration efficiency in relation to leaf anatomy in rice and wheat genotypes under drought. J. Exp. Bot. 2017, 68, 5191–5205. [Google Scholar] [CrossRef]
- Jones, H.G. Stomatal control of photosynthesis and transpiration. J. Exp. Bot. 1998, 49, 387–398. [Google Scholar] [CrossRef]
- Nilson, S.E.; Assmann, S.M. The control of transpiration. Insights from Arabidopsis. Plant Physiol. 2007, 143, 19. [Google Scholar] [CrossRef]
- Morison, J.I.L.; Lawson, T. Does lateral gas diffusion in leaves matter? PlantCell Environ. 2007, 30, 1072–1085. [Google Scholar] [CrossRef]
- Evans, J.R.; Kaldenhoff, R.; Genty, B.; Terashima, I. Resistances along the CO2 diffusion pathway inside leaves. J. Exp. Bot. 2009, 60, 2235–2248. [Google Scholar] [CrossRef]
- Flexas, J. Genetic improvement of leaf photosynthesis and intrinsic water use efficiency in C3 plants: Why so much little success? Plant Sci. 2016, 251, 155–161. [Google Scholar] [CrossRef]
- Xiong, D.; Flexas, J. Leaf economics spectrum in rice: Leaf anatomical, biochemical, and physiological trait trade-offs. J. Exp. Bot. 2018, 69, 5599–5609. [Google Scholar] [CrossRef]
- Xiao, Y.; Zhu, X.-G. Components of mesophyll resistance and their environmental responses: A theoretical modelling analysis. PlantCell Environ. 2017, 40, 2729–2742. [Google Scholar] [CrossRef]
- Warren, C.R.; Dreyer, E. Temperature response of photosynthesis and internal conductance to CO2: Results from two independent approaches. J. Exp. Bot. 2006, 57, 3057–3067. [Google Scholar] [CrossRef]
- Tomás, M.; Flexas, J.; Copolovici, L.; Galmés, J.; Hallik, L.; Medrano, H.; Ribas-Carbó, M.; Tosens, T.; Vislap, V.; Niinemets, Ü. Importance of leaf anatomy in determining mesophyll diffusion conductance to CO2 across species: Quantitative limitations and scaling up by models. J. Exp. Bot. 2013, 64, 2269–2281. [Google Scholar] [CrossRef]
- Xiong, D.; Flexas, J.; Yu, T.; Peng, S.; Huang, J. Leaf anatomy mediates coordination of leaf hydraulic conductance and mesophyll conductance to CO2 in Oryza. New Phytol. 2017, 213, 572–583. [Google Scholar] [CrossRef]
- Terashima, I.; Hanba, Y.T.; Tholen, D.; Niinemets, Ü. Leaf functional anatomy in relation to photosynthesis. Plant Physiol. 2011, 155, 108. [Google Scholar] [CrossRef]
- Flexas, J.; Ribas-CarbÓ, M.; Diaz-Espejo, A.; GalmÉS, J.; Medrano, H. Mesophyll conductance to CO2: Current knowledge and future prospects. PlantCell Environ. 2008, 31, 602–621. [Google Scholar] [CrossRef]
- Gaju, O.; DeSilva, J.; Carvalho, P.; Hawkesford, M.J.; Griffiths, S.; Greenland, A.; Foulkes, M.J. Leaf photosynthesis and associations with grain yield, biomass and nitrogen-use efficiency in landraces, synthetic-derived lines and cultivars in wheat. Field Crop. Res. 2016, 193, 1–15. [Google Scholar] [CrossRef]
- Wu, A.; Hammer, G.L.; Doherty, A.; von Caemmerer, S.; Farquhar, G.D. Quantifying impacts of enhancing photosynthesis on crop yield. Nat. Plants 2019, 5, 380–388. [Google Scholar] [CrossRef]
- Makino, A. Photosynthesis, grain yield, and nitrogen utilization in rice and wheat. Plant Physiol. 2011, 155, 125. [Google Scholar] [CrossRef]
- Karki, S.; Rizal, G.; Quick, W.P. Improvement of photosynthesis in rice (Oryza sativa L.) by inserting the c4 pathway. Rice 2013, 6, 28. [Google Scholar] [CrossRef]
- Shen, B.-R.; Wang, L.-M.; Lin, X.-L.; Yao, Z.; Xu, H.-W.; Zhu, C.-H.; Teng, H.-Y.; Cui, L.-L.; Liu, E.E.; Zhang, J.-J.; et al. Engineering a new chloroplastic photorespiratory bypass to increase photosynthetic efficiency and productivity in rice. Mol. Plant 2019, 12, 199–214. [Google Scholar] [CrossRef]
- Furbank, R.T.; Quick, W.P.; Sirault, X.R.R. Improving photosynthesis and yield potential in cereal crops by targeted genetic manipulation: Prospects, progress and challenges. Field Crop. Res. 2015, 182, 19–29. [Google Scholar] [CrossRef]
- Wankhade, S.D.; Cornejo, M.J.; Mateu-Andrés, I.; Sanz, A. Morpho-physiological variations in response to NaCl stress during vegetative and reproductive development of rice. Acta Physiol. Plant 2013, 35, 323–333. [Google Scholar] [CrossRef]
- Yu, Y.; Assmann, S.M. The effect of NaCl on stomatal opening in Arabidopsis wild type and agb1 heterotrimeric G-protein mutant plants. Plant Signal. Behav. 2015, 11, e1085275. [Google Scholar] [CrossRef]
- Almeida, D.M.; Oliveira, M.M.; Saibo, N.J.M. Regulation of Na+ and K+ homeostasis in plants: Towards improved salt stress tolerance in crop plants. Genet. Mol. Biol. 2017, 40, 326–345. [Google Scholar] [CrossRef]
- Morton, B.R. Neighboring base composition and transversion/transition bias in a comparison of rice and maize chloroplast noncoding regions. Proc. Natl. Acad. Sci. USA 1995, 92, 9717–9721. [Google Scholar] [CrossRef]
- Subbaiyan, G.K.; Waters, D.L.E.; Katiyar, S.K.; Sadananda, A.R.; Vaddadi, S.; Henry, R.J. Genome-wide DNA polymorphisms in elite indica rice inbreds discovered by whole-genome sequencing. Plant Biotechnol. J. 2012, 10, 623–634. [Google Scholar] [CrossRef]
- Kashima, K.; Mejima, M.; Kurokawa, S.; Kuroda, M.; Kiyono, H.; Yuki, Y. Comparative whole-genome analyses of selection marker–free rice-based cholera toxin B-subunit vaccine lines and wild-type lines. BMC Genom. 2015, 16, 48. [Google Scholar] [CrossRef][Green Version]
- Draisma, S.G.A.; Prud’Homme van Reine, W.F.; Stam, W.T.; Olsen, J.L. A reassessment of phylogenetic relationships within the Phaeophyceae based on RUBISCO large subunit and ribosomal DNA sequences. J. Phycol. 2001, 37, 586–603. [Google Scholar] [CrossRef]
- Chai, C.; Shankar, R.; Jain, M.; Subudhi, P.K. Genome-wide discovery of DNA polymorphisms by whole genome sequencing differentiates weedy and cultivated rice. Sci. Rep. 2018, 8, 14218. [Google Scholar] [CrossRef]
- Oh, J.-H.; Lee, Y.-J.; Byeon, E.-J.; Kang, B.-C.; Kyeoung, D.-S.; Kim, C.-K. Whole-genome resequencing and transcriptomic analysis of genes regulating anthocyanin biosynthesis in black rice plants. 3 Biotech 2018, 8, 115. [Google Scholar] [CrossRef]
- Nejat, N.; Mantri, N. Plant immune system: Crosstalk between responses to biotic and abiotic stresses the missing link in understanding plant defence. Curr. Issues Mol. Biol. 2017, 23, 1–15. [Google Scholar] [CrossRef]
- Głowacki, S.; Macioszek, V.K.; Kononowicz, A.K. R proteins as fundamentals of plant innate immunity. Cell Mol. Biol. Lett. 2011, 16, 1–24. [Google Scholar] [CrossRef]
- Fujita, M.; Fujita, Y.; Noutoshi, Y.; Takahashi, F.; Narusaka, Y.; Yamaguchi-Shinozaki, K.; Shinozaki, K. Crosstalk between abiotic and biotic stress responses: A current view from the points of convergence in the stress signaling networks. Curr. Opin. Plant. Biol. 2006, 9, 436–442. [Google Scholar] [CrossRef]
- Kim, Y.; Tsuda, K.; Igarashi, D.; Hillmer, R.A.; Sakakibara, H.; Myers, C.L.; Katagiri, F. Signaling mechanisms underlying the robustness and tunability of the plant immune network. Cell Host Microbe 2014, 15, 84–94. [Google Scholar] [CrossRef]
- Ye, Y.; Ding, Y.; Jiang, Q.; Wang, F.; Sun, J.; Zhu, C. The role of receptor-like protein kinases (RLKs) in abiotic stress response in plants. Plant Cell Rep. 2017, 36, 235–242. [Google Scholar] [CrossRef]
- Park, C.-J.; Ronald, P.C. Cleavage and nuclear localization of the rice XA21 immune receptor. Nat. Commun. 2012, 3, 920. [Google Scholar] [CrossRef]
- Caddell, D.F.; Park, C.-J.; Thomas, N.C.; Canlas, P.E.; Ronald, P.C. Silencing of the rice gene LRR1 compromises rice Xa21 transcript accumulation and XA21-mediated immunity. Rice 2017, 10, 23. [Google Scholar] [CrossRef]
- Gao, L.-L.; Xue, H.-W. Global analysis of expression profiles of rice receptor-like kinase genes. Mol. Plant 2012, 5, 143–153. [Google Scholar] [CrossRef]
- Shiu, S.-H.; Karlowski, W.M.; Pan, R.; Tzeng, Y.-H.; Mayer, K.F.X.; Li, W.-H. Comparative analysis of the receptor-like kinase family in Arabidopsis and rice. Plant Cell 2004, 16, 1220–1234. [Google Scholar] [CrossRef]
- Komiya, R.; Ohyanagi, H.; Niihama, M.; Watanabe, T.; Nakano, M.; Kurata, N.; Nonomura, K.-I. Rice germline-specific Argonaute MEL1 protein binds to phasiRNAs generated from more than 700 lincRNAs. Plant J. 2014, 78, 385–397. [Google Scholar] [CrossRef]
- Khraiwesh, B.; Zhu, J.-K.; Zhu, J. Role of miRNAs and siRNAs in biotic and abiotic stress responses of plants. Biochim. Biophys. Acta 2012, 1819, 137–148. [Google Scholar] [CrossRef]
- Ku, Y.-S.; Wong, J.W.-H.; Mui, Z.; Liu, X.; Hui, J.H.-L.; Chan, T.-F.; Lam, H.-M. Small RNAs in plant responses to abiotic stresses: Regulatory roles and study methods. Int. J. Mol. Sci. 2015, 16, 24532–24554. [Google Scholar] [CrossRef]
- Kumar, V.; Khare, T.; Shriram, V.; Wani, S.H. Plant small RNAs: The essential epigenetic regulators of gene expression for salt-stress responses and tolerance. Plant Cell Rep. 2018, 37, 61–75. [Google Scholar] [CrossRef]
- Ambasht, P.K.; Kayastha, A.M. Plant pyruvate kinase. Biol. Plant. 2002, 45, 1–10. [Google Scholar] [CrossRef]
- Andre, C.; Froehlich, J.E.; Moll, M.R.; Benning, C. A heteromeric plastidic pyruvate kinase complex involved in seed oil biosynthesis in Arabidopsis. Plant Cell 2007, 19, 2006. [Google Scholar] [CrossRef]
- Baud, S.; Wuillème, S.; Dubreucq, B.; De Almeida, A.; Vuagnat, C.; Lepiniec, L.; Miquel, M.; Rochat, C. Function of plastidial pyruvate kinases in seeds of Arabidopsis thaliana. Plant J. 2007, 52, 405–419. [Google Scholar] [CrossRef]
- Zhang, Y.-H.; Chen, C.; Shi, Z.-H.; Cheng, H.-M.; Bing, J.; Ma, X.-F.; Zheng, C.-X.; Li, H.-J.; Zhang, G.-F. Identification of salinity-related genes in ENO2 mutant (eno2−) of Arabidopsis thaliana. J. Integr. Agric. 2018, 17, 94–110. [Google Scholar] [CrossRef]
- Prabhakar, V.; Löttgert, T.; Gigolashvili, T.; Bell, K.; Flügge, U.-I.; Häusler, R.E. Molecular and functional characterization of the plastid-localized phosphoenolpyruvate enolase (eno1) from Arabidopsis thaliana. FEBS Lett. 2009, 583, 983–991. [Google Scholar] [CrossRef]
© 2019 by the authors. Licensee MDPI, Basel, Switzerland. This article is an open access article distributed under the terms and conditions of the Creative Commons Attribution (CC BY) license (http://creativecommons.org/licenses/by/4.0/).