Gene Expression Networks Across Multiple Tissues Are Associated with Rates of Molecular Evolution in Wild House Mice


Abstract
1. Introduction
2. Materials and Methods
2.1. Expression Data
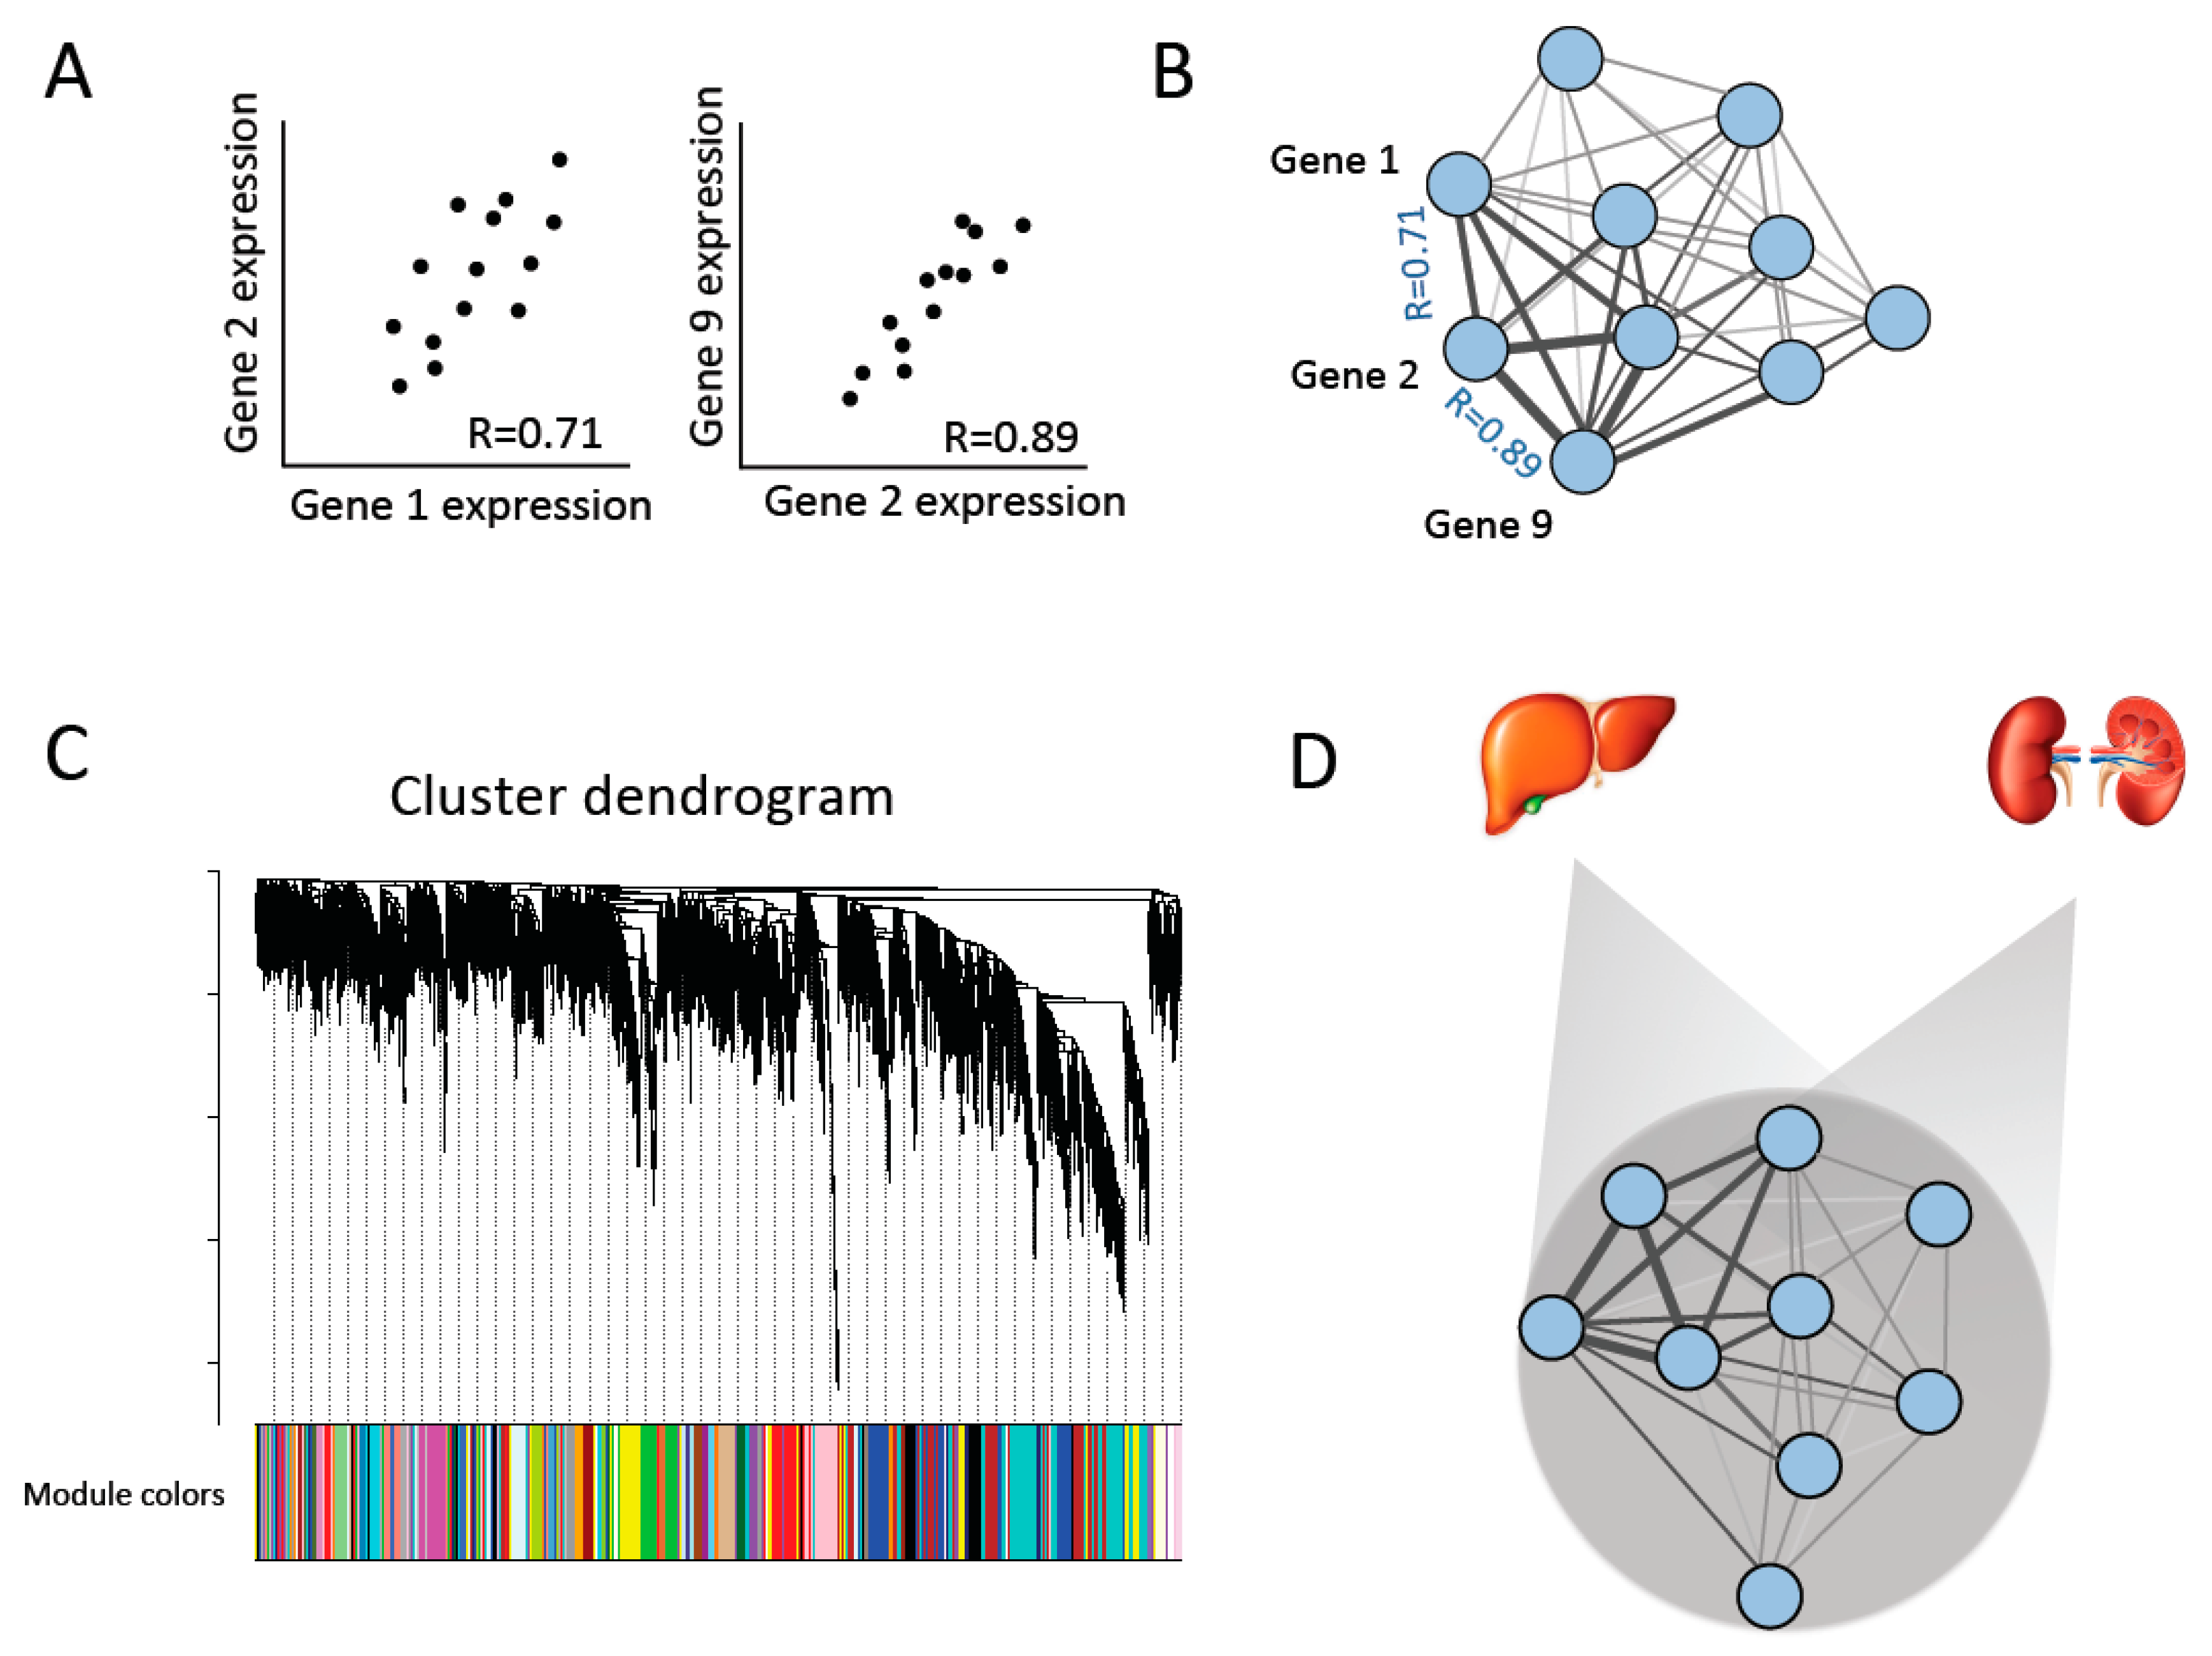
2.2. Co-Expression Analysis
2.3. Tissue Specificity
2.4. Allele-Specific Expression
2.5. Measures of Sequence Evolution
2.6. Enrichment Analyses
2.7. Protein Interaction Networks
2.8. Variant Annotations
3. Results
3.1. Properties of Gene Connectivity within and Across Tissues
3.2. Tissue Specific Expression and Connectivity
3.3. Relationship between Regulatory Variation and Connectivity
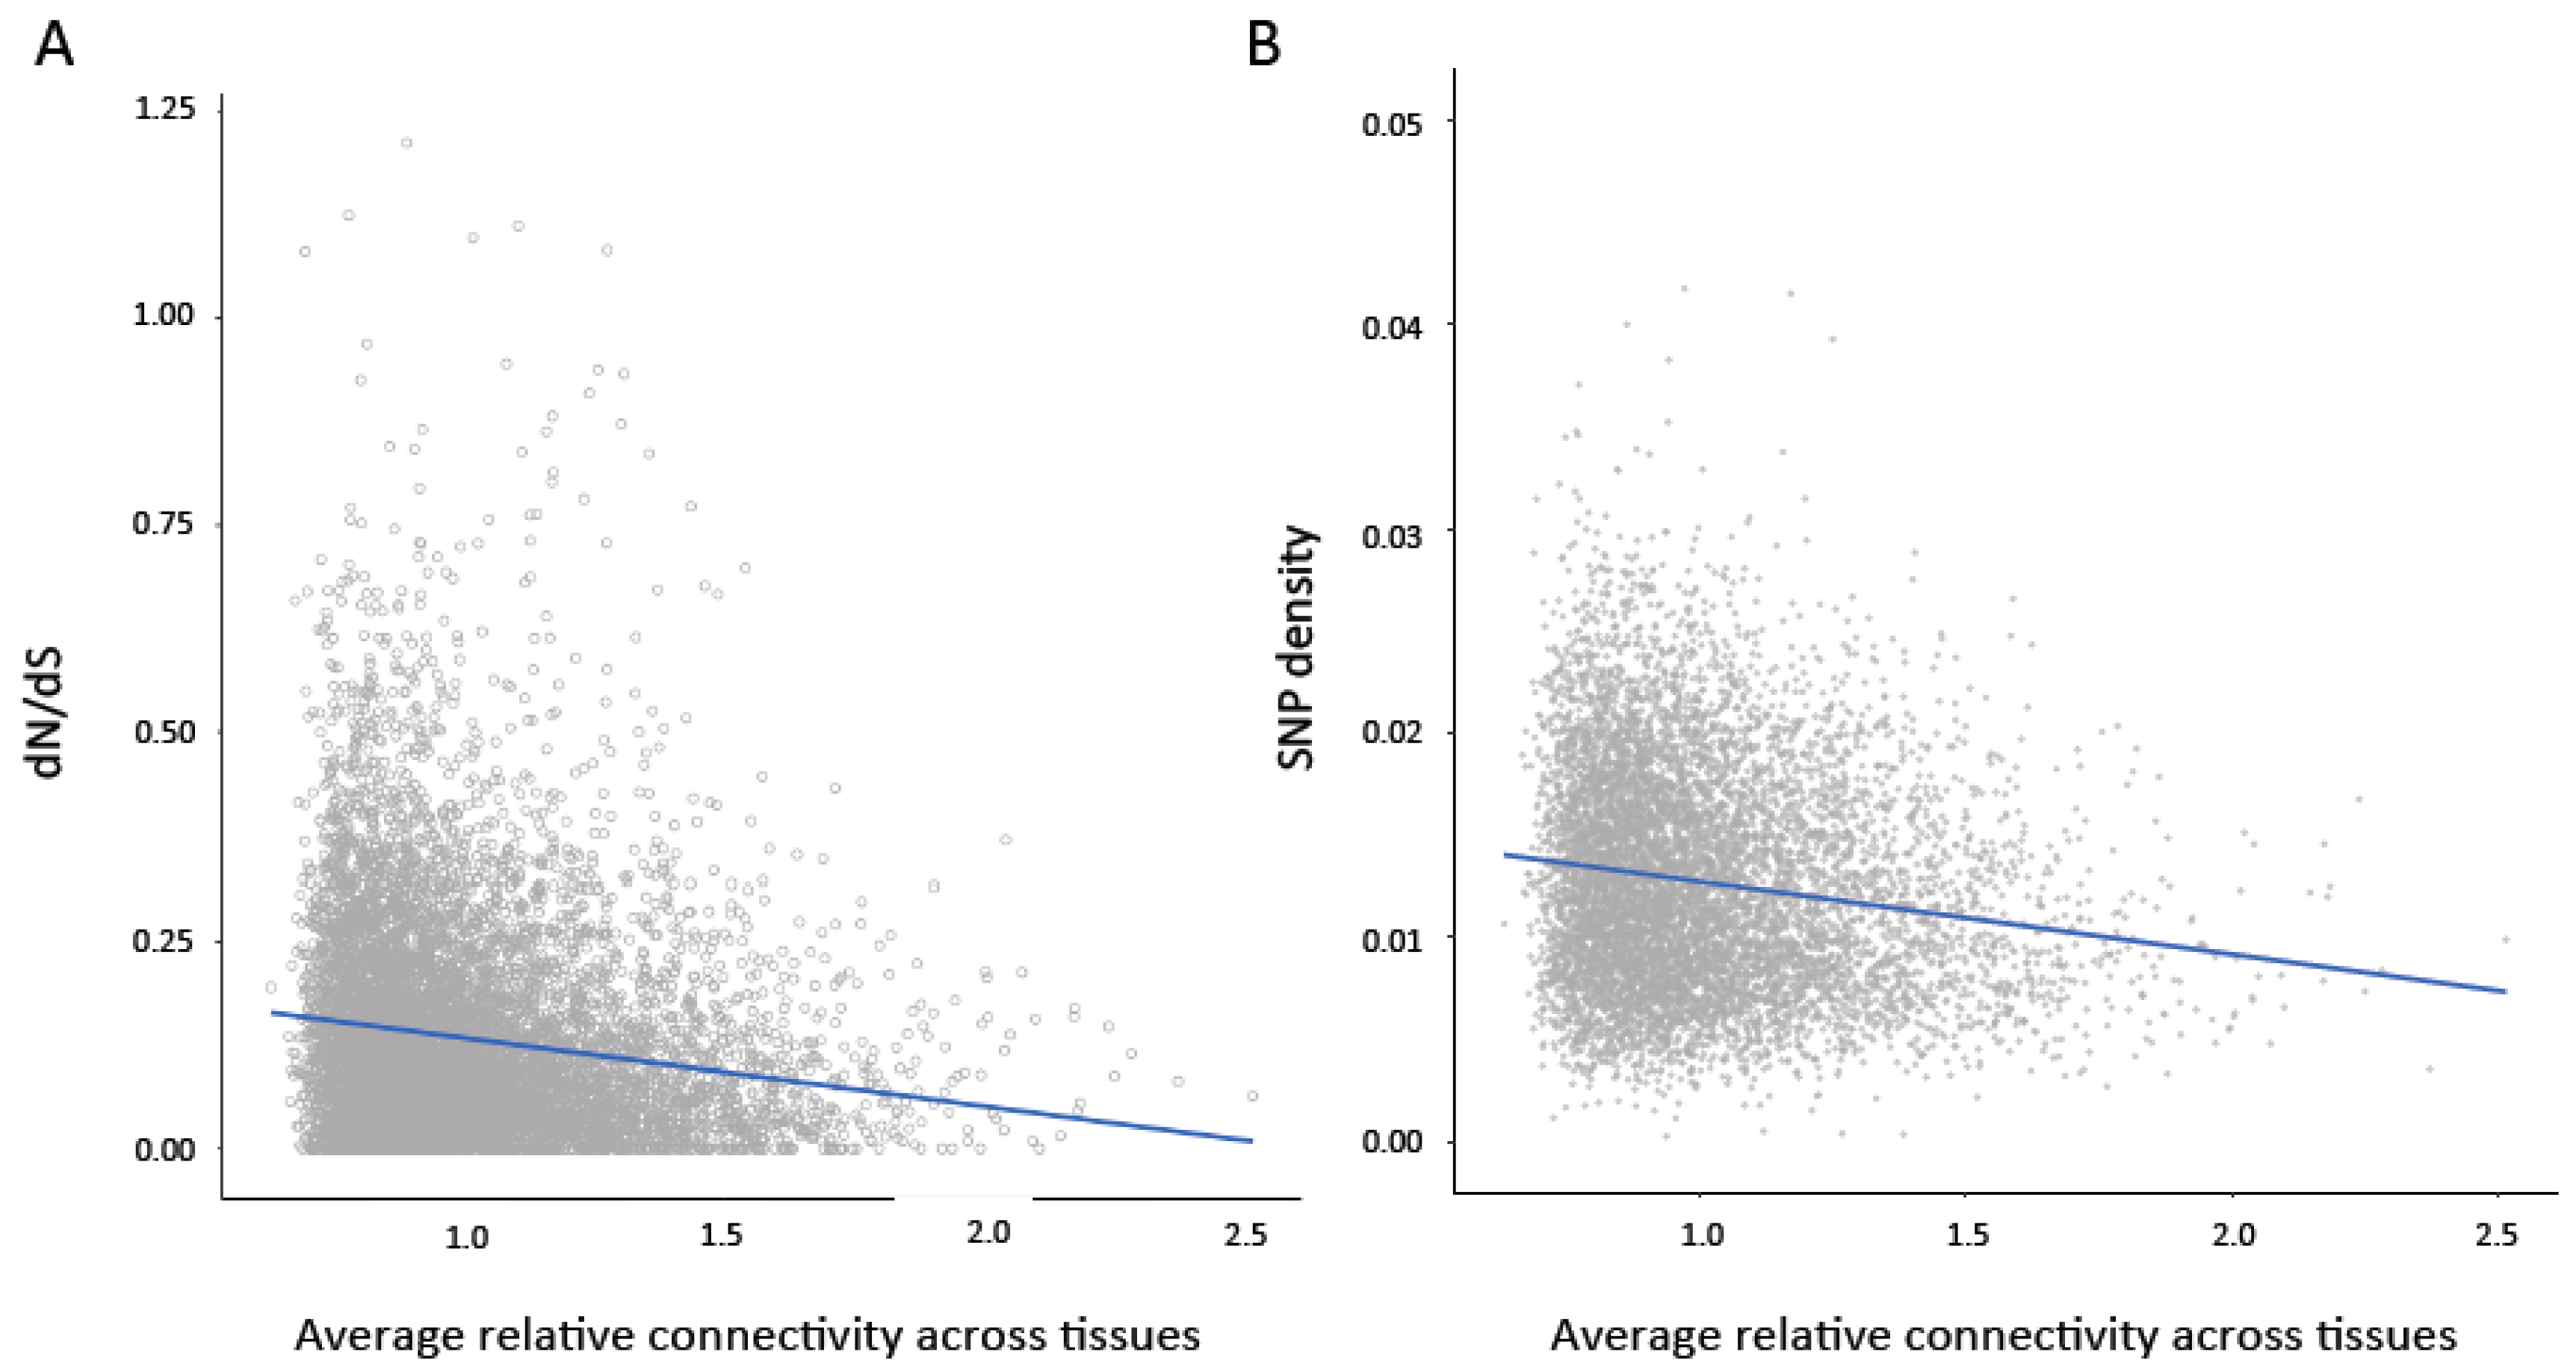
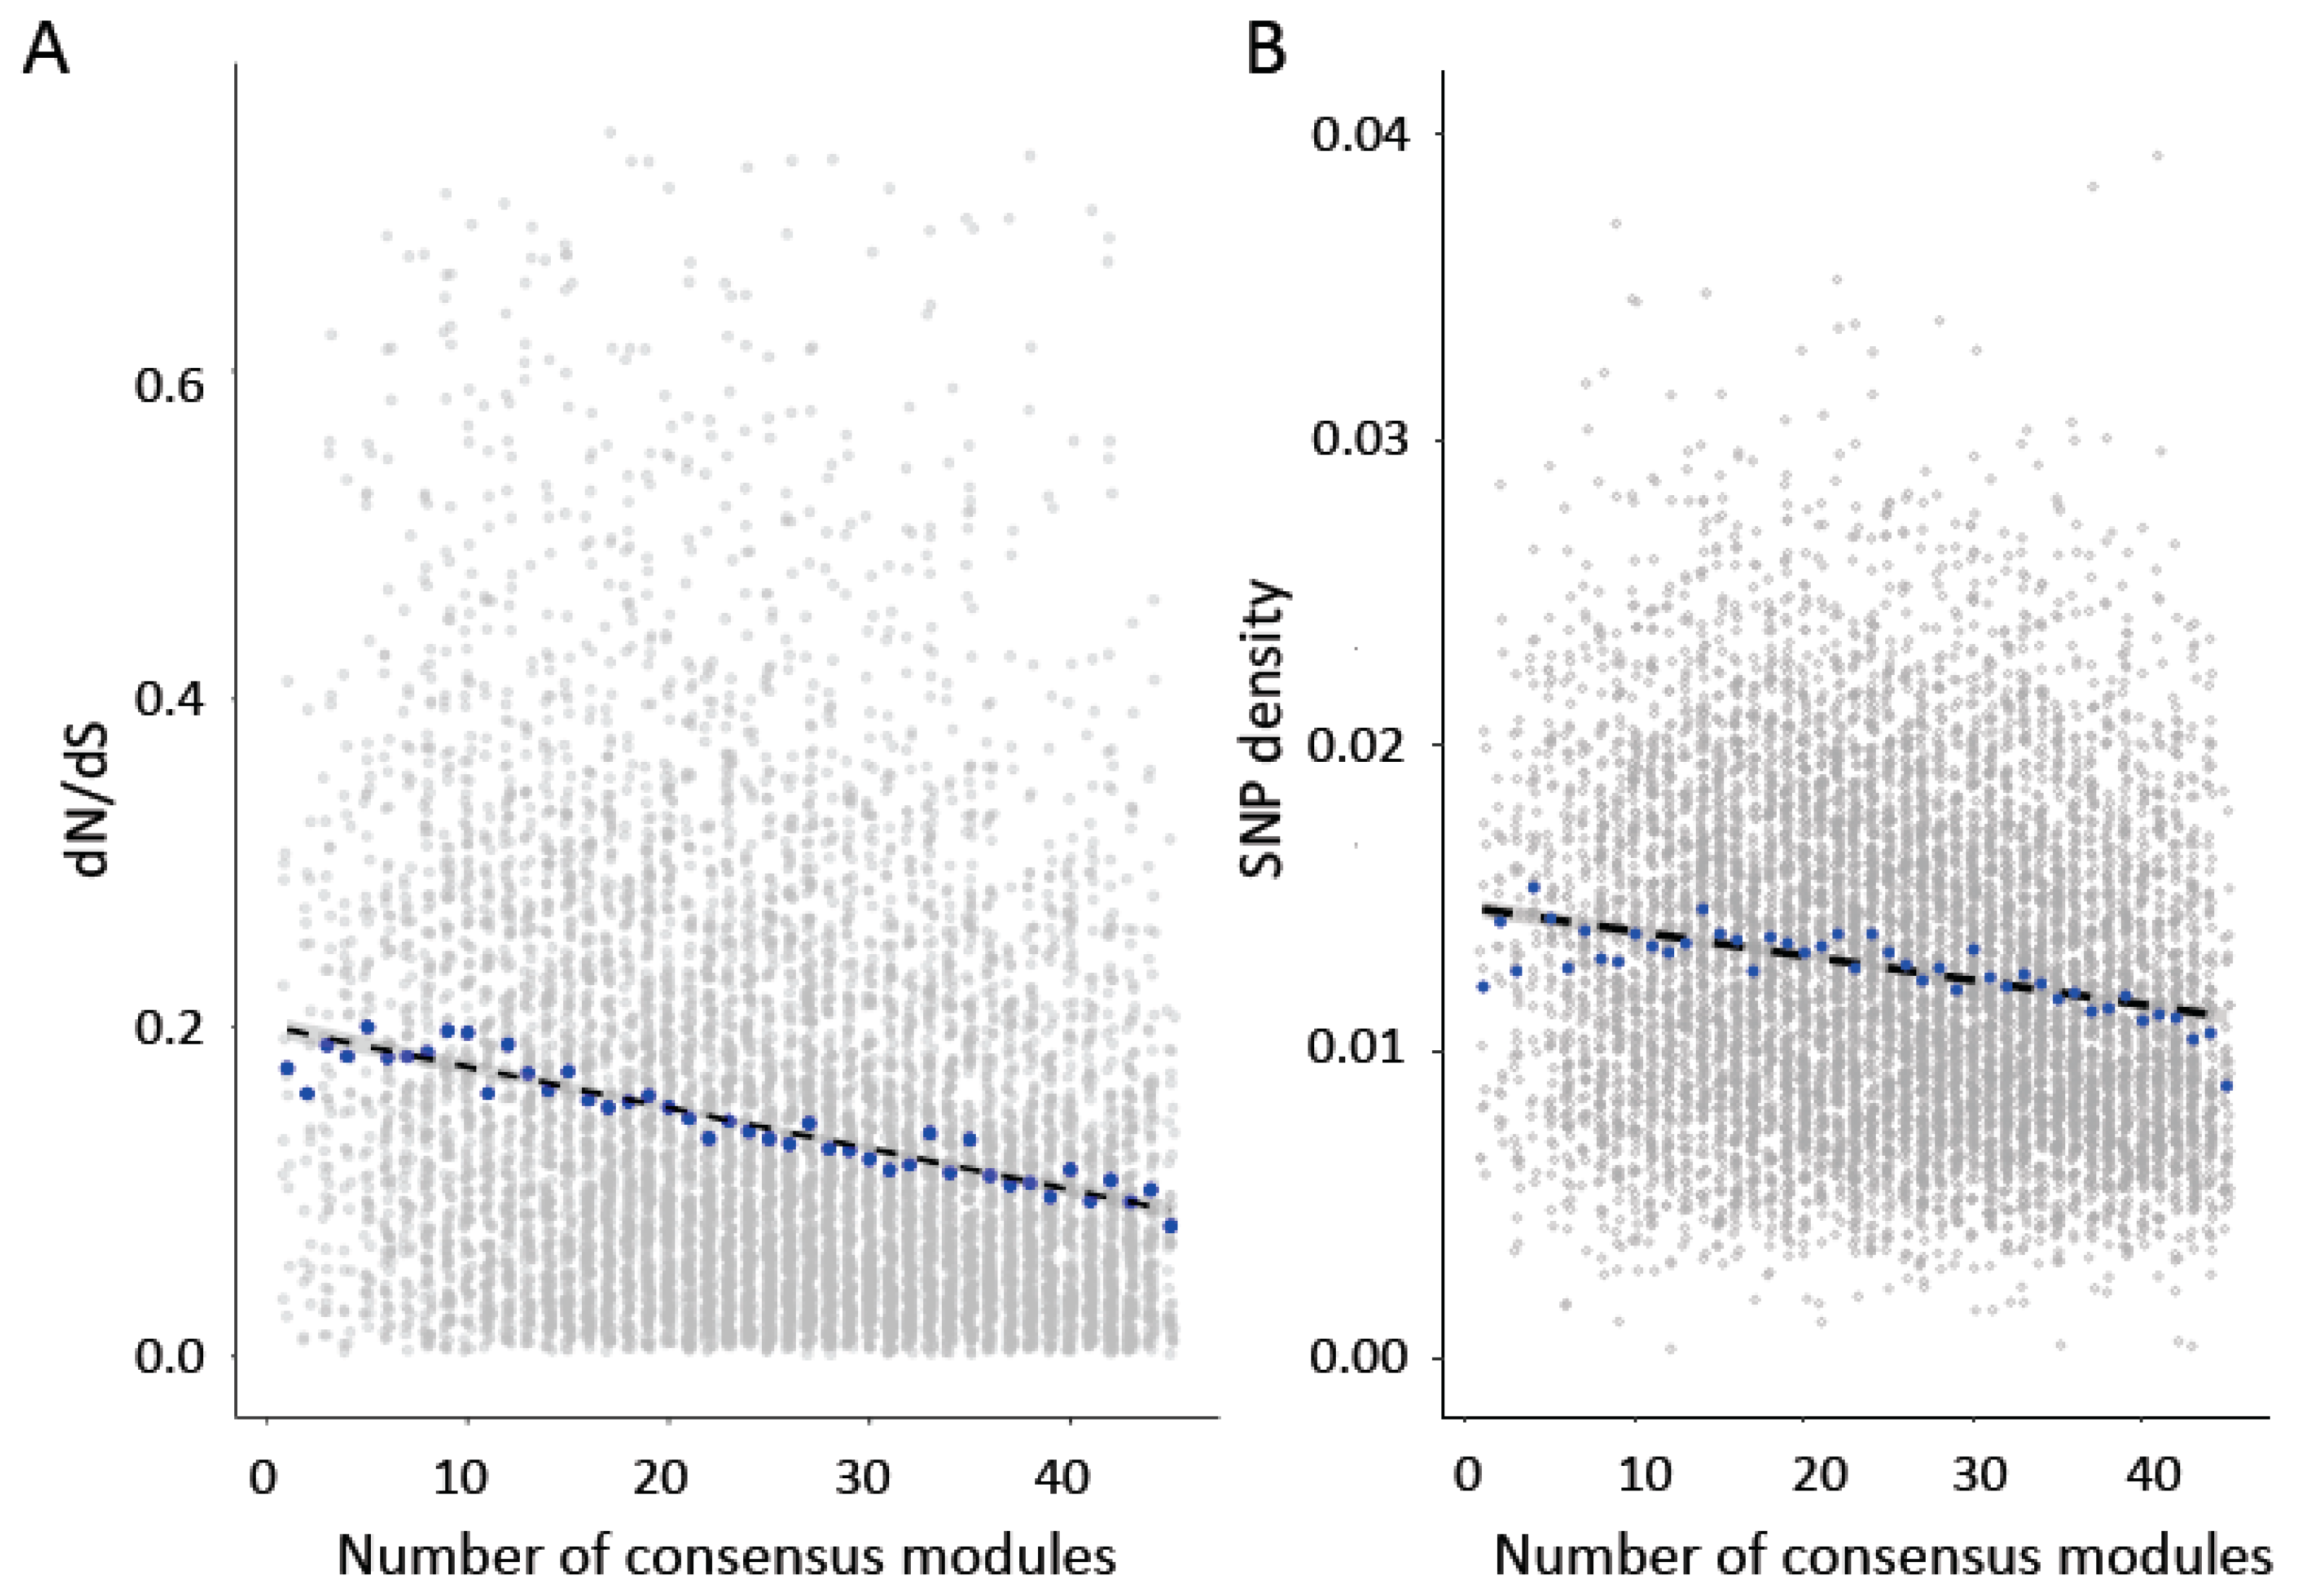
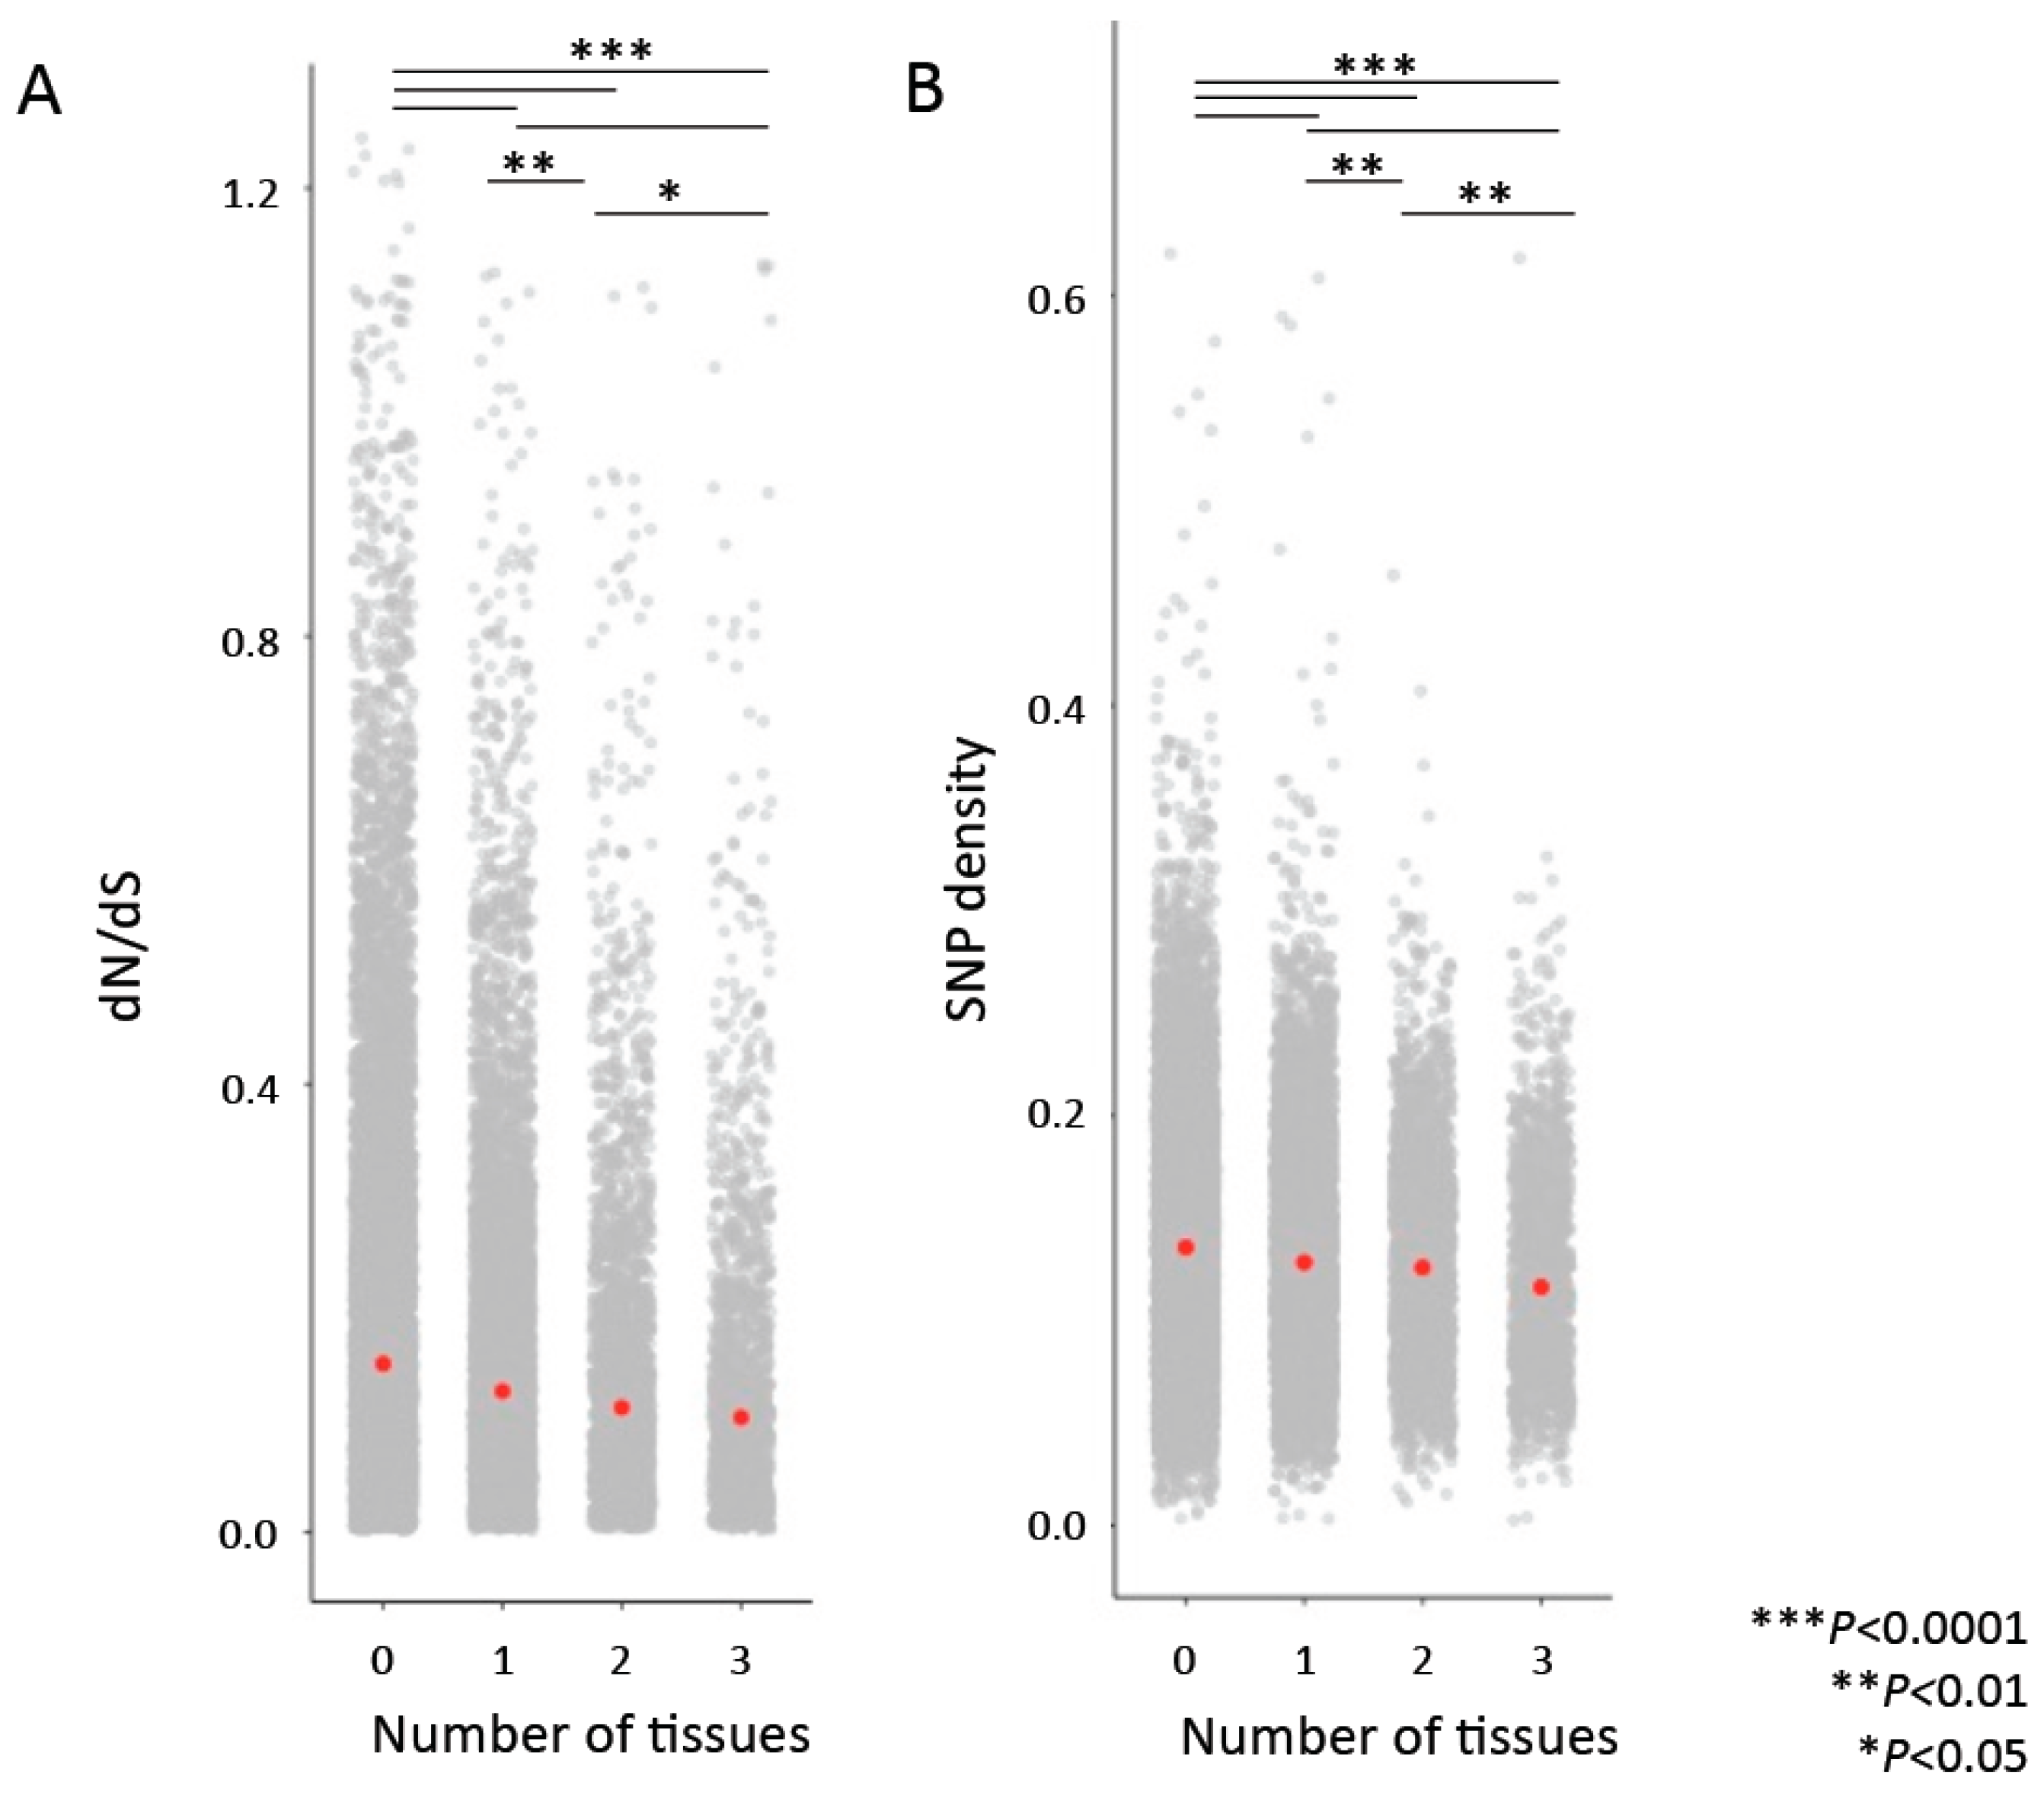
3.4. Relationship between Connectivity and Sequence Evolution
3.5. Constraint on Cross-Tissue Hub Genes
4. Discussion
Supplementary Materials
Author Contributions
Funding
Acknowledgments
Conflicts of Interest
References
- Fraser, H.B.; Hirsh, A.E.; Steinmetz, L.M.; Scharfe, C.; Feldman, M.W. Evolutionary rate in the protein interaction network. Science 2002, 296, 750–752. [Google Scholar] [CrossRef] [PubMed]
- Fraser, H.B.; Wall, D.P.; Hirsh, A.E. A simple dependence between protein evolution rate and the number of protein-protein interactions. BMC Evol. Biol. 2003, 3, 11. [Google Scholar] [CrossRef]
- Stern, D.L.; Orgogozo, V. The loci of evolution: How predictable is genetic evolution? Evolution 2008, 62, 2155–2177. [Google Scholar] [CrossRef] [PubMed]
- MacNeil, L.; Walhout, A.J. Gene regulatory networks and the role of robustness and stochasticity in the control of gene expression. Genome Res. 2011, 21, 645–657. [Google Scholar] [CrossRef] [PubMed]
- Pierson, E.; Koller, D.; Battle, A.; Mostafavi, S.; GTEx Consortium. Sharing and specificity of co-expression networks across 35 human tissues. PLoS Comput. Biol. 2015, 11, e1004220. [Google Scholar] [CrossRef] [PubMed]
- Stuart, J.M.; Segal, E.; Koller, D.; Kim, S.K. A gene-coexpression network for global discovery of conserved genetic modules. Science 2003, 302, 249–255. [Google Scholar] [CrossRef] [PubMed]
- Nowick, K.; Gernat, T.; Almaas, E.; Stubbs, L. Differences in human and chimpanzee gene expression patterns define an evolving network of transcription factors in brain. Proc. Natl. Acad. Sci. USA 2009, 106, 22358–22363. [Google Scholar] [CrossRef]
- Eidsaa, M.; Stubbs, L.; Almaas, E. Comparative analysis of weighted gene co-expression networks in human and mouse. PloS ONE 2017, 12, e0187611. [Google Scholar] [CrossRef]
- Ghazalpour, A.; Doss, S.; Zhang, B.; Wang, S.; Plaisier, C.; Castellanos, R.; Brozell, A.; Schadt, E.E.; Drake, T.A.; Lusis, A.J.; et al. Integrating genetic and network analysis to characterize genes related to mouse weight. PLoS Genet. 2006, 2, e130. [Google Scholar] [CrossRef]
- Chen, P.; Wang, F.; Feng, J.; Zhou, R.; Chang, Y.; Liu, J.; Zhao, Q. Co-expression network analysis identified six hub genes in association with metastasis risk and prognosis in hepatocellular carcinoma. Oncotarget 2017, 8, 48948. [Google Scholar] [CrossRef]
- Yuan, L.; Chen, L.; Qian, K.; Qian, G.; Wu, C.L.; Wang, X.; Xiao, Y. Co-expression network analysis identified six hub genes in association with progression and prognosis in human clear cell renal cell carcinoma (ccRCC). Genomics Data 2017, 14, 132–140. [Google Scholar] [CrossRef] [PubMed]
- Zhou, Z.; Cheng, Y.; Jiang, Y.; Liu, S.; Zhang, M.; Liu, J.; Zhao, Q. Ten hub genes associated with progression and prognosis of pancreatic carcinoma identified by co-expression analysis. Int. J. Biol. Sci. 2018, 14, 124. [Google Scholar] [CrossRef] [PubMed]
- Barabasi, A.L.; Oltvai, Z.N. Network biology: Understanding the cell’s functional organization. Nat. Rev. Genet. 2004, 5, 101. [Google Scholar] [CrossRef] [PubMed]
- Masalia, R.R.; Bewick, A.J.; Burke, J.M. Connectivity in gene coexpression networks negatively correlates with rates of molecular evolution in flowering plants. PLoS ONE 2017, 12, e0182289. [Google Scholar] [CrossRef]
- Josephs, E.B.; Wright, S.I.; Stinchcombe, J.R.; Schoen, D.J. The relationship between selection, network connectivity, and regulatory variation within a population of Capsella grandiflora. Genome Biol. Evol. 2017, 9, 1099–1109. [Google Scholar] [CrossRef] [PubMed]
- Mähler, N.; Wang, J.; Terebieniec, B.K.; Ingvarsson, P.K.; Street, N.R.; Hvidsten, T.R. Gene co-expression network connectivity is an important determinant of selective constraint. PLoS Genet. 2017, 13, e1006402. [Google Scholar]
- Sonawane, A.R.; Platig, J.; Fagny, M.; Chen, C.Y.; Paulson, J.N.; Lopes-Ramos, C.M.; DeMeo, D.L.; Quackenbush, J.; Glass, K.; Kuijjer, M.L. Understanding tissue-specific gene regulation. Cell Rep. 2017, 21, 1077–1088. [Google Scholar] [CrossRef]
- Morse, H.C., III. Building a better mouse: One hundred years of genetics and biology. In The Mouse in Biomedical Research; Foster, H.L., Small, D., Fox, J.G., Eds.; Academic Press: Cambridge, MA, USA, 2007; pp. 1–11. [Google Scholar]
- Phifer-Rixey, M.; Nachman, M.W. The natural history of model organisms: Insights into mammalian biology from the wild house mouse Mus musculus. eLife 2015, 4, e05959. [Google Scholar] [CrossRef]
- Harr, B.; Karakoc, E.; Neme, R.; Teschke, M.; Pfeifle, C.; Pezer, Ž.; Babiker, H.; Linnenbrink, M.; Montero, I.; Scavetta, R.; et al. Genomic resources for wild populations of the house mouse, Mus musculus and its close relative Mus spretus. Sci. Data 2016, 3, 160075. [Google Scholar] [CrossRef]
- Kim, D.; Pertea, G.; Trapnell, C.; Pimentel, H.; Kelley, R.; Salzberg, S.L. TopHat2: Accurate alignment of transcriptomes in the presence of insertions, deletions and gene fusions. Genome Biol. 2013, 14, R36. [Google Scholar] [CrossRef]
- Anders, S.; Pyl, P.T.; Huber, W. HTSeq—A Python framework to work with high-throughput sequencing data. Bioinformatics 2015, 31, 166–169. [Google Scholar] [CrossRef] [PubMed]
- Stegle, O.; Parts, L.; Durbin, R.; Winn, J. A Bayesian framework to account for complex non-genetic factors in gene expression levels greatly increases power in eQTL studies. PLoS Comput. Biol. 2010, 6, e1000770. [Google Scholar] [CrossRef] [PubMed]
- Stegle, O.; Parts, L.; Piipari, M.; Winn, J.; Durbin, R. Using probabilistic estimation of expression residuals (PEER) to obtain increased power and interpretability of gene expression analyses. Nat. Protoc. 2012, 7, 500–507. [Google Scholar] [CrossRef] [PubMed]
- Albert, F.W.; Kruglyak, L. The role of regulatory variation in complex traits and disease. Nat. Rev. Genet. 2015, 16, 197. [Google Scholar] [CrossRef] [PubMed]
- GTEx Consortium. The Genotype-Tissue Expression (GTEx) pilot analysis: Multitissue gene regulation in humans. Science 2015, 348, 648–660. [Google Scholar] [CrossRef] [PubMed]
- GTEx Consortium. Genetic effects on gene expression across human tissues. Nature 2017, 550, 204. [Google Scholar] [CrossRef] [PubMed]
- Zheng, X.; Levine, D.; Shen, J.; Gogarten, S.M.; Laurie, C.; Weir, B.S. A high-performance computing toolset for relatedness and principal component analysis of SNP data. Bioinformatics 2012, 28, 3326–3328. [Google Scholar] [CrossRef]
- Langfelder, P.; Horvath, S. WGCNA: An R package for weighted correlation network analysis. BMC Bioinform. 2008, 9, 559. [Google Scholar] [CrossRef]
- Langfelder, P.; Zhang, B.; Horvath, S. Defining clusters from a hierarchical cluster tree: The Dynamic Tree Cut package for R. Bioinformatics 2007, 24, 719–720. [Google Scholar] [CrossRef]
- Langfelder, P.; Horvath, S. Eigengene networks for studying the relationships between co-expression modules. BMC Syst. Biol. 2007, 1, 54. [Google Scholar] [CrossRef]
- Oldham, M.C.; Horvath, S.; Geschwind, D.H. Conservation and evolution of gene coexpression networks in human and chimpanzee brains. Proc. Natl. Acad. Sci. USA 2006, 103, 17973–17978. [Google Scholar] [CrossRef] [PubMed]
- McKenna, A.; Hanna, M.; Banks, E.; Sivachenko, A.; Cibulskis, K.; Kernytsky, A.; Garimella, K.; Altshuler, D.; Gabriel, S.; Daly, M.; et al. The Genome Analysis Toolkit: A MapReduce framework for analyzing next-generation DNA sequencing data. Genome Res. 2010, 20, 1297–1303. [Google Scholar] [CrossRef]
- Mack, K.L.; Ballinger, M.A.; Phifer-Rixey, M.; Nachman, M.W. Gene regulation underlies environmental adaptation in house mice. Genome Res. 2018, 28, 1636–1645. [Google Scholar] [CrossRef] [PubMed]
- Zerbino, D.R.; Achuthan, P.; Akanni, W.; Barrell, D.; Bhai, J.; Billis, K.; Cummins, C.; Gall, A.; Haggerty, L.; Haskell, E.; et al. Ensembl. Nucleic Acids Res. 2018, 46, D754–D761. [Google Scholar] [CrossRef]
- Weng, M.P.; Liao, B.Y. modPhEA: Model organism Phenotype Enrichment Analysis of eukaryotic gene sets. Bioinformatics 2017, 33, 3505–3507. [Google Scholar] [CrossRef] [PubMed]
- Mi, H.; Huang, X.; Muruganujan, A.; Tang, H.; Mills, C.; Kang, D.; Thomas, P.D. PANTHER version 11: Expanded annotation data from Gene Ontology and Reactome pathways, and data analysis tool enhancements. Nucleic Acids Res. 2016, 45, D183–D189. [Google Scholar] [CrossRef] [PubMed]
- Von Mering, C.; Jensen, L.J.; Snel, B.; Hooper, S.D.; Krupp, M.; Foglierini, M.; Jouffre, N.; Huynen, M.A.; Bork, P. STRING: Known and predicted protein–protein associations, integrated and transferred across organisms. Nucleic Acids Res. 2005, 33, D433–D437. [Google Scholar] [CrossRef]
- Szklarczyk, D.; Morris, J.H.; Cook, H.; Kuhn, M.; Wyder, S.; Simonovic, M.; Santos, A.; Doncheva, N.T.; Roth, A.; et al. The STRING database in 2017: Quality-controlled protein-protein association networks, made broadly accessible. Nucleic Acids Res. 2017, 45, D362–D368. [Google Scholar] [CrossRef] [PubMed]
- McLaren, W.; Gil, L.; Hunt, S.E.; Riat, H.S.; Ritchie, G.R.; Thormann, A.; Flicek, P.; Cunningham, F. The ensembl variant effect predictor. Genome Biol. 2016, 17, 122. [Google Scholar] [CrossRef]
- Fagerberg, L.; Hallström, B.M.; Oksvold, P.; Kampf, C.; Djureinovic, D.; Odeberg, J.; Habuka, M.; Tahmasebpoor, S.; Danielsson, A.; Edlund, K.; et al. Analysis of the human tissue-specific expression by genome-wide integration of transcriptomics and antibody-based proteomics. Mol. Cell Proteom. 2014, 13, 397–406. [Google Scholar] [CrossRef]
- Zhu, J.; Chen, G.; Zhu, S.; Li, S.; Wen, Z.; Li, B.; Zheng, Y.; Shi, L. Identification of tissue-specific protein-coding and noncoding transcripts across 14 human tissues using RNA-seq. Sci. Rep. 2016, 6, 28400. [Google Scholar] [CrossRef] [PubMed]
- Kummerfeld, S.K.; Teichmann, S.A. DBD: A transcription factor prediction database. Nucleic Acids Res. 2006, 34, D74–D81. [Google Scholar] [CrossRef] [PubMed]
- Cowles, C.R.; Hirschhorn, J.N.; Altshuler, D.; Lander, E.S. Detection of regulatory variation in mouse genes. Nat. Gent. 2002, 32, 432–437. [Google Scholar] [CrossRef] [PubMed]
- Fontanillas, P.; Landry, C.R.; Wittkopp, P.J.; Russ, C.; Gruber, J.D.; Nusbaum, C.; Hartl, D.L. Key considerations for measuring allelic expression on a genomic scale using high-throughput sequencing. Mol. Ecol. 2010, 19, 212–227. [Google Scholar] [CrossRef] [PubMed]
- Pechmann, S.; Frydman, J. Evolutionary conservation of codon optimality reveals hidden signatures of cotranslational folding. Nat. Struct. Mol. Biol. 2013, 20, 237. [Google Scholar] [CrossRef] [PubMed]
- Hernandez, R.D.; Kelley, J.L.; Elyashiv, E.; Melton, S.C.; Auton, A.; McVean, G.; Sella, G.; Przeworski, M. Classic selective sweeps were rare in recent human evolution. Science 2011, 331, 920–924. [Google Scholar] [CrossRef]


| dN/dS | SNP Density | |||
|---|---|---|---|---|
| Variable | Pairwise 1 | Partial 2 | Pairwise | Partial |
| Average expression level across tissues | −0.26 *** | −0.15 *** | −0.15 *** | −0.14 *** |
| Expression IQR across tissues | −0.22 *** | 0.042 ** | −0.05 *** | 0.17 *** |
| Average connectivity across tissues | −0.18 *** | −0.045 *** | −0.16 *** | −0.09 *** |
| Connectivity IQR across tissues | −0.12 *** | 0.04 ** | −0.11 *** | −0.04 *** |
© 2019 by the authors. Licensee MDPI, Basel, Switzerland. This article is an open access article distributed under the terms and conditions of the Creative Commons Attribution (CC BY) license (http://creativecommons.org/licenses/by/4.0/).
Share and Cite
Mack, K.L.; Phifer-Rixey, M.; Harr, B.; Nachman, M.W. Gene Expression Networks Across Multiple Tissues Are Associated with Rates of Molecular Evolution in Wild House Mice. Genes 2019, 10, 225. https://doi.org/10.3390/genes10030225
Mack KL, Phifer-Rixey M, Harr B, Nachman MW. Gene Expression Networks Across Multiple Tissues Are Associated with Rates of Molecular Evolution in Wild House Mice. Genes. 2019; 10(3):225. https://doi.org/10.3390/genes10030225
Chicago/Turabian StyleMack, Katya L., Megan Phifer-Rixey, Bettina Harr, and Michael W. Nachman. 2019. "Gene Expression Networks Across Multiple Tissues Are Associated with Rates of Molecular Evolution in Wild House Mice" Genes 10, no. 3: 225. https://doi.org/10.3390/genes10030225
APA StyleMack, K. L., Phifer-Rixey, M., Harr, B., & Nachman, M. W. (2019). Gene Expression Networks Across Multiple Tissues Are Associated with Rates of Molecular Evolution in Wild House Mice. Genes, 10(3), 225. https://doi.org/10.3390/genes10030225