Article

Chalcone Synthase-Encoding AeCHS is Involved in Normal Petal Coloration in Actinidia eriantha

1
Zhengzhou Fruit Research Institute, Chinese Academy of Agricultural Sciences, Zhengzhou 450009, China
2
Key Laboratory of Horticultural Plant Biology, College of Horticulture & Forestry Sciences of Huazhong Agricultural University, Wuhan 430000, China
*
Author to whom correspondence should be addressed.
Genes 2019, 10(12), 949; https://doi.org/10.3390/genes10120949
Submission received: 31 August 2019 / Revised: 13 November 2019 / Accepted: 18 November 2019 / Published: 20 November 2019
(This article belongs to the Section Plant Genetics and Genomics)

Abstract

:
Studies on anthocyanin biosynthesis have been mainly concentrated on the fruit, whereas few have focused the mechanism of flower coloration in kiwifruit. Here, we report that the structural gene, AeCHS, is involved in anthocyanin accumulation and indispensable for normal petal coloration in Actinidia eriantha. Petals from three different species including Actinidia eriantha (red petals), Actinidia hemsleyana (light pink petals) and Actinidia arguta (white petals) were selected for anthocyanin determination and gene expression analysis. The anthocyanin components in A. eriantha were significantly higher than in A. hemsleyana or A. arguta. Consistently, gene expression profiles suggested that AeCHS expression in A. eriantha was higher than in A. hemsleyana or A. arguta. Cluster analysis showed that AeCHS was clustered into a single group and distinctly separated from other genes, indicating the expression pattern of AeCHS gene was different from any other. Additionally, correlation analysis revealed AeCHS expression significantly correlated with anthocyanin content. The complete coding sequence of AeCHS was cloned from petals of A. eriantha ‘Zaoxu’, showing the length of AeCHS was 1170 bp encoding a protein of 389 amino acids. AeCHS was located in the cytoplasm, indicating it is indeed a structural gene involved in anthocyanin biosynthesis. AeCHS silencing performed by infiltration grafting-mediated virus-induced gene silencing (VIGS) reduced petal anthocyanin content and bleached red petals in A. eriantha. Our results confirm a crucial role of AeCHS in anthocyanin biosynthesis and accumulation in A. eriantha petals; furthermore, they offer important basic information and constitute a reference point for further research.

1. Introduction

Kiwifruit belongs to the genus Actinidia of the Actinidiaceae. It is a perennial deciduous fruit tree originated in China [1] that comprises over 70 species that vary extensively with regard to fruit type and flowers, most of them distributed in China [2]. The commercial cultivation of kiwifruit, one of the four fruit trees successfully domesticated in the last century, has extended around the world [3]. The most important tissue in most fruit trees is ripened fruit flesh, because of their unique flavor and delicious rich taste, which is highly valued in the market and therefore, of significant economic benefit for producers. Thus, plant breeders are committed to developing new cultivars to cater for the market demand. ‘Hayward,’ the most popular kiwifruit cultivar, has dominated global markets for many years [4].
In addition to the fruit, flowers are important during the growth and development of the kiwifruit tree. Several Actinida species, such as A. eriantha, A. hemsleyana, A. longicarpa, A. arguta, A. polygama, among others, show red, pink, or white petals at full bloom [5]. A. eriantha with bright colored petals has the potential to be a suitable ornamental kiwifruit tree whose promotion and development has recently started.
As is the case with red fruit coloration [6,7], red kiwifruit flowers are also due to the biosynthesis and accumulation of anthocyanins [8,9], a kind of water-soluble pigments produced by a branch in the flavonoid pathway that seemingly play an important role as attractants of insect and animal pollinators and seed dispersers [10,11]. Further, as natural food pigments, anthocyanins are of importance not only as plant endogenous compounds involved in a variety of biological responses but as natural plant extracts with enormous potential for human health as well [12,13,14,15,16,17]. The Anthocyanin biosynthetic pathway and the related genes including structural and regulatory genes have been extensively studied in plants [18,19,20,21,22,23,24,25,26,27,28,29,30].
We have summarized schematically the components of the pathway possibly occurring in kiwifruit in Figure 1, based on previous research on the biosynthetic pathway of anthocyanin [6,31,32]. Similarly, previous studies showed that transcript abundance of most structural genes related to anthocyanin synthesis, such as CHS (encoding chalcone synthase), F3H (encoding flavanone 3-hydroxylase), DFR (encoding dihydroflavonol-4-reductase), and UFGT (encoding UDP-glucose: flavonoid 3-O-glycosyltransferase), are highly correlated with anthocyanin accumulation [33,34,35].
Numerous studies have focused on anthocyanin biosynthesis in fruits, but few on the mechanism of flower coloration. The overexpression of SVP3 gene in kiwifruit affects reproductive development and suppresses anthocyanin biosynthesis in petals [9]. In addition, an R2R3 MYB transcription factor (MYB110a) reportedly determined red petal color in a kiwifruit hybrid population [8]. These studies provide a molecular basis for anthocyanin regulation of red petal coloration in kiwifruit; however, the specific structural gene that plays a decisive role in the formation of red petals remains elusive.
With the advent of the post-genomic and molecular biological era, an increasing number of combinations of omics and experimental systems are applied to unravel various biological phenomena. In kiwifruit, two Actinidia species including Actinidia chinensis and Actinidia eriantha have allowed the completion of genome sequencing [36,37,38], thus providing a sequence basis for the study of the molecular mechanism underlying various biological traits. Nonetheless, functional genomic studies in kiwifruit are still seriously limited compared with other model plants because of the late start of molecular biology techniques and the long period of the genetic transformation system in this case, where virus-induced gene silencing (VIGS) may be an ideal method to perform verification experiments of gene function by silencing the correct target gene. VIGS used for functional characterization of genes has been extensively reported in various plant species, including tobacco [39,40], rose [41,42,43], cotton [44], pea [45], potato [46], tomato [47,48,49], apple [50], and strawberry [51]. Furthermore, VIGS was recently successfully used in kiwifruit [52].
As perennial woody plants, grafting is the main reproductive mode for fruit trees, with the survival rate of grafts depending on the affinity of rootstocks and scions [53]. Therefore, the combination of grafting technology and VIGS may be a useful strategy to obtain information about a gene function of interest. Therefore, we used infiltration grafting-mediated VIGS to verify the role of a target gene in kiwifruit petal coloration.
To explore possible molecular mechanisms underlying petal coloration, a series of physiological and biochemical experiments were carried out as well as a new try of infiltration grafting-mediated VIGS, providing new insight for anthocyanin biosynthesis and accumulation of kiwifruit petals.

2. Materials and Methods

2.1. Flower Materials

Three types of flowers of different color, from three different Actinidia species including Actinidia eriantha ‘Zaoxu’, Actinidia hemsleyana NY-CY’, and Actinidia arguta ‘XX-RZ’, were collected from the National Kiwifruit Germplasm Garden (34.71569° N, 113.7122° E), at the Zhengzhou Fruit Research Institute of the Chinese Academy of Agricultural Sciences, Henan Province, China. The color of the petals of the three types of flowers at full blooming stage were red, light pink and white, respectively (Figure 2). For each Actinidia species, approximately 60 flowers were sampled from three independent vines. The petals were separated from the flowers, immediately frozen in liquid nitrogen, and stored at −80 °C until use for anthocyanin and RNA extraction.
For grafting experiments, branches with one unopened bud to be used for scions were cut from the adult Actinidia eriantha vine and terminal part was removed. Actinidia valvata twigs were used as rootstocks. Scions were grafted onto rootstocks by the traditional cleft grafting method and wrapped in transparent bags to keep high humidity conditions until bud opening.

2.2. Extraction and Determination of Anthocyanins and Precursors

Considering that anthocyanins are sensitive to light and easy to degrade, the whole extraction process was carried out under dark conditions. The extraction procedure was carried out according to the modified protocol for the determination of anthocyanins in products of plant origin, of the Agricultural Industry Standards of the People’s Republic of China (NY/T2640-2014). Briefly, approximately two grams of petal tissue were ground and extracted in an 80:20:1 solution t of anhydrous ethanol, water, and formic acid. The extracts were passed through a syringe filter with a 0.45-µm filter membrane (Jinteng, Tianjin, China) prior to chromatographic analysis. Qualitative and quantitative determination of anthocyanins and their precursors were conducted by ultra-performance liquid chromatography coupled with tandem mass spectrometry (UPLC-MS/MS) (Agilent Technologies Inc., CA, USA). Dihydroquercetin (CAS: 480-18-2), dihydromyricetin (CAS: 27200-12-0), cyanidin (CAS: 528-58-5), delphinidin (CAS: 528-53-0), cyanidin-3-O-galactoside (CAS: 27661-36-5), cyanidin-3-O-xylose-galactoside (CAS: 31073-32-2), and delphinidin-3-O-galactoside (CAS: 28500-00-7) were used as authentic standards for constructing the corresponding standard curves for single point quantitation.
In petal samples used for VIGS, measurements of total anthocyanin content were carried out using the Plant Anthocyanin Content Detection Kit (Solarbio, Beijing, China) according to manufacturer instructions.

2.3. Total RNA Extraction, cDNA Synthesis, and qRT-PCR Analysis

Total RNA was extracted from petals using the Quick RNA Isolation Kit (Huayueyang, Beijing, China) in accordance with manufacturer instructions. The integrity and concentration of RNA were assessed and determined by 1% agarose gel electrophoresis and micro ultraviolet spectrophotometry using NanoDrop 2000 (Thermo Fisher Scientific, MA, USA), respectively. Approximately 1 µg of total RNA was used for cDNA synthesis using RevertAid™ First Strand cDNA Synthesis Kit (Thermo Fisher Scientific, MA, USA) according to manufacturer instructions. Fifteen genes encoding enzymes involved in anthocyanin biosynthesis were obtained from Actinidia chinensis cv ‘Red 5′ [37] or ‘Hongyang’ genomes [36]. Primers used for quantitative real-time polymerase chain reaction (qRT-PCR) were designed using Primer-Blast online tool in the National Center for Biotechnology Information (NCBI, https://www.ncbi.nlm.nih.gov/tools/primer-blast/). The specific primer sequences of these fifteen genes used for qRT-PCR are listed in Table 1. The 20-µL reaction mixture contained 5 µL of double distilled water, 10 µL of SYBR Green I Master Mix (Roche, Basel, Switzerland), 1 µL of forward and reverse primers for each gene, and 3 µL of cDNA template (diluted 40 times). The LightCycler® 480 realtime PCR system (Roche, Basel, Switzerland) with a 96-well plate was used for qRT-PCR, and three biological replicates were included for each condition. Kiwifruit β-actin served as reference gene for normalization [54]. Relative quantification of gene expression level was performed using the 2(-Delta C(T)) (2−ΔΔCt) method as described previously [55].

2.4. Cloning and Sequencing of AeCHS

The coding sequence of CHS (DTZ79_22g06860) from the genome of Actinidia eriantha ‘White’ was selected as reference to design a primer [38]. The coding sequence (CDS) of AeCHS was amplified from A. eriantha ‘Zaoxu’ red petal sample by specific primers 5′-ATGGTGACTGTCGAGGAAGTTC-3′(forward) and 5′-CTAAGTGCACAGGCTATGGAGC-3′(reverse) using high-fidelity DNA polymerase KOD-Plus-Neo (TOYOBO, Osaka, Japan). The amplified product was inserted into the pMD18-T vector (TsingKe Biological Technology, Beijing, China) by using the TA cloning method. The construct was transformed to E. coli DH5α competent cells cultured on LB agar plates with ampicillin and incubated at 37 ℃. After PCR detection, positive clones were sequenced by the Sanger system (Sangon Biotech, Shanghai, China).

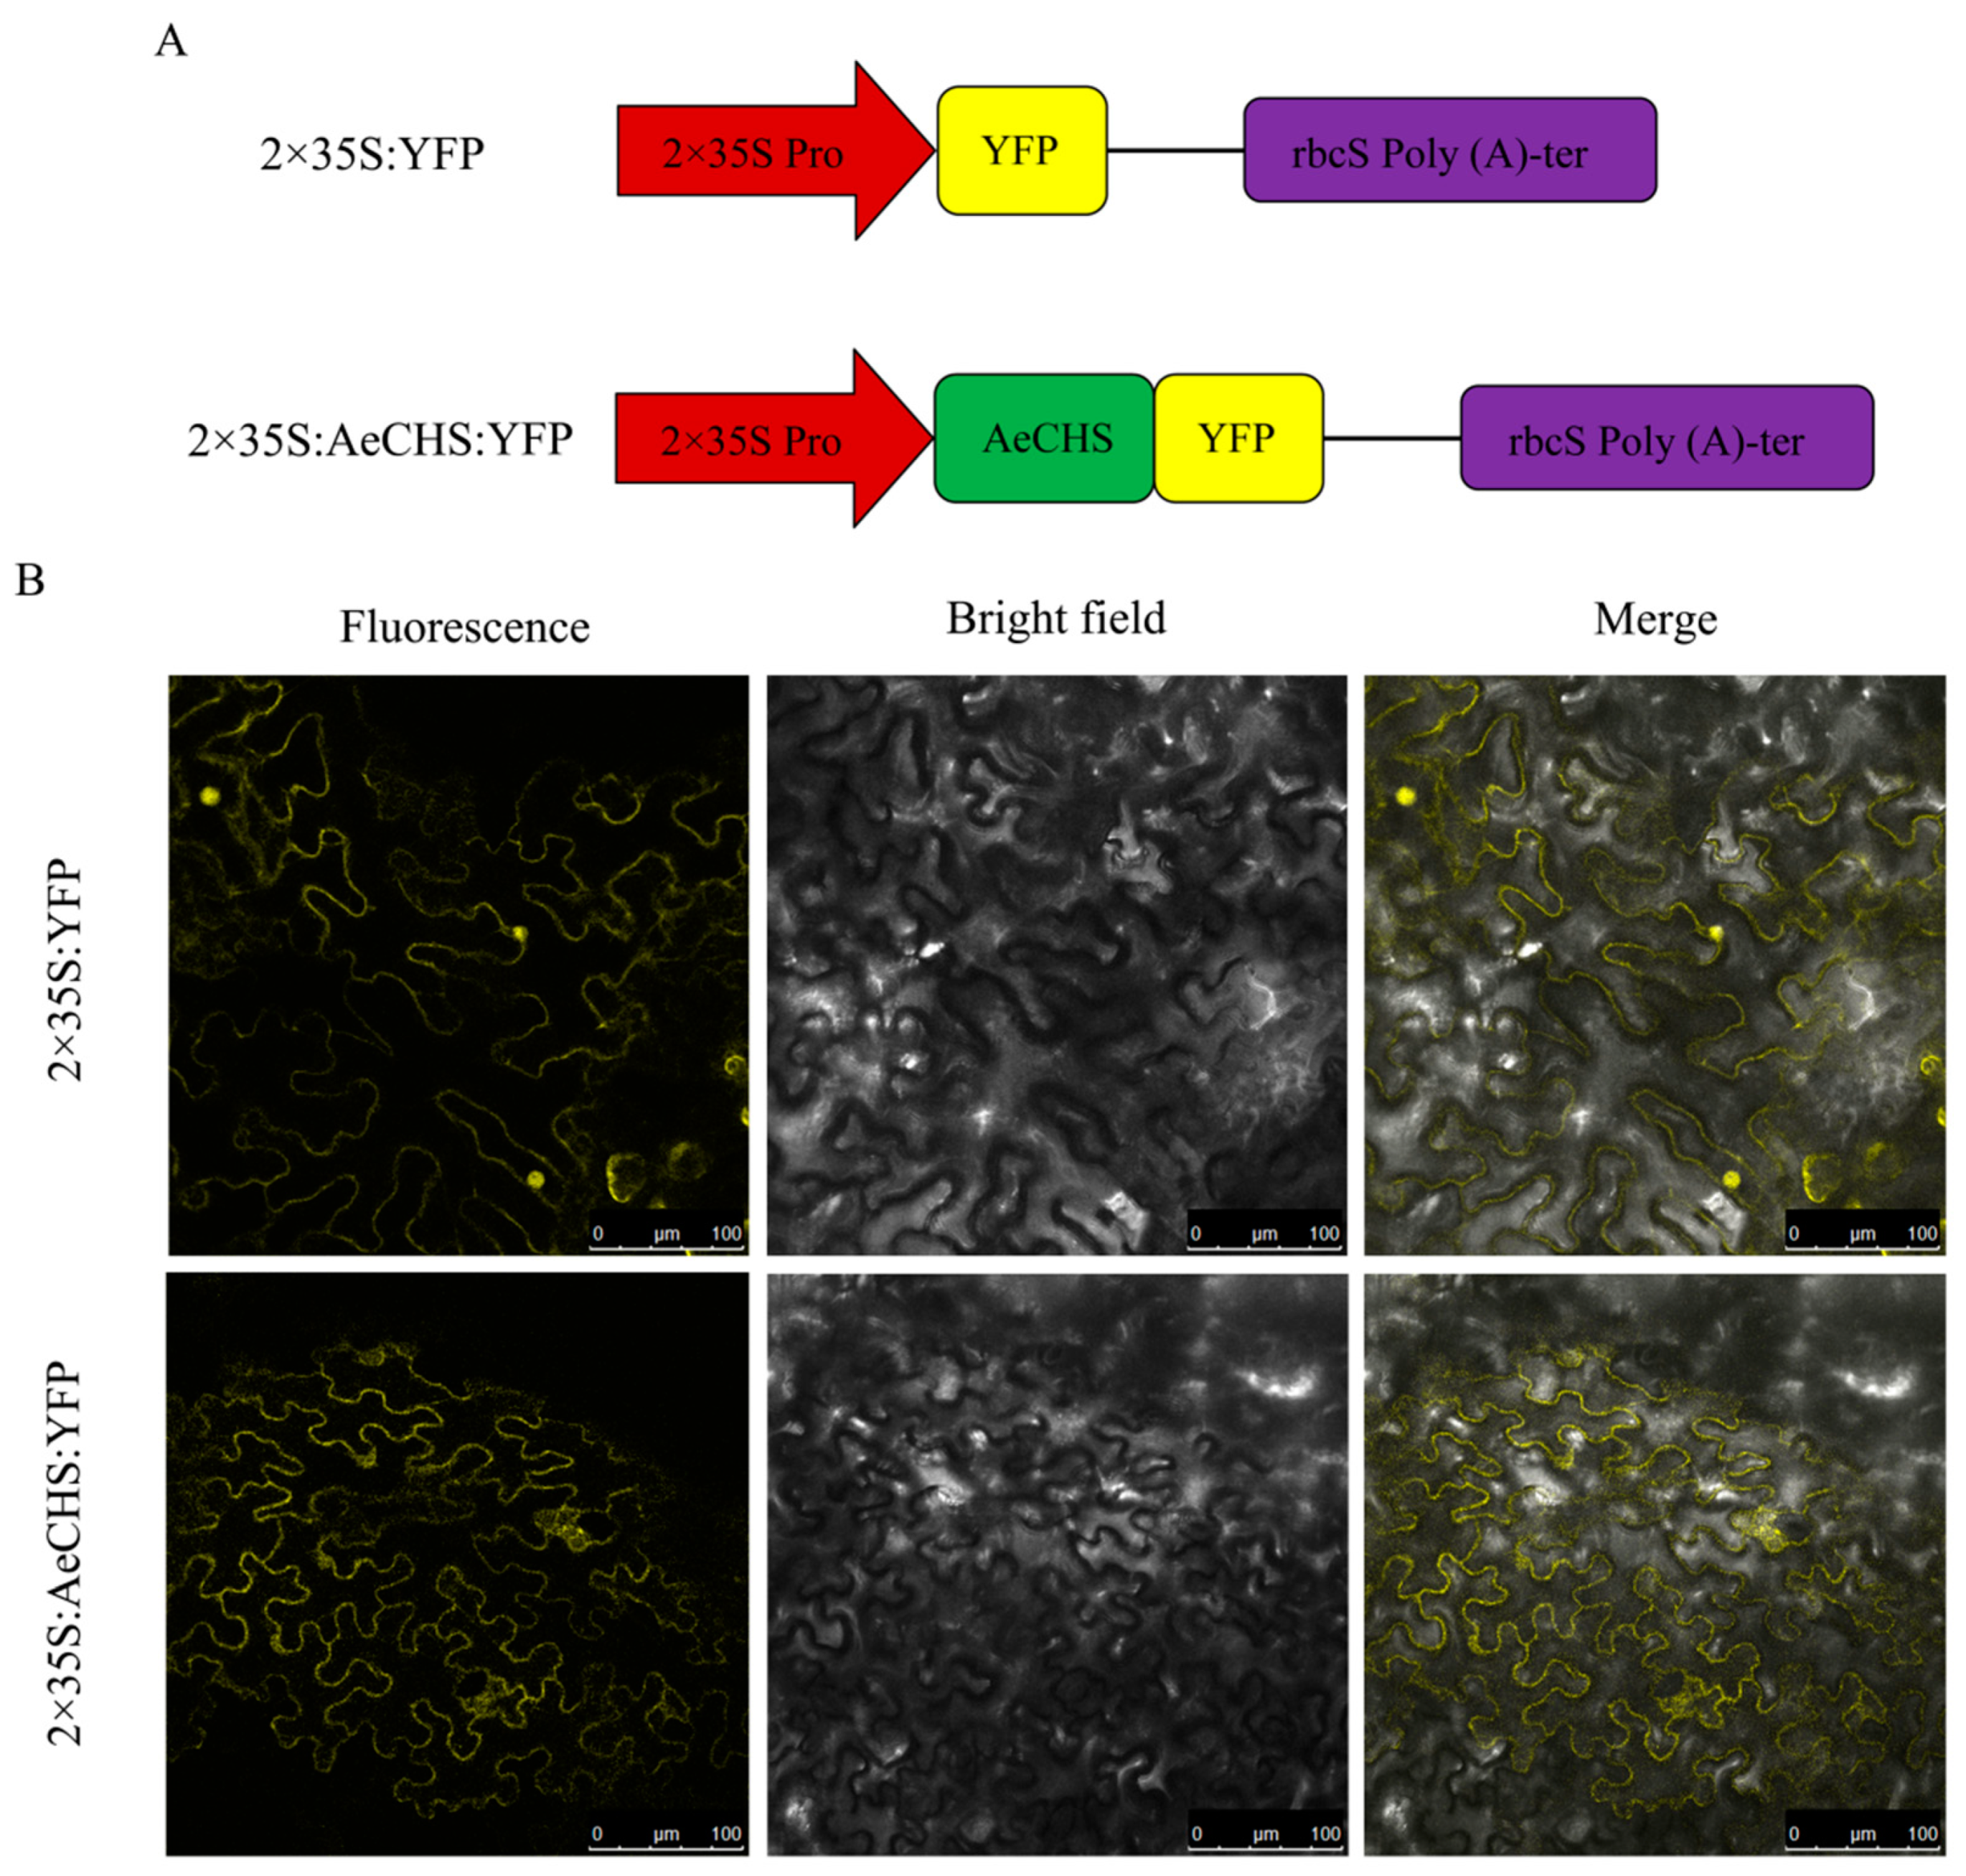
2.5. Subcellular Localization

The CDS of AeCHS without the stop codon was amplified from A. arguta by specific primers 5′-CCCAAGCTTGGGATGGTGACTGTCGAGGAAGTTC-3′ (forward primer) and 5′-TGCCTGCAGGCAAGTGCACAGGCTATGGAGC-3′ (reverse primer) containing Hind III and Pst I restriction enzymatic sites. The PCR product was recombined with the plant binary expression vector pHB to form CaMV 2×35S:AeCHS:YFP. The empty pHB vector only with the YFP gene (2×35S:YFP) was used as positive control. Two constructs were introduced into A. tumefaciens strain EHA105 using a freeze-thaw method. A. tumefaciens strains were kept at 28 ℃ in LB medium supplemented with kanamycin, resuspended in infiltration buffer containing 10 mM MgCl2, 10 mM MES and 200 µM acetosyringone to an OD600 of 0.6–1.0, and left to stand for 2 h at room temperature before infiltration. Subsequently, the A. tumefaciens solution was infiltrated into 5–6-week-old N. benthamiana leaves with a 1-ml needleless syringe. Infiltrated plants were placed under dark conditions at room temperature for the first 24 h and then under 16 h light and 8 h dark for another 24 h; YFP fluorescence was observed with a Leica TCS SP5 confocal laser scanning microscope (Leica Microsystems, Wetzlar, Germany).

2.6. Construction of Silencing Vector for Virus-induced Gene Silencing (VIGS)

Two types of TRV vector, pTRV1 and pTRV2, were selected for the VIGS experiment [47]. A 252 bp specific fragment of AeCHS coding sequence was amplified from Actinidia eriantha ‘Zaoxu’ cDNA by PCR using specific primer 5′-CCGGAATTCCGG CCTGCTATTTTGGACCAAGTGG-3′ (forward primer) and 5′-CGGGGTACCCCG CTAAGTGCACAGGCTATGGAGC-3′ (reverse primer) containing EcoR Ι and Kpn Ι restriction enzymatic sites (Figure S1). This fragment was cloned into the EcoR Ι and Kpn Ι sites of the pTRV2 vector to generate the pTRV2:AeCHS vector. The empty pTRV1 and pTRV2 vectors were used as controls. Three constructs were introduced into A. tumefaciens strain GV3101 using a freeze-thaw method, and then stored at −80 ℃ for further use.

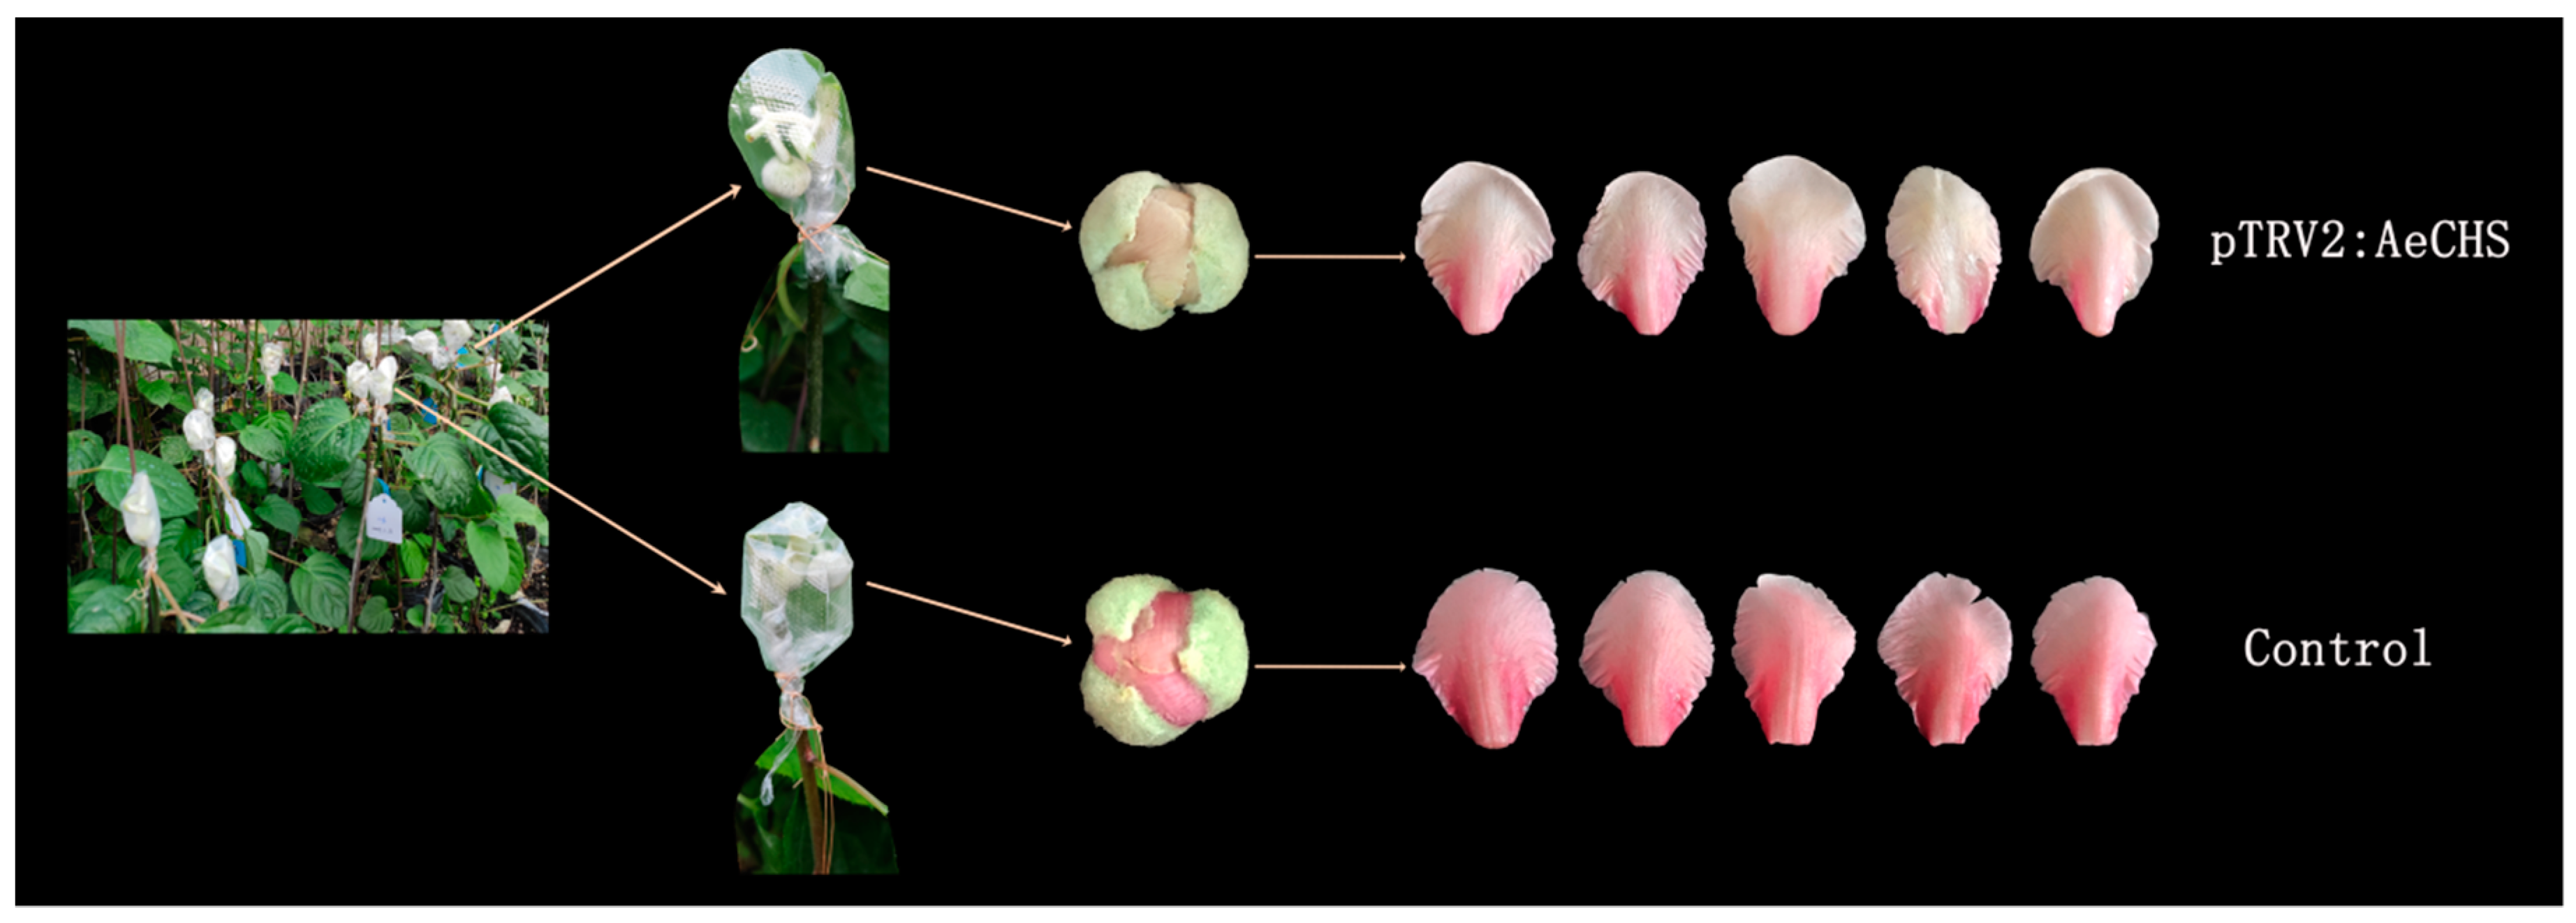
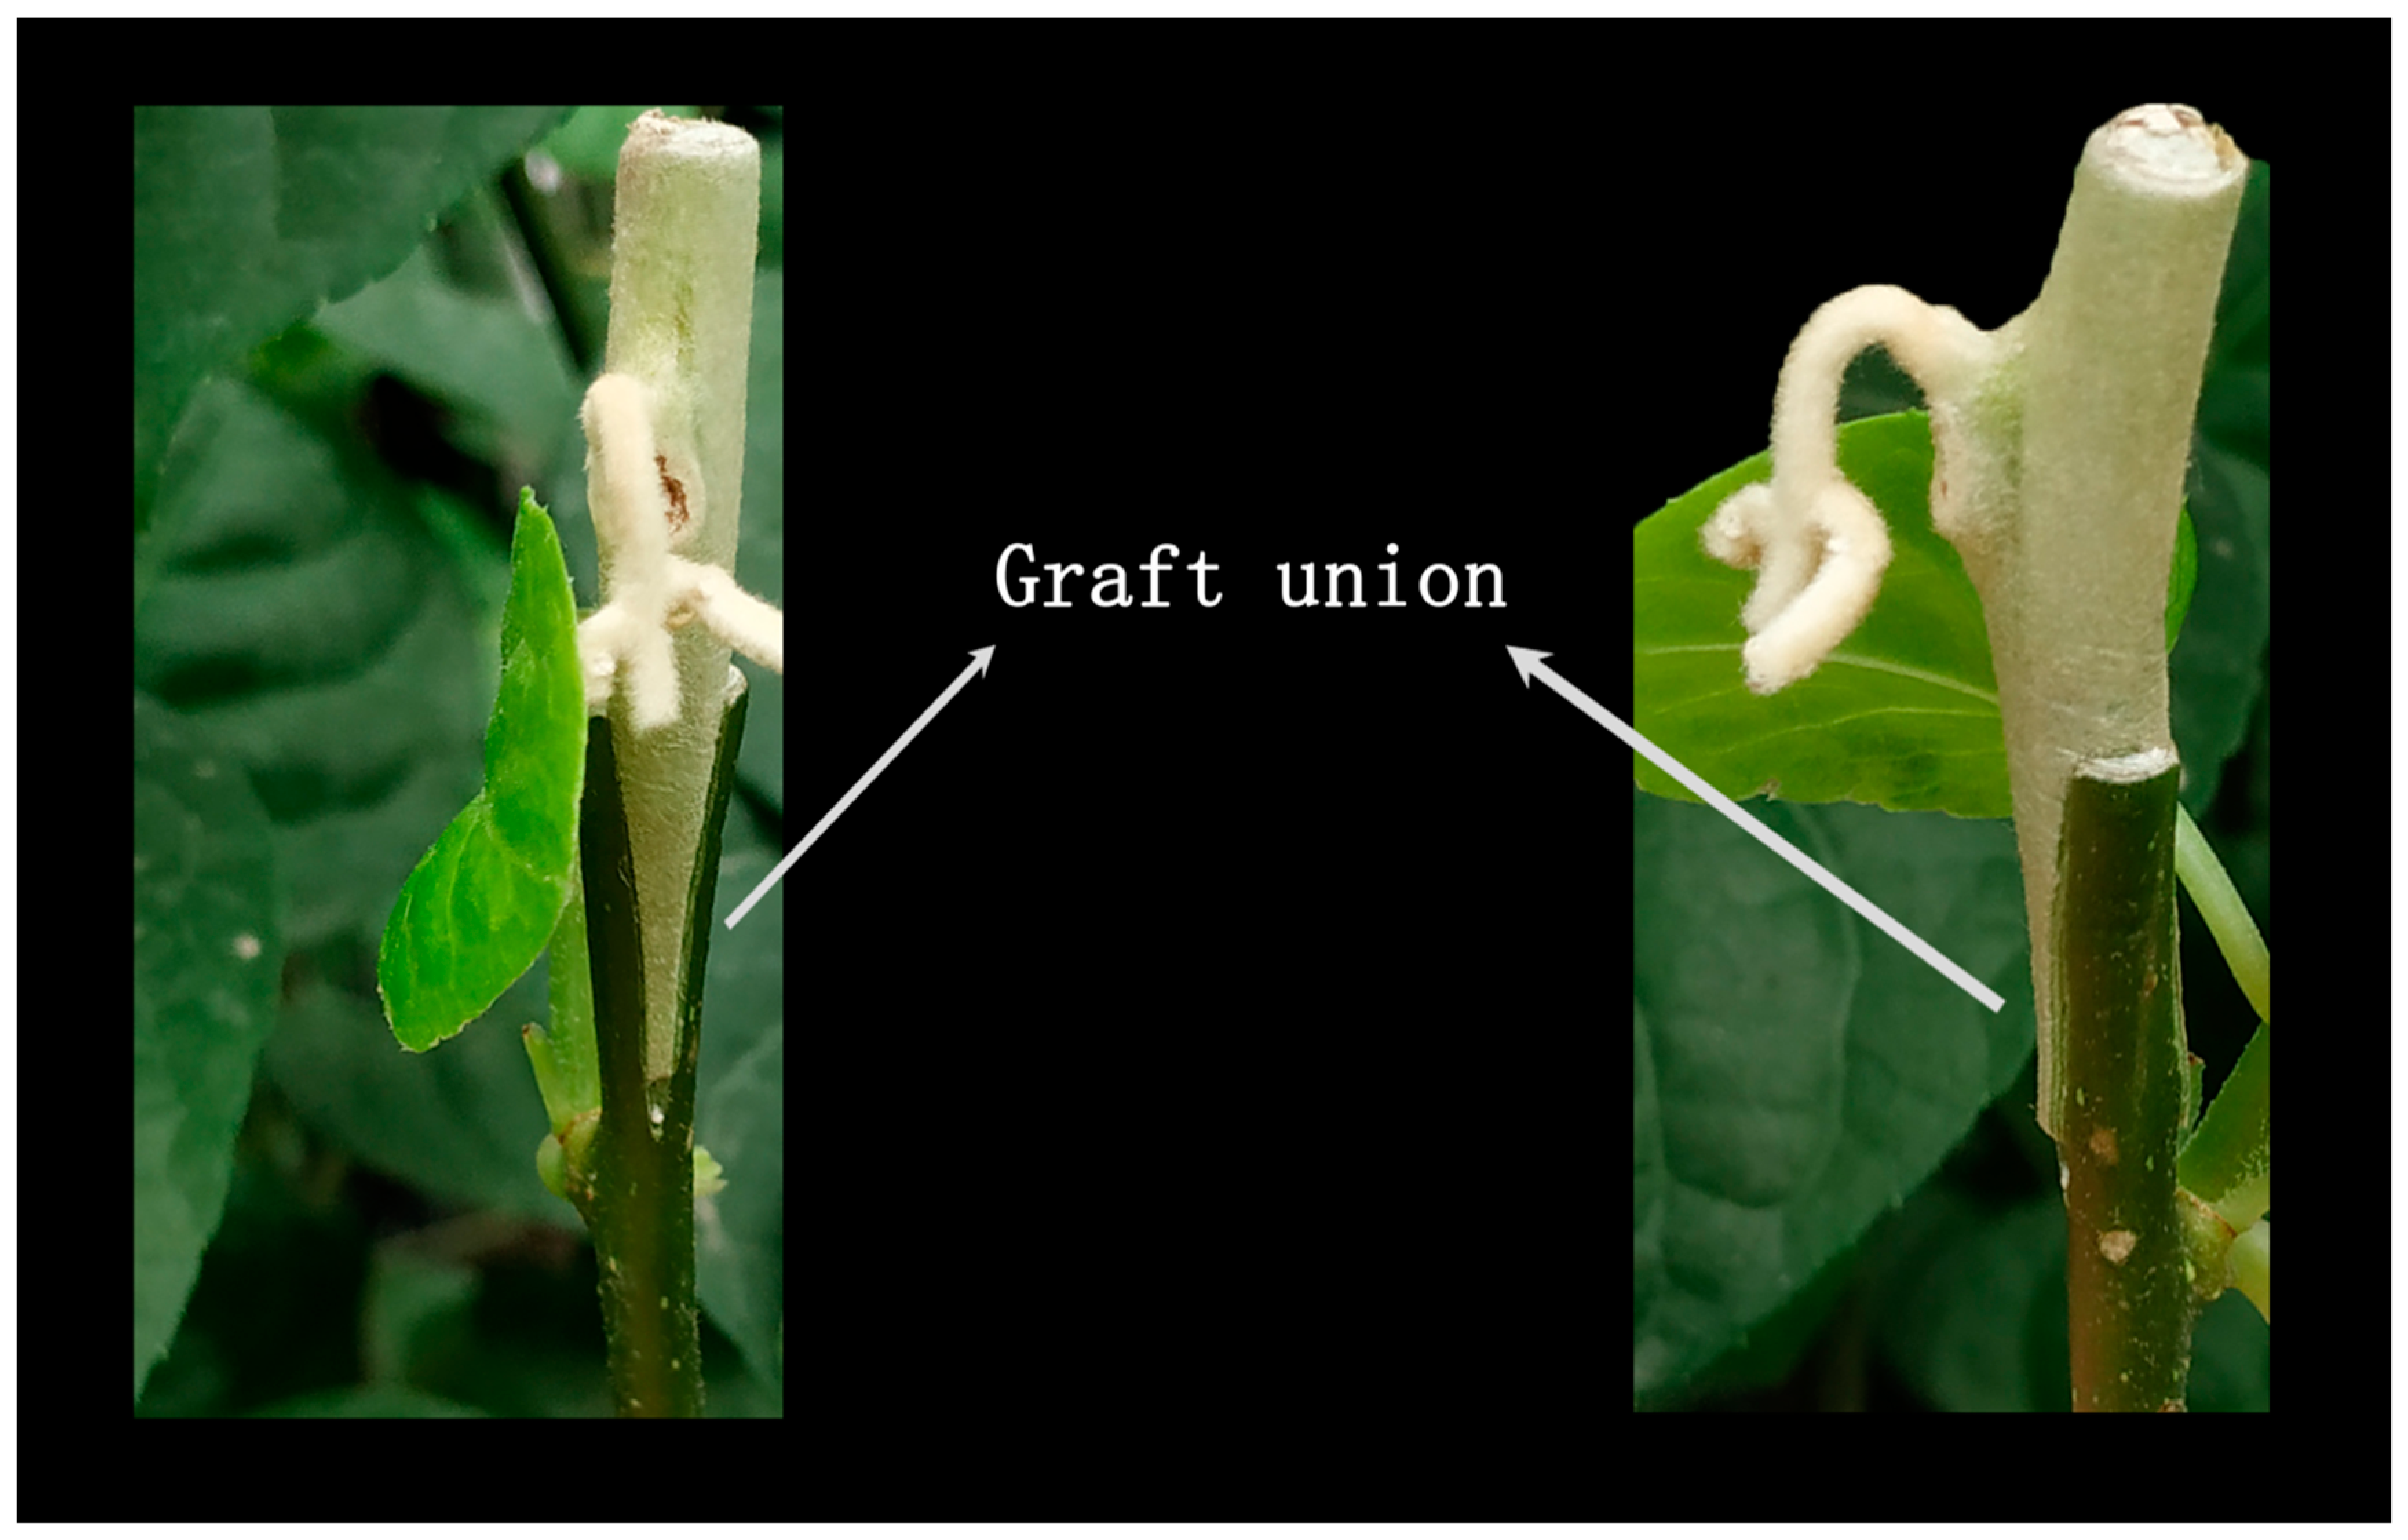
2.7. Infiltration Grafting-mediated VIGS Experiment

For the virus-induced gene silencing (VIGS) experiment in A. eriantha petal, a modified infiltration grafting method was performed based on a previous study [43]. Briefly, A. tumefaciens strain GV3101 containing three TRV vectors including pTRV1, pTRV2 and pTRV2:AeCHS were grown at 28 ℃ for 16–24 h in LB medium (10 mM MES, 100 µM AS) supplemented with kanamycin and rifampicin. Activated A. tumefaciens cells were collected by centrifugation for 5 min at 1000 g, and resuspended in infiltration buffer (10 mM MgCl2, 10 mM MES, 400 µM AS). Scions with a newly cut wound were submerged in 1:1 infiltration mixture consisting of pTRV1 and pTRV2:AeCHS (OD600, 0.8), and subjected to vacuum (DZF-60, RongFeng, Shanghai, China) at −25 kPa for 5 min. The 1:1 mixture of pTRV1 and pTRV2 was used as control. Treated scions were grafted onto Actinidia valvata twigs to use as rootstocks.

2.8. Graph Making and Statistical Analysis

GraphPad Prism5 (GraphPad Software Inc., San Diego, CA, USA) was used for chart preparation. R-3.4.2 was used to obtain the heat map and to conduct cluster analyses. DNAman software (Lynnon Biosoft, USA) was used for sequence alignment. Data are means and standard deviations and were analyzed using Student’s t-tests. Differences among different groups were considered statistically significant at P ≤ 0.05. IBM SPSS Statistics 20 (IBM, New York, USA) was used to test significant differences.

3. Results

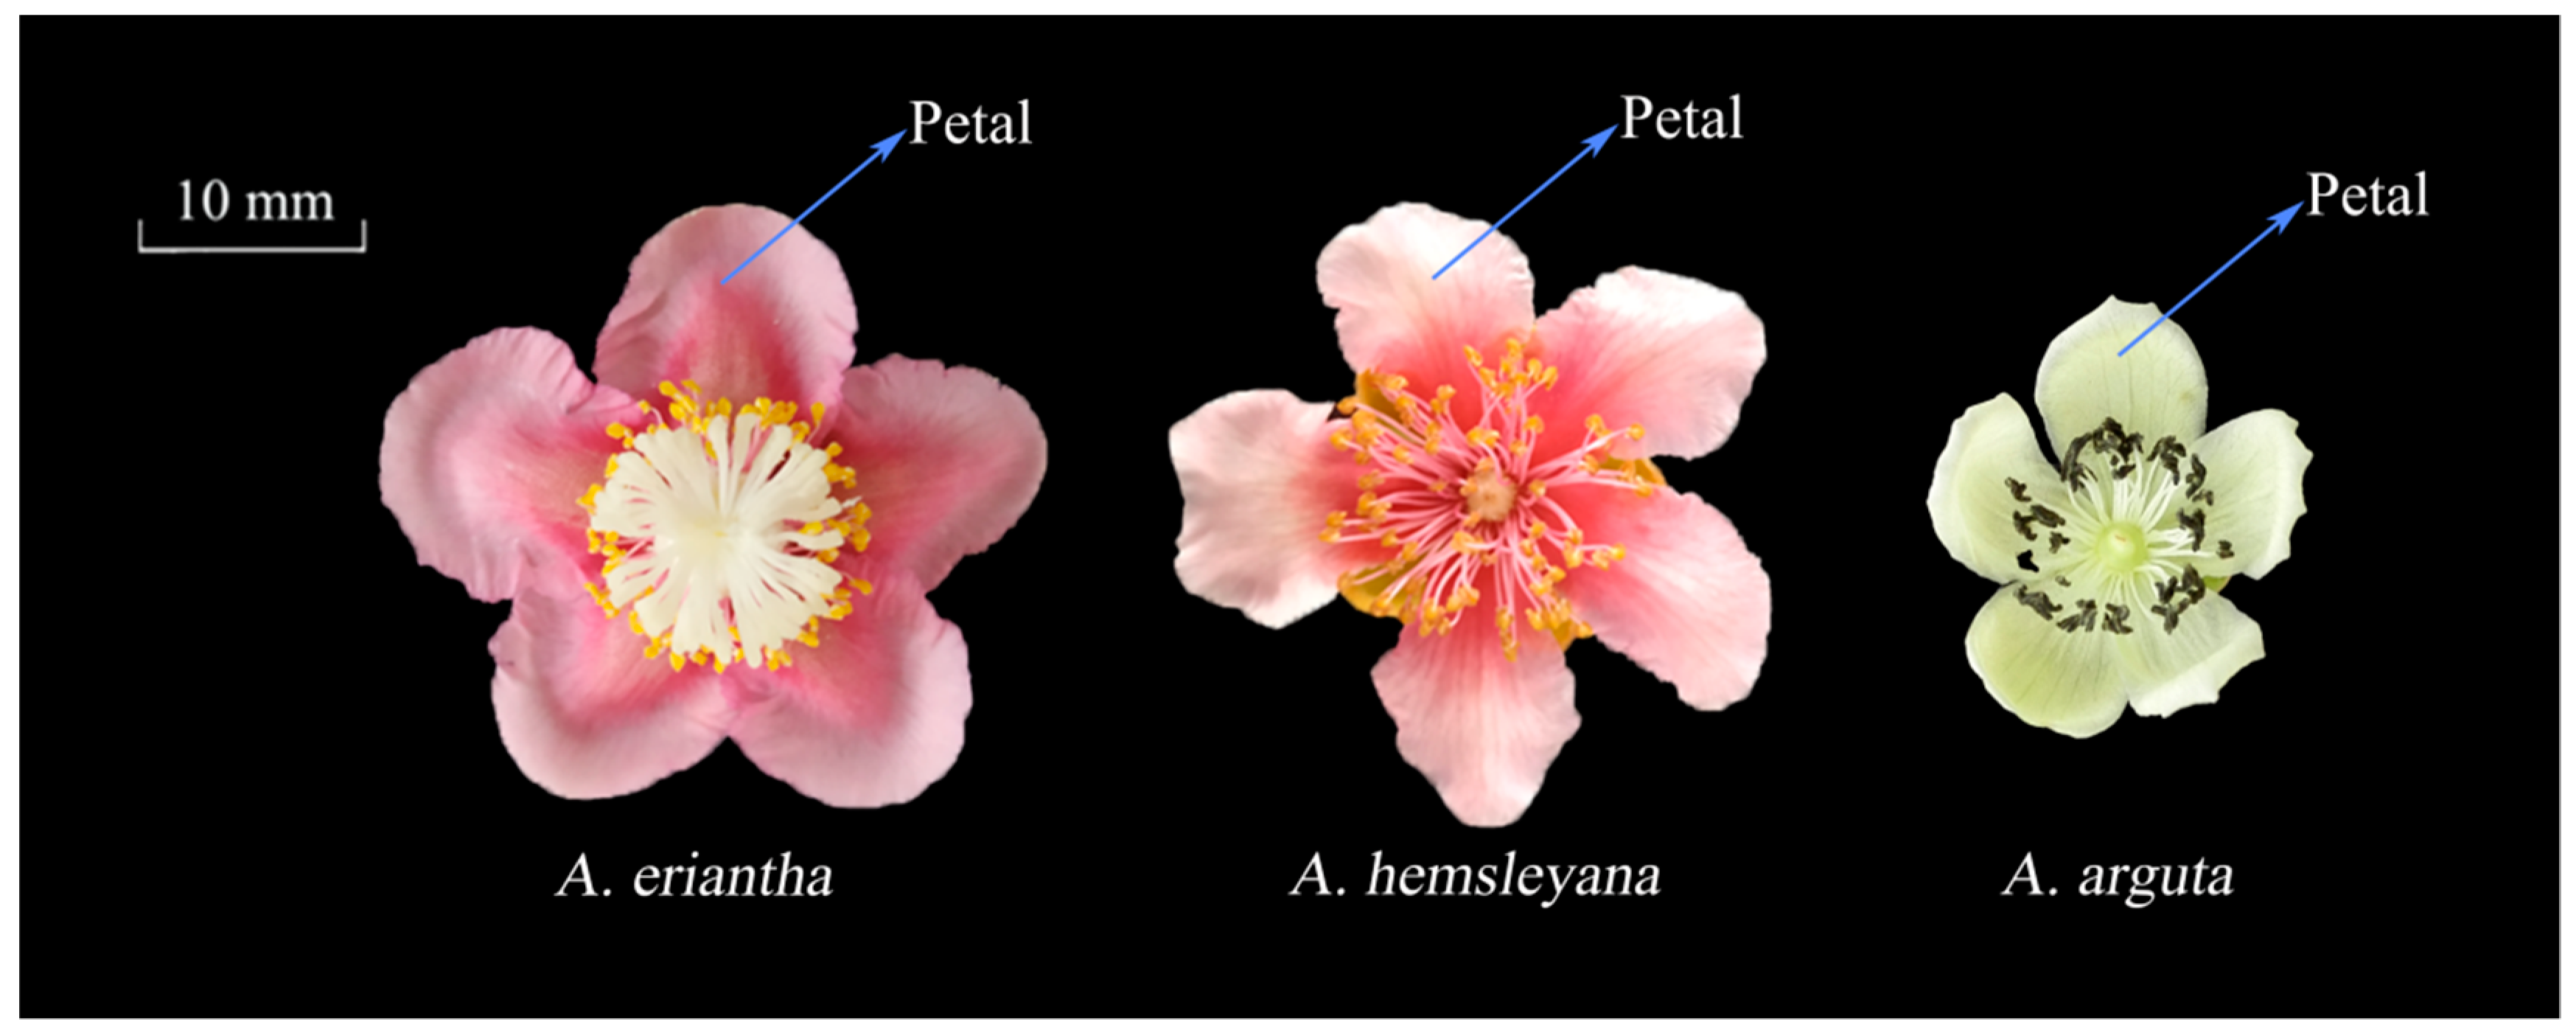
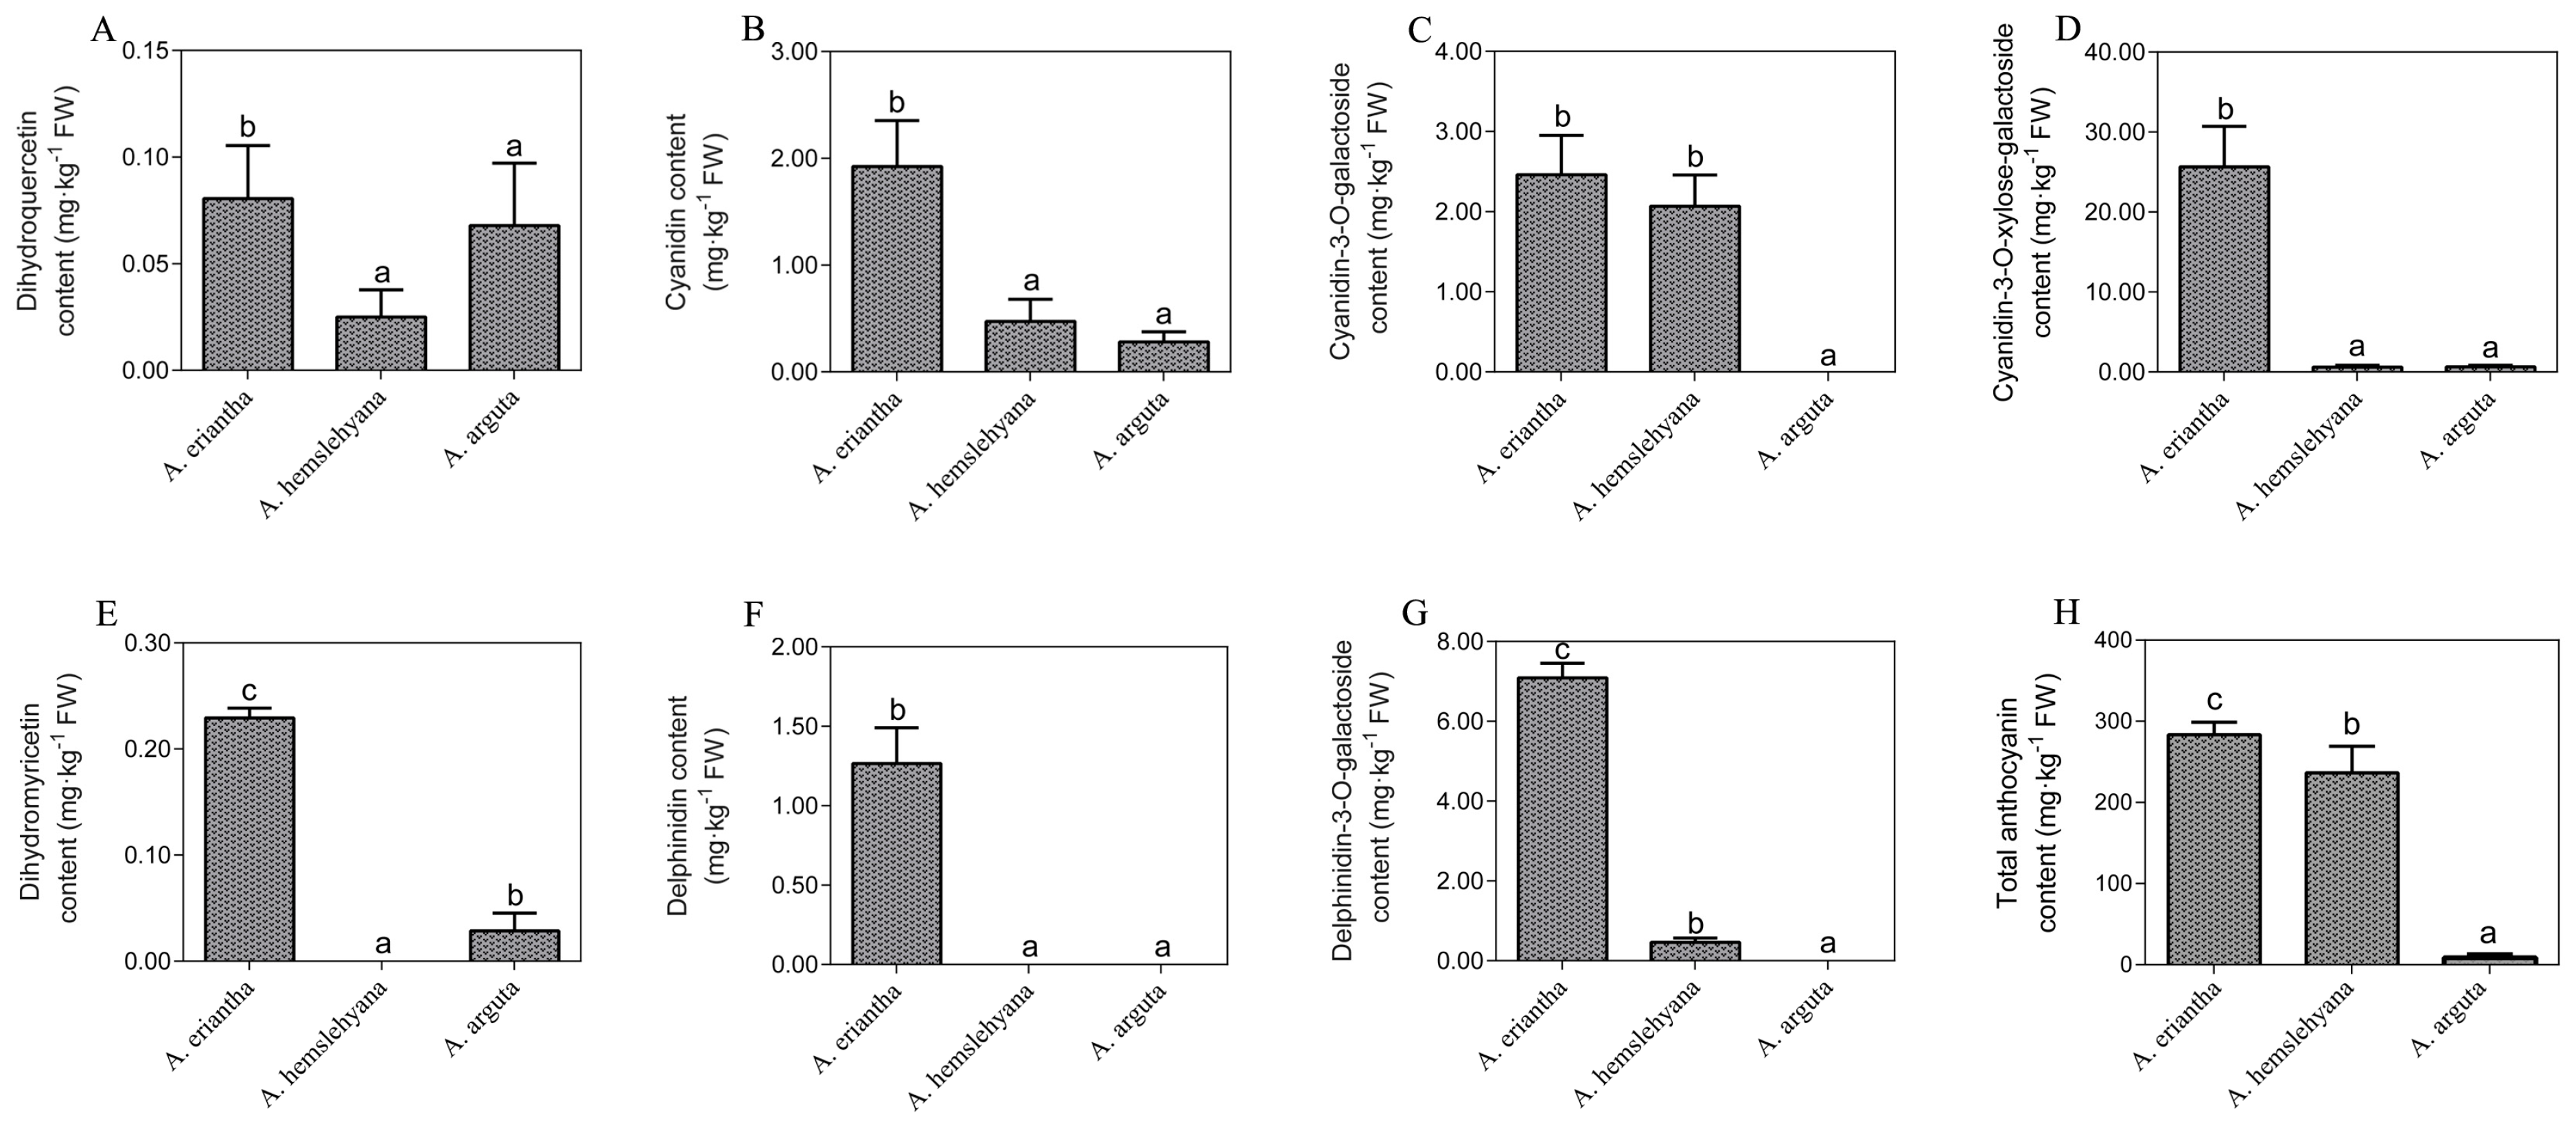
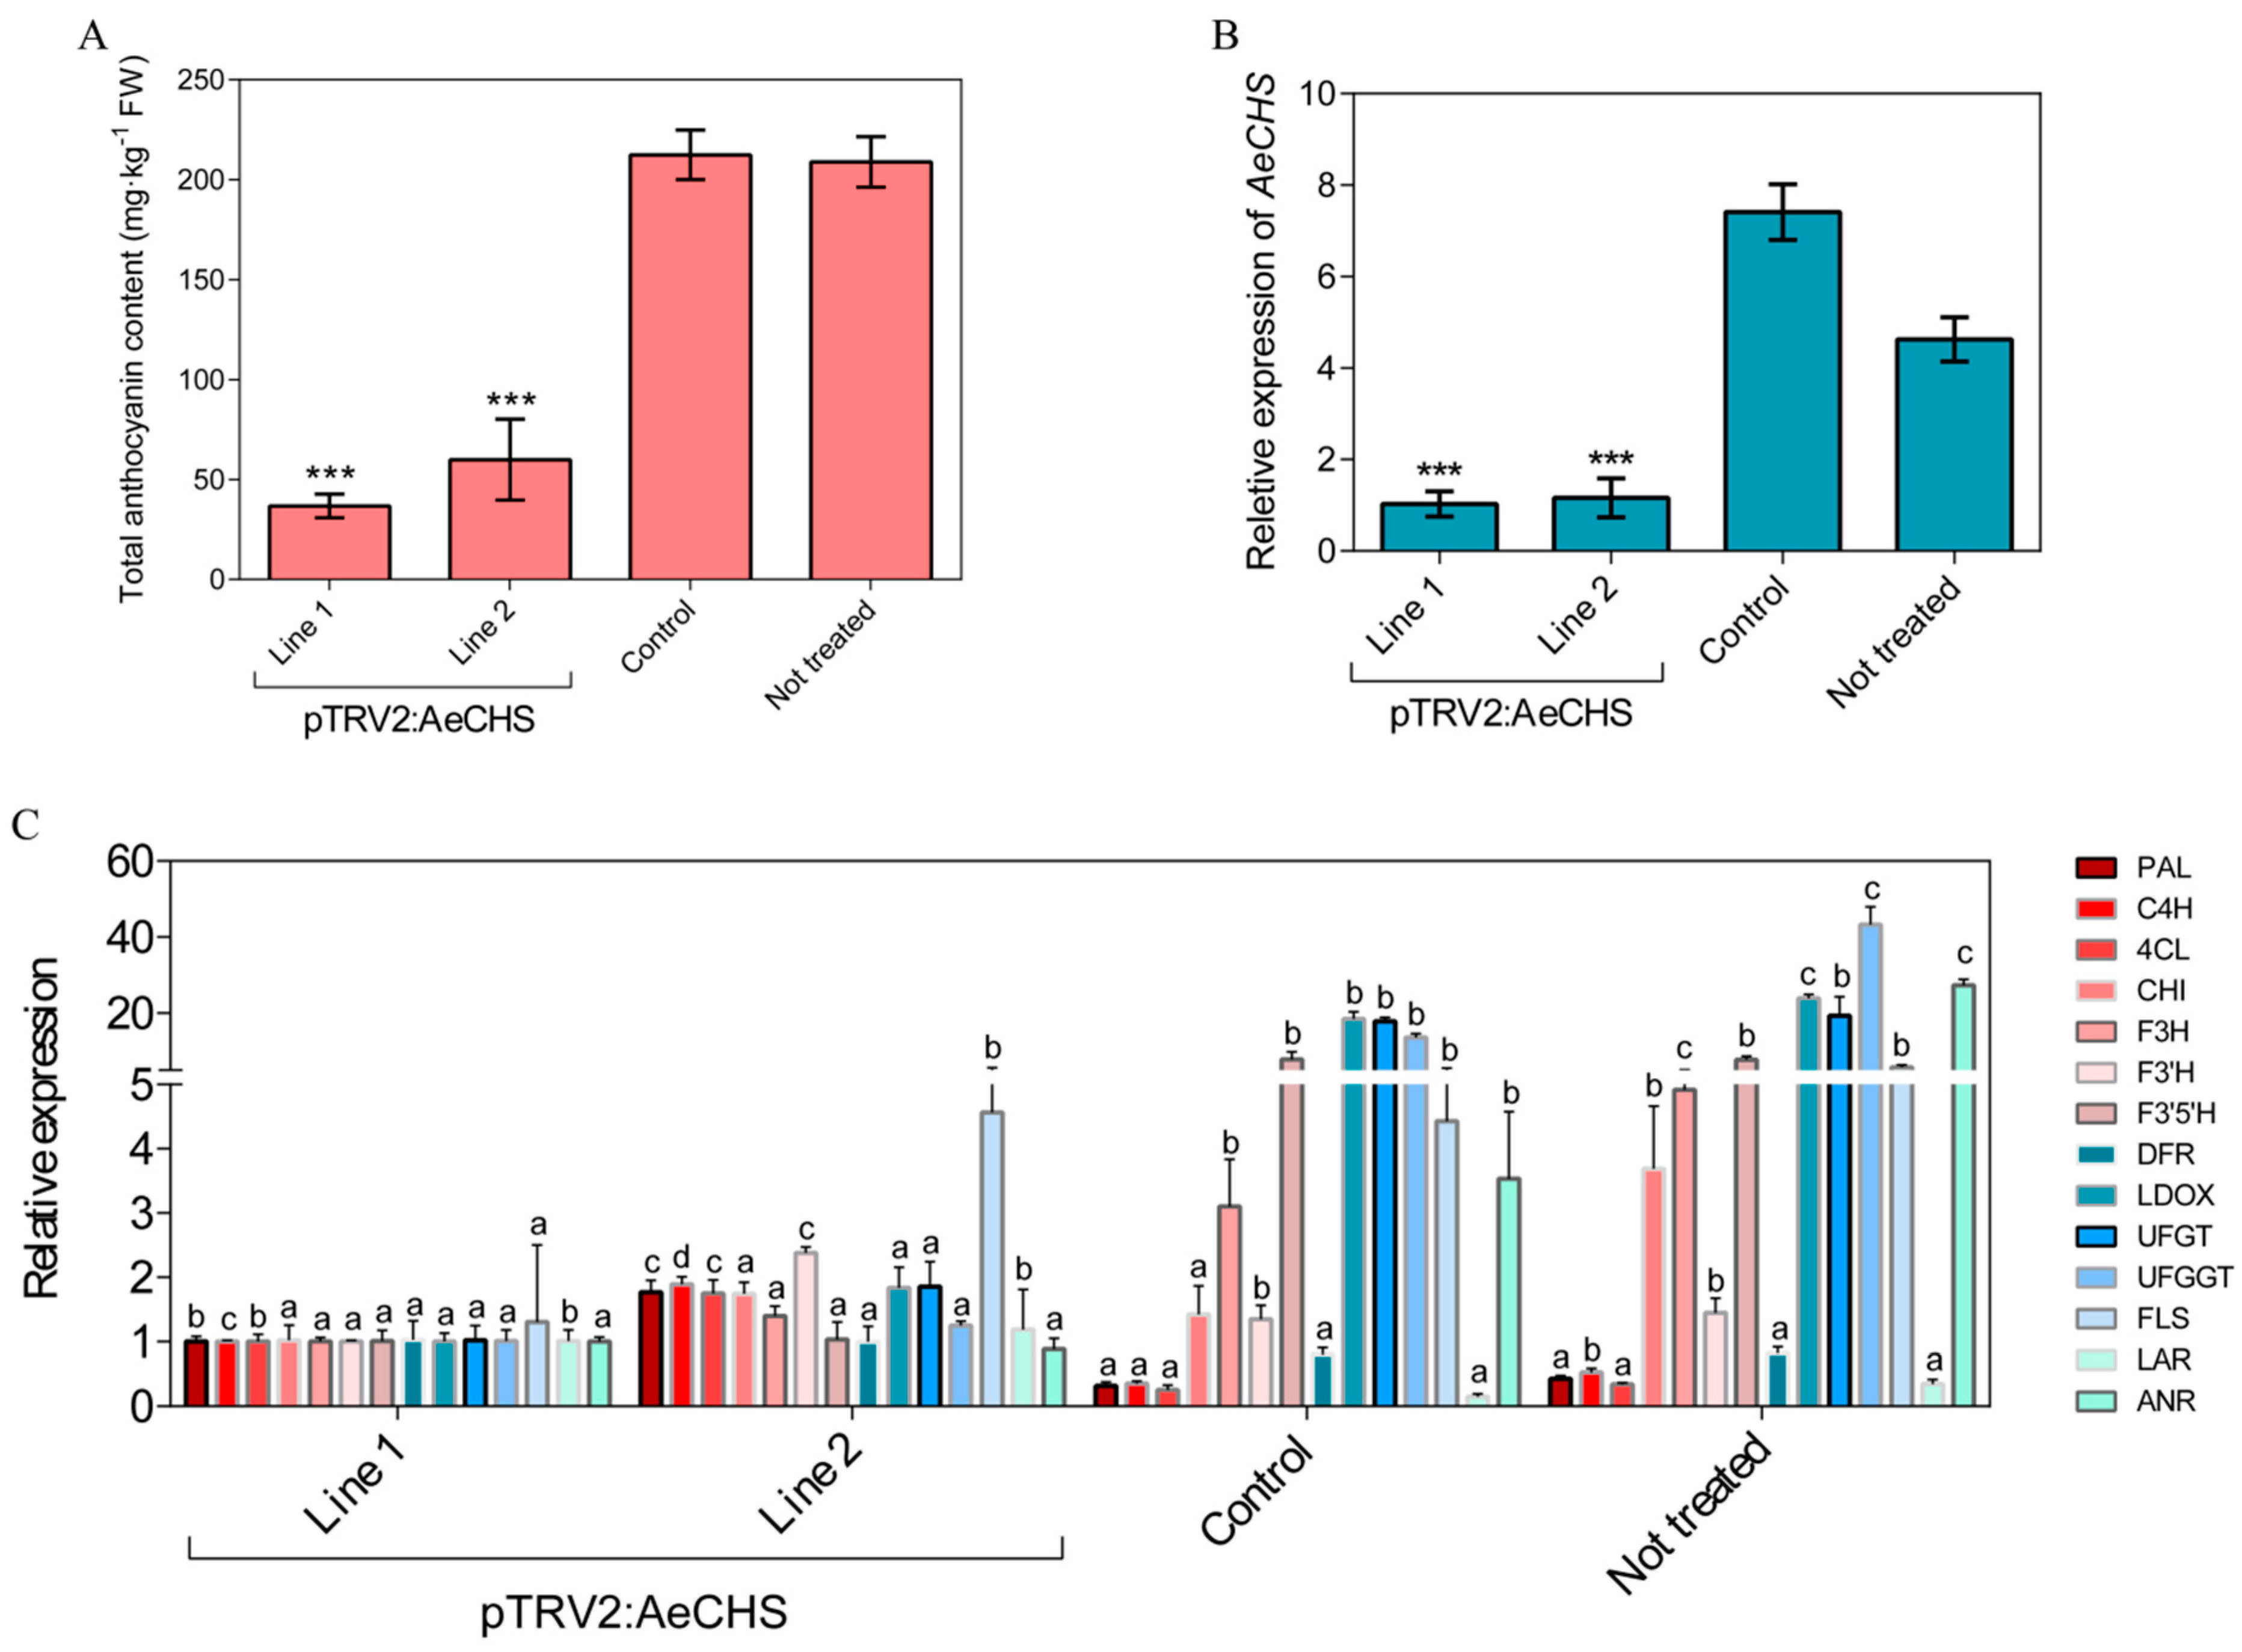
3.1. Phenotype Observation and Anthocyanin Content Analysis

Phenotype observation and comparison among the three kinds of Actinidia petals revealed that A. eriantha petal color were of a more intense and darker red color than the other two Actinidia species A. hemsleyana and A. arguta (Figure 2). Analysis of anthocyanins and their precursors by UPLC-MS/MS revealed significant differences in the content of seven anthocyanin components among the three types of petals under study. Seven components were detected in A. eriantha petals whose content were significantly higher than those recorded for A. hemsleyana and A. arguta. In A. eriantha petals, cyanidin-3-O-xylose-galactoside content was the highest, reaching 25.65 mg kg−1 FW (Figure 3D), followed by delphinidin-3-O-galactoside (Figure 3G) and cyanidin-3-O-galactoside (Figure 3C). In A. hemsleyana and A. arguta petals, only four to five components were detected, and at very low levels (Figure 3A-G). This result correlated well with the visible phenotype, indicating anthocyanins, especially cyanidin-3-O-xylose-galactoside, seems to be associated with the formation of red color in petals. The total anthocyanin content in A. eriantha was significantly higher than that in A. hemsleyana and A. arguta (Figure 3H), which was consistent to petal phenotype.

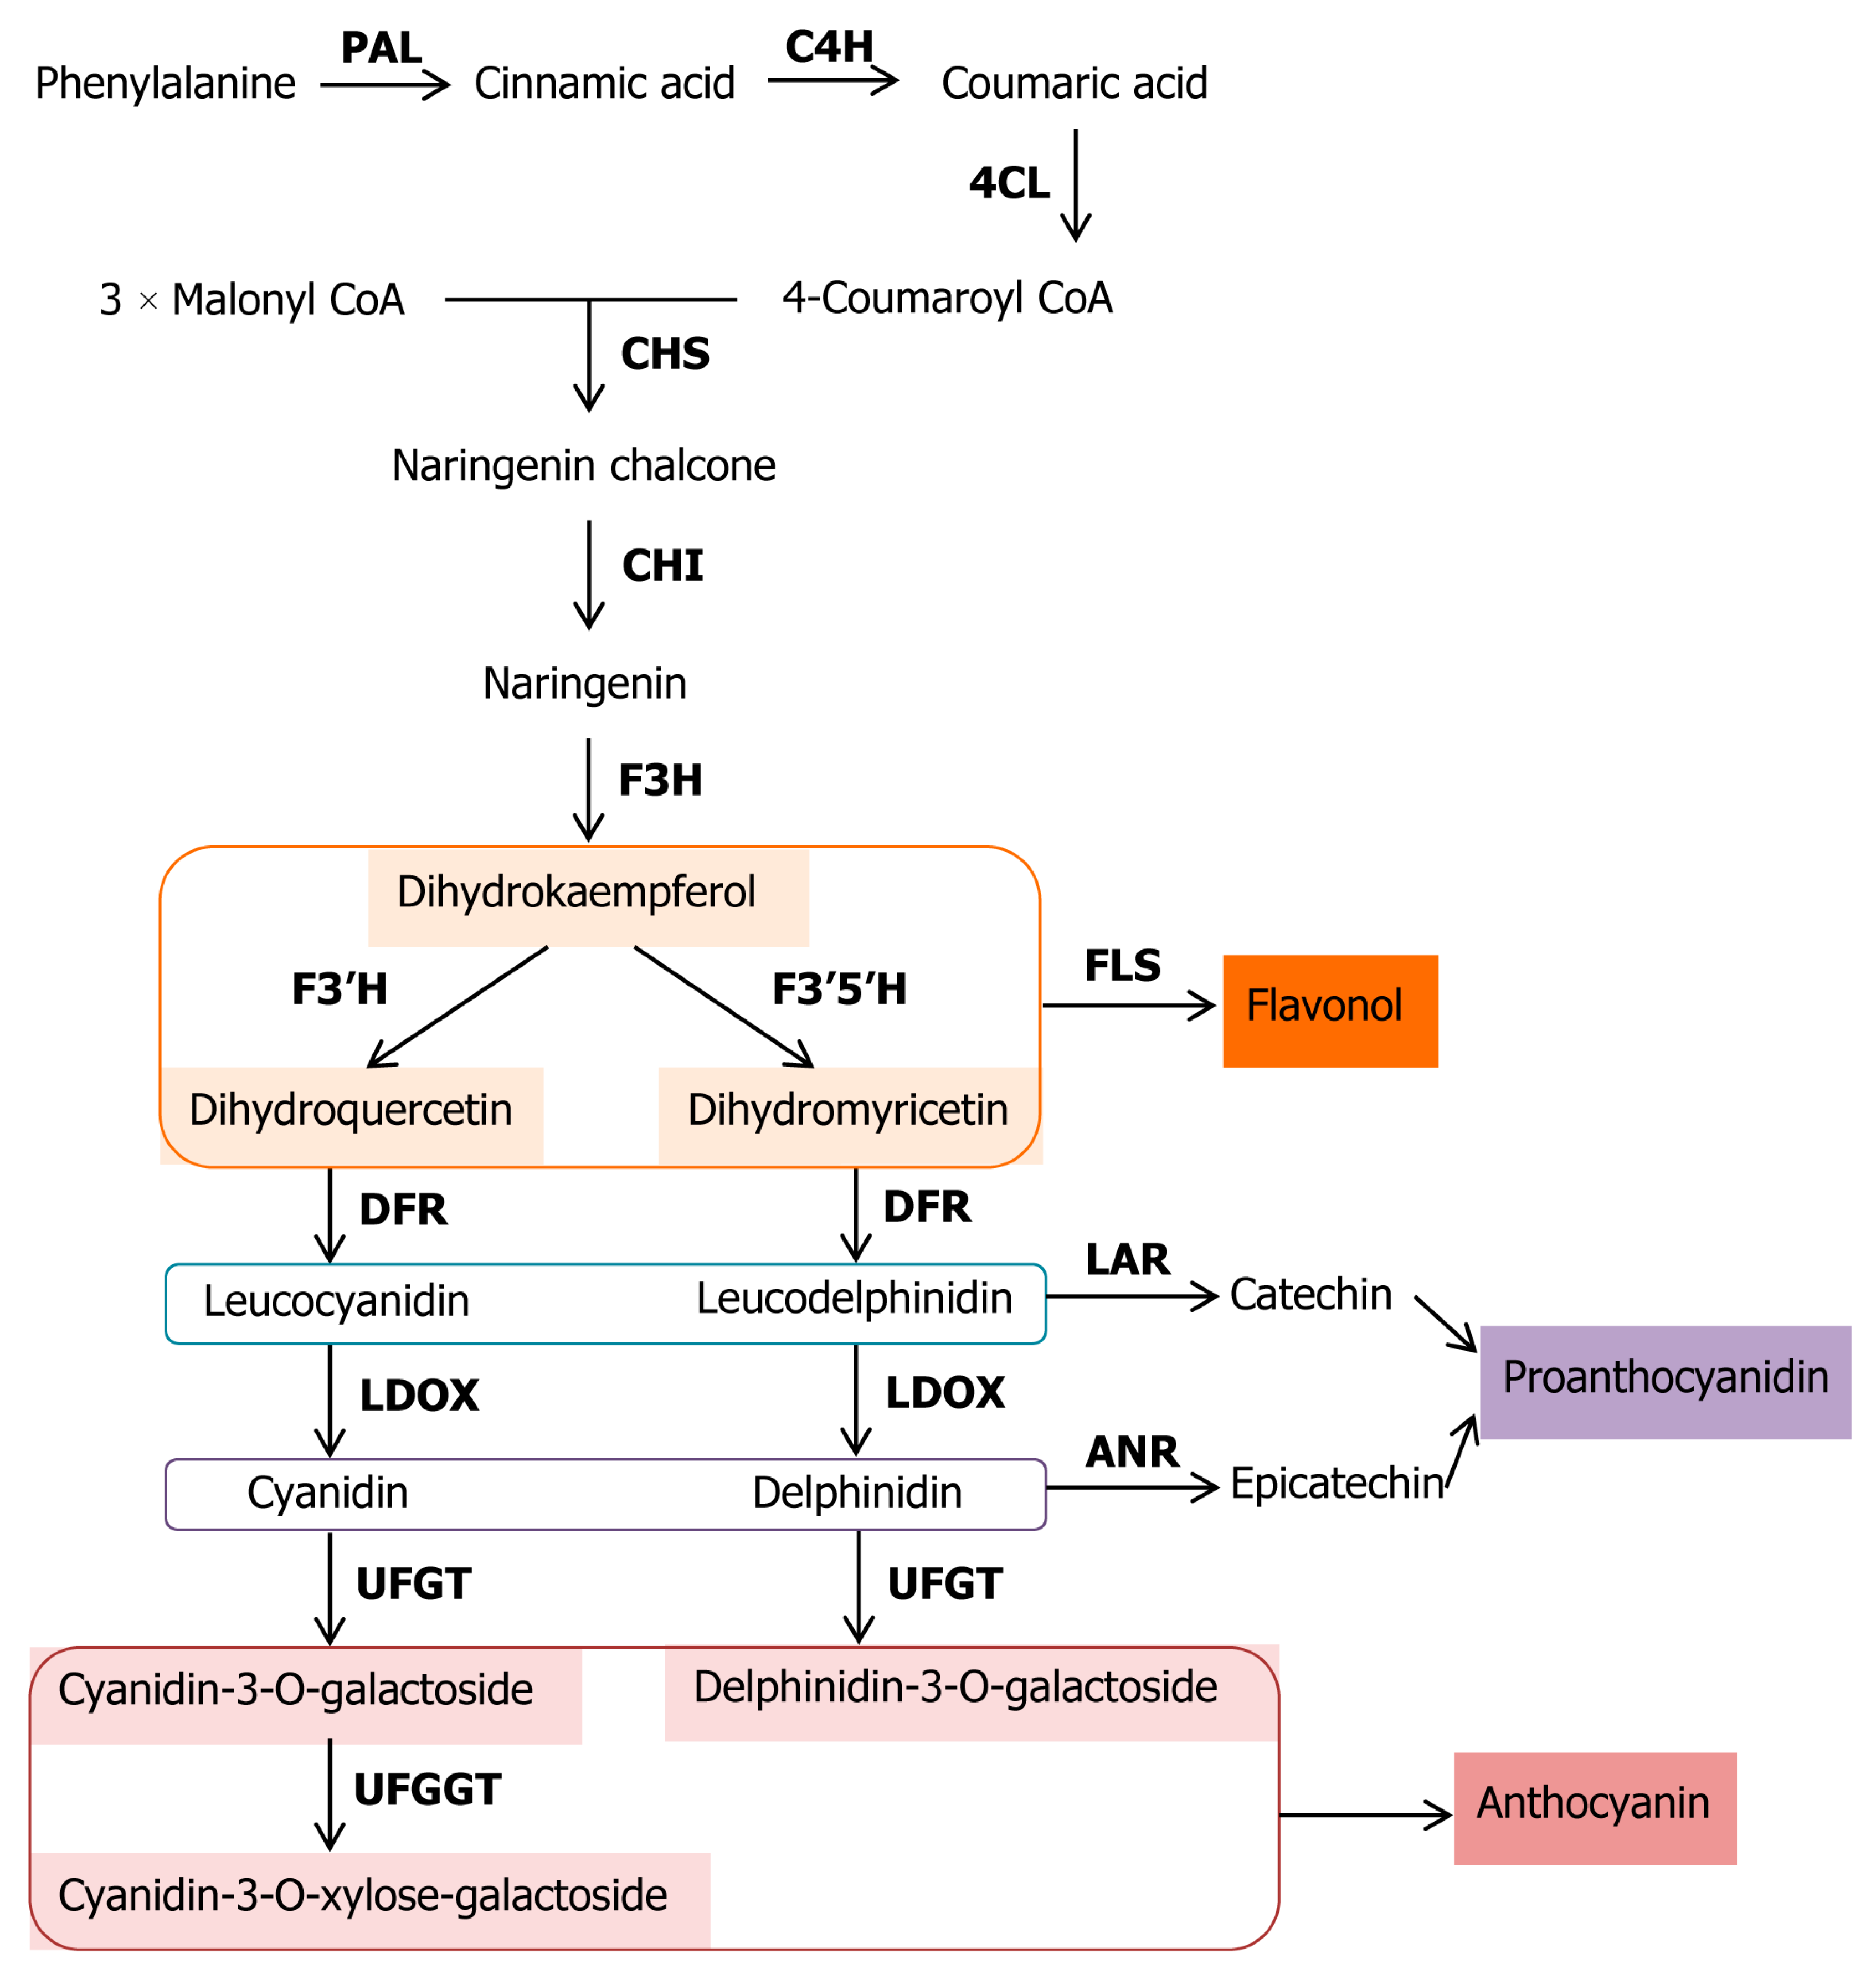
3.2. Expression and Cluster Analysis of Genes Involved in Anthocyanin Biosynthesis

To investigate the cause of the difference in red, light pink, and white petals, petal samples of the three Actinidia species were used to analyze the gene expression level by qRT-PCR. The expression profile of anthocyanin biosynthetic genes, including PAL, C4H, 4CL, CHS, CHI, F3H, F3′H, F3′5′H, DFR, LDOX, UFGT, UFGGT, FLS, LAR, and ANR, were investigated (Figure 4A). Except for two genes, namely, 4CL and CHS, whose expression was very high in A. eriantha, most of the other genes showed no obvious expression rules. Only one gene, CHS, was expressed to significantly high levels in A. eriantha, thus reaching significant differences with respect to the other genes analyzed. In order to find out the expression patterns of genes involved in anthocyanin biosynthesis, cluster analysis was performed by the R-3.4.2 language package. Cluster analysis showed that CHS was clustered into a single class and was distinctly separated from the rest of the genes (Figure 4B), possibly indicating that the expression pattern of CHS was different from others. In addition, correlation analysis revealed that AeCHS expression was significantly correlated to anthocyanin content (Table 2), which clearly indicates CHS might be the key gene controlling anthocyanin biosynthesis in A. eriantha petals.

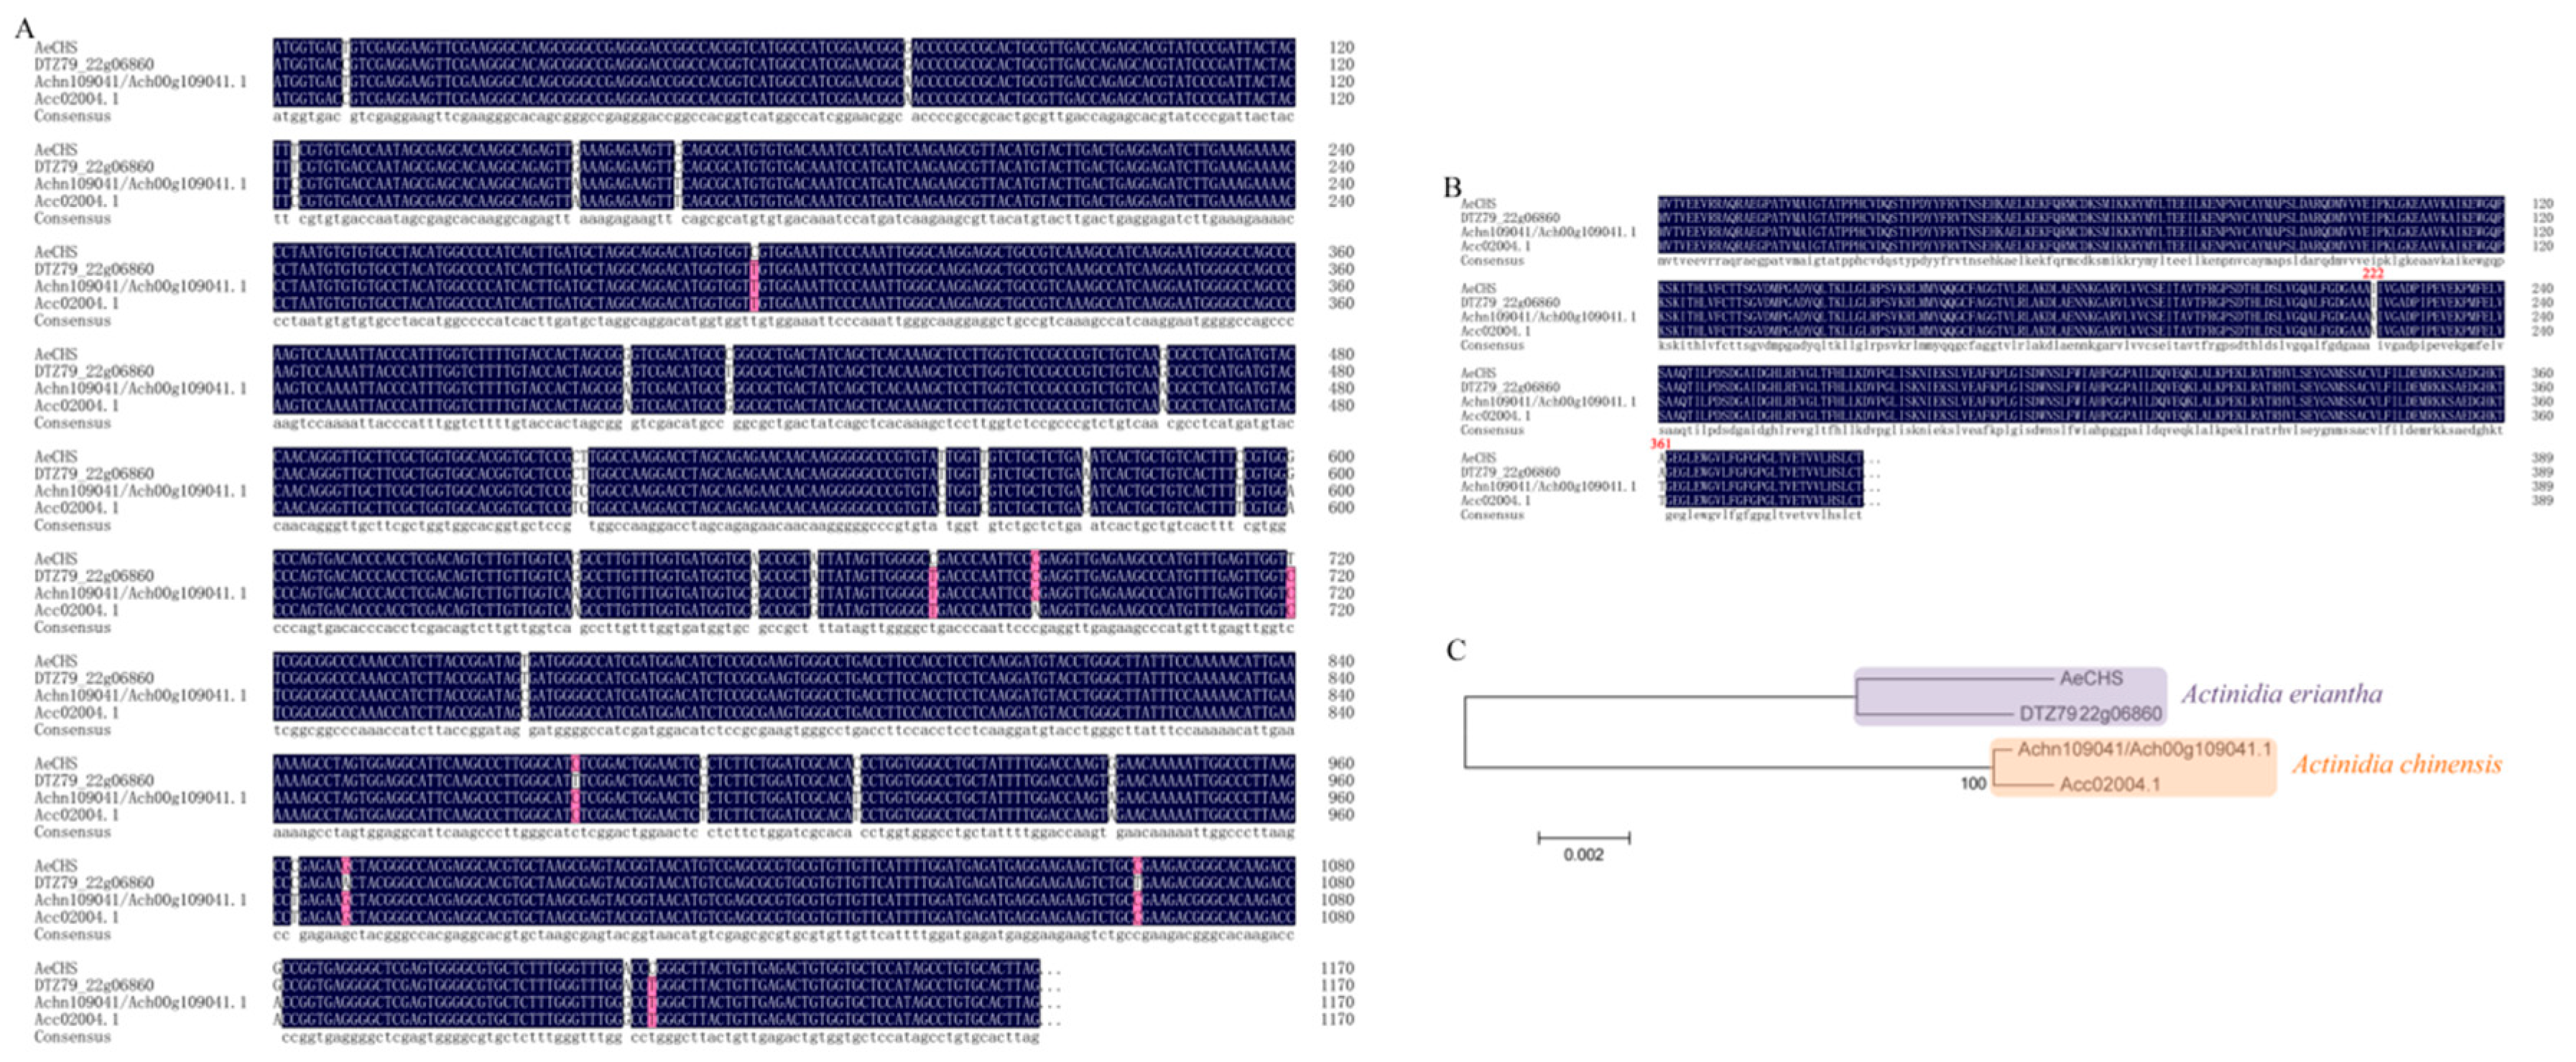
3.3. Sequence Analysis and Alignment of AeCHS

As mentioned above, CHS might be the key gene controlling anthocyanin biosynthesis in A. eriantha petals. Therefore, the full-length cDNA of AeCHS was cloned from A. eriantha ‘Zaoxu’ petals. The length of AeCHS is 1170 bp encoding a protein of 389 amino acids. A comparison of the cDNA sequences showed CHS had nucleotide divergence in Actinidia species or cultivars, including A. eriantha ‘Zaoxu,’ A. eriantha ‘White,’ A. chinensis ‘Hongyang’ and A. chinensis ‘Red 5′ (Figure 5A). Protein alignment suggested that there were two amino acid differences between A. eriantha and A. chinensis (Figure 5B), and phylogenesis showed that A. eriantha and A. chinensis were clustered into one class, (Figure 5C), which indicated CHS is different in different Actinidia species.

3.4. Subcellular Localization Analysis of AeCHS

To determine the subcellular localization of the AeCHS protein, AeCHS was first predicted by online tool PSORT (https://www.genscript.com/tools/wolf-psort). After putting AeCHS protein sequence into retrieval system, corresponding prediction results that called neighbors were presented in online page. Prediction results showed that 12 neighbors were located in cytoplasm among 14 nearest neighbors, which indicated that the AeCHS protein was located in the cytoplasm. To verify this result, a subcellular localization experiment was performed by transient injection assays in N. benthamiana leaves. Vectors inserted with AeCHS:YFP and only YFP were constructed (Figure 6A). The positive control 2×35S:YFP was diffuse in the cytoplasm and concentrated in the nucleus. In contrast, the 2×35S:AeCHS:YFP fusion protein signal was detected only in the cytoplasm (Figure 6B), which indicated that AeCHS seemed likely to be a structural gene encoding chalcone synthase controlling anthocyanin biosynthesis. The same results were obtained in three independent experiments.

3.5. Silencing of AeCHS in A. eriantha Petals

Available approaches to gene silencing are limited and rarely reported in Actinidia. A novel approach, namely, an infiltration grafting-mediated VIGS system was applied in A. eriantha petals. The results showed A. eriantha ‘Zaoxu’ scions infiltrated with pTRV1/pTRV2:AeCHS virus displayed bleached petals at about twenty days after infiltration grafting. In contrast, control scions infiltrated with pTRV1/pTRV2 displayed normal petal color (Figure 7). In addition to phenotypic changes resulted from AeCHS silencing, pigment content and gene expression were analyzed to investigate whether silencing of AeCHS could induce other changes at molecular level in A. eriantha ‘Zaoxu’ petals. Total anthocyanin content in pTRV1/pTRV2:AeCHS infiltrated petals was significantly lower than that in pTRV1/pTRV2 infiltrated petals (Figure 8A). Transcript abundance of AeCHS was reduced in pTRV1/pTRV2:AeCHS infiltrated petals by approximately 85%, reaching a highly significant difference at 0.001 probability level (Figure 8B). Besides AeCHS, the relative expression level of other genes involved anthocyanin biosynthesis showed different changing trend in different typed petal samples. Compared to control and not treated petals, the expression of LBGs (late synthetic genes) including LDOX, UFGT and UFGGT was lower in silencing petals (Figure 8C).

4. Discussion

4.1. Anthocyanin Changes in Three Types of Petals

Anthocyanins dominate flower coloration in most plant species. We measured the concentrations of anthocyanins and their precursors in three types of petals including, A. eriantha, A. hemsleyana, and A. arguta, with red, light pink, and white color petals, respectively. The content of different anthocyanins components showed similar variation trends in the three types of petals. Except for cyanidin-3-O-galactoside, the content of other anthocyanins and their precursors in A. eriantha petals was significantly higher than that in A. hemsleyana or A. arguta. In addition, the concentration of cyanidin-3-O-xylose-galactoside was significantly higher than that of other anthocyanins and anthocyanins precursors, followed by delphinidin-3-O-galactoside and cyanidin-3-O-galactoside. These results not only indicate that the formation of the red color of petals is due to accumulation of anthocyanin components, additionally, they suggest that cyanidin-3-O-xylose-galactoside is the main anthocyanin component primarily responsible for the red color in petals of A. eriantha, which partially agrees with Fraser [8], who suggested that the red petal phenotype in the interspecific Actinidia population results from a mixture of anthocyanins, with cyanidin-3-O-galactoside present in the greatest concentration, and with cyanidin-3-O-xylose-galactoside and cyanidin-3-O-glucoside also present in significant amounts. However, the reasons for this difference need to be further explored.

4.2. Screening, Cloning and Subcellular Localization of AeCHS

Anthocyanin biosynthesis has been extensively studied in different plant tissues including fruits, flowers, and seeds, among others. Anthocyanin accumulation is determined by structural genes including, PAL, C4H, 4CL, CHS, CHI, F3H, F3′H, F3′5′H, DFR, LDOX, UFGT, UFGGT, FLS, LAR and ANR. The key structural gene participating in anthocyanin biosynthesis is different in different plant species. Furthermore, the key structural gene in different tissues within the same plant species also varies. Previous research has shown that the gene involved in the last step, UFGT, is the key structural gene involved in anthocyanin biosynthesis and that it determines anthocyanin accumulation in many fruits, such as pear [56], peach [57] and kiwifruit [6]. In a previous study, using transcriptome analysis we concluded that AaLDOX is a key structural gene involved in anthocyanin biosynthesis in A. arguta fruit [58].
Most studies have focused on fruit tissues, whereas flower tissues, have scarcely been documented despite being equally important tissues determining the phenotype of any cultivar. By measurement and comparison of transcription abundance of the 15 structural genes mentioned above in the three different types of Actinidia petals under study here, we found that the regulation of CHS expression was different from that of other genes. The expression level of CHS in A. eriantha petals was significantly higher than that in A. hemsleyana or in A. arguta petals (Figure 4A). Cluster analysis showed that CHS was clustered into a single class distinctly separated from the rest of the genes (Figure 4B), possibly indicating that the expression pattern of CHS seems to be different from others and CHS might be the key gene controlling anthocyanin biosynthesis in A. eriantha petals. Therefore, we selected CHS as candidate structural gene for subsequent research. Through homologous cloning, we obtained the AeCHS complete coding sequence with 1170 bp encoding a protein of 389 amino acids from A. eriantha cv ‘Zaoxu’ petal and sequence alignment showed AeCHS was highly conserved in Actinidia species (Figure 5). Furthermore, subcellular localization experiments conducted by transient injection assays in N. Benthamiana leaves showed that AeCHS is located in the cytoplasm, which indicates AeCHS is indeed a structural gene encoding chalcone synthase participating in anthocyanin biosynthesis and controlling anthocyanin accumulation. These results prove that the key structural gene responsible for color is different in different plant tissues.

4.3. Infiltration Grafting-mediated VIGS

Although the VIGS methodology was reported a long time ago [47], its application is still quite limited in fruit trees compared with other model plant species. There have been few successful reports of VIGS application, such as in apple [50], strawberry [51] and recently in kiwifruit [52]. In perennial woody plants, such as fruit trees, grafting is the main reproductive mode; therefore, here we used the new experimental method known as infiltration grafting-mediated VIGS to silence the target gene in A. eriantha petals based on the previous experience with the application of the VIGS method in roses [43]. The petal phenotype of silenced AeCHS was obviously white at the upper part of the petal, while the control phenotype, i.e., without silenced AeCHS, was the normal red color (Figure 7). Total anthocyanin content of silenced petal AeCHS was significantly lower than that of control petals (Figure 8A); furthermore, analysis of the expression level showed that the abundance of AeCHS transcripts in the AeCHS-silenced petals was less than 80% of that in control petals at twenty days after infiltration grafting (Figure 8B). In addition, the expression level of LBGs including LDOX, UFGT and UFGGT involved in anthocyanin biosynthesis in silencing petals was significantly lower than that in control and non-treated petals (Figure 8C). This might suggest silencing of AeCHS might reduce anthocyanin biosynthesis and accumulation mainly by repressing expression of LBGs in A. eriantha petal. However, the specific mechanism needs further study to prove. Since there are different copies for different genes of the anthocyanin pathway, the derived conclusion might be limited by the results of one gene copy. Therefore, it is necessary to understand the expression and function of each gene copy in further research.
Altogether, these results suggest that infiltration grafting-mediated VIGS might be an effective method to silence a target gene, and silencing AeCHS could significantly reduce the number of AeCHS transcripts and total anthocyanin content, thus resulting in abnormal coloration of A. eriantha petals. After removal of the flowers and the transparent bags from the stalk, the graft union can continue growing healthy (Figure 9). Therefore, we conclude that AeCHS is a key structural gene involved in anthocyanin biosynthesis and that it is indispensable for petal normal coloration in A. eriantha. However, this conclusion is not consistent with previous studies that confirmed that UFGT, and not AeCHS, is the key structural gene controlling anthocyanin biosynthesis and accumulation in Actinidia red petals [8,9]. The reason for the discrepancy might be the difference in materials used for experimentation, as different materials have different key genes playing a key role in anthocyanin biosynthesis. The specific molecular mechanism leading to this difference needs further study.

Supplementary Materials

The following are available online at https://www.mdpi.com/2073-4425/10/12/949/s1, Figure S1: Basic information of AeCHS used for VIGS.

Author Contributions

Y.L. designed the experiments, carried out the research, analyzed the data, and wrote and revised the manuscript. X.Q. and W.C. provided useful technical assistance in the grafting experiments. C.Q. helped in the determination of anthocyanin components. M.L. and Y.Z. provided important suggestions and assisted in the analysis of the data. J.F. and C.H. designed the study and revised the manuscript. All authors participated in this study and approved the final version of the manuscript.

Acknowledgments

This work was supported by the National Natural Science Foundation of China (Grant No. 31401825), by the National Key R&D Program of China (Grant No. 2018YFD1000205), and by the Special Funds for Science and Technology Innovation Project of the Chinese Academy of Agricultural Sciences (CAAS-ASTIP-2018-ZFRI).

Conflicts of Interest

The authors declare that they have no conflict of interest.

References

  1. Huang, H.W.; Ferguson, A.R. Actinidia in China: Natural diversity, phylogeographical evolution, interspecific gene flow and kiwifruit cultivar improvement. Acta Hortic. 2007, 753, 31–40. [Google Scholar] [CrossRef]
  2. Li, J.Q.; Li, X.W.; Soejarto, D.D. A revision of the genus Actinidia from China. Acta Hortic. 2007, 753, 41–44. [Google Scholar] [CrossRef]
  3. Zhang, Q.; Liu, C.Y.; Liu, Y.F.; VanBuren, R.; Yao, X.H.; Zhong, C.H.; Huang, H. High-density interspecific genetic maps of kiwifruit and the identification of sex-specific markers. DNA Res. 2015, 22, 367–375. [Google Scholar] [CrossRef] [PubMed]
  4. Guroo, I.; Wani, S.A.; Wani, S.M.; Ahmad, M.; Mir, S.A.; Masoodi, S.A. A review of production and processing of kiwifruit. J. Food Process. Technol. 2017, 8, 699. [Google Scholar] [CrossRef]
  5. Huang, H.W. The Genus Actinidia, a World Monograph; Science Press: Beijing, China, 2014. [Google Scholar]
  6. Montefiori, M.; Espley, R.V.; Stevenson, D.; Cooney, J.; Datson, P.M.; Saiz, A.; Atkinson, R.G.; Hellens, R.P.; Allan, A.C. Identification and characterisation of F3GT1 and F3GGT1, two glycosyltransferases responsible for anthocyanin biosynthesis in red-fleshed kiwifruit (Actinidia chinensis). Plant J. 2011, 65, 106–118. [Google Scholar] [CrossRef]
  7. Peng, Y.Y.; Wang, K.L.; Cooney, J.M.; Wang, T.C.; Espley, R.V.; Allan, A.C. Differential regulation of the anthocyanin profile in purple kiwifruit (Actinidia species). Hortic. Res. 2019, 6, 3. [Google Scholar] [CrossRef]
  8. Fraser, L.G.; Seal, A.G.; Montefiori, M.; McGhie, T.K.; Tsang, G.K.; Datson, P.M.; Hilario, E.; Marsh, H.E.; Dunn, J.K.; Hellens, R.P.; et al. An R2R3 MYB transcription factor determines red petal colour in an Actinidia (kiwifruit) hybrid population. BMC Genom. 2013, 14, 28. [Google Scholar] [CrossRef]
  9. Wu, R.M.; Wang, T.C.; McGie, T.; Voogd, C.; Allan, A.C.; Hellens, R.P.; Varkonyi-Gasic, E. Overexpression of the kiwifruit SVP3 gene affects reproductive development and suppresses anthocyanin biosynthesis in petals, but has no effect on vegetative growth, dormancy, or flowering time. J. Exp. Bot. 2014, 65, 4985–4995. [Google Scholar] [CrossRef]
  10. Allan, A.C.; Hellens, R.P.; Laing, W.A. MYB transcription factors that colour our fruit. Trends Plant Sci. 2008, 13, 99–102. [Google Scholar] [CrossRef]
  11. Glover, B.J.; Martin, C. Anthocyanin. Curr. Biol. 2012, 22, R147–R150. [Google Scholar] [CrossRef]
  12. Gould, K.S.; Lister, C. Flavonoid functions in plants. In Flavonoids: Chemistry, Biochemistry, and Applications; CRC Press: Boca Raton, FL, USA, 2006; pp. 397–411. ISBN 9780849320217. [Google Scholar]
  13. Grotewold, E. The genetics and biochemistry of floral pigments. Annu. Rev. Plant Biol. 2006, 57, 761–780. [Google Scholar] [CrossRef] [PubMed]
  14. Kay, C.D. Aspects of anthocyanin absorption, metabolism and pharmacokinetics in humans. Nutr. Res. Rev. 2006, 19, 137–146. [Google Scholar] [CrossRef] [PubMed]
  15. Stevenson, D.E.; Hurst, R.D. Polyphenolic phytochemicals—Just antioxidants or much more? Cell Mol. Life Sci. 2007, 64, 2900–2916. [Google Scholar] [CrossRef] [PubMed]
  16. Zafra-Stone, S.; Yasmin, T.; Bagchi, M.; Chatterjee, A.; Vinson, J.A.; Bagchi, D. Berry anthocyanins as novel antioxidants in human health and disease prevention. Mol. Nutr. Food Res. 2007, 51, 675–683. [Google Scholar] [CrossRef]
  17. de Pascual-Teresa, S.; Sanchez-Ballesta, M.T. Anthocyanins: From plant to health. Phytochem. Rev. 2008, 7, 281–299. [Google Scholar] [CrossRef]
  18. Quattrocchio, F.; Wing, J.F.; Leppen, H.; Mol, J.; Koes, R.E. Regulatory genes controlling anthocyanin pigmentation are functionally conserved among plant species and have distinct sets of target genes. Plant Cell 1993, 5, 1497–1512. [Google Scholar] [CrossRef]
  19. Holton, T.A.; Cornish, E.C. Genetics and biochemistry of anthocyanin biosynthesis. Plant Cell 1995, 7, 1071–1083. [Google Scholar] [CrossRef]
  20. Song, Y.H.; Yoo, C.M.; Hong, A.P.; Kim, S.H.; Jeong, H.J.; Shin, S.Y.; Kim, H.J.; Yun, D.J.; Lim, C.O.; Bahk, J.D.; et al. DNA-binding study identifies C-Box and hybrid C/G-Box or C/ABox motifs as high-affinity binding sites for STF1 and LONG HYPOCOTYL5 proteins. Plant Physiol. 2008, 146, 1862–1877. [Google Scholar] [CrossRef]
  21. Albert, N.W.; Lewis, D.H.; Zhang, H.; Schwinn, K.E.; Jameson, P.E.; Davies, K.M. Members of an R2R3-MYB transcription factor family in Petunia are developmentally and environmentally regulated to control complex floral and vegetative pigmentation patterning. Plant J. 2011, 65, 771–784. [Google Scholar] [CrossRef]
  22. An, X.H.; Tian, Y.; Chen, K.Q.; Wang, X.F.; Hao, Y.J. The apple WD40 protein MdTTG1 interacts with bHLH but not MYB proteins to regulate anthocyanin accumulation. J Plant Physiol. 2012, 169, 710–717. [Google Scholar] [CrossRef]
  23. Schaart, J.G.; Dubos, C.; Romero, D.L.F.I.; van Houwelingen, A.M.; de Vos, R.C.; Jonker, H.H.; Xu, W.; Routaboul, J.M.; Lepiniec, L.; Bovy, A.G. Identification and characterization of MYB-bHLH-WD40 regulatory complexes controlling proanthocyanidin biosynthesis in strawberry (Fragaria × ananassa) fruits. New Phytol. 2012, 197, 454–467. [Google Scholar] [CrossRef] [PubMed]
  24. Patra, B.; Schluttenhofer, C.; Wu, Y.; Pattanaik, S.; Yuan, L. Transcriptional regulation of secondary metabolite biosynthesis in plants. Biochim. Biophys. Acta. 2013, 1829, 1236–1247. [Google Scholar] [CrossRef] [PubMed]
  25. Li, W.; Wang, B.; Wang, M.; Chen, M.; Yin, J.M.; Kaleri, G.M.; Zhang, G.M.; Zuo, T.N.; You, X.; Yang, Q. Cloning and characterization of a potato StAN11 gene involved in anthocyanin biosynthesis regulation. J. Integr. Plant Biol. 2014, 56, 364–372. [Google Scholar] [CrossRef] [PubMed]
  26. Xu, W.; Grain, D.; Bobet, S.; Le Gourriere, J.; Thévenin, J.; Kelemen, Z.; Lepiniec, L.; Dubos, C. Complexity and robustness of the flavonoid transcriptional regulatory network revealed by comprehensive analyses of MYB-bHLH-WDR complexes and their targets in Arabidopsis seed. New Phytol. 2014, 202, 132–144. [Google Scholar] [CrossRef] [PubMed]
  27. El-Sharkawy, I.; Liang, D.; Xu, K.N. Transcriptome analysis of an apple (Malus x domestica) yellow fruit somatic mutation identifies a gene network module highly associated with anthocyanin and epigenetic regulation. J. Exp. Bot. 2015, 66, 7359–7376. [Google Scholar] [CrossRef]
  28. Montefiori, M.; Brendolise, C.; Darem, A.P.; Lin-Wang, K.; Davies, K.M.; Hellens, R.P.; Allan, A.C. In the Solanaceae, a hierarchy of bHLHs confer distinct target specificity to the anthocyanin regulatory complex. J. Exp. Bot. 2015, 66, 1427–1436. [Google Scholar] [CrossRef] [PubMed]
  29. Xu, W.; Dubos, C.; Lepiniec, L. Transcriptional control of flavonoid biosynthesis by MYB-bHLH-WDR complexes. Trends Plant Sci. 2015, 20, 176–185. [Google Scholar] [CrossRef]
  30. Cho, K.; Cho, K.S.; Sohn, H.B.; Ha, I.J.; Hong, S.Y.; Lee, H.; Kim, Y.M.; Nam, M.H. Network analysis of the metabolome and transcriptome reveals novel regulation of potato pigmentation. J. Exp. Bot. 2016, 67, 1519–1533. [Google Scholar] [CrossRef]
  31. Springob, K.; Nakajima, J.; Yamazaki, M.; Saito, K. Recent advances in the biosynthesis and accumulation of anthocyanins. Nat. Prod. Rep. 2003, 20, 288–303. [Google Scholar] [CrossRef]
  32. Petroni, K.; Tonelli, C. Recent advances on the regulation of anthocyanin synthesis in reproductive organs. Plant Sci. 2011, 181, 219–229. [Google Scholar] [CrossRef]
  33. Boss, P.K.; Davies, C.; Robinson, S.P. Analysis of the expression of anthocyanin pathway genes in developing Vitis vinifera L. cv Shiraz grape berries and the implications for pathway regulation. Plant Physiol. 1996, 111, 1059–1066. [Google Scholar] [CrossRef] [PubMed] [Green Version]
  34. Takos, A.M.; Jaffé, F.W.; Jacob, S.R.; Bogs, J.; Robinson, S.P.; Walker, A.R. Light-induced expression of a MYB gene regulates anthocyanin biosynthesis in red apples. Plant Physiol. 2006, 142, 1216–1232. [Google Scholar] [CrossRef] [PubMed] [Green Version]
  35. Lou, Q.; Liu, Y.; Qi, Y.; Jiao, S.; Tian, F.; Jiang, L.; Wang, Y. Transcriptome sequencing and metabolite analysis reveals the role of delphinidin metabolism in flower colour in grape hyacinth. J. Exp. Bot. 2014, 65, 3157–3164. [Google Scholar] [CrossRef] [PubMed] [Green Version]
  36. Huang, S.; Ding, J.; Deng, D.; Tang, W.; Sun, H.; Liu, D.; Zhang, X.; Meng, M.; Yu, J.; Liu, J.; et al. Draft genome of the kiwifruit Actinidia chinensis. Nat. Commun. 2013, 4, 2640. [Google Scholar] [CrossRef]
  37. Pilkington, S.M.; Crowhurst, R.; Hilario, E.; Nardozza, S.; Fraser, L.; Peng, Y.Y.; Gunaseelan, K.; Simpson, R.; Tahir, J.; Deroles, S.C.; et al. A manually annotated Actinidia chinensis var. chinensis (kiwifruit) genome highlights the challenges associated with draft genomes and gene prediction in plants. BMC Genom. 2018, 19, 257. [Google Scholar] [CrossRef] [Green Version]
  38. Tang, W.; Sun, X.; Yue, J.; Tang, X.; Jiao, C.; Yang, Y.; Niu, X.; Miao, M.; Zhang, D.; Huang, S.; et al. Chromosome-scale genome assembly of kiwifruit Actinidia eriantha with single-molecule sequencing and chromatin interaction mapping. GigaScience 2019, 8. [Google Scholar] [CrossRef] [Green Version]
  39. Liu, Y.; Schiff, M.; Marathe, R.; Dinesh-Kumar, S. Tobacco Rar1, EDS1 and NPR1/NIM1 like genes are required for N-mediated resistance to tobacco mosaic virus. Plant J. 2002, 30, 415–429. [Google Scholar] [CrossRef]
  40. Liu, Y.; Nakayama, N.; Schiff, M.; Litt, A.; Irish, V.F.; Dinesh-Kumar, S. Virus induced gene silencing of a DEFICIENS ortholog in Nicotiana benthamiana. Plant Mol. Biol. 2004, 54, 701–711. [Google Scholar] [CrossRef]
  41. Ma, N.; Xue, J.; Li, Y.; Liu, X.; Dai, F.; Jia, W.; Luo, Y.; Gao, J. Rh-PIP2; 1, a rose aquaporin gene, is involved in ethyleneregulated petal expansion. Plant Physiol. 2008, 148, 894–907. [Google Scholar] [CrossRef] [Green Version]
  42. Ito, H.; Ochiai, M.; Kato, H.; Shiratake, K.; Takemoto, D.; Otagaki, S. Rose phytoene desaturase gene silencing by apple latent spherical virus vectors. Hort. Sci. 2012, 47, 1278–1282. [Google Scholar] [CrossRef]
  43. Yan, H.; Shi, S.; Ma, N.; Cao, X.; Zhang, H.; Qiu, X.; Wang, Q.; Jian, H.; Zhou, N.; Zhang, Z.; et al. Graft-accelerated virus-induced gene silencing facilitates functional genomics in rose flowers. J. Integr. Plant. Biol. 2018, 60, 34–44. [Google Scholar] [CrossRef] [PubMed]
  44. Gao, X.; Li, F.; Li, M.; Kianinejad, A.S.; Dever, J.K.; Wheeler, T.A.; Li, Z.; He, P.; Shan, L. Cotton GhBAK1 mediates Verticillium wilt resistance and cell death. J. Integr. Plant. Biol. 2013, 55, 586–596. [Google Scholar] [CrossRef] [PubMed] [Green Version]
  45. Chen, Z.; Jia, F.; Hu, J.; Pang, J.; Xu, L.; Wang, L. Virus-induced gene silencing of PEAM4 affects floral morphology by altering the expression pattern of PsSOC1a and PsPVP in pea. J. Plant Physiol. 2014, 171, 148–153. [Google Scholar] [CrossRef] [PubMed]
  46. Faivre-Rampant, O.; Gilroy, E.M.; Hrubikova, K.; Hein, I.; Millam, S.; Loake, G.J.; Birch, P.; Taylor, M.; Lacomme, C. Potato virus X-induced gene silencing in leaves and tubers of potato. Plant Physiol. 2004, 134, 1308–1316. [Google Scholar] [CrossRef] [Green Version]
  47. Liu, Y.; Schiff, M.; Dinesh-Kumar, S.P. Virus-induced gene silencing in tomato. Plant J. 2002, 31, 777–786. [Google Scholar] [CrossRef]
  48. Fu, D.Q.; Zhu, B.Z.; Zhu, H.L.; Jiang, W.B.; Luo, Y.B. Virus-induced gene silencing in tomato fruit. Plant J. 2005, 43, 299–308. [Google Scholar] [CrossRef]
  49. Zhu, H.L.; Zhu, B.Z.; Shao, Y.; Wang, X.G.; Lin, X.J.; Xie, Y.H. Tomato fruit development and ripening are altered by the silencing of LeEIN2 gene. J. Integr. Plant. Biol. 2006, 48, 1478–1485. [Google Scholar] [CrossRef]
  50. Yamagishi, N.; Yoshikawa, N. Highly efficient virus-induced gene silencing in apple and soybean by apple latent spherical virus vector and biolistic inoculation. Methods Mol. Biol. 2013, 975, 167–181. [Google Scholar] [CrossRef]
  51. Tian, J.; Cheng, L.; Han, Z.Y.; Yao, Y.C. Tobacco rattle virus mediated gene silencing in strawberry plants. Plant Cell Tissue Organ Cult. 2015, 120, 1131–1138. [Google Scholar] [CrossRef]
  52. Liu, Y.F.; Zhou, B.; Qi, Y.W.; Liu, C.H.; Liu, Z.D.; Ren, X.L. Biochemical and functional characterization of AcUFGT3a, a galactosyltransferase involved in anthocyanin biosynthesis in the red-fleshed kiwifruit (Actinidia chinensis). Physiol. Plant 2018, 162, 409–426. [Google Scholar] [CrossRef]
  53. Jeffree, C.E.; Yeoman, M.M. Development of intercellular connections between opposing cells in a graft union. New Phytologist. 1983, 93, 491–509. [Google Scholar] [CrossRef]
  54. Ampomah-Dwamena, C.; McGhie, T.; Wibisono, R.; Montefiori, M.; Hellens, R.P.; Allan, A.C. The kiwifruit lycopene β-cyclase plays a significant role in carotenoid accumulation in fruit. J. Exp. Bot. 2009, 60, 3765–3779. [Google Scholar] [CrossRef] [Green Version]
  55. Livak, K.J.; Schmittgen, T.D. Analysis of relative gene expression data using real-time quantitative PCR and the 2(-Delta Delta C(T)) Method. Methods 2001, 25, 402–408. [Google Scholar] [CrossRef] [PubMed]
  56. Wang, Z.G.; Meng, D.; Wang, A.D.; Li, T.L.; Jiang, S.L.; Cong, P.H.; Li, T. The methylation of the PcMYB10 promoter is associated with green-skinned sport in max red bartlett pear. Plant Physiol. 2013, 162, 885–896. [Google Scholar] [CrossRef] [PubMed] [Green Version]
  57. Tuan, P.A.; Bai, S.L.; Yaegaki, H.; Tamura, T.; Hihara, S.; Moriguchi, T.; Oda, K. The crucial role of PpMYB10.1 in anthocyanin accumulation in peach and relationships between its allelic type and skin color phenotype. BMC Plant Biol. 2015, 15, 280. [Google Scholar] [CrossRef] [PubMed] [Green Version]
  58. Li, Y.K.; Fang, J.B.; Qi, X.J.; Lin, M.M.; Zhong, Y.P.; Sun, L.M. A key structural gene, AaLDOX, is involved in anthocyanin biosynthesis in all red-fleshed kiwifruit (Actinidia arguta) based on transcriptome analysis. Gene 2018, 648, 31–41. [Google Scholar] [CrossRef] [PubMed]
Figure 1. Anthocyanin biosynthetic pathway in kiwifruit. PAL, phenylalanine ammonia-lyase; C4H, trans-cinnamate 4-hydroxylase; 4CL, 4-coumarate: CoA ligase; CHS, chalcone synthase; CHI, chalcone isomerase; F3H, flavanone 3-hydroxylase; F3′H, flavonoid 3′-hydroxylase; F3′5′H, flavonoid 3′,5′-hydroxylase; DFR, dihydroflavonol 4-reductase; LDOX, leucoanthocyanidin dioxygenase; UFGT, flavonoid 3-O-galactosyl transferase; UFGGT, flavonoid 3-O-galactoside-xylosyl transferase; FLS, flavonol synthase; LAR, leucoanthocyanidin reductase; ANR, anthocyanidin reductase.
Genes 10 00949 g001
Figure 2. Flower phenotype in three different Actinidia species. The petal color of A. eriantha, A. hemsleyana, and A. arguta are red, light pink, and white, respectively.
Genes 10 00949 g002
Figure 3. Anthocyanin components contents and their precursors including dihydroquercetin, dihydromyricetin, cyanidin, delphinidin, cyanidin-3-O-galactoside, delphinidin-3-O-galactoside and cyanidin-3-O-xylose-galactoside. (A) Dihydroquercetin content in three typed petals. (B) Cyanidin content in three typed petals. (C) Cyanidin-3-O-galactoside content in three typed petals. (D) Cyanidin-3-O-xylose-galactoside in three typed petals. (E) Dihydromyricetin content in three typed petals. (F) Delphinidin content in three typed petals. (G) Delphinidin-3-O-galactoside in three typed petals. (H) Total anthocyanin content in three typed petals. Data are means ± SE of three replicates. Error bars represent standard error of means. Columns with different lowercase letters are significantly different at P ≤ 0.05. Data were analyzed with Student’s t-test.
Genes 10 00949 g003
Figure 4. Expression profiles of structural genes in three Actinidia species including A. eriantha, A. hemsleyana, and A. arguta (A), and cluster analysis of gene expression (B). Data are means ± SE of three replicates. Error bars represent standard error of the means. Columns with different lowercase letters are significantly different at P ≤ 0.05. Cyan and pink boxes with normalized color scales from -1 to 1 indicate low and high expression level, respectively. The blue shadow indicates that CHS gene is clustered into a single group.
Genes 10 00949 g004
Figure 5. Sequence alignments of DNA and protein, and construction of phylogenetic tree. (A) DNA sequence alignment of CHS in different Actinidia species and cultivars. (B) Protein sequence alignment of CHS in different Actinidia species and cultivars. (C) Construction of the phylogenetic tree based on amino acid sequences. AeCHS, the complete coding sequence was identified and cloned from Actinidia eriantha ‘Zaoxu’ petals. DTZ79_22g06860, gene ID of CHS in Actinidia eriantha ‘White’; Achn109041/Ach00g109041.1, Gene ID of CHS in Actinidia chinensis ‘Hongyang’; Acc02004.1, Gene ID of CHS in Actinidia chinensis ‘Red 5′.
Genes 10 00949 g005
Figure 6. Subcellular localization. (A) Vector construction of 2×35S:YFP and 2×35S:AeCHS:YFP. (B) Subcellular localization of AeCHS in Nicotiana benthamiana leaves. Experiments were repeated three times. Cells expressing AeCHS:YFP fusion gene showed fluorescence in cytoplasm. Cells expressing empty plasmid with YFP tag was used as a control.
Genes 10 00949 g006
Figure 7. Petals of AeCHS-silenced (upper) and the control (lower) A. eriantha ‘Zaoxu’ flowers. Petals of AeCHS-silenced flowers were of a paler pink than those of the control, and close to white.
Genes 10 00949 g007
Figure 8. Total anthocyanin content and expression level of AeCHS and other genes involved in anthocyanin biosynthesis for VIGS samples. (A) Total anthocyanin analyses in silenced lines 1 and 2, control and untreated petal samples. (B) Expression profiles of AeCHS in silenced lines 1 and 2, control and untreated petal samples. Data are means ± SE of three replicates. Asterisks indicate significant differences calculated using Duncan’s test (*** P ≤ 0.001). (C) Expression level of related genes involved in anthocyanin biosynthesis in silenced lines 1 and 2, control and untreated petal samples. Different letters denote statistical significance using one-way ANOVA, P < 0.05.
Genes 10 00949 g008
Figure 9. Growth status of scions after removing flowers.
Genes 10 00949 g009
Table 1. Primers used for RT-qPCR.
GeneForward Primer (5′ to 3′)Reverse Primer (5′ to 3′)
PALGGACTGGGCTTTTGACAGGACAGAGGTGCACCATTCCACT
C4HAGTCCAAATCACAGAGCCCGGTATCCACCGAGCTTTGCCT
4CLTTGGCCAGGGCTATGGAATGGCCAGTTTCGGGGTCGATAA
CHSACAAAGCTCCTTGGTCTCCGCCCCCTTGTTGTTCTCTGCT
CHITGCCATTAACGGGCAAGGAATTGTAACGGCTTTGGCCTCT
F3HACCATCACGCTCTTGCTTCATGCTTGGTGGTCTGCATTCT
F3′HCACCCTCCTTAACCGTCACCCGGGCCATGGAAGCTATTGA
F3′5′HGTGGGAAAACCCGCTAGAGTTCCCATCCTTATGCCTGCAC
DFRCTTCCATGTCGCCACTCGTACAGATTGGGGGTGTTGTTGC
LDOXTACCCGGAGGACAAAAGGGAGAGCCGACCCTCTTCAAGTC
UFGTCGTGGCAATAGCTGAAGCACGAGTTCCACCCGCAATGAGT
UFGGTCACGTCCCGGAAACCCTAAATGCTCTCCCCAAAATCGCAT
FLSGGCAGTGTACCATCGGTCAATGTCATCCCCAACGAGCTTC
LARGGTTCCTGCCATCGGAGTTTGAAGTAGGGCCACGAAGCAA
ANRGTACAACGTCCCCACCGATTTGAAGTAGGCGACGGATTGG
β-actinTGCATGAGCGATCAAGTTTCAAGTGTCCCATGTCTGGTTGATGACT
Table 2. Correlation analysis between content of anthocyanin components precursors and expression level of fifteen genes involved in anthocyanin biosynthesis.
Anthocyanins and PrecursorsPALC4H4CLCHSCHIF3HF3’HF3’5’HDFRLDOXUFGTUFGGTFLSLARANR
Dihydroquercetin0.528−0.738 *0.4320.423−0.746 *−0.140.0030.1350.5950.2550.208−0.6390.140.421−0.793 *
Cyanidin−0.163−0.5290.925 **0.939 **−0.625−0.742 *0.739 *−0.387−0.102−0.586−0.585−0.858 **−0.6650.951 **−0.437
Cyanidin-3-O-galactoside−0.793 *0.1690.6570.688 *0.038−0.904 **0.984 **−0.782 *−0.742 *−0.947 **−0.958 **−0.356−0.962**0.720 *0.253
Cyanidin-3-O-xylose-galactoside−0.066−0.6330.971 *0.977 **−0.703 *−0.672 *0.584−0.295−0.011-0.528−0.514−0.923 **−0.6080.965−0.496
Dihyromyricetin0.052−0.720 *0.960 **0.960 **−0.790 *−0.5850.558−0.1810.099−0.448−0.421−0.961 **−0.5270.952 **−0.591
Delphinidin−0.055−0.6320.953 **0.966 **−0.709 *−0.682 *0.662−0.296−0.016−0.529−0.517−0.921 **−0.610.966 **−0.497
Delphinidin-3-O-galactoside−0.122−0.5980.985 **0.995 **−0.679 *−0.725 *0.668 *−0.349−0.07−0.585−0.573−0.920 **−0.6640.990 **−0.459
‘*’ indicates correlation is significant at the 0.05 level (2-tailed); ‘**’ indicates correlation is significant at the 0.01 level (2-tailed). The gray shadow mark represents the expression level of candidate gene CHS is significantly correlated to 6 anthocyanins at 0.05 and 0.01 level.

