Article

Genome-Wide Association Study of Body Mass Index and Body Fat in Mexican-Mestizo Children

by
Paula Costa-Urrutia
1,
Valentina Colistro
2,
Angélica Saraí Jiménez-Osorio
1,
Helios Cárdenas-Hernández
1,
Jacqueline Solares-Tlapechco
1,
Miryam Ramirez-Alcántara
1,
Julio Granados
3,
Iván de Jesús Ascencio-Montiel
4 and
Martha Eunice Rodríguez-Arellano
1,*
1
Laboratorio de Medicina Genómica, Hospital Regional Lic. Adolfo López Mateos, ISSSTE. 1321 Universidad Avenue, Álvaro Obregón, Florida, Mexico City P.C0103, Mexico
2
Departamento de Métodos Cuantitativos, Facultad de Medicina, Universidad de la República, 2125 General Flores Avenue, Montevideo P.C11800, Uruguay
3
División de Inmunogenética, Departamento de Trasplantes, Instituto Nacional de Ciencias Médicas y Nutrición Salvador Zubirán. 15 Vasco de Quiroga Avenue. Mexico City P.C.14080, Mexico
4
Coordinación de Vigilancia de Epidemiología, Instituto Mexicano de Seguro Social, 120 Mier y Pesado Street, del Valle Benito Juárez, Mexico City C.P. 03100 Mexico
*
Author to whom correspondence should be addressed.
Genes 2019, 10(11), 945; https://doi.org/10.3390/genes10110945
Submission received: 8 October 2019 / Revised: 12 November 2019 / Accepted: 15 November 2019 / Published: 19 November 2019

Abstract

:
Background: Childhood obesity is a major health problem in Mexico. Obesity prevalence estimated by body mass index (BMI) is almost half than that estimated by percent body fat (%BF) in the Childhood Obesity pediatric cohort (COIPIS). Objective. We performed a genome-wide association study (GWAS) of BMI and %BF in 828 children from the COIPIS to identify markers of predisposition to high values for both phenotypes used for obesity classification. Methods: For the GWAS we used the LAT Axiom 1, Affymetrix and 2.5 million single loci from the 1000 Genomes Phase 3 imputation panel. We used a linear model, adjusted by age, sex, and Amerindian ancestry assuming an additive inheritance model. Results. Genome-wide significance (p ≤ 5.0 × 10⁻⁸) and 80% of statistical power was reached for associations of two loci in two genes (CERS3 and CYP2E1) to BMI. Also, 11 loci in six genes (ANKS1B, ARNTL2, KCNS3, LMNB1, SRGAP3, TRPC7) reached genome-wide significance for associations to %BF, though not 80% of statistical power. Discussion: None of the SNPs were previously reported as being associated to BMI or %BF. In addition, different loci were found for BMI and %BF. These results highlight the importance of gaining deeper understanding of genetic markers of predisposition to high values for the phenotypes used for obesity diagnosis.

1. Introduction

Childhood obesity is associated with severe health problems and premature death [1]. Mexico ranks as one of the first countries worldwide in childhood overweight/obesity with a mean national prevalence of 34.9% for school children [2]. Recently, for children from Mexico City in the pediatric Childhood Obesity cohort of the Healthy Childhood project (COIPIS) obesity prevalence estimated by percent body fat (%BF) was 43.7%, while it was 20.1% when estimated by body mass index (BMI) [3]. It means that the diagnosis of obesity by BMI underestimated around 50% of children diagnosed with obesity by %BF [3]. Deeper knowledge on the molecular etiology of the common phenotypes (or intermediate phenotypes) used for obesity diagnosis is key for improving its precision, and genome-wide association studies (GWAS) have been largely used for this purpose [4]. GWAS of BMI and/or obesity are typically performed in adults [4]; however, GWAS in children are recommended to identify what could affect early life [5]. In this regard, GWAS and meta-analysis in childhood populations with European ancestry have identified several of the novel loci [6,7]. Further, based on the 15 most strongly associated loci, it was found that the genetic predisposition to high BMI in childhood was associated with increased risk of type 2 diabetes and cardiovascular diseases in adult life [8].
In Mexico, the genetic components predisposing to high BMI and/or obesity in childhood are scarcely known. Efforts made have been concentrated in transferability studies from European adults to Mexican children, which showed partial BMI/obesity associated loci transferability [9,10,11,12,13,14], whereas a GWAS has not been reported in childhood population yet. To identify single nucleotide polymorphisms (SNPs) influencing BMI and %BF in Mexican children from COIPIS, we performed a GWAS using LAT Axiom 1, Affymetrix, and around 2.5 million SNPs from the 1000 Genomes Phase 3 imputation panel.

2. Materials and Methods
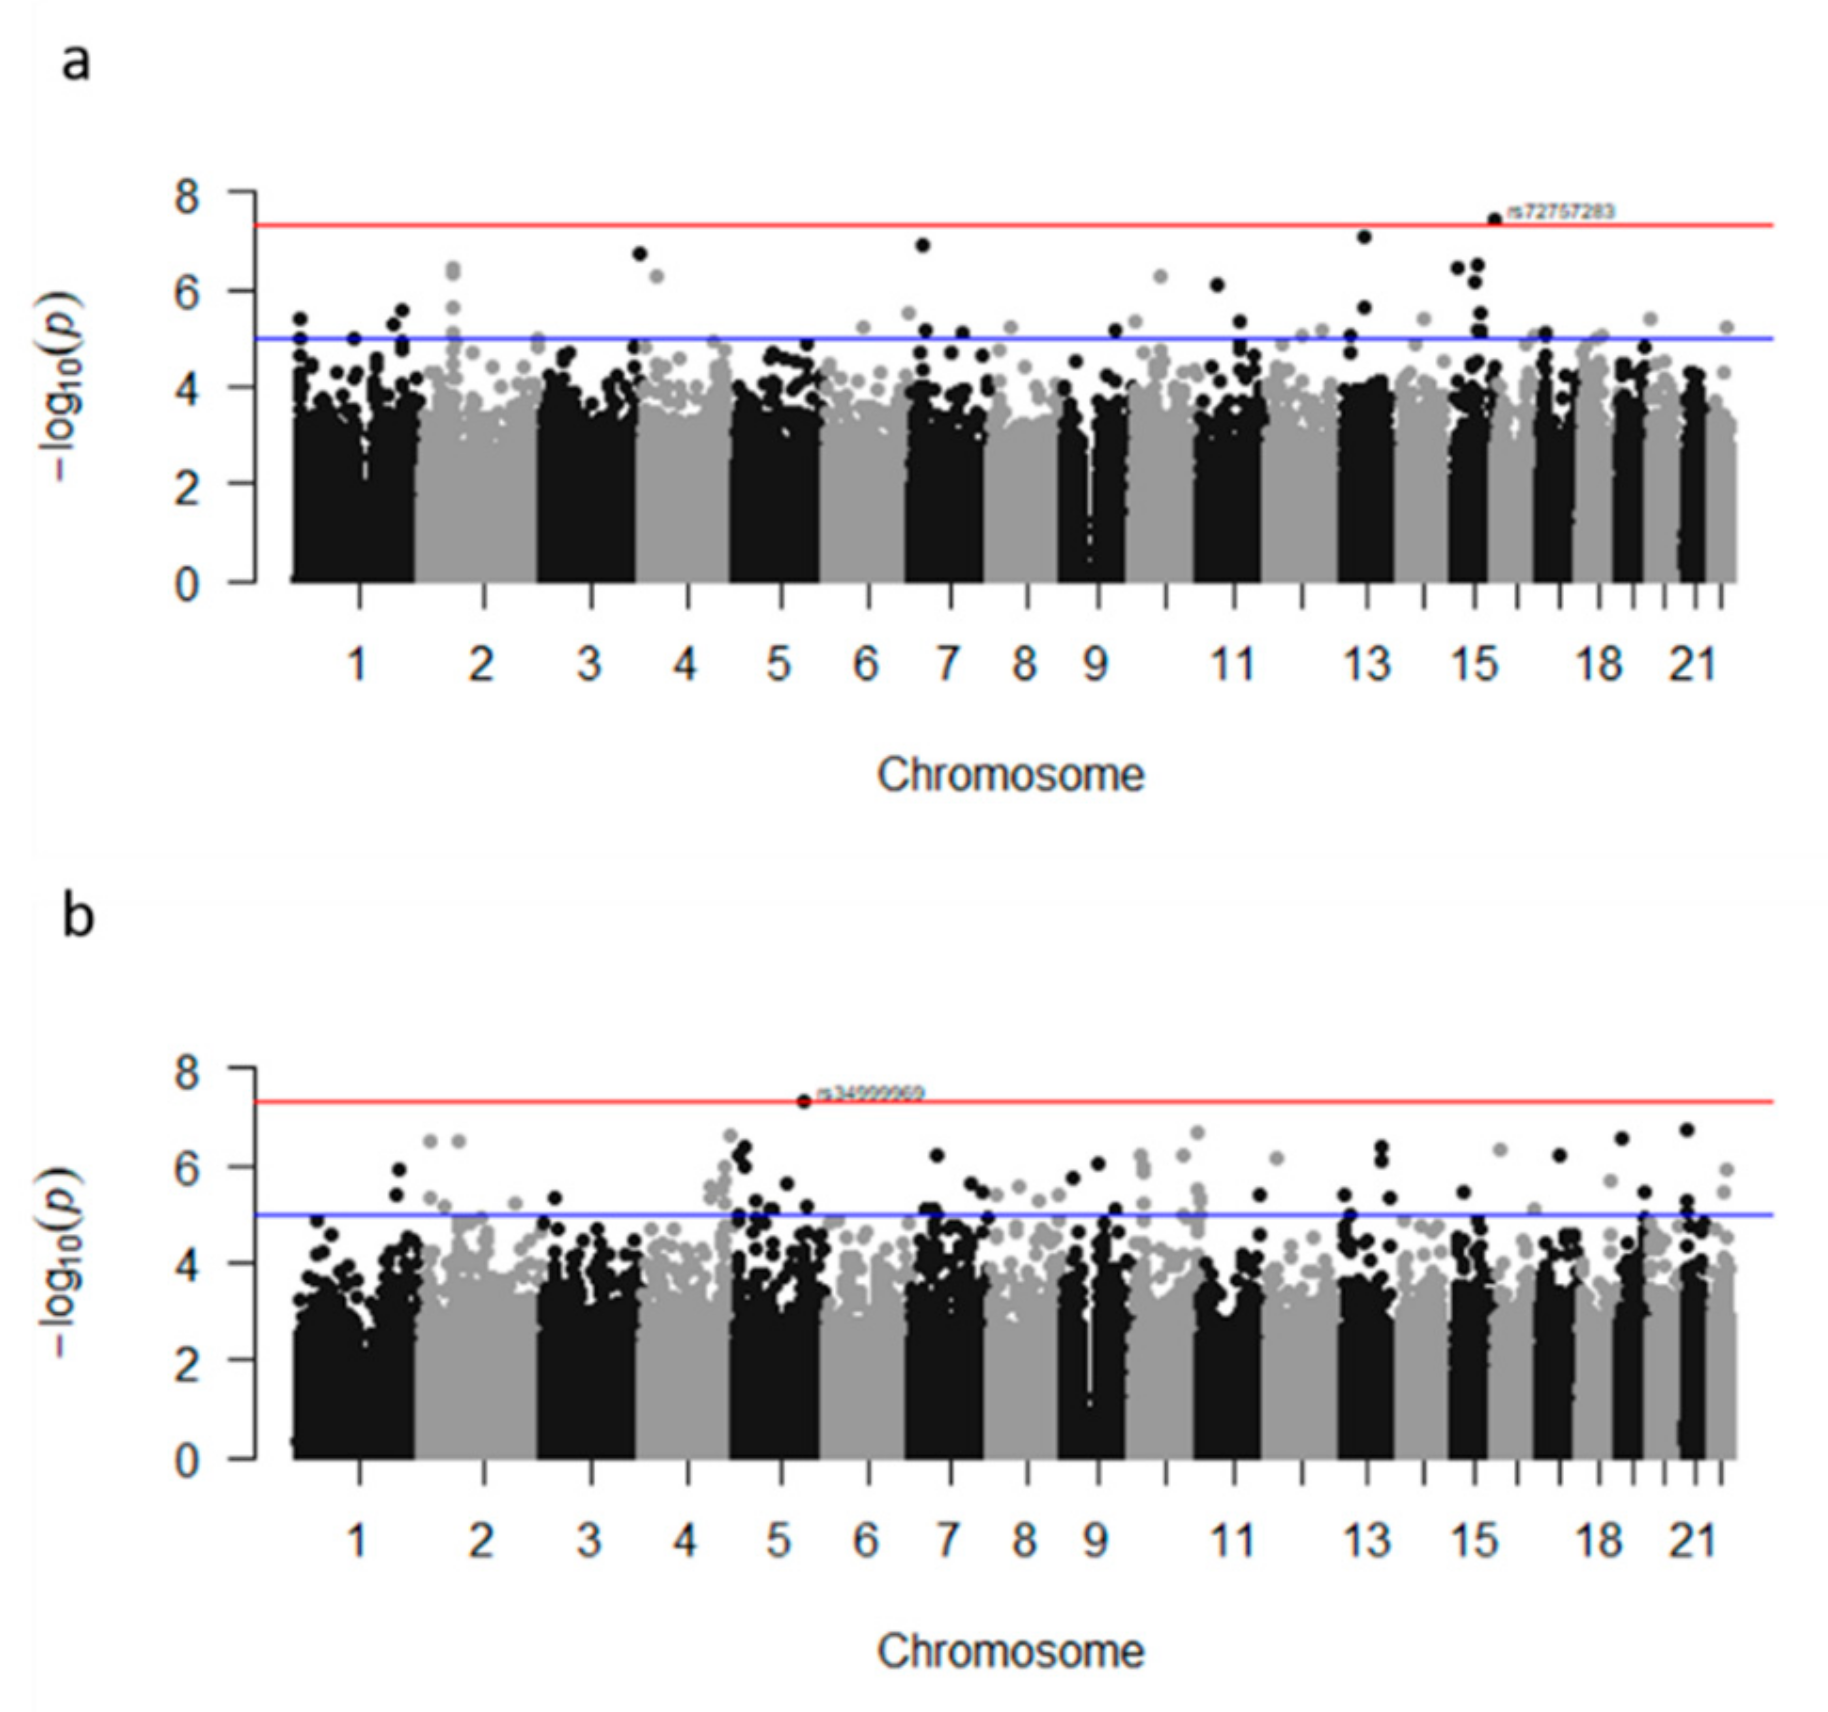
This study includes a total of 828 Mexican-Mestizo children (423 boys, 405 girls) from Mexico City, aged from 3 to 16 years old, of the COIPIS from the Genomic Medicine Laboratory at Hospital Regional Lic. Adolfo López Mateos, Instituto de Seguridad y Servicios Sociales de los Trabajadores del Estado, ISSSTE (Institute of Security and Social Services of State workers) [3].
Weight, height, and %BF were measured using InBody J10 equipment (Gangnam-gu, Seoul 135–854 KOREA). Children were measured after a 10-hour fast, without consuming water, and they were barefoot and wearing light clothes. Accuracy of the stadiometer integrated to InBody J10 was ± 0.1 cm and ± 0.01 kg for height and weight, respectively. Electrical bioimpedance was used to estimate %BF as implemented in InBody J10 tetrapolar equipment of three frequencies (5, 50, and 250 kHz) and anthropometry [15]. BMI (kg/m2) was calculated as body weight (kg) divided by square height (m2).
Genomic DNA was obtained from a whole blood sample. We used an automated system (QIASymphony, QIAGEN Hilden, Alemania). Genotyping was performed on Axiom® Genome-Wide LAT 1 Array, designed for Latin American populations with 813,551 single nucleotide polymorphism (SNPs) at the Affymetrix Services Lab (California, USA, http://www.affymetrix.com/). Genotype calling was conducted using the Genotyping Console from Affymetrix (Axiom Analysis Suite). The SNP calling was done following Affymetrix best practice workflow, which includes the Genotyping Console Software in combination with SNPolisher. These pipelines include SNP and sample call rate thresholds, Dish QC filtering, and heterozygosity. No samples were discarded due to sex discordance. Regarding population structure, two individuals were considered outliers and were not included in downstream analysis.
In addition, we used 2.5 million of SNPs from HapMap European-ancestry imputation panel. Before imputation, we applied quality filters; SNPs with a minor allele frequency below 1% (MAF) and SNPs with poor imputation quality (<98%) were removed from the database (MACHr2_hat ≤ 0.3, IMPUTE proper_info ≤ 0.4orinfo ≤ 0.4). The Hardy–Weinberg equilibrium was estimated using Fisher’s exact test, and linkage disequilibrium among the SNPs was tested using the R2 coefficient. Both analyses were conducted in PLINK 1.9 software [16]. SNPs failing any of these filters were removed from downstream analyses. We performed imputation using Eagle software for phasing [17] and 1000 Genomes Phase 3 as a reference panel using the algorithm Minimac 3 [18]. We filtered out variants with MAF <1% and non bi-allelic variants. In order to assess imputation quality control, genotyped SNPs were masked in the imputation and MAF of imputed/genotyped SNPs were compared afterwards. Mean differences were <1%.
Population structure analysis was conducted using Principal Component Analysis (PCA) in Eigenstructure [19] and individual admixture proportion was obtained using Admixture software version 1.3 [20]. The top three significant PCs after Tracy-Widom test were included. Data from parental population of European, African, Asian, and Native American individuals were obtained from 1000 Genomes Project (http://www.internationalgenome.org/), while Amerindian genotypes were available at the server of the Project which collected the samples (ftp://ftp.inmegen.gob.mx/). GWAS of BMI and %BF were obtained using a linear model, adjusted by age, sex, and Amerindian ancestry (AMA) assuming additive inheritance model in PLINK 1.9 software [16]. Power calculations to detect significance at 5.0 × 10⁻⁸ were performed using a continuous outcome design in Quanto software version 1.2.4 (University of Southern California, Los Angeles, CA; (University of Southern California, Los Angeles, CA; http://biostats.usc.edu/Quanto.html). [21]. Calculations were carried out for gene only, under an additive inheritance model and using the minor SNPs allele frequency 0.02. The whole sample means and SD for BMI and %BF were used (BMI mean = 19.2, SD = 5.1; %BF mean = 28.5, SD = 11.3). Our study had 80% statistical power to detect β ≥ 10 with an allele risk frequency less than 0.02. As allele frequency increased from 0.02 β ≥ 3 could be detected.
For the genes with (or near) those SNPs reaching genome-wide significance (p ≤ 5.0 × 10⁻⁸) or significance at 5.0 × 10⁻⁸p-value < 1.0 × 10⁻⁷passing Bonferroni correction (p < 0.05) we ran enrichment analyses for gene ontology using Enrichr web server software [22] to identify genes sharing a common biological function.
Parents of all children authorized their participation signing an informed consent. This project was approved by the Research and Ethics Committee of Regional Hospital Lic. Adolfo López Mateos (Registry number 447.2016) from ISSSTE.

3. Results

A total of 828 children (423 boys, 405 girls) aged from three to 16 were genotyped. The number of children, BMI and %BF means and standard deviation by sex and age are shown in Table 1. Distribution of BMI and %BF for the whole population is shown in Supplementary Materials Figure S1.
Regarding population structure, Mexican-Mestizo children formed a spread cluster distributed between the European, and Native-American parental populations—the expected pattern for Mestizo population [23,24]—with a mean of 57% (SD = 21%) of AMA and 36% (SD = 19%) of European ancestry. Population structure results are shown in Supplementary Materials Figure S2.
Overall, two loci in two genes reached genome-wide significance (p ≤ 5.0 × 10⁻⁸) associated with BMI (CERS3, CYP2E1) and 11 loci in 6 genes (ANKS1B, ARNTL2, KCNS3, LMNB1, SRGAP3, TRPC7) were associated to %BF. Before imputation, two loci reached genome-wide significance. One of them was associated to BMI (CERS3 rs72757283) (Figure 1a) and the other was associated to %BF (rs34, 999,969 near TRPC7) (Figure 1b). After imputation, associations for both SNPs remained significant. Three additional SNPs in genes PCDH15 and CERS3 were associated to BMI, while six additional SNPs in genes, ENAM, MARCH3, PHF20L1, SLC6A1, TRPC7, and ZC3H3 were associated to %BF at 5.0 × 10⁻⁸ < p-value < 1.0 × 10⁻⁷ significance level and passed Bonferroni correction (Table 2).
Variants in a single gene showed high Linkage Disequilibrium (LD), indicating that they correspond to the same signal. SNPs associated to BMI reached 80% of statistical power, whereas SNPs associated to %BF did not. Locus zoom plots of variants associated to BMI are shown in Figure S3.
Genes associated to BMI were enriched in drug catabolism, terpenoids, and ceramide metabolism, while those associated to %BF were enriched in transcription processes: regulation of mRNA and protein export from nucleus and ribonucleoprotein complex localization. The top five enriched terms are shown in Table 3.

4. Discussion

Genome-wide significance (p ≤ 5.0 × 10⁻⁸) and 80% of statistical power was reached for associations of three loci in two genes (CERS3 and CYP2E1) to BMI. Also, 11 loci in six genes (ANKS1B, ARNTL2, KCNS3, LMNB1, SRGAP3, TRPC7) reached genome-wide significance for associations to %BF, though not 80% of statistical power.
In this GWAS of childhood BMI and %BF conducted in 828 children (423 boys, 405 girls) aged from three to 16 years old, we found two loci in two genes associated to BMI, and 11 loci in or near six genes associated to %BF which reached genome-wide significance (Table 2). Three additional SNPs in genes PCDH15 and CERS3 were associated to BMI, and six additional SNPs in genes ENAM, MARCH3, PHF20L1, SLC6A1, TRPC7, and ZC3H3 were associated to %BF at 5.0 × 10⁻⁸p-value < 1.0 × 10⁻⁷ significance level and passed Bonferroni correction (Table 2). Overall, variants in a single gene showed high LD, indicating they correspond to the same signal. All loci associated to %BF did not reach 80% of statistical power; thus, caution is needed to evaluate findings related to %BF.
Neither the loci, nor the genes showing significant associations were previously reported as related to childhood BMI, %BF or obesity in Europeans. Mexico City, considered part of Central Mexico, has higher Amerindian ancestry than northern and western Mexico, [25]. In agreement with previous studies, on average, more than half of Mexican ancestry from Central Mexicans is Amerindian (mean AMA = 57% in this study) [26,27]. Ancestry differences could be explained, at least in part, by differences in genetic markers predisposing high childhood BMI and %BF values between Mexican and European children. Our results also agree with the findings of partial loci transferability from European adults to Mexican children; those studies found that 25 out of over 150 loci associated to BMI/obesity in Europeans were also associated in Mexican children [9,10,11,12,13,14].
Regarding genetic predisposition to high BMI and %BF values, and in line with previous results in adult Mexicans [28], different loci were associated with both phenotypes. This result may have more than one non-exclusive explanation. Firstly, even if the same several loci were involved in the genetic predisposition to high BMI and %BF levels, these loci could have different magnitude effect on each phenotype. Thus, the effect in both phenotypes could be detected by increasing the statistical power with a larger sample size [29]. This explanation could account for not finding replicates in other populations. Secondly, BMI and %BF are based on different anthropometric measurements and, in Mexican children, they reflect highly different obesity prevalences [3]. In particular, BMI by definition is a relationship between height and weight, but does not distinguish between fat and lean mass tissue [30]. A different feature of both phenotypes; BMI and %BF could be led by a different biological process, which was suggested by enrichment analysis (Table 3). In this regard, the genes associated with BMI (CERS3, PCDH15, CYP2E1) are involved in lipid and glucose metabolism, while the biological processes related to body fat metabolism of the remaining loci associated to %BF in genes KCNS3, SRGAP3, SLC6A1, ENAM, LMNB1, MARCH3, TRPC7, PHF20L1, ZC3H3, ANKS1B (Table 2) are not known. They were enriched in the transcription process (Table 3) in which small but important signals of regulation may drive cellular machines and trigger changes in metabolic genes but their involvement in fat metabolism remains uncertain [31]. In addition, loci associated to %BF did not reach the acceptable threshold of 80% of statistical power; thus, below we will focus our discussion on BMI associated SNPs.
The ceramide synthase 3 gene (CERS3) encodes for the ceramide synthase 3 protein; it is one of the six synthetases involved in de novo formation of ceramides [32,33]. Ceramides are the building blocks of sphingolipids, and their accumulation in tissues is involved in disorders associated with obesity. Although the cause is not fully understood, clinical studies have shown a positive correlation between plasma and tissue ceramide levels and insulin resistance [34]. In addition, after bariatric surgery in subjects with obesity, the decrease in adipose tissue is accompanied by a reduction in CERS3 products [35]. CERS3 is also found in immune system pathways. Moreover, the low-grade inflammation associated with obesity causes the infiltration of TNFα into adipocytes. The increase in this pro-inflammatory cytokine plus the increase in free fatty acids trigger de novo synthesis of ceramides [34].
The protocadherin-related 15 gene (PCDH15) is a member of the cadherin superfamily. Family members encode integral membrane proteins that mediate calcium-dependent cell-cell adhesion [36] Variants of this gene have been associated with triglycerides, total cholesterol, and apolipoprotein B levels in families with hyperlipidemia, suggesting their association with lipid abnormalities [37]. As well, other variants of this gene were associated with cardiovascular traits in Europeans [38] and with the carotid intima media thickness in Chinese population [39].
The cytochrome P450 family 2 subfamily E member 1 gene (CYP2E1) encodes the cytochrome P450 family 2 subfamily E member 1 enzymes; it is a potent protein of the oxidative system. It is involved in several preclinical and clinical lipid metabolism features. The CYP2E knockout mice showed protection against high-fat diet-induced obesity and insulin resistance, and also showed improvement in glucose homeostasis in vivo [40]. Regarding clinical studies, it was suggested that obesity increases CYP2E1 activity in children [41].
This study has strengths and limitations that should be mentioned. The main limitation is sample size; 828 individuals is low in order to detect significant associations with low effects (β < 5 with an allele frequency of 0.02). The major strength is that the GWAS was conducted using intermediate phenotypes, BMI and %BF, widely employed for obesity classification, which gives us further insight in the etiology of the disease.

5. Conclusions

In conclusion, we identified two loci in two genes (CERS3 and CYP2E1) associated with childhood BMI which reached genome-wide significance and 80% of statistical power. These SNPs were not previously reported in population with European ancestry, probably due to ancestry differences or differences in magnitude effect of loci between Mexicans and Europeans. Our results highlight the mismatch of the genetic background predisposing high childhood BMI and %BF values. The BMI and %BF-related loci may reflect differences in different magnitude effect of associations, and/or different biological processes underlying these phenotypes. To our best knowledge, this is the first GWAS of BMI and %BF in Mexican children. Future efforts should include further replication studies to confirm the association of these potential loci to BMI and %BF in Mexican children.

Supplementary Materials

The following are available online at https://www.mdpi.com/2073-4425/10/11/945/s1, Figure S1: title Density distribution of percent body fat (%BF) and body mass index (BMI), Figure S2: title Genetic stratification of Mexican-Mestizo children from Mexico City., Figure S3: title Locus zoom plots of the GWAS after imputation with BMI.

Author Contributions

Conceptualization, M.E.R.-A. and P.C.U.; Methodology, V.C., P.C.-U.; Software, V.C.; Validation, M.E.R.-A., P.C.-U., and V.C.; Formal analysis, P.C.-U., V.C., I.d.J.A.M.; Investigation, A.S.J.-O., H.C.-H., J.S.-T., M.R.-A.; Resources, M.E.R.-A.; Data curation, V.C., P.C.-U., and I.d.J.A.-M.; Writing―original draft preparation, P.C.-U.; Writing―review and editing, P.C.-U., H.C.-H., A.S.J.-O., E.R.-A.; Visualization, J.G., E.R.A.; Supervision, J.G., M.E.R.-A.; Project administration, M.E.R.A.; Funding acquisition, M.E.R.-A.

Funding

This research was funded by ISSSTE (grant number 447.2016-E015).

Acknowledgments

The authors would like to thank Claudette Musalem-Younes, Rebeca Olivia Robles and Jessica Ariana Perez for logistic and technical support, and C. Abud for English editing.

Conflicts of Interest

The authors declare no conflict of interest.

References

  1. Ng, M.; Fleming, T.; Robinson, M.; Thomson, B.; Graetz, N.; Margono, C.; Mullany, E.C.; Biryukov, S.; Abbafati, C.; Abera, S.F.; et al. Global, regional, and national prevalence of overweight and obesity in children and adults during 1980–2013: A systematic analysis for the Global Burden of Disease Study 2013. Lancet 2014, 384, 766–781. [Google Scholar] [CrossRef]
  2. Encuesta Nacional de Salud y Nutrición de Medio Camino 2016. Inst. Nac. Salud. Pública 2016, 2016, 151. [CrossRef]
  3. Costa-Urrutia, P.; Vizuet-Gámez, A.; Ramirez-Alcántara, M.; Guillen-González, M.A.; Medina-Contreras, O.; Valdes-Moreno, M.; Musalem-Younes, C.; Solares-Tlapechco, J.; Granados, J.; Franco-Trecu, V.; et al. Obesity measured as percent body fat, relationship with body mass index, and percentile curves for Mexican pediatric population. PLoS ONE 2019, 14, e0212792. [Google Scholar] [CrossRef]
  4. Locke, A.; Kahali, B.; Berndt, S.; Justice, A.; Pers, T. Genetic studies of body mass index yield new insights for obesity biology. Nature 2015, 518, 197–206. [Google Scholar] [CrossRef] [PubMed]
  5. Day, F.R.; Loos, R.J.F. Developments in Obesity Genetics in the Era of Genome-Wide Association Studies. Lifestyle Genom 2011, 4, 222–238. [Google Scholar] [CrossRef]
  6. Bradfield, J.P.; Taal, H.R.; Timpson, N.J.; Scherag, A.; Lecoeur, C.; Warrington, N.M.; Hypponen, E.; Holst, C.; Valcarcel, B.; Thiering, E.; et al. A genome-wide association meta-analysis identifies new childhood obesity loci. Nat. Genet. 2012, 44, 526–531. [Google Scholar] [CrossRef]
  7. Felix, J.F.; Bradfield, J.P.; Monnereau, C.; van Der Valk, R.J.P.; Stergiakouli, E.; Chesi, A.; Gaillard, R.; Feenstra, B.; Thiering, E.; Kreiner-Møller, E.; et al. Genome-wide association analysis identifies three new susceptibility loci for childhood body mass index. Hum. Mol. Genet. 2016, 25, 389–403. [Google Scholar] [CrossRef]
  8. Geng, T.; Smith, C.E.; Li, C.; Huang, T. Childhood BMI and adult type 2 diabetes, coronary artery diseases, chronic kidney disease, and cardiometabolic traits: A Mendelian randomization analysis. Diabetes Care 2018, 41, 1089–1096. [Google Scholar] [CrossRef]
  9. Villalobos-Comparán, M.; Villamil-Ramírez, H.; Villarreal-Molina, T.; Larrieta-Carrasco, E.; Leon-Mimila, P.; Romero-Hidalgo, S.; Jacobo-Albavera, L.; Liceaga-Fuentes, A.E.; Campos-Pérez, F.J.; López-Contreras, B.E.; et al. PCSK1 rs6232 is associated with childhood and adult class III obesity in the Mexican population. PLoS ONE 2012, 7, e39037. [Google Scholar] [CrossRef]
  10. Mejía-Benítez, A.; Klünder-Klünder, M.; Yengo, L.; Meyre, D.; Aradillas, C.; Cruz, E.; Pérez-Luque, E.; Malacara, J.M.; Garay, M.E.; Peralta-Romero, J.; et al. Analysis of the contribution of FTO, NPC1, ENPP1, NEGR1, GNPDA2 and MC4R genes to obesity in Mexican children. BMC Med. Genet. 2013, 14, 1–6. [Google Scholar] [CrossRef]
  11. Aradillas-García, C.; Cruz, M.; Pérez-Luque, E.; Garay-Sevilla, M.E.; Malacara, J.M.R.A.; Peralta, J.; Burguete-García, A.; Alegría-Torres, J.A. Obesity is associated with the Arg389Gly ADRB1 but not with the Trp64Arg ADRB3 polymorphism in children from San Luis Potosí and León, México. J. Biomed. Res. 2017, 31, 40. [Google Scholar] [CrossRef]
  12. Abadi, A.R.K.A.N.; Jesus, J.; De Romero, P.; Gomez, J.; Peralta-romero, J.; Suarez, F.; Gomez-zamudio, J.; Burguete-Garcia, A.I.; Cruz, M.; Meyre, D. Assessing the effects of 35 European-derived BMI-associated SNPs in Mexican children: Effects of European BMI SNPs in M Assessing the Effects of 35 European-Derived BMI-Associated SNPs in Mexican Children. Obesity 2016, 24, 1989–1995. [Google Scholar] [CrossRef] [PubMed]
  13. Liu, H.Y.; Alyass, A.; Abadi, A.; Peralta-romero, J. Fine-mapping of 98 obesity loci in Mexican children. Int. J. Obes. 2018, 43, 23. [Google Scholar] [CrossRef] [PubMed]
  14. Jiménez-Osorio, A.S.; Aguilar-Lucio, A.O.; Cárdenas-Hernández, H.; Musalem-Younes, C.; Solares-Tlapechco, J.; Costa-Urrutia, P.; Medina-Contreras, O.; Granados, J.; Rodríguez-Arellano, M.E. Polymorphisms in adipokines in mexican children with obesity. Int. J. Endocrinol. 2019, 2019, 4764751. [Google Scholar] [CrossRef]
  15. Fomon, S.J.; Haschke, F.; Ziegler, E.E.; Nelson, S.E. Body composition of reference children from birth to age 10 years. Am. J. Clin. Nutr. 1982, 35, 1169–1175. [Google Scholar] [CrossRef]
  16. Purcell, S.; Neale, B.; Todd-Brown, K.; Thomas, L.; Ferreira, M.A.R.; Bender, D.; Maller, J.; Sklar, P.; de Bakker, P.I.W.; Daly, M.J.; et al. PLINK: A Tool Set for Whole-Genome Association and Population-Based Linkage Analyses. Am. J. Hum. Genet. 2007, 81, 559–575. [Google Scholar] [CrossRef]
  17. Loh, P.; Danecek, P.; Palamara, P.F.; Fuchsberger, C.; Reshef, A.; Finucane, H.K. Reference-based phasing using the Haplotype Reference Consortium panel. Nat. Genet. 2017, 48, 1443–1448. [Google Scholar] [CrossRef]
  18. Sayantan, D.; Forer, L.; Sebastian, S.; Carlo Sidore, C.; Locke, A.E.; Alan Kwong, A.; Scott, I.; Vrieze, S.J.; Chew, E.Y.; Levy, S.; et al. Next-generation genotype imputation service and methods. Nat. Genet. 2016, 48, 1284–1287. [Google Scholar] [CrossRef]
  19. Patterson, N.; Price, A.L.; Reich, D. Population structure and eigenanalysis. PLoS Genet. 2006, 2, 2074–2093. [Google Scholar] [CrossRef]
  20. Alexander, D.H.; Novembre, J.; Lange, K. Fast model-based estimation of ancestry in unrelated individuals. Genome Res. 2009, 19, 1655–1664. [Google Scholar] [CrossRef]
  21. Gauderman, W.J.; Morrison, J.M. Quanto 1.1: A Computer Program for Power and Sample Size Calculations for Genetic-Epidemiology Studies. 2006. Available online: http://hydra.usc.edu/gxe (accessed on 15 September 2019).
  22. Kuleshov, M.V.; Jones, M.R.; Rouillard, A.D.; Fernandez, N.F.; Duan, Q.; Wang, Z.; Koplev, S.; Jenkins, S.L.; Jagodnik, K.M.; Lachmann, A.; et al. Enrichr: A comprehensive gene set enrichment analysis web server 2016 update. Nucleic Acids Res. 2016, 44, W90–W97. [Google Scholar] [CrossRef] [PubMed]
  23. Silva-Zolezzi, I.; Hidalgo-Miranda, A.; Estrada-Gil, J.; Fernandez-Lopez, J.C.; Uribe-Figueroa, L.; Contreras, A.V.; Balam-Ortiz, E.; Del Bosque-Plata, L.; Velazquez-Fernandez, D.; Lara, C.; et al. Analysis of genomic diversity in Mexican Mestizo populations to develop genomic medicine in Mexico. Proc. Natl. Acad. Sci. USA 2009, 106, 8611–8616. [Google Scholar] [CrossRef] [PubMed]
  24. Moreno-Estrada, A.; Gignoux, C.R.; Fernández-López, J.C.; Zakharia, F.; Sikora, M.; Contreras, A.V.; Acuña-Alonzo, V.; Sandoval, K.; Eng, C.; Romero-Hidalgo, S.; et al. The genetics of Mexico recapitulates Native American substructure and affects biomedical traits. Science 2014, 344, 1280–1285. [Google Scholar] [CrossRef] [PubMed]
  25. Rangel-Villalobos, H.; Muñoz-Valle, J.F.; González-Martín, A.; Gorostiza, A.; Magaña, M.T.; Páez-Riberos, L.A. Genetic admixture, relatedness, and structure patterns among Mexican populations revealed by the Y-chromosome. Am. J. Phys. Anthropol. 2008, 135, 448–461. [Google Scholar] [CrossRef] [PubMed]
  26. Martinez-Marignac, V.L.; Valladares, A.; Cameron, E.; Chan, A.; Perera, A.; Globus-Goldberg, R.; Shriver, M.D.; Wacher, N.; Kumate, J.; McKeigue, P.; et al. Admixture in Mexico City: Implications for admixture mapping of Type 2 diabetes genetic risk factors. Hum. Genet. 2007, 120, 807–819. [Google Scholar] [CrossRef] [PubMed]
  27. Barquera, R.; Martínez-Álvarez, J.C.; Hernández-Zaragoza, D.I.; Bravo-Acevedo, A.; Juárez-Nicolás, F.; Arriaga-Perea, A.J.; Vega-Martínez, M.D.R.; Ortega-Yáñez, A.; Benítez-Arvizu, G.; Arrieta-Bolaños, E.; et al. Genetic diversity of HLA system in six populations from Mexico City Metropolitan Area, Mexico: Mexico City North, Mexico City South, Mexico City East, Mexico City West, Mexico City Center and rural Mexico City. Hum. Immunol. 2019, 5, 1111. [Google Scholar] [CrossRef] [PubMed]
  28. Costa-Urrutia, P.; Abud, C.; Franco-Trecu, V.; Colistro, V.; Rodríguez-Arellano, M.E.; Vázquez-Pérez, J.; Granados, J.; Seelaender, M. Genetic Obesity Risk and Attenuation Effect of Physical Fitness in Mexican-Mestizo Population: A Case-Control Study. Ann. Hum. Genet. 2017, 81, 106–116. [Google Scholar] [CrossRef]
  29. Lu, Y.; Loos, R.J.F. Obesity genomics: Assessing the transferability of susceptibility loci across diverse populations. Genome Med. 2013, 5, 55. [Google Scholar] [CrossRef]
  30. Dulloo, A.G.; Jacquet, J.; Solinas, G.; Montani, J.P.; Schutz, Y. Body composition phenotypes in pathways to obesity and the metabolic syndrome. Int. J. Obes. 2010, 34, S4–S17. [Google Scholar] [CrossRef]
  31. Azeloglu, E.U.; Iyengar, R. Signaling networks: Information flow, computation, and decision making. Cold Spring Harb. Perspect. Biol. 2015, 7, 1–13. [Google Scholar] [CrossRef]
  32. Larsen, P.J.; Tennagels, N. On ceramides, other sphingolipids and impaired glucose homeostasis. Mol. Metab. 2014, 3, 252–260. [Google Scholar] [CrossRef] [PubMed]
  33. Levy, M.; Futerman, A.H. Mammalian ceramide synthases. IUBMB Life 2010, 62, 347–356. [Google Scholar] [CrossRef] [PubMed]
  34. Fucho, R.; Casals, Ń.; Serra, D.; Herrero, L. Ceramides and mitochondrial fatty acid oxidation in obesity. FASEB J. 2017, 31, 1263–1272. [Google Scholar] [CrossRef] [PubMed] [Green Version]
  35. Huang, H.; Kasumov, T.; Gatmaitan, P.; Heneghan, H.M.; Kashyap, S.R.; Schauer, P.R.; Brethauer, S.A.; Kirwan, J.P. Gastric bypass surgery reduces plasma ceramide subspecies and improves insulin sensitivity in severely obese patients. Obesity 2011, 19, 2235–2240. [Google Scholar] [CrossRef] [Green Version]
  36. Hulpiau, P.; van Roy, F. Molecular evolution of the cadherin superfamily. Int. J. Biochem. Cell Biol. 2009, 41, 349–369. [Google Scholar] [CrossRef]
  37. Huertas-Vazquez, A.; Plaisier, C.L.; Geng, R.; Haas, B.E.; Lee, J.; Greevenbroek, M.M.; Pajukanta, P.; Taskinen, M.R.; Alagramam, K.N.; Pajukanta, P.; et al. A nonsynonymous SNP within PCDH15 is associated with lipid traits in familial combined hyperlipidemia. Hum. Genet. 2010, 127, 83–89. [Google Scholar] [CrossRef] [Green Version]
  38. Nazarenko, M.S.; Sleptcov, A.A.; Lebedev, I.N.; Skryabin, N.A.; Markov, A.V.; Golubenko, M.V.; Koroleva, I.A.; Kazancev, A.N.; Barbarash, O.L.; Puzyrev, V.P.; et al. Genomic structural variations for cardiovascular and metabolic comorbidity. Sci. Rep. 2017, 7, 41268. [Google Scholar] [CrossRef] [Green Version]
  39. Xie, G.; Myint, P.K.; Voora, D.; Laskowitz, D.T.; Shi, P.; Ren, F.; Wang, H.; Yang, Y.; Huo, Y.; Gao, W.; et al. Genome-wide association study on progression of carotid artery intima media thickness over 10 years in a Chinese cohort. Atherosclerosis 2015, 243, 30–37. [Google Scholar] [CrossRef]
  40. Zong, H.; Armoni, M.; Harel, C.; Karnieli, E.; Pessin, J.E. Cytochrome P-450 CYP2E1 knockout mice are protected against high-fat diet-induced obesity and insulin resistance. Am. J. 2012, 302, 532–539. [Google Scholar] [CrossRef] [Green Version]
  41. Gade, C.; Dalhoff, K.; Petersen, T.S.; Riis, T.; Schmeltz, C.; Chabanova, E.; Christensen, H.R.; Mikus, G.; Burhenne, J.; Holm, J.C.; et al. Higher chlorzoxazone clearance in obese children compared with nonobese peers. Br. J. Clin. Pharmacol. 2018, 84, 1738–1747. [Google Scholar] [CrossRef] [Green Version]
Figure 1. Manhattan plot of results of the genome-wide association study before imputation of (a) body mass index; and (b) percent body fat in children from Mexico City. Chromosomes are shown on the x-axis, and the −log10 of the p-value on the y-axis. The red line represents the genome-wide significance cut off of 5.0 × 10⁻⁸. The blue line shows false discovery rate significance cut off.
Genes 10 00945 g001
Table 1. Number (N), mean and standard deviation (SD) of body mass index (BMI) and percent body fat (%BF) by sex and age.
AgeNBMI (SD)%BF (SD)
Girls
32216.6 (1.7)0.30 (0.13)
42815.9 (1.4)0.26 (0.14)
53017.3 (3.4)0.23 (0.15)
63016.3 (1.7)0.23 (0.04)
73917.8 (3.6)0.25 (0.13)
82617.3 (3.0)0.26 (0.08)
92419.2 (2.6)0.32 (0.07)
103020.4 (3.8)0.32 (0.10)
113020.9 (3.9)0.31(0.11)
122822.0 (4.7)0.32 (0.09)
133422.1 (3.9)0.33 (0.09)
143723.8 (4.8)0.37 (0.13)
152323.0 (4.6)0.33 (0.08)
162425.7 (6.1)0.33 (0.12)
Boys
32816.1 (2.2)0.24 (0.16)
42516.6 (2.9)0.22 (0.13)
52816.5 (2.6)0.18 (0.13)
62816.3 (2.0)0.24 (0.11)
72217.8 (2.3)0.27 (0.12)
84018.3 (3.1)0.26 (0.10)
94620.4 (4.2)0.31(0.10)
102922.6 (5.3)0.34 (0.10)
113221.6 (4.5)0.30 (0.11)
124121.2 (4.9)0.28 (0.10)
132822.3 (4.1)0.27 (0.10)
143621.9 (4.9)0.24 (0.12)
152023.6 (4.1)0.26 (0.10)
162025.5 (4.6)0.27 (0.09)
Table 2. Significant loci associated with body mass index (BMI) and percent body fat (%BF) from the genome-wide association study after imputation analysis for Mexico City children. Reference SNP (rs), Ensemble identification (En Id), Chromosome (Chr), alleles (As), minor allele (MA), minor allele frequency (MAF), position (P) or function (F) in the gene (gene P/F), significance association level unadjusted p-value (Punadj), adjusted by Bonferroni (PBonf). Genic upstream transcript variant (GUTV), genic downstream transcript variant (GDTV) and mean linkage disequilibrium among variants in the same chr (R2).
GeneDescriptionrsEn IdChrAsMAMAFP/GβPunadjPBonfR2
BMI associated
CERS3Ceramide synthase 3 rs72757283ENSG0000015422715A/CC0.02intron3.42.18 × 10−80.0050.95
CERS3 rs75661572ENSG0000015422715T/CC0.16intron1.38.97 × 10−8*0.020
CYP2E1Cytochrome P450 family 2 subfamily E member 1 rs72866768ENSG0000013064910A/GG0.02intron5.13.39 × 10−80.014
PCDH15Protocadherin related 15rs2680328ENSG0000015027510G/AG0.16GUTV1.45.86 × 10−8*0.0200.97
PCDH15 rs2799617ENSG0000015027510G/AG0.16GUTV1.75.86 × 10−8*0.024
%BF associated
ANKS1BAnkyrin repeat and sterile alpha motif domain containing 1Brs116928965ENSG0000018504612G/AA0.1303’ UTR0.23.27 × 10−80.0120.60
ARNTL2Aryl hydrocarbon receptor nuclear translocator like 2rs111392859ENSG0000002915312G/AA0.012intron0.23.61 × 10−80.014
ENAMEnamelin rs115766831ENSG000001324644T/AA0.0143’ UTR0.15.25 × 10−8*0.031
KCNS3Potassium voltage-gated channel modifier subfamily S member 3rs67939090ENSG000001707452A/TT0.012intron0.27.31 × 10−114.89 × 10−50.90
KCNS3 rs2198300ENSG000001707452A/GG0.012intron0.22.49 × 10−111.66 × 10⁻⁵
KCNS3 rs111366249ENSG000001707452G/AA0.012intron0.23.67 × 10−122.45 × 10⁻⁶
KCNS3 rs34364120ENSG000001707452C/AA0.012intron0.23.67 × 10−122.45 × 10⁻⁶
KCNS3 rs13002427ENSG000001707452A/TT0.012intron0.21.26 × 10−118.40 × 10⁻⁶
LMNB1Lamin B1 rs140680370ENSG000001133685G/AA0.012intron0.21.40 × 10−80.0070.57
MARCH3Membrane associated ring-CH-type finger 3rs77016412ENSG000001739265G/AA0.011intron0.29.17 × 10−8*0.046
PHF20L1Phd finger protein 20 like 1 rs78211770ENSG000001292928A/GG0.050intron0.28.48 × 10−90.0031
ZC3H3Zinc finger CCCH-type containing 3rs35110652ENSG000000141648C/TC0.015GDTV0.15.29 × 0−8*0.023
SLC6A1Solute carrier family 6 member 1rs58053962ENSG000001571033G/CC0.015intron0.26.64 × 10−8*0.038
SRGAP3Slit-robo Rho GTPase activating protein 3 rs544274585ENSG000001962203C/AA0.015intron0.22.31 × 10−80.0133
TRPC7Transient receptor potential cation channel subfamily C member 7 rs3756699ENSG000000690185A/GG0.012intron0.13.53 × 10−80.01780.99
TRPC7 rs55996753ENSG000000690185G/AA0.050intron0.13.53 × 10−80.0178
TRPC7 rs34999969ENSG000002792405C/AA0.050near0.17.18 × 10−8*0.036
*refers to loci with 5.0 × 10⁻⁸p-value < 1.0 × 10⁻⁷ and passing Bonferroni correction.
Table 3. The top 10 significant enrichment terms in gene ontology (GO) biological processes of the genes associated with body mass index (BMI) and percent body fat (%BF) found in the genome-wide association study. Significance association level unadjusted p-value (P).
Biological ProcessP
BMI
Monoterpenoid metabolic process (GO:0016098)9.0 × 10⁻⁴
Equilibrioception (GO:0050957)9.0 × 10⁻⁴
Terpenoid metabolic process (GO:0006721)1.0 × 10⁻³
Benzene-containing compound metabolic process (GO:0042537)1.2 × 10⁻³
Neuromuscular process controlling balance (GO:0050885)2.1 × 10⁻³
Epoxygenase P450 pathway (GO:0019373)3.1 × 10⁻³
Exogenous drug catabolic process (GO:0042738)3.4 × 10⁻³
Drug catabolic process (GO:0042737)3.7 × 10⁻³
Ceramide biosynthetic process (GO:0046513)4.9 × 10⁻³
Ceramide metabolic process (GO:0006672)6.4 × 10⁻³
%BF
Regulation of mRNA export from nucleus (GO:0010793)3.3 × 10⁻³
Regulation of ribonucleoprotein complex localization (GO:2000197)3.3 × 10⁻³
Manganese ion transport (GO:0006828)4.9 × 10⁻³
Positive regulation of circadian rhythm (GO:0042753)5.5 × 10⁻³
Poly(A) + mRNA export from nucleus (GO:0016973)7.1 × 10⁻³
Regulation of RNA export from nucleus (GO:0046831)8.2 × 10⁻³
mRNA polyadenylation (GO:0006378)0.02
Transition metal ion transport (GO:0000041)0.02
RNA polyadenylation (GO:0043631)0.02
Regulation of protein export from nucleus (GO:0046825)0.02

