Genome-Wide Association Analyses of Equine Metabolic Syndrome Phenotypes in Welsh Ponies and Morgan Horses

 ,
, 
Abstract
1. Introduction
2. Materials and Methods
2.1. Samples
2.2. Genotype Data
2.3. Genome-Wide Association Analyses (GWA)
2.4. Meta-analysis
2.5. Prioritization of GWA Regions and Identification of Positional Candidate Genes
2.5.1. Fixed-Size Regions
2.5.2. LD-Bound Regions
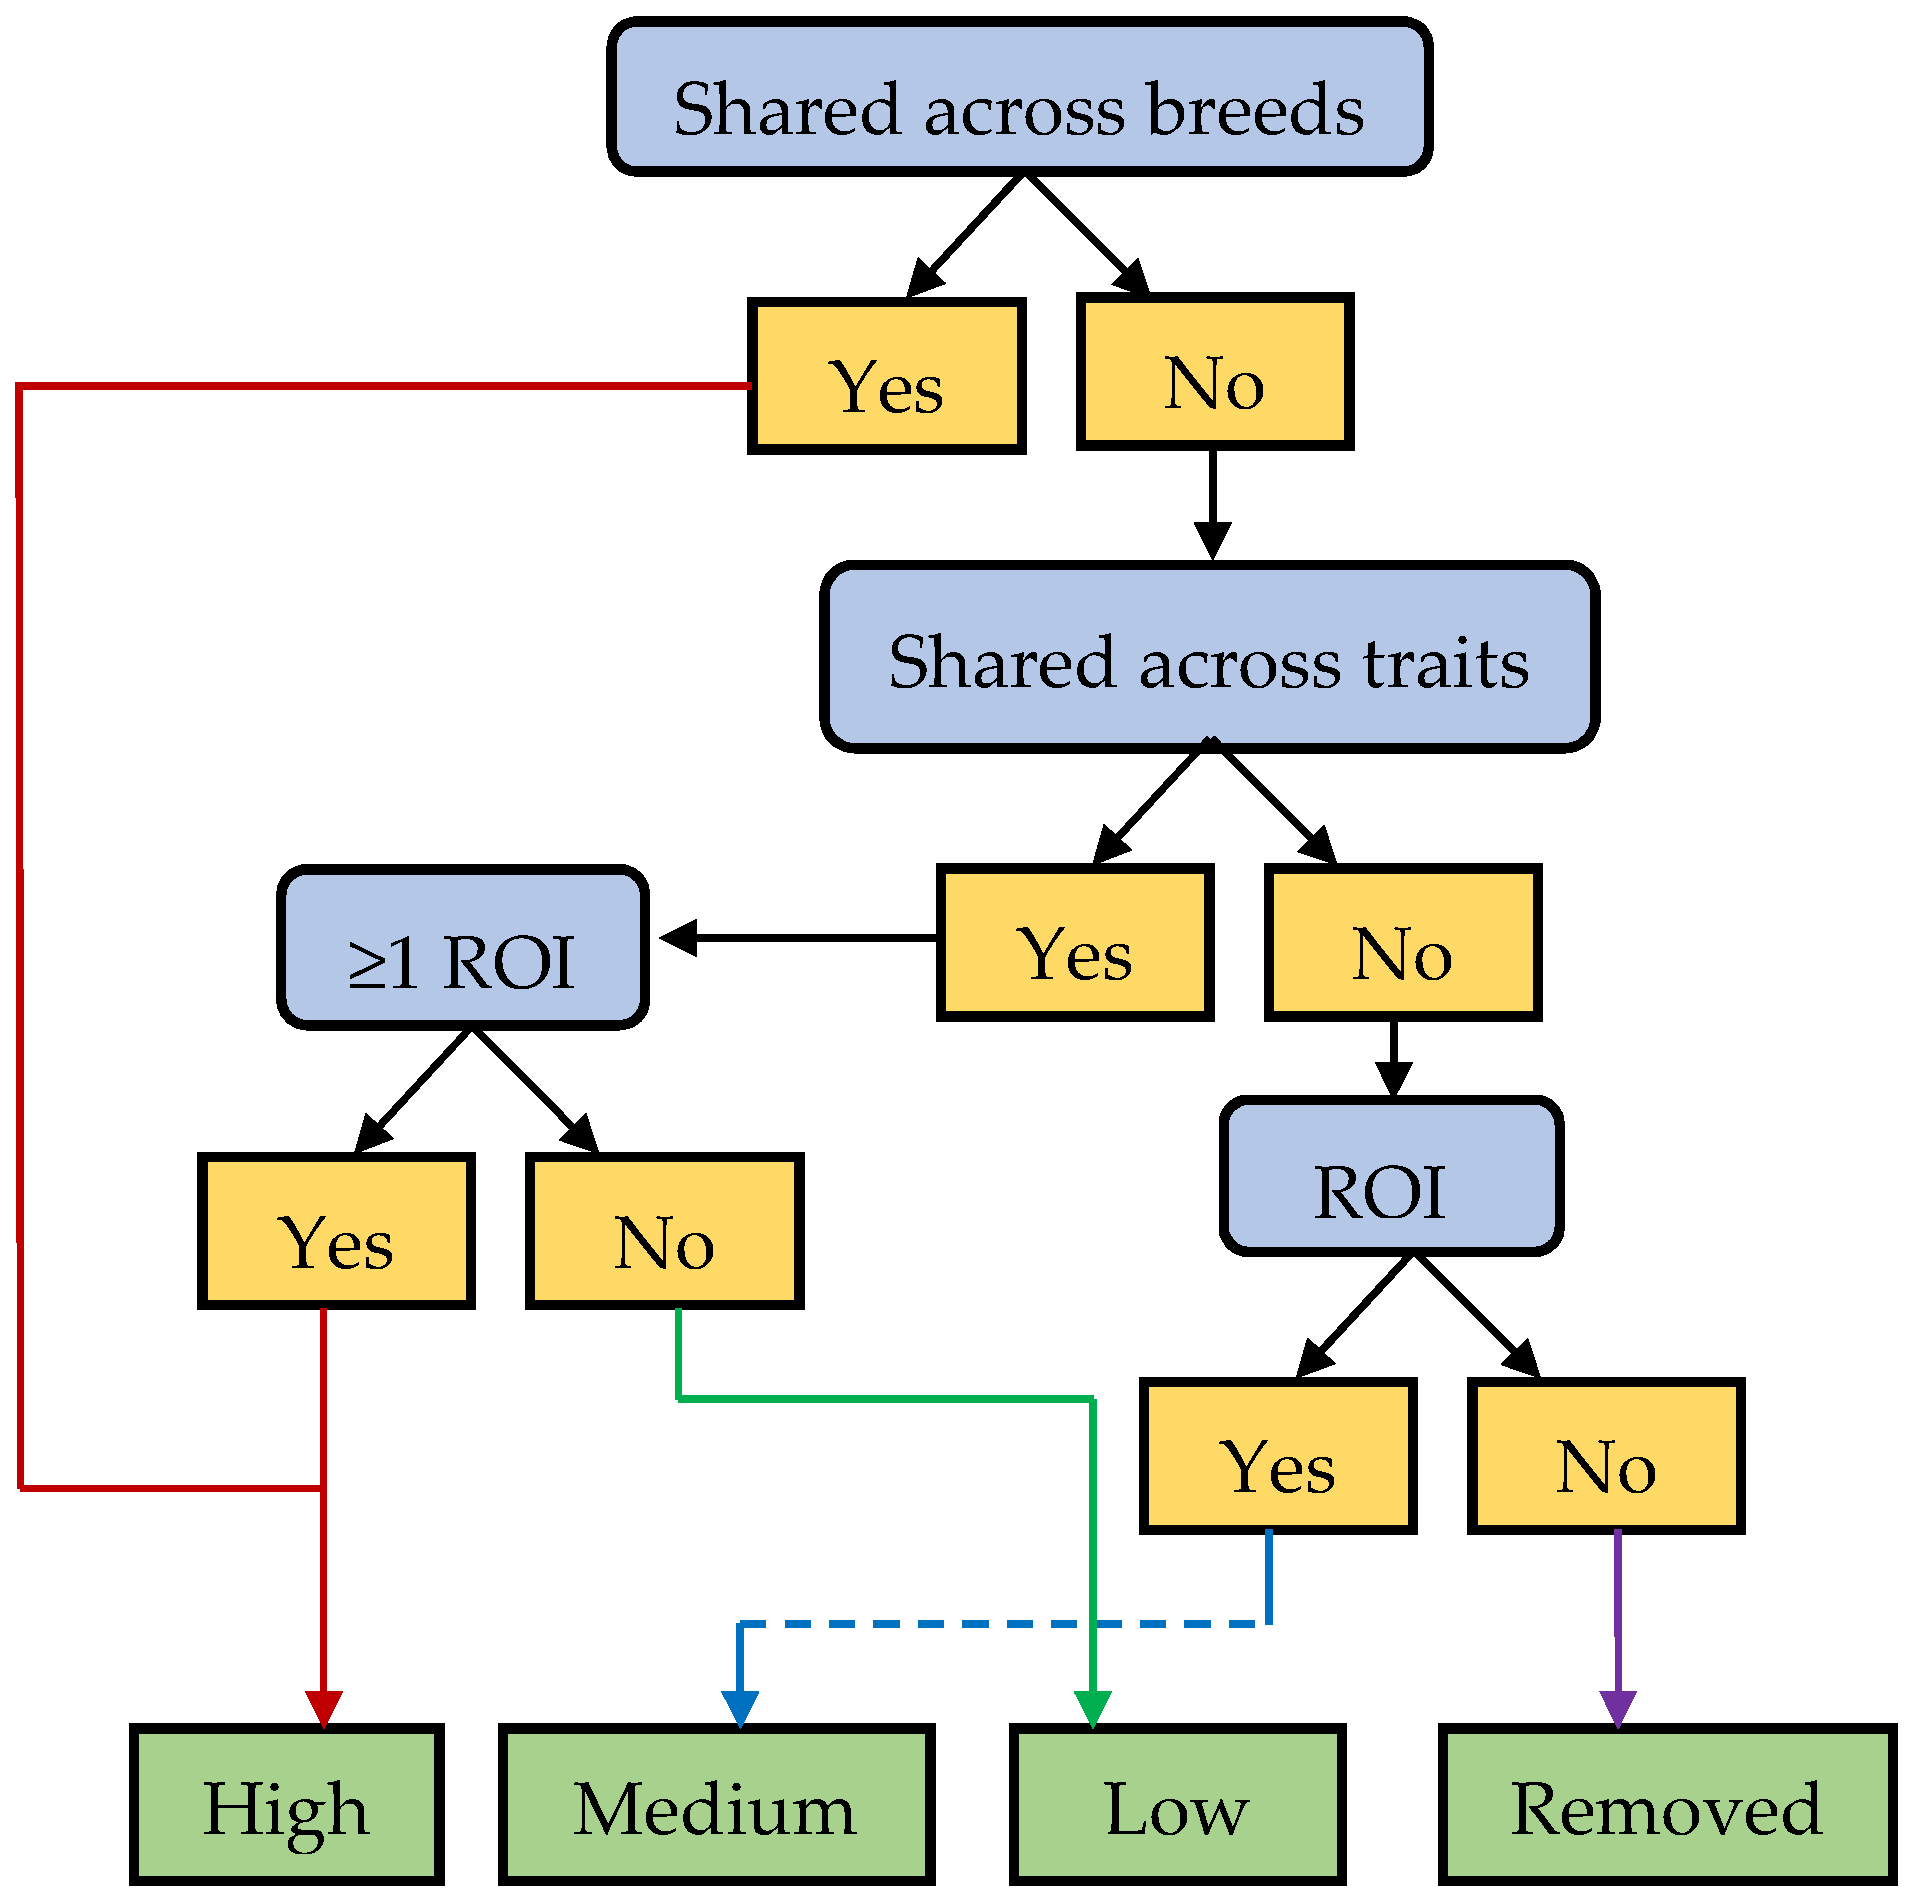
2.5.3. Prioritization
- High priority: Region was identified as an MA-ROI or it was shared across traits with at least one region being considered an ROI.
- Medium priority: Region was identified as an ROI in at least one GWA cohort.
- Low priority: Region was shared across traits, but no regions met the criteria to be considered an ROI.
- If a region met the criteria for more than one category (for example a region identified as a MA-ROI and was also shared across traits but not an ROI) then the region was assigned the higher priority level.
2.5.4. Identification of Positional Candidate Genes and Functional Enrichment Analysis
3. Results
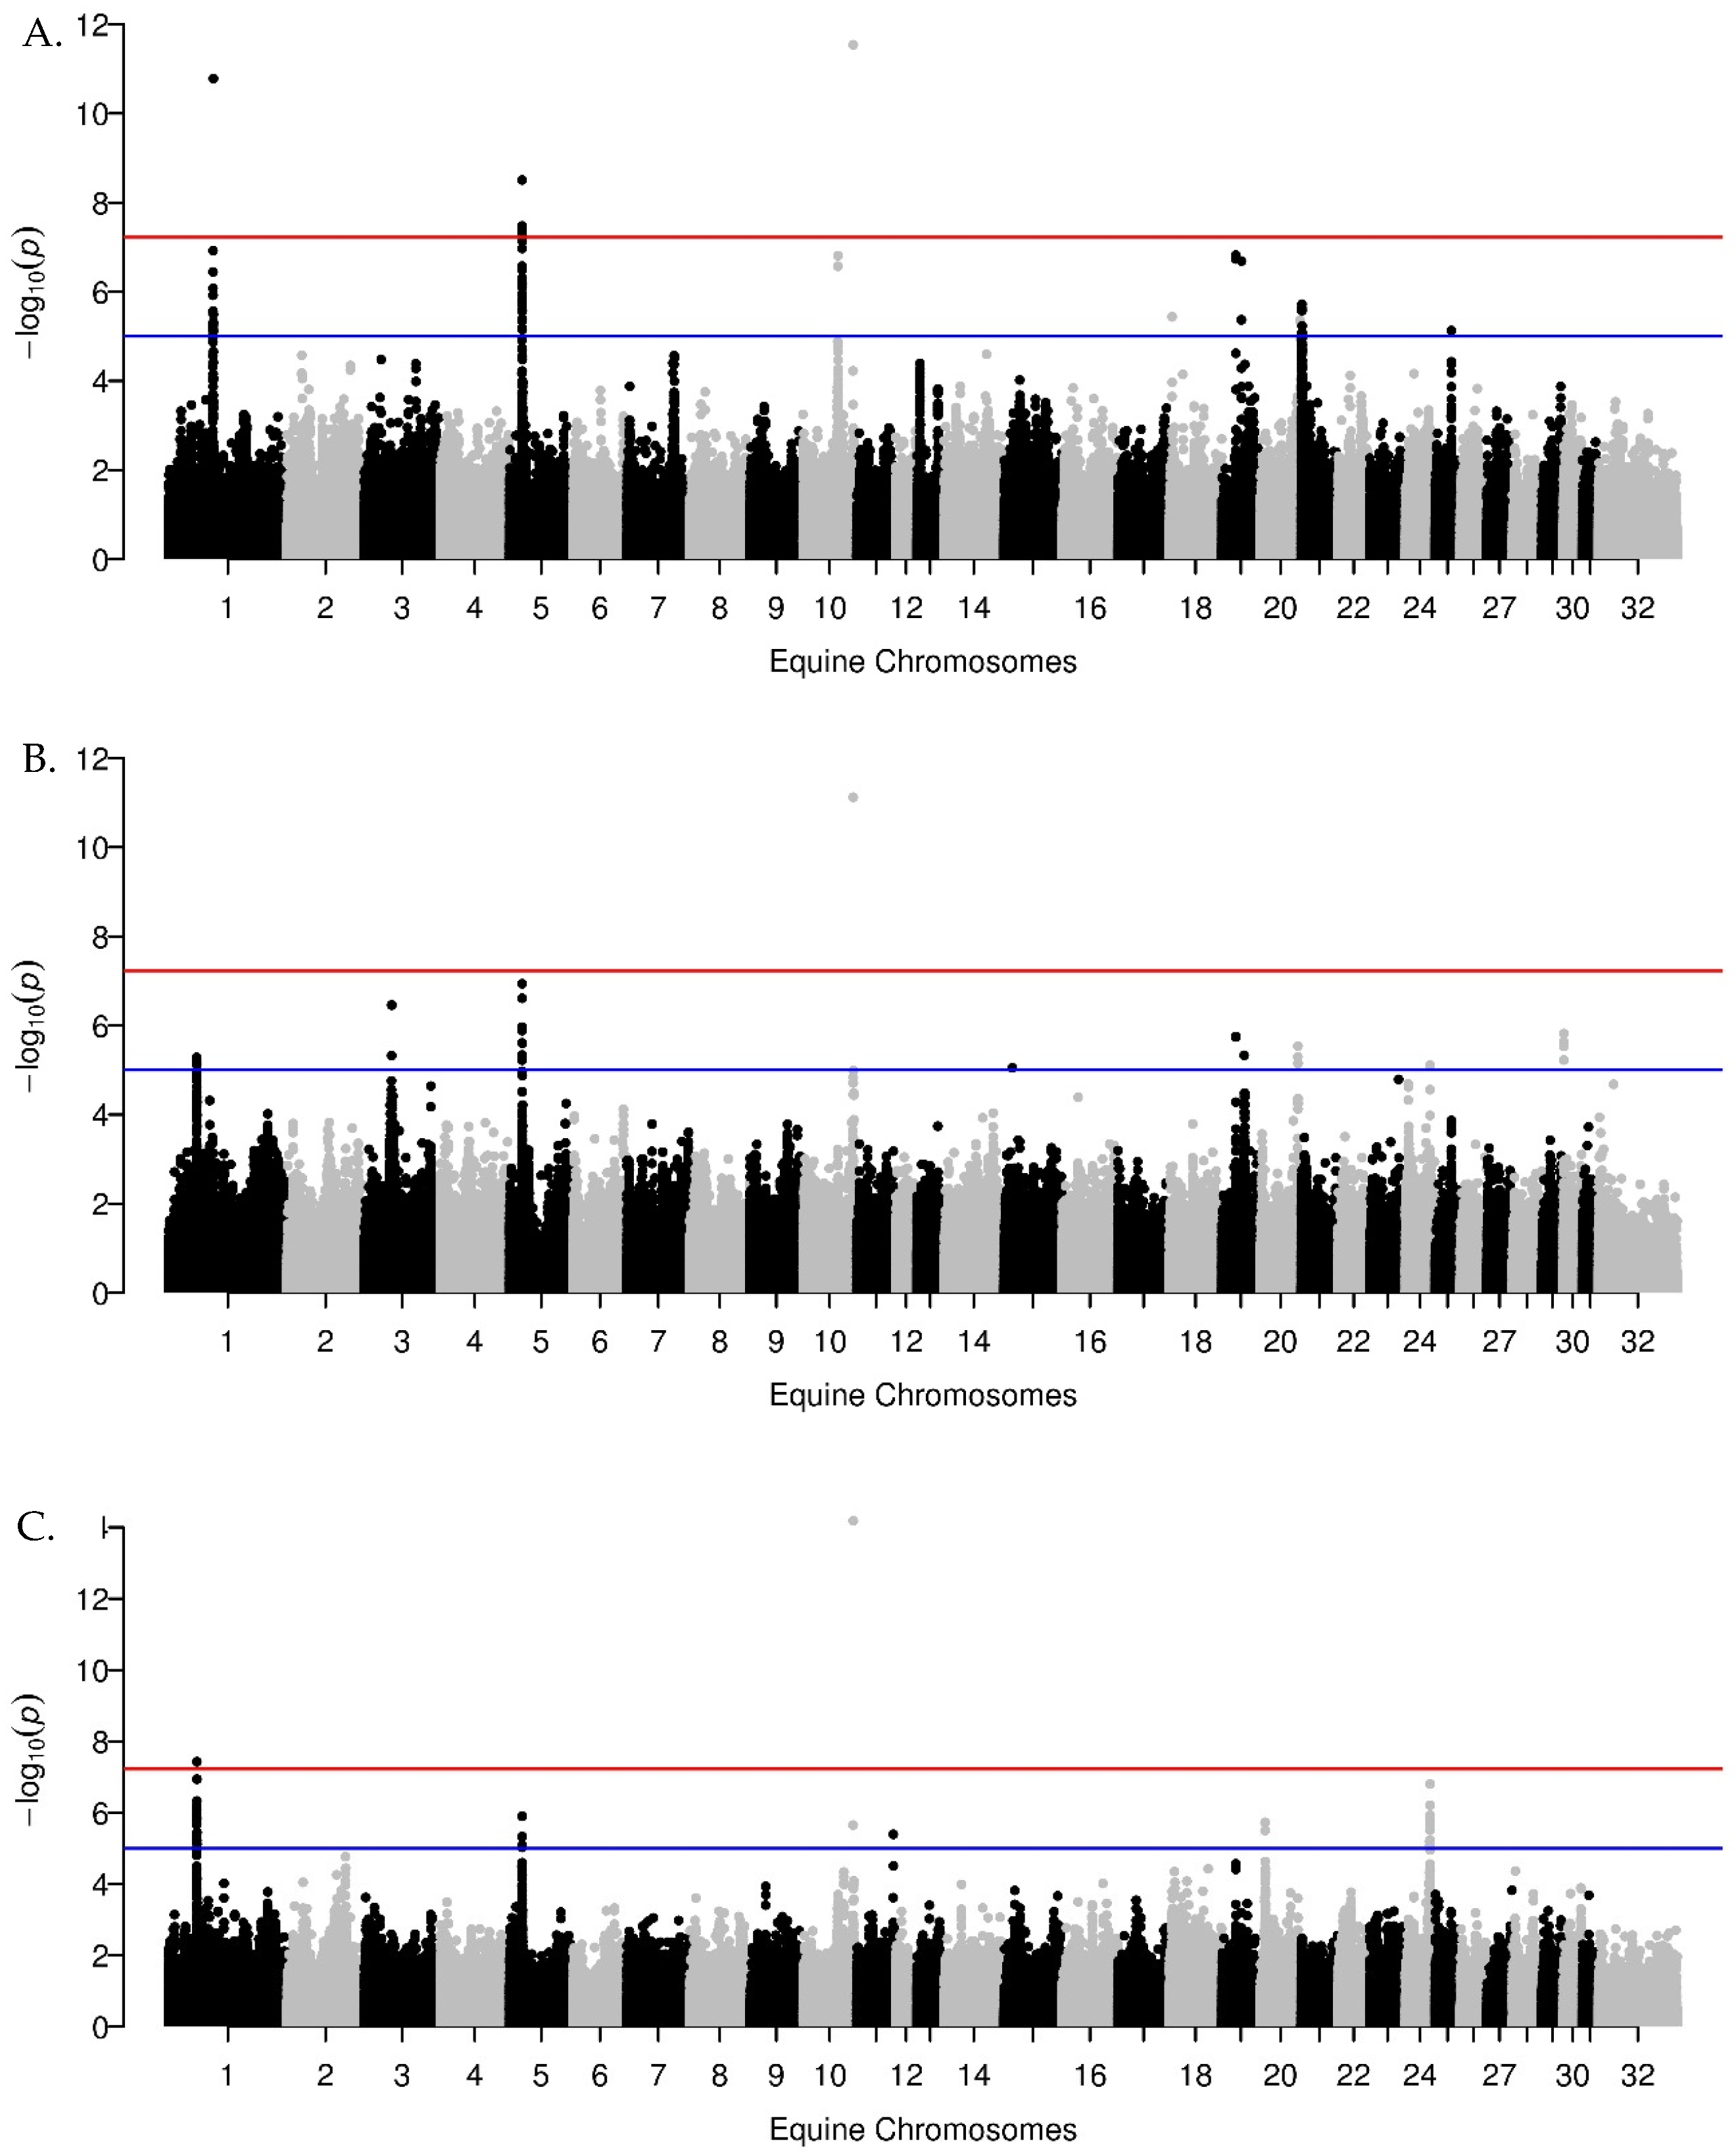
3.1. GWA Results
3.2. Shared Regions Across Welsh Ponies and Morgan Horses and Across Traits
3.3. Prioritization of GWA Results and Identification of Positional Candidate Genes Based on Fixed-Size Regions in Welsh Ponies
3.4. Prioritization of GWA Results and Identification of Positional Candidate Genes Based on Fixed-Size Regions in Morgan Horses
3.5. Prioritization of LD-Bound GWA Regions, Identification of Positional Candidate Genes, and Network Analysis in Welsh Ponies
3.6. Prioritization of LD-Bound GWA Regions, Identification of Positional Candidate Genes, and Network Analysis in Morgan Horses
4. Discussion
5. Conclusions
Supplementary Materials
Author Contributions
Funding
Acknowledgments
Conflicts of Interest
Appendix A
Appendix A.1. Welsh Pony Population Structure

Appendix A.2. GWA Results
Appendix A.3. Prioritization of GWA Results and Identification of Positional Candidate Genes Based on Fixed-Size Regions in Welsh Ponies
Appendix A.4. Prioritization of LD-Bound GWA Regions, Identification of Positional Candidate Genes, and Network Analysis in Welsh Ponies

Appendix B
Appendix B.1. Description of the Mixed Liner Model Used for Genome-Wide Association Analyses
Appendix B.2. Fixed and Random Effects

| 10 M Iterations Seeds 1–10 | 10 M Iterations Seeds 11–20 | 20 M Iterations Seeds 1–10 | 30 M Iterations Seeds 1–10 | |||||
|---|---|---|---|---|---|---|---|---|
| CHR | Sugg | Sign | Sugg | Sign | Sugg | Sign | Sugg | Sign |
| 1 | 2 | 0 | NA | NA | NA | NA | NA | NA |
| 1 | 1 | 0 | NA | NA | 1 | 0 | 4 | 0 |
| 2 | 38 | 27 | 5 | 1 | 32 | 2 | 5 | 1 |
| 3 | NA | NA | NA | NA | 1 | NA | ||
| 4 | 54 | 4 | 25 | 2 | 3 | 0 | 5 | 2 |
| 6 | 68 | 4 | 8 | 1 | 11 | 2 | 11 | 2 |
| 7 | 14 | 0 | 10 | 0 | 5 | 0 | 8 | 0 |
| 8 | 6 | 0 | NA | NA | NA | NA | NA | NA |
| 9 | NA | NA | 2 | 0 | NA | NA | NA | NA |
| 14 | NA | NA | NA | NA | 1 | 0 | NA | NA |
| 15 | 6 | 1 | 5 | 1 | 5 | 2 | 12 | 1 |
| 16 | NA | NA | NA | NA | 2 | 0 | NA | NA |
| 18 | NA | NA | 1 | 0 | NA | NA | NA | NA |
| 19 | NA | NA | NA | NA | NA | NA | 3 | 0 |
| 20 | NA | NA | NA | NA | NA | NA | 1 | 0 |
| 22 | NA | NA | NA | NA | 4 | 0 | NA | NA |
| 23 | NA | NA | 11 | 0 | NA | NA | NA | NA |
| 24 | NA | NA | 4 | 1 | 16 | 0 | NA | NA |
References
- Durham, A.E.; Frank, N. ECEIM consensus statement on equine metabolic syndrome. J. Vet. Intern. Med. 2019, 33, 335–349. [Google Scholar] [CrossRef] [PubMed]
- Orsini, J.A.; Parsons, C.S.; Capewell, L.; Smith, G. Prognostic indicators of poor outcome in horses with laminitis at a tertiary care hospital. Can. Vet. J. 2010, 51, 623–628. [Google Scholar] [PubMed]
- Treiber, K.H.; Kronfeld, D.S.; Hess, T.M.; Byrd, B.M.; Splan, R.K.; Staniar, W.B. Evaluation of genetic and metabolic predispositions and nutritional risk factors for pasture-associated laminitis in ponies. J. Am. Vet. Med. Assoc. 2006, 228, 1538–1545. [Google Scholar] [CrossRef] [PubMed]
- Shi, H.; Kichaev, G.; Pasaniuc, B. Contrasting the Genetic Architecture of 30 Complex Traits from Summary Association Data. Am. J. Hum. Genet. 2016, 99, 139–153. [Google Scholar] [CrossRef]
- Norton, E.M.; Schultz, N.E.; Rendahl, A.K.; McFarlane, D.; Geor, R.J.; Mickelson, J.R.; McCue, M.E. Heritability of metabolic traits associated with equine metabolic syndrome in Welsh ponies and Morgan horses. Equine Vet. J. 2019, 51, 475–480. [Google Scholar] [CrossRef]
- Kissebah, A.H.; Sonnenberg, G.E.; Myklebust, J.; Goldstein, M.; Broman, K.; James, R.G.; Marks, J.A.; Krakower, G.R.; Jacob, H.J.; Weber, J.; et al. Quantitative trait loci on chromosomes 3 and 17 influence phenotypes of the metabolic syndrome. Proc. Natl. Acad. Sci. USA 2000, 97, 14478–14483. [Google Scholar] [CrossRef]
- Fall, T.; Ingelsson, E. Genome-wide association studies of obesity and metabolic syndrome. Mol. Cell Endocrinol. 2014, 382, 740–757. [Google Scholar] [CrossRef]
- Avery, C.L.; He, Q.; North, K.E.; Ambite, J.L.; Boerwinkle, E.; Fornage, M.; Hindorff, L.A.; Kooperberg, C.; Meigs, J.B.; Pankow, J.S.; et al. A phenomics-based strategy identifies loci on APOC1, BRAP, and PLCG1 associated with metabolic syndrome phenotype domains. PLoS Genet. 2011, 7, e1002322. [Google Scholar] [CrossRef]
- Schultz, N. Characterization of Equine Metabolic Syndrome and Mapping of Candidate Genetic Loci. Ph.D. Thesis, University of Minnesota, Saint Paul, MN, USA, 2016. [Google Scholar]
- Norton, E.M.; Avila, F.; Schultz, N.E.; Mickelson, J.R.; Geor, R.J.; McCue, M.E. Evaluation of an HMGA2 variant for pleiotropic effects on height and metabolic traits in ponies. J. Vet. Intern. Med. 2019, 33, 942–952. [Google Scholar] [CrossRef]
- Schuver, A.; Frank, N.; Chameroy, K.A.; Elliott, S.B. Assessment of Insulin and Glucose Dynamics by Using an Oral Sugar Test in Horses. J. Equine Vet. Sci. 2014, 34, 465–470. [Google Scholar] [CrossRef]
- Browning, S.R.; Browning, B.L. Rapid and accurate haplotype phasing and missing-data inference for whole-genome association studies by use of localized haplotype clustering. Am. J. Hum. Genet. 2007, 81, 1084–1097. [Google Scholar] [CrossRef] [PubMed]
- McCoy, A.M.; McCue, M.E. Validation of imputation between equine genotyping arrays. Anim. Genet. 2014, 45, 153. [Google Scholar] [CrossRef] [PubMed]
- Purcell, S.; Neale, B.; Todd-Brown, K.; Thomas, L.; Ferreira, M.A.; Bender, D.; Maller, J.; Sklar, P.; de Bakker, P.I.; Daly, M.J.; et al. PLINK: A tool set for whole-genome association and population-based linkage analyses. Am. J. Hum. Genet. 2007, 81, 559–575. [Google Scholar] [CrossRef] [PubMed]
- Beeson, S.K.; Schaefer, R.J.; Mason, V.C.; McCue, M.E. Robust remapping of equine SNP array coordinates to EquCab3. Anim. Genet. 2019, 50, 114–115. [Google Scholar] [CrossRef] [PubMed]
- Pinheiro, J.; Bates, D.; DebRoy, S.; Sarkar, D. nlme: Linear and Nonlinear Mixed Effects Model. R. Package Version 3.1-141. 2018. Available online: https://CRAN.R-project.org/package=nlme (accessed on 5 November 2019).
- Zhou, X.; Carbonetto, P.; Stephens, M. Polygenic modeling with bayesian sparse linear mixed models. PLoS Genet. 2013, 9, e1003264. [Google Scholar] [CrossRef]
- Zhou, X.; Stephens, M. Genome-wide efficient mixed-model analysis for association studies. Nat. Genet. 2012, 44, 821–824. [Google Scholar] [CrossRef]
- Lippert, C.; Listgarten, J.; Liu, Y.; Kadie, C.M.; Davidson, R.I.; Heckerman, D. FaST linear mixed models for genome-wide association studies. Nat. Methods 2011, 8, 833–835. [Google Scholar] [CrossRef]
- Li, M.X.; Yeung, J.M.; Cherny, S.S.; Sham, P.C. Evaluating the effective numbers of independent tests and significant p value thresholds in commercial genotyping arrays and public imputation reference datasets. Hum. Genet. 2012, 131, 747–756. [Google Scholar] [CrossRef]
- Schroder, W.; Klostermann, A.; Stock, K.F.; Distl, O. A genome-wide association study for quantitative trait loci of show-jumping in Hanoverian warmblood horses. Anim. Genet. 2012, 43, 392–400. [Google Scholar] [CrossRef]
- Lykkjen, S.; Dolvik, N.I.; McCue, M.E.; Rendahl, A.K.; Mickelson, J.R.; Roed, K.H. Genome-wide association analysis of osteochondrosis of the tibiotarsal joint in Norwegian Standardbred trotters. Anim. Genet. 2010, 41, 111–120. [Google Scholar] [CrossRef]
- Han, B.; Eskin, E. Random-effects model aimed at discovering associations in meta-analysis of genome-wide association studies. Am. J. Hum. Genet. 2011, 88, 586–598. [Google Scholar] [CrossRef] [PubMed]
- McCue, M.E.; Bannasch, D.L.; Petersen, J.L.; Gurr, J.; Bailey, E.; Binns, M.M.; Distl, O.; Guerin, G.; Hasegawa, T.; Hill, E.W.; et al. A high density SNP array for the domestic horse and extant Perissodactyla: Utility for association mapping, genetic diversity, and phylogeny studies. PLoS Genet. 2012, 8, e1002451. [Google Scholar] [CrossRef] [PubMed]
- Petersen, J.L.; Mickelson, J.R.; Rendahl, A.K.; Valberg, S.J.; Andersson, L.S.; Axelsson, J.; Bailey, E.; Bannasch, D.; Binns, M.M.; Borges, A.S.; et al. Genome-wide analysis reveals selection for important traits in domestic horse breeds. PLoS Genet. 2013, 9, e1003211. [Google Scholar] [CrossRef] [PubMed]
- Corbin, L.J.; Blott, S.C.; Swinburne, J.E.; Vaudin, M.; Bishop, S.C.; Woolliams, J.A. Linkage disequilibrium and historical effective population size in the Thoroughbred horse. Anim. Genet. 2010, 41, 8–15. [Google Scholar] [CrossRef] [PubMed]
- Petersen, J.L.; Mickelson, J.R.; Cothran, E.G.; Andersson, L.S.; Axelsson, J.; Bailey, E.; Bannasch, D.; Binns, M.M.; Borges, A.S.; Brama, P.; et al. Genetic diversity in the modern horse illustrated from genome-wide SNP data. PLoS ONE 2013, 8, e54997. [Google Scholar] [CrossRef] [PubMed]
- Schaefer, R.J.; Schubert, M.; Bailey, E.; Bannasch, D.L.; Barrey, E.; Bar-Gal, G.K.; Brem, G.; Brooks, S.A.; Distl, O.; Fries, R.; et al. Developing a 670k genotyping array to tag ~2M SNPs across 24 horse breeds. BMC Genom. 2017, 18, 565. [Google Scholar] [CrossRef]
- Wade, C.M.; Giulotto, E.; Sigurdsson, S.; Zoli, M.; Gnerre, S.; Imsland, F.; Lear, T.L.; Adelson, D.L.; Bailey, E.; Bellone, R.R.; et al. Genome sequence, comparative analysis, and population genetics of the domestic horse. Science 2009, 326, 865–867. [Google Scholar] [CrossRef]
- Durinck, S.; Spellman, P.T.; Birney, E.; Huber, W. Mapping identifiers for the integration of genomic datasets with the R/Bioconductor package biomaRt. Nat. Protoc. 2009, 4, 1184–1191. [Google Scholar] [CrossRef]
- Kalbfleisch, T.S.; Rice, E.S.; DePriest, M.S., Jr.; Walenz, B.P.; Hestand, M.S.; Vermeesch, J.R.; BL, O.C.; Fiddes, I.T.; Vershinina, A.O.; Saremi, N.F.; et al. Improved reference genome for the domestic horse increases assembly contiguity and composition. Commun. Biol. 2018, 1, 197. [Google Scholar] [CrossRef]
- Raudvere, U.; Kolberg, L.; Kuzmin, I.; Arak, T.; Adler, P.; Peterson, H.; Vilo, J. g:Profiler: A web server for functional enrichment analysis and conversions of gene lists (2019 update). Nucl. Acids Res. 2019, 47, W191–W198. [Google Scholar] [CrossRef]
- Peters, U.; Bien, S.; Zubair, N. Genetic architecture of colorectal cancer. Gut 2015, 64, 1623–1636. [Google Scholar] [CrossRef] [PubMed]
- Ardlie, K.G.; Kruglyak, L.; Seielstad, M. Patterns of linkage disequilibrium in the human genome. Nat. Rev. Genet. 2002, 3, 299–309. [Google Scholar] [CrossRef] [PubMed]
- Slatkin, M.; Theunert, C. Distinguishing Recent Admixture from Ancestral Population Structure. Genome Biol. Evol. 2017, 9, 427–437. [Google Scholar] [CrossRef]
- Marchini, J.; Cardon, L.R.; Phillips, M.S.; Donnelly, P. The effects of human population structure on large genetic association studies. Nat. Genet. 2004, 36, 512. [Google Scholar] [CrossRef] [PubMed]
- Begum, F.; Ghosh, D.; Tseng, G.C.; Feingold, E. Comprehensive literature review and statistical considerations for GWAS meta-analysis. Nucl. Acids Res. 2012, 40, 3777–3784. [Google Scholar] [CrossRef] [PubMed]
- Evangelou, E.; Ioannidis, J.P. Meta-analysis methods for genome-wide association studies and beyond. Nat. Rev. Genet. 2013, 14, 379–389. [Google Scholar] [CrossRef]
- Petersen, J.L.; Mickelson, J.R.; Cleary, K.D.; McCue, M.E. The American Quarter Horse: Population structure and relationship to the thoroughbred. J. Hered. 2014, 105, 148–162. [Google Scholar] [CrossRef][Green Version]
- Freedman, M.L.; Reich, D.; Penney, K.L.; McDonald, G.J.; Mignault, A.A.; Patterson, N.; Gabriel, S.B.; Topol, E.J.; Smoller, J.W.; Pato, C.N.; et al. Assessing the impact of population stratification on genetic association studies. Nat. Genet. 2004, 36, 388–393. [Google Scholar] [CrossRef]
- Yu, J.; Pressoir, G.; Briggs, W.H.; Vroh Bi, I.; Yamasaki, M.; Doebley, J.F.; McMullen, M.D.; Gaut, B.S.; Nielsen, D.M.; Holland, J.B.; et al. A unified mixed-model method for association mapping that accounts for multiple levels of relatedness. Nat. Genet. 2006, 38, 203–208. [Google Scholar] [CrossRef]
- Williams, S.M.; Haines, J.L. Correcting away the hidden heritability. Ann. Hum. Genet. 2011, 75, 348–350. [Google Scholar] [CrossRef]
- Kraja, A.T.; Vaidya, D.; Pankow, J.S.; Goodarzi, M.O.; Assimes, T.L.; Kullo, I.J.; Sovio, U.; Mathias, R.A.; Sun, Y.V.; Franceschini, N.; et al. A bivariate genome-wide approach to metabolic syndrome: STAMPEED consortium. Diabetes 2011, 60, 1329–1339. [Google Scholar] [CrossRef] [PubMed]
- Kristiansson, K.; Perola, M.; Tikkanen, E.; Kettunen, J.; Surakka, I.; Havulinna, A.S.; Stancakova, A.; Barnes, C.; Widen, E.; Kajantie, E.; et al. Genome-wide screen for metabolic syndrome susceptibility Loci reveals strong lipid gene contribution but no evidence for common genetic basis for clustering of metabolic syndrome traits. Circ. Cardiovasc. Genet. 2012, 5, 242–249. [Google Scholar] [CrossRef] [PubMed]
- Povel, C.M.; Boer, J.M.; Reiling, E.; Feskens, E.J. Genetic variants and the metabolic syndrome: A systematic review. Obes. Rev. 2011, 12, 952–967. [Google Scholar] [CrossRef] [PubMed]
- Morton, N.M.; Beltram, J.; Carter, R.N.; Michailidou, Z.; Gorjanc, G.; McFadden, C.; Barrios-Llerena, M.E.; Rodriguez-Cuenca, S.; Gibbins, M.T.; Aird, R.E.; et al. Genetic identification of thiosulfate sulfurtransferase as an adipocyte-expressed antidiabetic target in mice selected for leanness. Nat. Med. 2016, 22, 771–779. [Google Scholar] [CrossRef]
- Huang, X.; Liu, G.; Guo, J.; Su, Z. The PI3K/AKT pathway in obesity and type 2 diabetes. Int. J. Biol. Sci. 2018, 14, 1483–1496. [Google Scholar] [CrossRef]
- Guo, S. Insulin signaling, resistance, and the metabolic syndrome: Insights from mouse models into disease mechanisms. J. Endocrinol. 2014, 220, T1–T23. [Google Scholar] [CrossRef]
- Abou Ziki, M.D.; Mani, A. The interplay of canonical and noncanonical Wnt signaling in metabolic syndrome. Nutr. Res. 2018. [Google Scholar] [CrossRef]
- De la Iglesia, R.; Mansego, M.L.; Sanchez-Muniz, F.J.; Zulet, M.A.; Martinez, J.A. Arylesterase activity is associated with antioxidant intake and paraoxonase-1 (PON1) gene methylation in metabolic syndrome patients following an energy restricted diet. EXCLI J. 2014, 13, 416–426. [Google Scholar]
- Hashemi, M.; Kordi-Tamandani, D.M.; Sharifi, N.; Moazeni-Roodi, A.; Kaykhaei, M.A.; Narouie, B.; Torkmanzehi, A. Serum paraoxonase and arylesterase activities in metabolic syndrome in Zahedan, Southeast Iran. Eur. J. Endocrinol. 2011, 164, 219–222. [Google Scholar] [CrossRef]
- Riddy, D.M.; Delerive, P.; Summers, R.J.; Sexton, P.M.; Langmead, C.J. G Protein-Coupled Receptors Targeting Insulin Resistance, Obesity, and Type 2 Diabetes Mellitus. Pharmacol. Rev. 2018, 70, 39–67. [Google Scholar] [CrossRef]
- Ole, T. GNU Parallel 2016; Ole Tange: Frederiksberg, Denmark, 2016. [Google Scholar]
- Speidel, S.E.; Buckley, B.A.; Boldt, R.J.; Enns, R.M.; Lee, J.; Spangler, M.L.; Thomas, M.G. Genome-wide association study of Stayability and Heifer Pregnancy in Red Angus cattle. J. Anim. Sci. 2018, 96, 846–853. [Google Scholar] [CrossRef] [PubMed]
- Suagee, J.K.; Corl, B.A.; Crisman, M.V.; Pleasant, R.S.; Thatcher, C.D.; Geor, R.J. Relationships between body condition score and plasma inflammatory cytokines, insulin, and lipids in a mixed population of light-breed horses. J. Vet. Intern. Med. 2013, 27, 157–163. [Google Scholar] [CrossRef] [PubMed]
- Kawasumi, K.; Yamamoto, M.; Koide, M.; Okada, Y.; Mori, N.; Yamamoto, I.; Arai, T. Aging effect on plasma metabolites and hormones concentrations in riding horses. Open Vet. J. 2015, 5, 154–157. [Google Scholar] [PubMed]
- Funk, R.A.; Wooldridge, A.A.; Stewart, A.J.; Behrend, E.N.; Kemppainen, R.J.; Zhong, Q.; Johnson, A.K. Seasonal changes in the combined glucose-insulin tolerance test in normal aged horses. J. Vet. Intern. Med. 2012, 26, 1035–1041. [Google Scholar] [CrossRef] [PubMed]
- Kamezaki, F.; Sonoda, S.; Tomotsune, Y.; Yunaka, H.; Otsuji, Y. Seasonal variation in metabolic syndrome prevalence. Hypertens. Res. 2010, 33, 568–572. [Google Scholar] [CrossRef] [PubMed]
- Menzies-Gow, N.J. Endocrinopathic laminitis: Reducing the risk through diet and exercise. Vet. Clin. Norton Am. Equine Pract. 2010, 26, 371–378. [Google Scholar] [CrossRef] [PubMed]
- Bamford, N.J.; Potter, S.J.; Baskerville, C.L.; Harris, P.A.; Bailey, S.R. Influence of dietary restriction and low-intensity exercise on weight loss and insulin sensitivity in obese equids. J. Vet. Intern. Med. 2019, 33, 280–286. [Google Scholar] [CrossRef]
- Durward-Akhurst, S.A.; Schultz, N.E.; Norton, E.M.; Rendahl, A.K.; Besselink, H.; Behnisch, P.A.; Brouwer, A.; Geor, R.J.; Mickelson, J.R.; McCue, M.E. Associations between endocrine disrupting chemicals and equine metabolic syndrome phenotypes. Chemosphere 2019, 218, 652–661. [Google Scholar] [CrossRef]
- Bamford, N.J.; Potter, S.J.; Baskerville, C.L.; Harris, P.A.; Bailey, S.R. Effect of increased adiposity on insulin sensitivity and adipokine concentrations in different equine breeds adapted to cereal-rich or fat-rich meals. Vet. J. 2016, 214, 14–20. [Google Scholar] [CrossRef]
- Borer-Weir, K.E.; Menzies-Gow, N.J.; Bailey, S.R.; Harris, P.A.; Elliott, J. Seasonal and annual influence on insulin and cortisol results from overnight dexamethasone suppression tests in normal ponies and ponies predisposed to laminitis. Equine Vet. J. 2013, 45, 688–693. [Google Scholar] [CrossRef]
- Bamford, N.J.; Potter, S.J.; Harris, P.A.; Bailey, S.R. Effect of increased adiposity on insulin sensitivity and adipokine concentrations in horses and ponies fed a high fat diet, with or without a once daily high glycaemic meal. Equine Vet. J. 2016, 48, 368–373. [Google Scholar] [CrossRef] [PubMed]
- Jacob, S.I.; Geor, R.J.; Weber, P.S.D.; Harris, P.A.; McCue, M.E. Effect of age and dietary carbohydrate profiles on glucose and insulin dynamics in horses. Equine Vet. J. 2018, 50, 249–254. [Google Scholar] [CrossRef] [PubMed]


| Trait | Chr | Min_SNP | Max_SNP | Sugg_SNPs | Sign_SNPs | FE |
|---|---|---|---|---|---|---|
| Insulin | 5 | 44104129 | 45081679 | 39 | 4 | - |
| 15 | 5887873 | 6225014 | 21 | 2 | - | |
| 24 | 28804043 | 29076914 | 3 | 2 | - | |
| INS-OST | 10 | 71620835 | 72425049 | 19 | 4 | X |
| 28 | 38307699 | 38344594 | 2 | 1 | - | |
| Glucose | 4 | 18053357 | 18550035 | 20 | 1 | - |
| 8 | 9289661 | 9312611 | 2 | 1 | - | |
| GLU-OST | 3 | 55982921 | 56558742 | 57 | 39 | X |
| 4 | 27802674 | 28514796 | 18 | 4 | X | |
| 15 | 79697363 | 79717603 | 3 | 3 | - | |
| 28 | 34861664 | 34868420 | 2 | 2 | - | |
| NEFA | 1 | 183532379 | 184178932 | 21 | 15 | X |
| 17 | 13355958 | 14014858 | 23 | 1 | X | |
| 24 | 20975408 | NA | 1 | 1 | - | |
| 30 | 20148173 | 20205201 | 10 | 3 | X | |
| Adiponectin | 2 | 16725632 | 17531903 | 25 | 19 | X |
| 4 | 37105938 | 37523046 | 6 | 2 | X | |
| 6 | 31582345 | 31708194 | 17 | 1 | X | |
| 6 | 67097628 | 68036518 | 16 | 1 | - | |
| 18 | 41399862 | 41533081 | 9 | 1 | - | |
| 18 | 60138400 | 60241267 | 10 | 2 | - | |
| 20 | 3447045 | 3609674 | 10 | 4 | X | |
| Leptin | 7 | 65731012 | 65804974 | 6 | 3 | X |
| 10 | 871456 | NA | 1 | 1 | - | |
| 19 | 48839140 | 49627683 | 44 | 22 | X | |
| 24 | 28551544 | 28744981 | 17 | 6 | - | |
| ACTH | 1 | 69730886 | 70257187 | 4 | 1 | - |
| 1 | 82755708 | 82879246 | 10 | 1 | - | |
| 3 | 41684754 | NA | 1 | 1 | - | |
| 3 | 101236287 | 101618645 | 42 | 24 | X | |
| 5 | 28822515 | 29342972 | 12 | 3 | X | |
| 10 | 78846710 | NA | 1 | 1 | - | |
| NH | 1 | 88009187 | NA | 1 | 1 | - |
| 3 | 58464229 | NA | 1 | 1 | - | |
| 4 | 51903203 | 53474757 | 64 | 40 | - | |
| 6 | 63614756 | 63814984 | 20 | 10 | - | |
| 9 | 22745020 | NA | 1 | 1 | - | |
| 9 | 33549797 | 34165892 | 31 | 1 | - | |
| 11 | 18987272 | 19176693 | 10 | 8 | - | |
| 14 | 63778931 | 63876998 | 7 | 2 | X | |
| 19 | 1134701 | 1139669 | 2 | 2 | - | |
| 19 | 32230245 | 33643392 | 55 | 2 | - | |
| 20 | 39797561 | 40162785 | 7 | 4 | X | |
| 20 | 59659997 | 60403627 | 11 | 4 | X | |
| 21 | 20193411 | 21256032 | 18 | 11 | X | |
| 24 | 33852631 | 34812035 | 36 | 23 | X | |
| GH | 1 | 121484057 | 121775873 | 47 | 19 | - |
| 1 | 131512239 | 131621826 | 3 | 3 | X | |
| 4 | 84181768 | 85275183 | 29 | 11 | X | |
| 11 | 18987272 | 19176693 | 10 | 9 | X | |
| 17 | 32120145 | 32544617 | 23 | 4 | X | |
| 19 | 28934939 | NA | 1 | 1 | - | |
| 20 | 63560971 | 63691145 | 10 | 6 | - | |
| 22 | 40135963 | 40167502 | 4 | 4 | X | |
| LAM | 1 | 49077969 | NA | 1 | 1 | - |
| 2 | 36104151 | 36108219 | 6 | 6 | - | |
| 4 | 17765473 | 18991639 | 11 | 3 | - | |
| 12 | 29378128 | 30296509 | 19 | 11 | X | |
| 14 | 88430222 | 89591967 | 20 | 5 | - | |
| 18 | 31679672 | 33134556 | 51 | 26 | X | |
| 19 | 28057756 | 28417335 | 5 | 2 | - | |
| 19 | 57605404 | 58429206 | 36 | 20 | X | |
| 22 | 3565315 | 4307679 | 62 | 38 | X | |
| 23 | 12226548 | 12763020 | 35 | 24 | X | |
| 28 | 9446507 | 9643240 | 13 | 5 | X |
| Trait | Chr | Min | Max | Protein Coding | RNA Genes | Total Genes |
|---|---|---|---|---|---|---|
| Insulin | 5 | 35409104 | 44806458 | 267 | 38 | 306 |
| 8 | 69350844 | 75906595 | 32 | 23 | 55 | |
| 15 | 5748377 | 6612684 | 0 | 1 | 1 | |
| 18 | 78720858 | 79634082 | 2 | 4 | 6 | |
| 24 | 28451012 | 29887250 | 2 | 4 | 6 | |
| INS-OST | 1 | 176773704 | 176873704 | 0 | 1 | 1 |
| 8 | 73173455 | 73699198 | 1 | 1 | 2 | |
| 10 | 71967783 | 72438937 | 3 | 0 | 3 | |
| 28 | 39322188 | 39488807 | 8 | 1 | 9 | |
| Glucose | 15 | 83728178 | 83828178 | 2 | 0 | 2 |
| GLU-OST | 28 | 34271949 | 35138699 | 9 | 0 | 9 |
| Adiponectin | 1 | 171861236 | 178270042 | 25 | 24 | 49 |
| 18 | 60060215 | 61349045 | 7 | 6 | 13 | |
| Leptin | 5 | 39751797 | 50431769 | 207 | 32 | 239 |
| 6 | 488137 | 4012580 | 15 | 10 | 25 | |
| 7 | 65678376 | 68117086 | 1 | 2 | 3 | |
| 10 | 692055 | 1068890 | 0 | 5 | 5 | |
| 21 | 22940681 | 23516697 | 1 | 0 | 1 | |
| NEFA | 19 | 1005718 | 1105718 | 2 | 0 | 2 |
| 28 | 32909542 | 35703535 | 65 | 11 | 76 | |
| ACTH | 1 | 42944403 | 45232767 | 5 | 4 | 9 |
| 1 | 69558737 | 70960589 | 7 | 16 | 23 | |
| 10 | 55060512 | 56255134 | 1 | 1 | 2 | |
| 10 | 78795710 | 80306613 | 20 | 5 | 25 | |
| 20 | 60381850 | 60481850 | 0 | 0 | 0 | |
| NH | 4 | 67130904 | 69873296 | 8 | 8 | 16 |
| 4 | 77298241 | 81186565 | 24 | 15 | 40 | |
| 4 | 83144842 | 83244842 | 1 | 0 | 1 | |
| 7 | 93176991 | 93628686 | 0 | 1 | 1 | |
| 9 | 32632235 | 37587269 | 10 | 8 | 18 | |
| 11 | 18342117 | 19876247 | 55 | 4 | 60 | |
| 14 | 63702522 | 63847210 | 0 | 2 | 2 | |
| 20 | 40244007 | 41210876 | 3 | 11 | 14 | |
| 20 | 60723014 | 61735694 | 0 | 2 | 2 | |
| 21 | 5280993 | 6396786 | 2 | 6 | 8 | |
| 21 | 19515280 | 25046226 | 22 | 27 | 49 | |
| 24 | 31843480 | 36758215 | 47 | 10 | 57 | |
| GH | 1 | 132184772 | 133716124 | 9 | 7 | 16 |
| 4 | 68425678 | 69636837 | 5 | 1 | 6 | |
| 4 | 70026254 | 81648125 | 49 | 45 | 95 | |
| 4 | 82570011 | 86366835 | 49 | 25 | 75 | |
| 7 | 93191676 | 93628672 | 0 | 1 | 1 | |
| 11 | 15414337 | 16451463 | 24 | 1 | 25 | |
| 11 | 18613895 | 19317536 | 26 | 0 | 26 | |
| 18 | 79527484 | 81467661 | 13 | 12 | 25 | |
| 19 | 31204596 | 31799125 | 0 | 0 | 0 | |
| 20 | 29486630 | 30976763 | 54 | 8 | 62 | |
| 20 | 59464566 | 61015217 | 1 | 2 | 3 | |
| 20 | 64722427 | 65336095 | 1 | 3 | 4 | |
| 21 | 20611963 | 22057711 | 3 | 4 | 7 | |
| 22 | 41032889 | 41066045 | 0 | 0 | 0 | |
| 25 | 19435041 | 19535041 | 4 | 0 | 4 | |
| LAM | 1 | 49391032 | 49491032 | 0 | 1 | 1 |
| 2 | 35880861 | 36665473 | 8 | 6 | 14 | |
| 19 | 57082025 | 62825378 | 42 | 16 | 59 | |
| 28 | 9990892 | 10844823 | 4 | 0 | 4 | |
| Total | 1146 | 415 | 1567 |
| Trait | Chr | Min | Max | Protein Coding | RNA Genes | Total Genes |
|---|---|---|---|---|---|---|
| Insulin | 24 | 21134897 | 21184897 | 1 | 0 | 1 |
| INS-OST | 4 | 28373202 | 28423202 | 0 | 0 | 0 |
| 6 | 32751552 | 34029749 | 12 | 10 | 22 | |
| 10 | 71666607 | 73534053 | 6 | 5 | 12 | |
| Glucose | 4 | 17239374 | 19043831 | 6 | 5 | 11 |
| 8 | 11193683 | 12404572 | 8 | 9 | 17 | |
| GLU-OST | 3 | 55746338 | 58085997 | 15 | 6 | 21 |
| 4 | 26695616 | 29116058 | 5 | 4 | 9 | |
| NEFA | 1 | 184859013 | 187238015 | 24 | 17 | 41 |
| 17 | 12653835 | 14464765 | 4 | 2 | 6 | |
| 24 | 20287835 | 20973401 | 15 | 1 | 16 | |
| 30 | 20915473 | 21380977 | 0 | 0 | 0 | |
| Adiponectin | 2 | 16362904 | 18105119 | 21 | 21 | 42 |
| 4 | 34723398 | 39321960 | 36 | 10 | 47 | |
| 6 | 32486287 | 32841880 | 3 | 4 | 7 | |
| 6 | 64297403 | 71493047 | 168 | 22 | 191 | |
| 18 | 41448414 | 41498414 | 0 | 1 | 1 | |
| 20 | 3649052 | 4325872 | 8 | 3 | 11 | |
| Leptin | 4 | 51590680 | 52810437 | 4 | 5 | 9 |
| 19 | 51286493 | 53959028 | 7 | 14 | 21 | |
| 24 | 25564765 | 29384679 | 7 | 14 | 21 | |
| 1 | 82700933 | 84269783 | 18 | 5 | 24 | |
| 3 | 42674448 | 44422013 | 2 | 7 | 10 | |
| 3 | 102944842 | 103801021 | 2 | 4 | 6 | |
| 5 | 25378878 | 27689002 | 12 | 16 | 28 | |
| NH | 1 | 82097718 | 83618523 | 14 | 6 | 20 |
| 4 | 52024470 | 54237747 | 8 | 12 | 20 | |
| 6 | 60410647 | 70570773 | 144 | 26 | 172 | |
| 19 | 661978 | 1345372 | 4 | 1 | 6 | |
| 19 | 32962795 | 37391949 | 53 | 19 | 73 | |
| GH | 1 | 120644115 | 124691346 | 36 | 20 | 56 |
| 17 | 31806060 | 33720086 | 3 | 3 | 7 | |
| LAM | 4 | 17301415 | 19812653 | 8 | 7 | 16 |
| 12 | 32885278 | 34800986 | 29 | 16 | 45 | |
| 14 | 87916190 | 91602875 | 32 | 26 | 58 | |
| 18 | 30095266 | 35177011 | 23 | 13 | 36 | |
| 19 | 30133826 | 30183826 | 2 | 0 | 2 | |
| 22 | 2843476 | 5225020 | 13 | 10 | 23 | |
| 23 | 7656404 | 12984095 | 11 | 23 | 34 | |
| Total | 764 | 367 | 1142 |
© 2019 by the authors. Licensee MDPI, Basel, Switzerland. This article is an open access article distributed under the terms and conditions of the Creative Commons Attribution (CC BY) license (http://creativecommons.org/licenses/by/4.0/).
Share and Cite
Norton, E.; Schultz, N.; Geor, R.; McFarlane, D.; Mickelson, J.; McCue, M. Genome-Wide Association Analyses of Equine Metabolic Syndrome Phenotypes in Welsh Ponies and Morgan Horses. Genes 2019, 10, 893. https://doi.org/10.3390/genes10110893
Norton E, Schultz N, Geor R, McFarlane D, Mickelson J, McCue M. Genome-Wide Association Analyses of Equine Metabolic Syndrome Phenotypes in Welsh Ponies and Morgan Horses. Genes. 2019; 10(11):893. https://doi.org/10.3390/genes10110893
Chicago/Turabian StyleNorton, Elaine, Nichol Schultz, Ray Geor, Dianne McFarlane, James Mickelson, and Molly McCue. 2019. "Genome-Wide Association Analyses of Equine Metabolic Syndrome Phenotypes in Welsh Ponies and Morgan Horses" Genes 10, no. 11: 893. https://doi.org/10.3390/genes10110893
APA StyleNorton, E., Schultz, N., Geor, R., McFarlane, D., Mickelson, J., & McCue, M. (2019). Genome-Wide Association Analyses of Equine Metabolic Syndrome Phenotypes in Welsh Ponies and Morgan Horses. Genes, 10(11), 893. https://doi.org/10.3390/genes10110893