Article

Patterns and Constraints in the Evolution of Sperm Individualization Genes in Insects, with an Emphasis on Beetles

1
Animal Biodiversity and Evolution, Institute of Evolutionary Biology (CSIC-Universitat Pompeu Fabra), 08003 Barcelona, Spain
2
Center for Molecular Biodiversity Research, Zoological Research Museum Alexander Koenig, 53113 Bonn, Germany
3
Center for Biodiversity Research, Department of Biological Sciences, University of Memphis, Memphis, TN 38152, USA
4
Department of Entomology, College of Plant Protection, China Agricultural University, Beijing 100193, China
*
Author to whom correspondence should be addressed.
Genes 2019, 10(10), 776; https://doi.org/10.3390/genes10100776
Submission received: 24 August 2019 / Revised: 20 September 2019 / Accepted: 1 October 2019 / Published: 4 October 2019
(This article belongs to the Section Population and Evolutionary Genetics and Genomics)

Abstract

:
Gene expression profiles can change dramatically between sexes and sex bias may contribute specific macroevolutionary dynamics for sex-biased genes. However, these dynamics are poorly understood at large evolutionary scales due to the paucity of studies that have assessed orthology and functional homology for sex-biased genes and the pleiotropic effects possibly constraining their evolutionary potential. Here, we explore the correlation of sex-biased expression with macroevolutionary processes that are associated with sex-biased genes, including duplications and accelerated evolutionary rates. Specifically, we examined these traits in a group of 44 genes that orchestrate sperm individualization during spermatogenesis, with both unbiased and sex-biased expression. We studied these genes in the broad evolutionary framework of the Insecta, with a particular focus on beetles (order Coleoptera). We studied data mined from 119 insect genomes, including 6 beetle models, and from 19 additional beetle transcriptomes. For the subset of physically and/or genetically interacting proteins, we also analyzed how their network structure may condition the mode of gene evolution. The collection of genes was highly heterogeneous in duplication status, evolutionary rates, and rate stability, but there was statistical evidence for sex bias correlated with faster evolutionary rates, consistent with theoretical predictions. Faster rates were also correlated with clocklike (insect amino acids) and non-clocklike (beetle nucleotides) substitution patterns in these genes. Statistical associations (higher rates for central nodes) or lack thereof (centrality of duplicated genes) were in contrast to some current evolutionary hypotheses, highlighting the need for more research on these topics.

1. Introduction

Phenotypic and physiological differences among closely related species with highly similar genomes are expected to be the result of differences in the expression profiles of key genes (e.g., [1]). In this regard, understanding the mechanisms underlying differences between males and females of the same species becomes of particular interest. Conspecific individuals of different sexes share most, if not all, of their genome and genetics but sometimes display striking anatomical and physiological differences. Studies using model organisms have demonstrated the existence of significant differences in gene expression profiles between sexes. For example, approximately 30% of genes in the vinegar fly (order Diptera), Drosophila melanogaster, show sex-biased expression, and most of these genes are specific to reproductive tissues [2,3,4]. In fact, it has been proposed that most gene expression in Drosophila is sex biased at some point, exhibiting this bias either throughout the life cycle or in specific developmental stages [5]. Similarly, 5–15% of the genes in the mosquito (order Diptera) Anopheles gambiae genome show differential expression between males and females [6], and approximately 20% of the X-chromosome genes of Tribolium castaneum (order Coleoptera) are regulated differently in each sex [7].
The existence and need for biases in gene expression imply several evolutionary mechanisms that, on the one hand, allow for the bias to occur and, on the other hand, condition the dynamics of changes in the affected genes through time [8]. Sex bias in gene expression can be achieved through linkage to sex chromosomes and dosage compensation, sex-specific alternative splicing, and other mechanisms [9,10,11,12]. However, these mechanisms primarily affect the expression of regulatory elements, which in turn condition the action of the genes themselves, e.g., following a particular sex-specific splicing or protein maturation pathway. Gene duplication is another mechanism that directly allows for new gene expression profiles, including sex-biased ones [13]. Gene duplication offers an immediate solution to differential expression needs by potentially allowing each copy of a gene to acquire unique functionality. It is now viewed as having played an important, if poorly understood, role in the evolution of sex-biased gene expression [14]. Moreover, gene duplication could also be related, in part, to the relaxation of evolutionary constraints on one of the resulting gene copies, which could, in turn, lead to more rapid gene evolution [15]. Rapid gene evolution has classically been proposed as a consequence of sex-biased and particularly male-biased genes [4,5,16,17,18]. However, it is not entirely clear whether it is the bias in expression that results in faster evolutionary rates or if it is because of other features of these genes, such as their frequent tissue specificity, which is also correlated with faster evolutionary rates [19].
It is generally accepted that gene duplication is a major force altering the diversity and characteristics of sex-biased genes, but the connection between sex-biased gene expression and evolutionary rates remains poorly understood [8]. So far, these associations have been studied in just a handful of model organisms, and even though it is theoretically plausible that evolutionary processes and functional patterns are related, it is too early to invoke a general rule. Working toward this generalization first requires determining the unequivocal orthology of sex-biased genes between model and non-model species [20]. Furthermore, it requires assuming that orthology and structural homology correlate with functional homology [21,22]. Another problem lies in the actual definition of sex-biased genes. The concept is intuitive and unambiguous: a sex-biased gene is one with different levels of expression between males and females [23]. However, it is also a quantitative one: how different do the expression levels have to be to elicit the activation of the particular evolutionary mechanisms mentioned above? Other non-trivial issues include the occurrence of pleiotropy, the fact that sex-biased genes may be expressed for alternative functions in different tissues and not necessarily related or restricted to one sex, and protein–protein interactions, so that a specific function takes place through physical and genetic modulation by other proteins. Pleiotropy and protein–protein interactions could modulate or limit the evolutionary dynamics of genes, obscuring or changing the expectations derived from the study of model species.
In this study, we aimed to explore the correlation of sex-biased expression with gene duplications and accelerated evolutionary rates in a large evolutionary framework, using non-model organisms for which no gene expression analyses are available. Our work was informed by previous studies involving a model organism (D. melanogaster) and used phylogenetic approaches. The obvious candidates for sex-biased genes are those involved in processes that are exclusive to one sex, for example, spermatogenesis in males [18,24]. Thus, in order to test for these differences, we selected a male reproduction functional group, i.e., a coherent set of genes working together toward a specific reproductive function in males, including genes that are male biased in Drosophila spp. and genes that are expressed both in female and in male tissues or non-reproductive tissues. In particular, the present study focused on an integrated male reproductive function—sperm individualization—which is known to involve the action of both constitutive and sex-biased genes in D. melanogaster with different degrees of tissue specificity. Sperm individualization is one of the final stages in spermatogenesis that resolves spermatids as individual cells from the syncytial male germline cysts [25]. In a very simplified manner, this process involves a number of stages where (1) a syncytial cyst forms around all spermatids resulting from a primary spermatocyte, (2) an individualization complex formed through cytoskeletal mechanisms and membrane formation encapsulates each of the spermatids, and (3) the syncytial cytoplasm is discarded [26]. We investigated the phylogeny and evolution of these genes across the class Insecta, with particular emphasis on the species-rich order Coleoptera (beetles). The insects we studied included several model organisms for which both orthology assessment and expression studies were publicly available (e.g., modENCODE and OrthoDB projects; [27,28]). Given that beetles are proportionally underrepresented in the genomic and gene profiling literature, we mined relevant data from the 1KITE project (http://1kite.org/), thereby broadening representation of beetles in our study and facilitating orthology assessment via phylogenetic approaches [29].

2. Materials and Methods

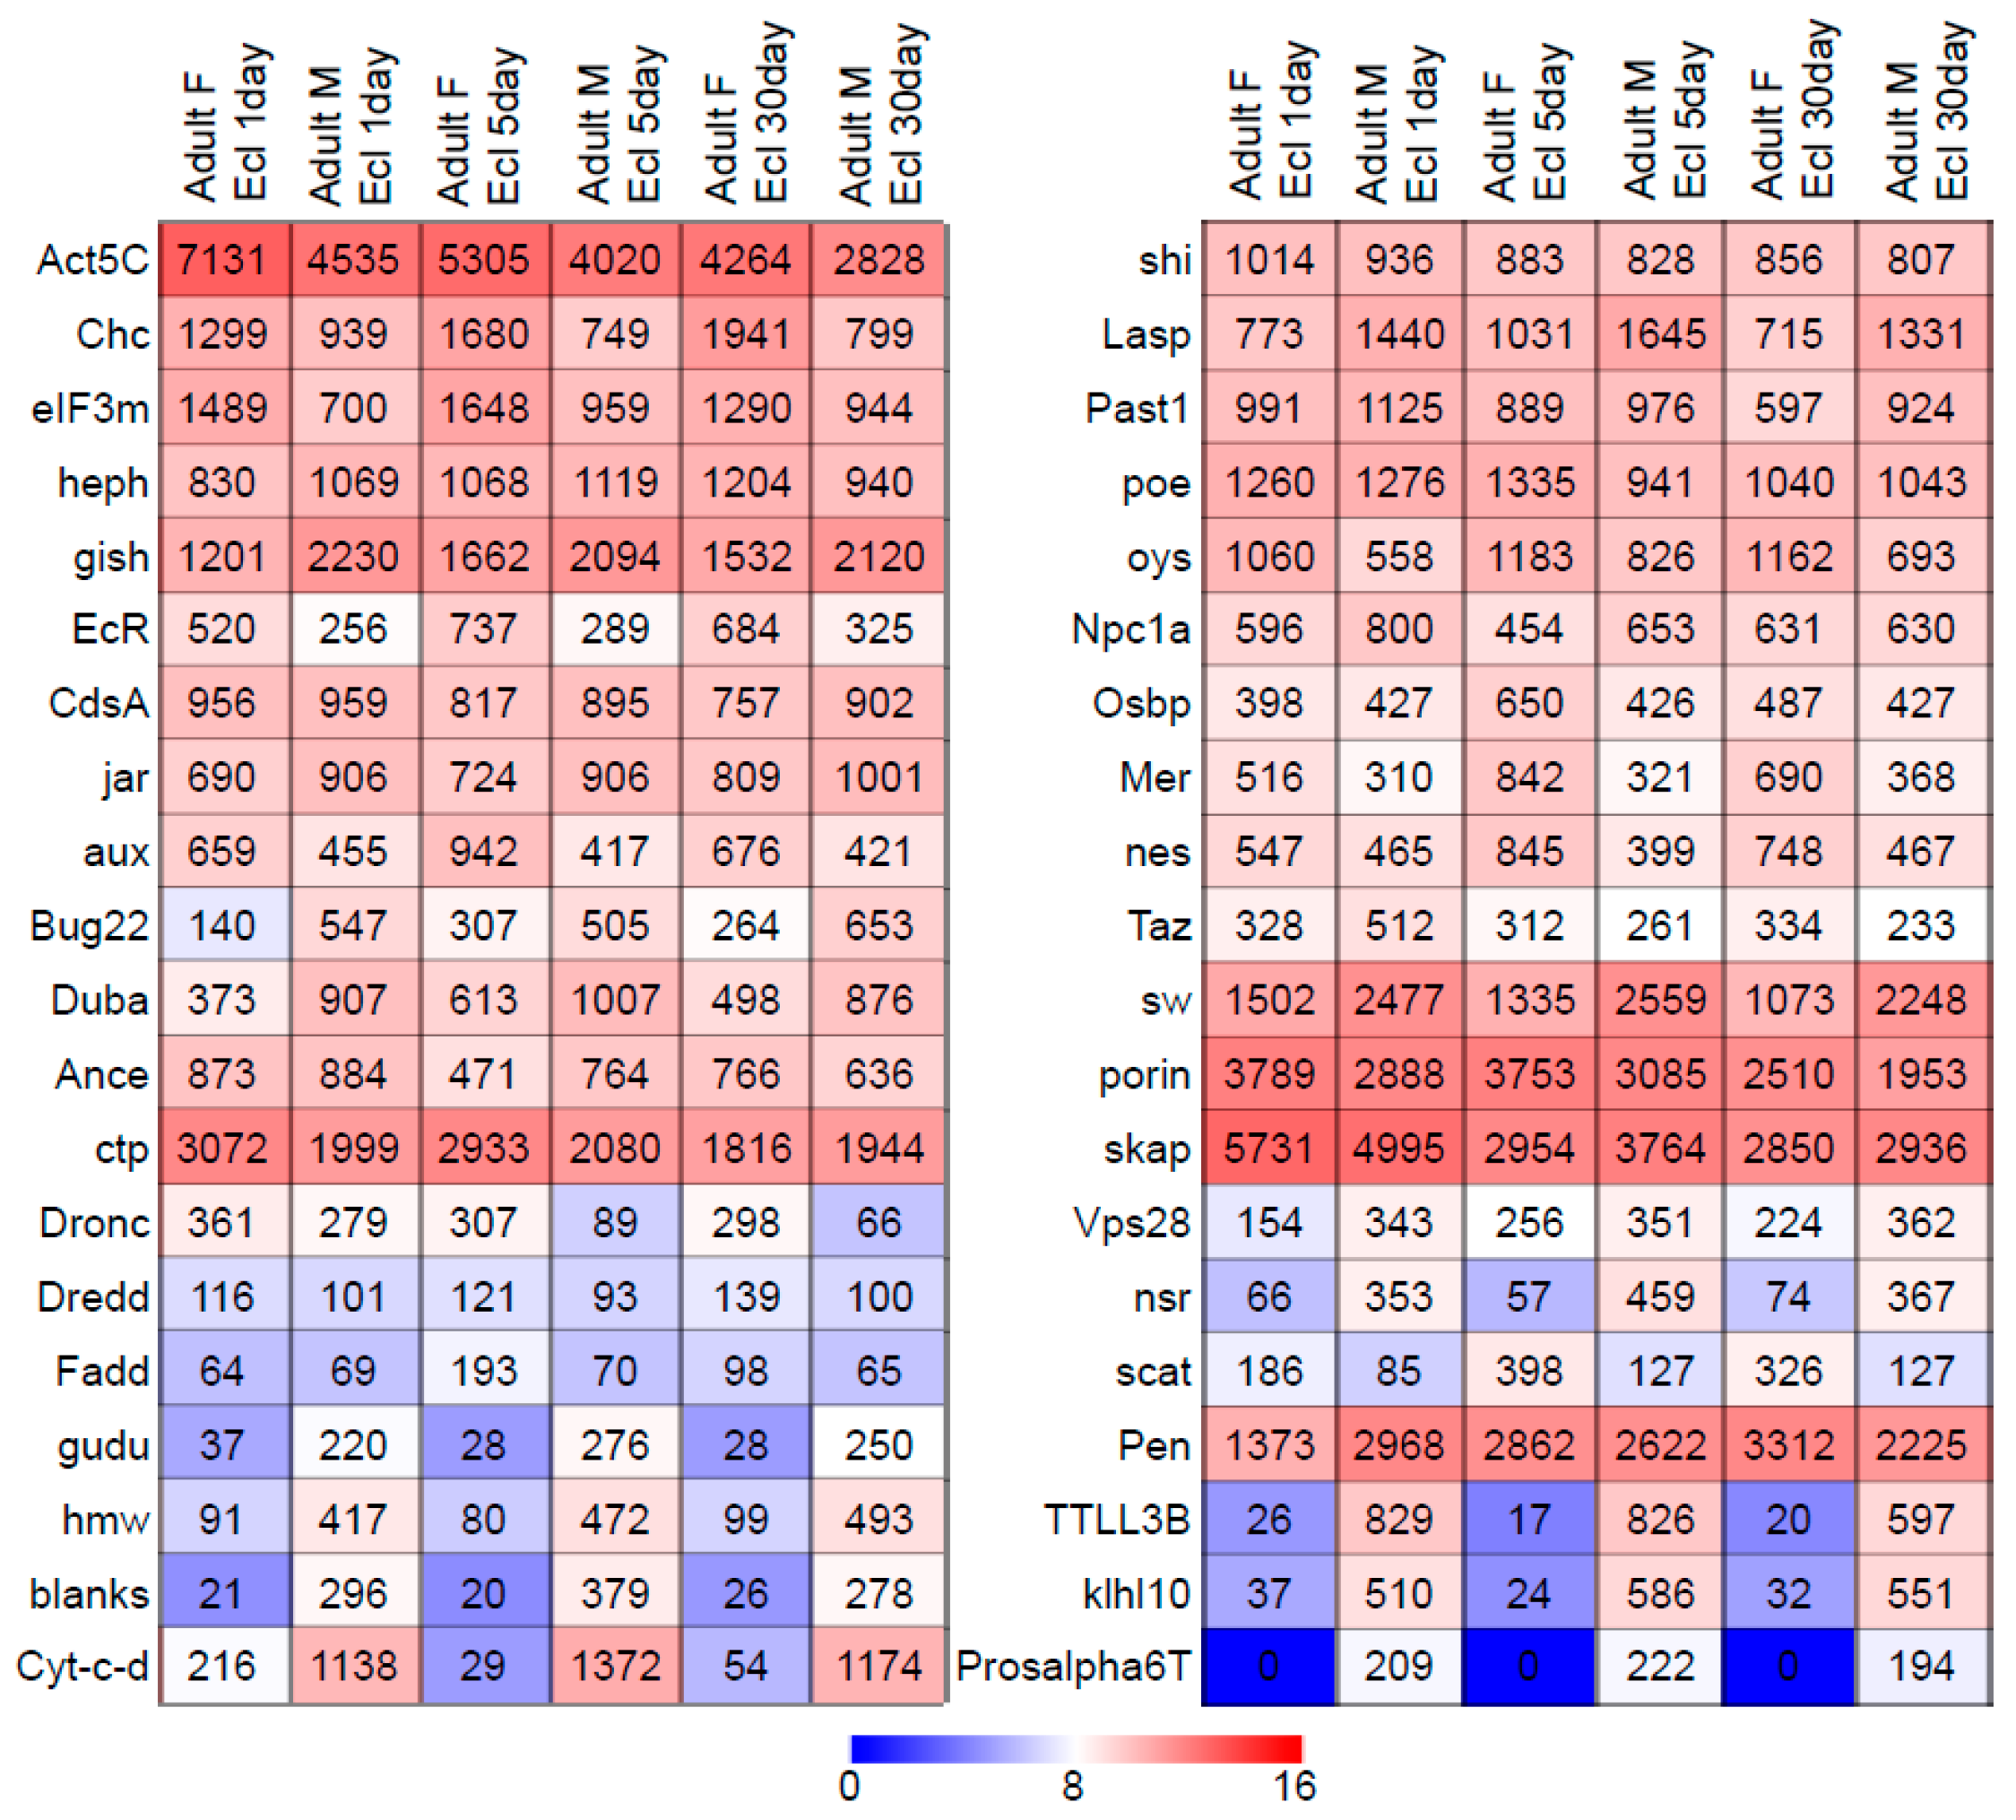
2.1. Selection of Functional Group and Expression Profiles

The gene browser AmiGO2 [30] was used to search for genes belonging to the gene ontology category “sperm individualization” (GO:0007291), a category that comprises all genes recognized to participate in the aforementioned processes. With this query, we obtained 54 genes, of which 1 was reported only for mammals (Spem1) and was not further considered, and the remaining 53 genes had been previously characterized in Drosophila melanogaster. The DNA coding sequences (CDSs) of these genes were retrieved (in September 2017) from FlyBase [31]. A preliminary blastx default search was conducted using these CDSs as query sequences, revealing that nine of these genes lacked obvious putative homologs in organisms other than Diptera. These genes (dj, dud, fan, mst101(3), nkg, ntc, soti, TTLL3B, and yuri; named based on Drosophila gene nomenclature) were excluded from subsequent analyses. The remaining 44 genes (Table 1) were retained for use in our phylogenetic study and were functionally categorized as (i) unbiased or (ii) sex biased, according to their expression profiles in Drosophila using data publicly available in modENCODE [27]. These expression profiles were mined from Affymetrix tiling arrays (Figure 1), designed to study transcription levels in a large number of Drosophila cell lines and developmental stages, using modMINE [32]. When the expression profiles of males were less than twofold higher or not more than twofold lower than those measured in females, they were not considered indicative of being biased (a criterion applied in previous studies; e.g., [17]). Five of the genes of interest (Cul3, Dark, didum, mlt, and orb2) lacked data in the Affymetrix tiling array experiments, and we deduced their sex-based functional profile based on RNA-seq transcriptome profiles available in modENCODE [27].

2.2. Retrieval of Sperm Individualization Gene Orthologs in Insects

The FlyBase IDs for the 44 genes of interest were used as queries to find putative orthologs and their corresponding eukaryotic orthologous group (EOG) identifiers in OrthoDB v9.1 [33]. We retrieved all insect amino acid sequences for each EOG from the database, together with descriptive information about the number of hits and taxonomic redundancy, as well as data on the relative amino acid sequence divergence of each orthologous group as a proxy for the evolutionary rate in each EOG [28].
The representation of Coleoptera in OrthoDB is currently restricted to six species of three infraorders of the suborder Polyphaga (Table 2). In order to increase the representation of Coleoptera in the sample, we mined the genes of interest from transcriptomic data from beetle species available from 1KITE. The species studied included representatives from all four suborders of Coleoptera (Table 2). Moreover, we also searched for these genes in published RNA-seq data from testis of Calligrapha multipunctata (Chrysomelidae), which we expected to be enriched in sperm individualization genes [22]. In order to identify the 44 genes of interest in the assembled beetle transcriptomes, we used the software pipeline Orthograph version 0.5.14 [34]. This software predicts the orthology of nucleotide sequences by mapping their amino acid translation to genes of known ortholog groups using a graph-based best reciprocal hit approach. The pipeline also performs an automatic correction for sequence orientation, frameshifts, and translation. For all Orthograph searches, we used the official gene sets (OGSs) of three reference species: D. melanogaster (dmel_r6.11; http://flybase.org/, [35]); the red flour beetle, Tribolium castaneum (v3.0; http://beetlebase.org/, [36]); and the leaf-cutting ant, Acromyrmex echinatior (v3.8; http://hymenopteragenome.org/acromyrmex/, [37,38]).
Each OGS included the 44 genes belonging to the EOGs of interest. Additionally, Orthograph required a tab-delimited file listing the name of the gene for each EOG and each reference species (obtained from OrthoDB). With this information, Orthograph retrieved from each OGS the genes of interest and aligned the amino acid sequences to create a profile hidden Markov model with which to conduct a forward search for respective candidate homologs in each of the beetle transcriptomes. The resulting hits were compared with a BLAST search against all genes in all OGSs (reverse search), and for each match between the best hit of the reverse search and the ortholog group of the original forward search, the corresponding transcript was assigned to that specific ortholog group [34]. Each Orthograph search produced the single best hit from each of the 1KITE transcriptomes mined for the study and generated separate files for each EOG, one with the original nucleotide data and one with their amino acid sequence translations, including the sequences of both the beetle targets and the reference species.

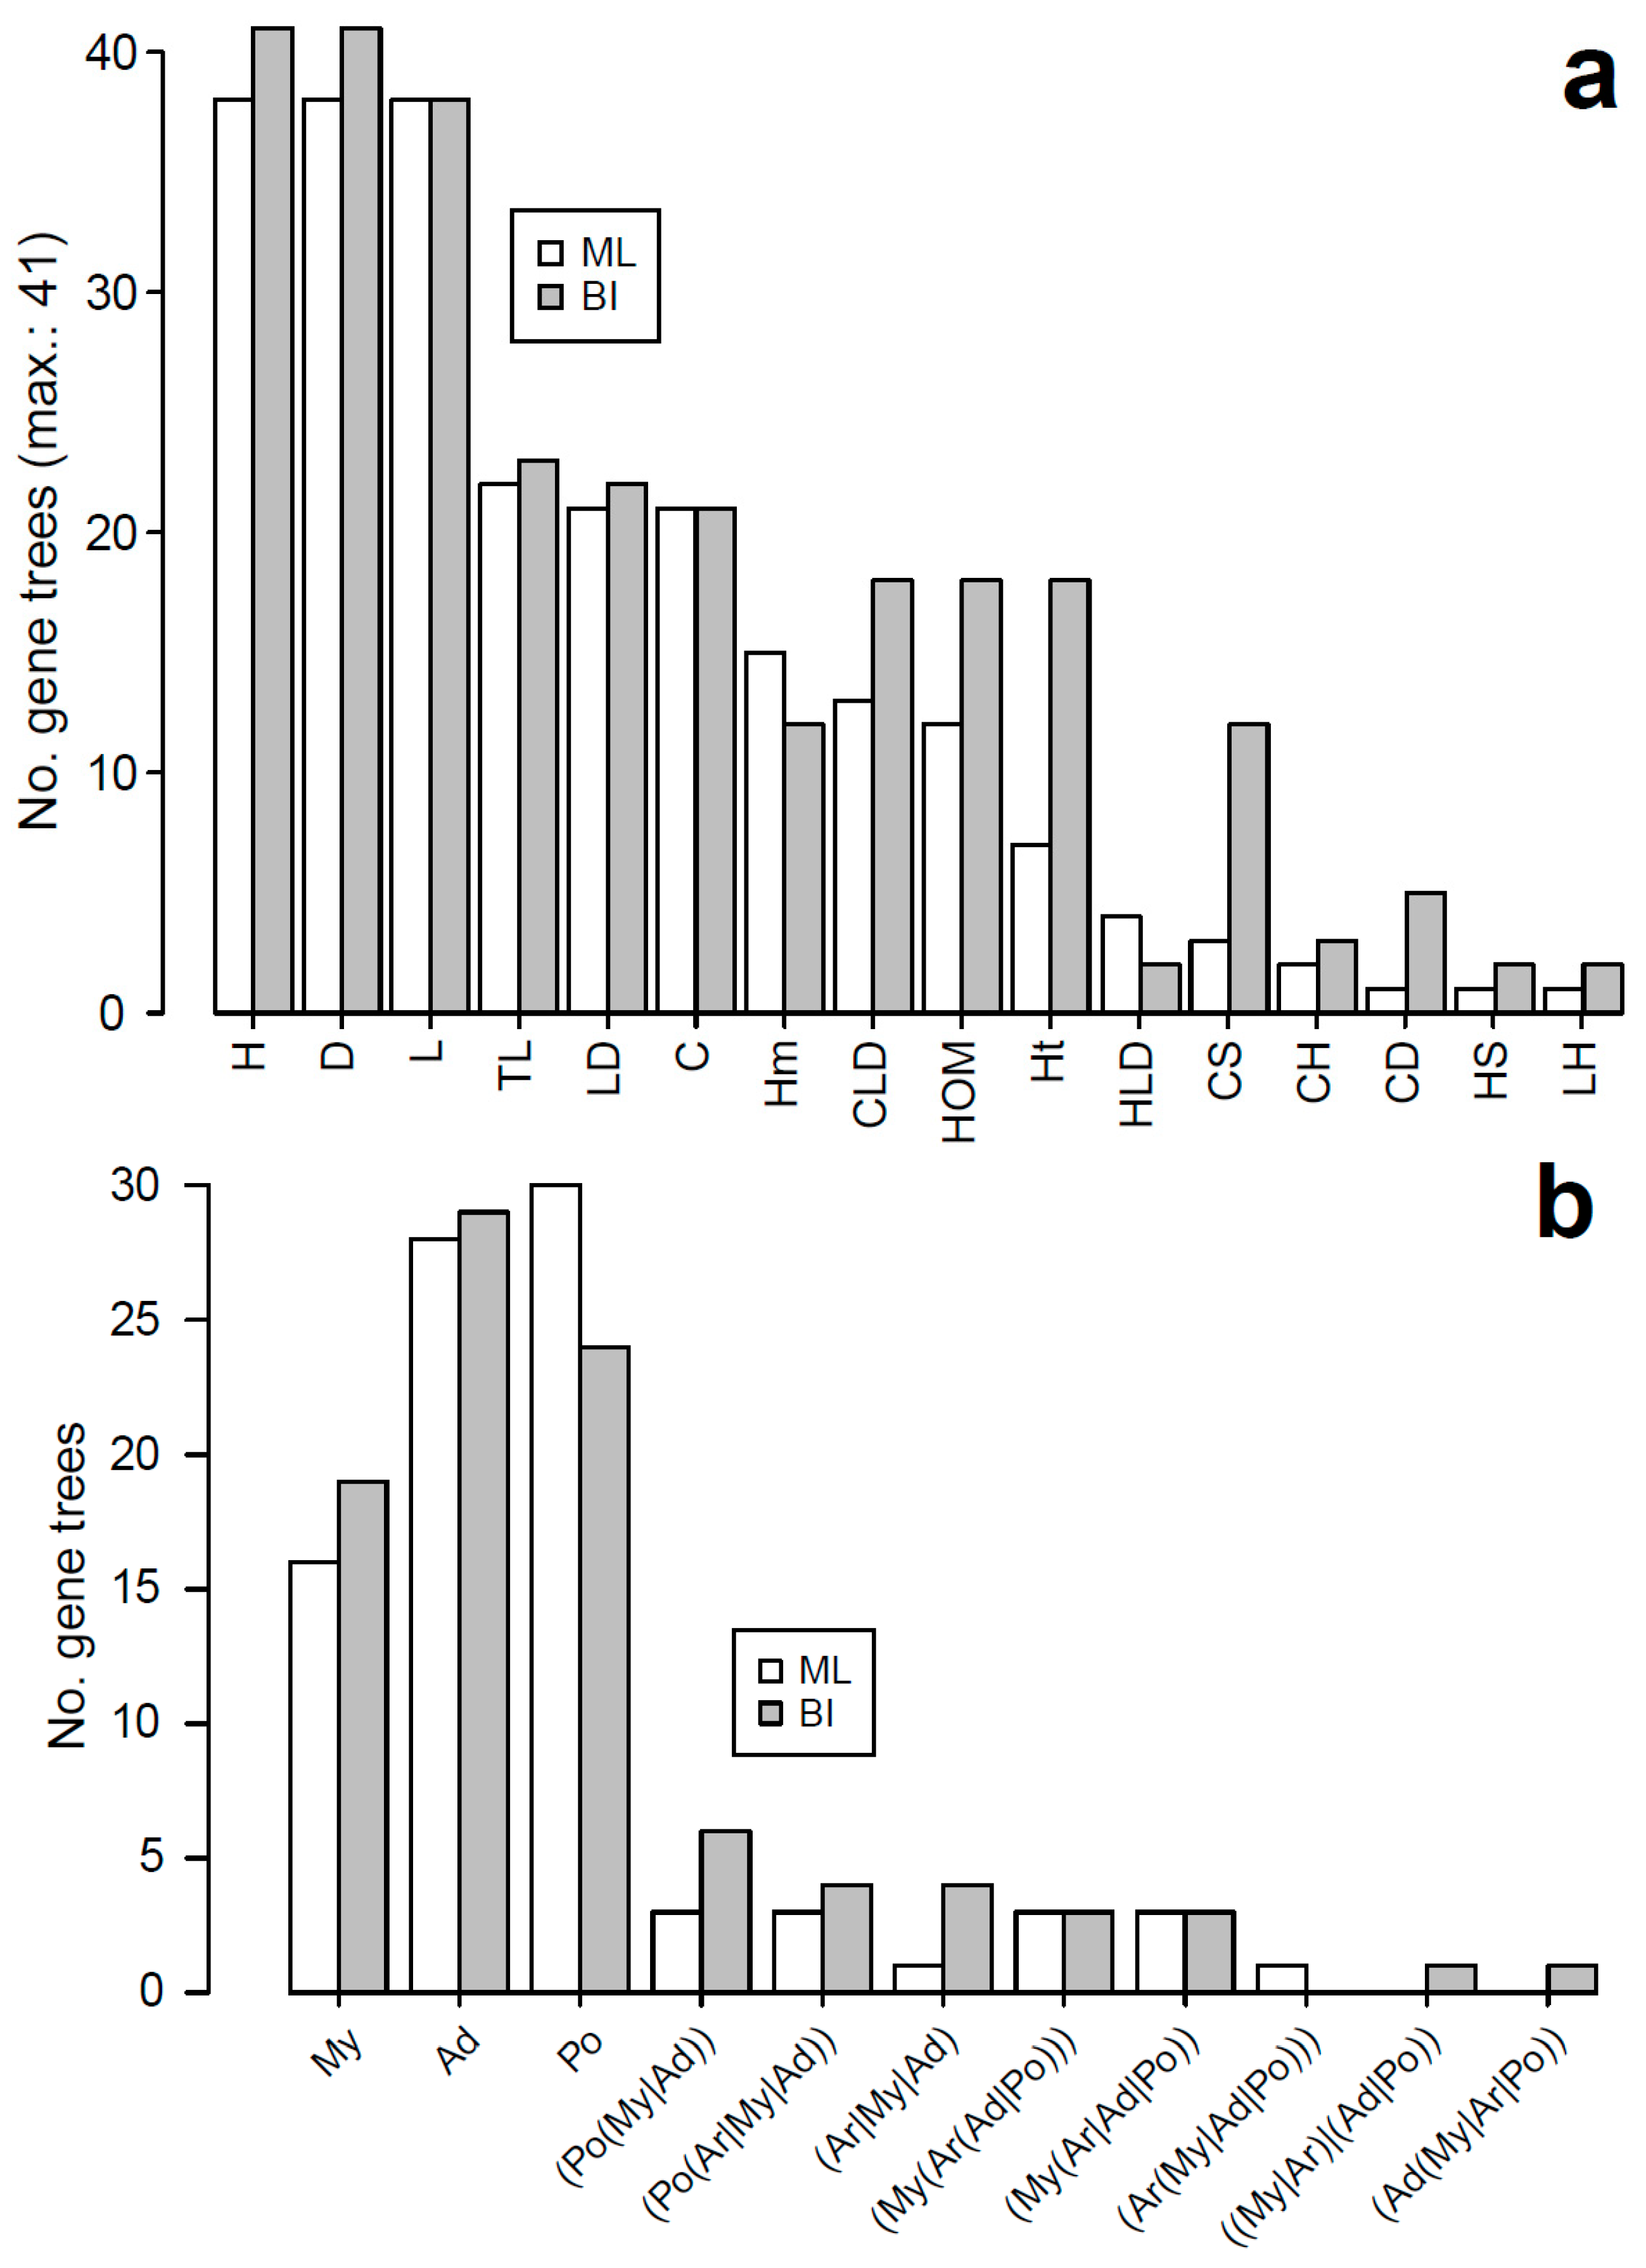
2.3. Phylogenetic Analyses of Amino Acid Sequences in Insects

Insect amino acid sequences from each EOG and those obtained from the output of Orthograph were aligned with the G-INS-i algorithm of MAFFT v7 [39]. Long autapomorphic insertions in these alignments, possibly corresponding to unrecognized introns, were trimmed manually, as were sequence ends of doubtful quality, typically showing as sequences unaligned beyond one point and longer than the remaining sequences in the alignment, suggesting that the reading frame had been lost and, therefore, the correct start or stop codons were not found either. In a few cases, the protein was retrieved from OrthoDB or the beetle transcripts as disjoint amino acid fragments coming from non-overlapping sequenced transcripts of the same gene. In these cases, the full protein length was reconstituted, and gaps between fragments were filled with missing data. Sequences were secondarily removed from the alignments if they (i) consisted of short fragments usually spanning less than 50% of the gene; (ii) were highly similar and monophyletic for a given species; and/or (iii) were highly divergent in the context of the variability of the alignment, the latter two features assessed based on preliminary phylogenetic analyses of the data.
The resulting purged alignments (deposited in Zenodo.org: 10.5281/zenodo.3380181) were analyzed using SMS [40] to identify the models of amino acid sequence evolution best fitting the data. The resulting models were used in maximum likelihood (ML) tree searches executed using the program PhyML v3.0 [41]. Since some of the genes of interest are multi-copy (in principle, OrthoDB identifies duplicated genes from isoforms resulting from alternative splicing), several gene alignments included many more sequences than taxa, and phylogenetic analyses allowed us to easily recognize when these extra sequences represented gene duplications affecting particular taxa or entire clades. In the former case, one representative of an intraspecific duplication was retained, and in the latter, duplicated versions of the gene were separated into independent alignments, which we realigned with MAFFT. Of the gene variants studied, the one including the sperm individualization gene copy in Drosophila was analyzed, assessing the best-fitting evolutionary model again with SMS. ML gene trees were inferred using PhyML, and statistical measures of nodal support were estimated via 100 bootstrap pseudoreplicates.

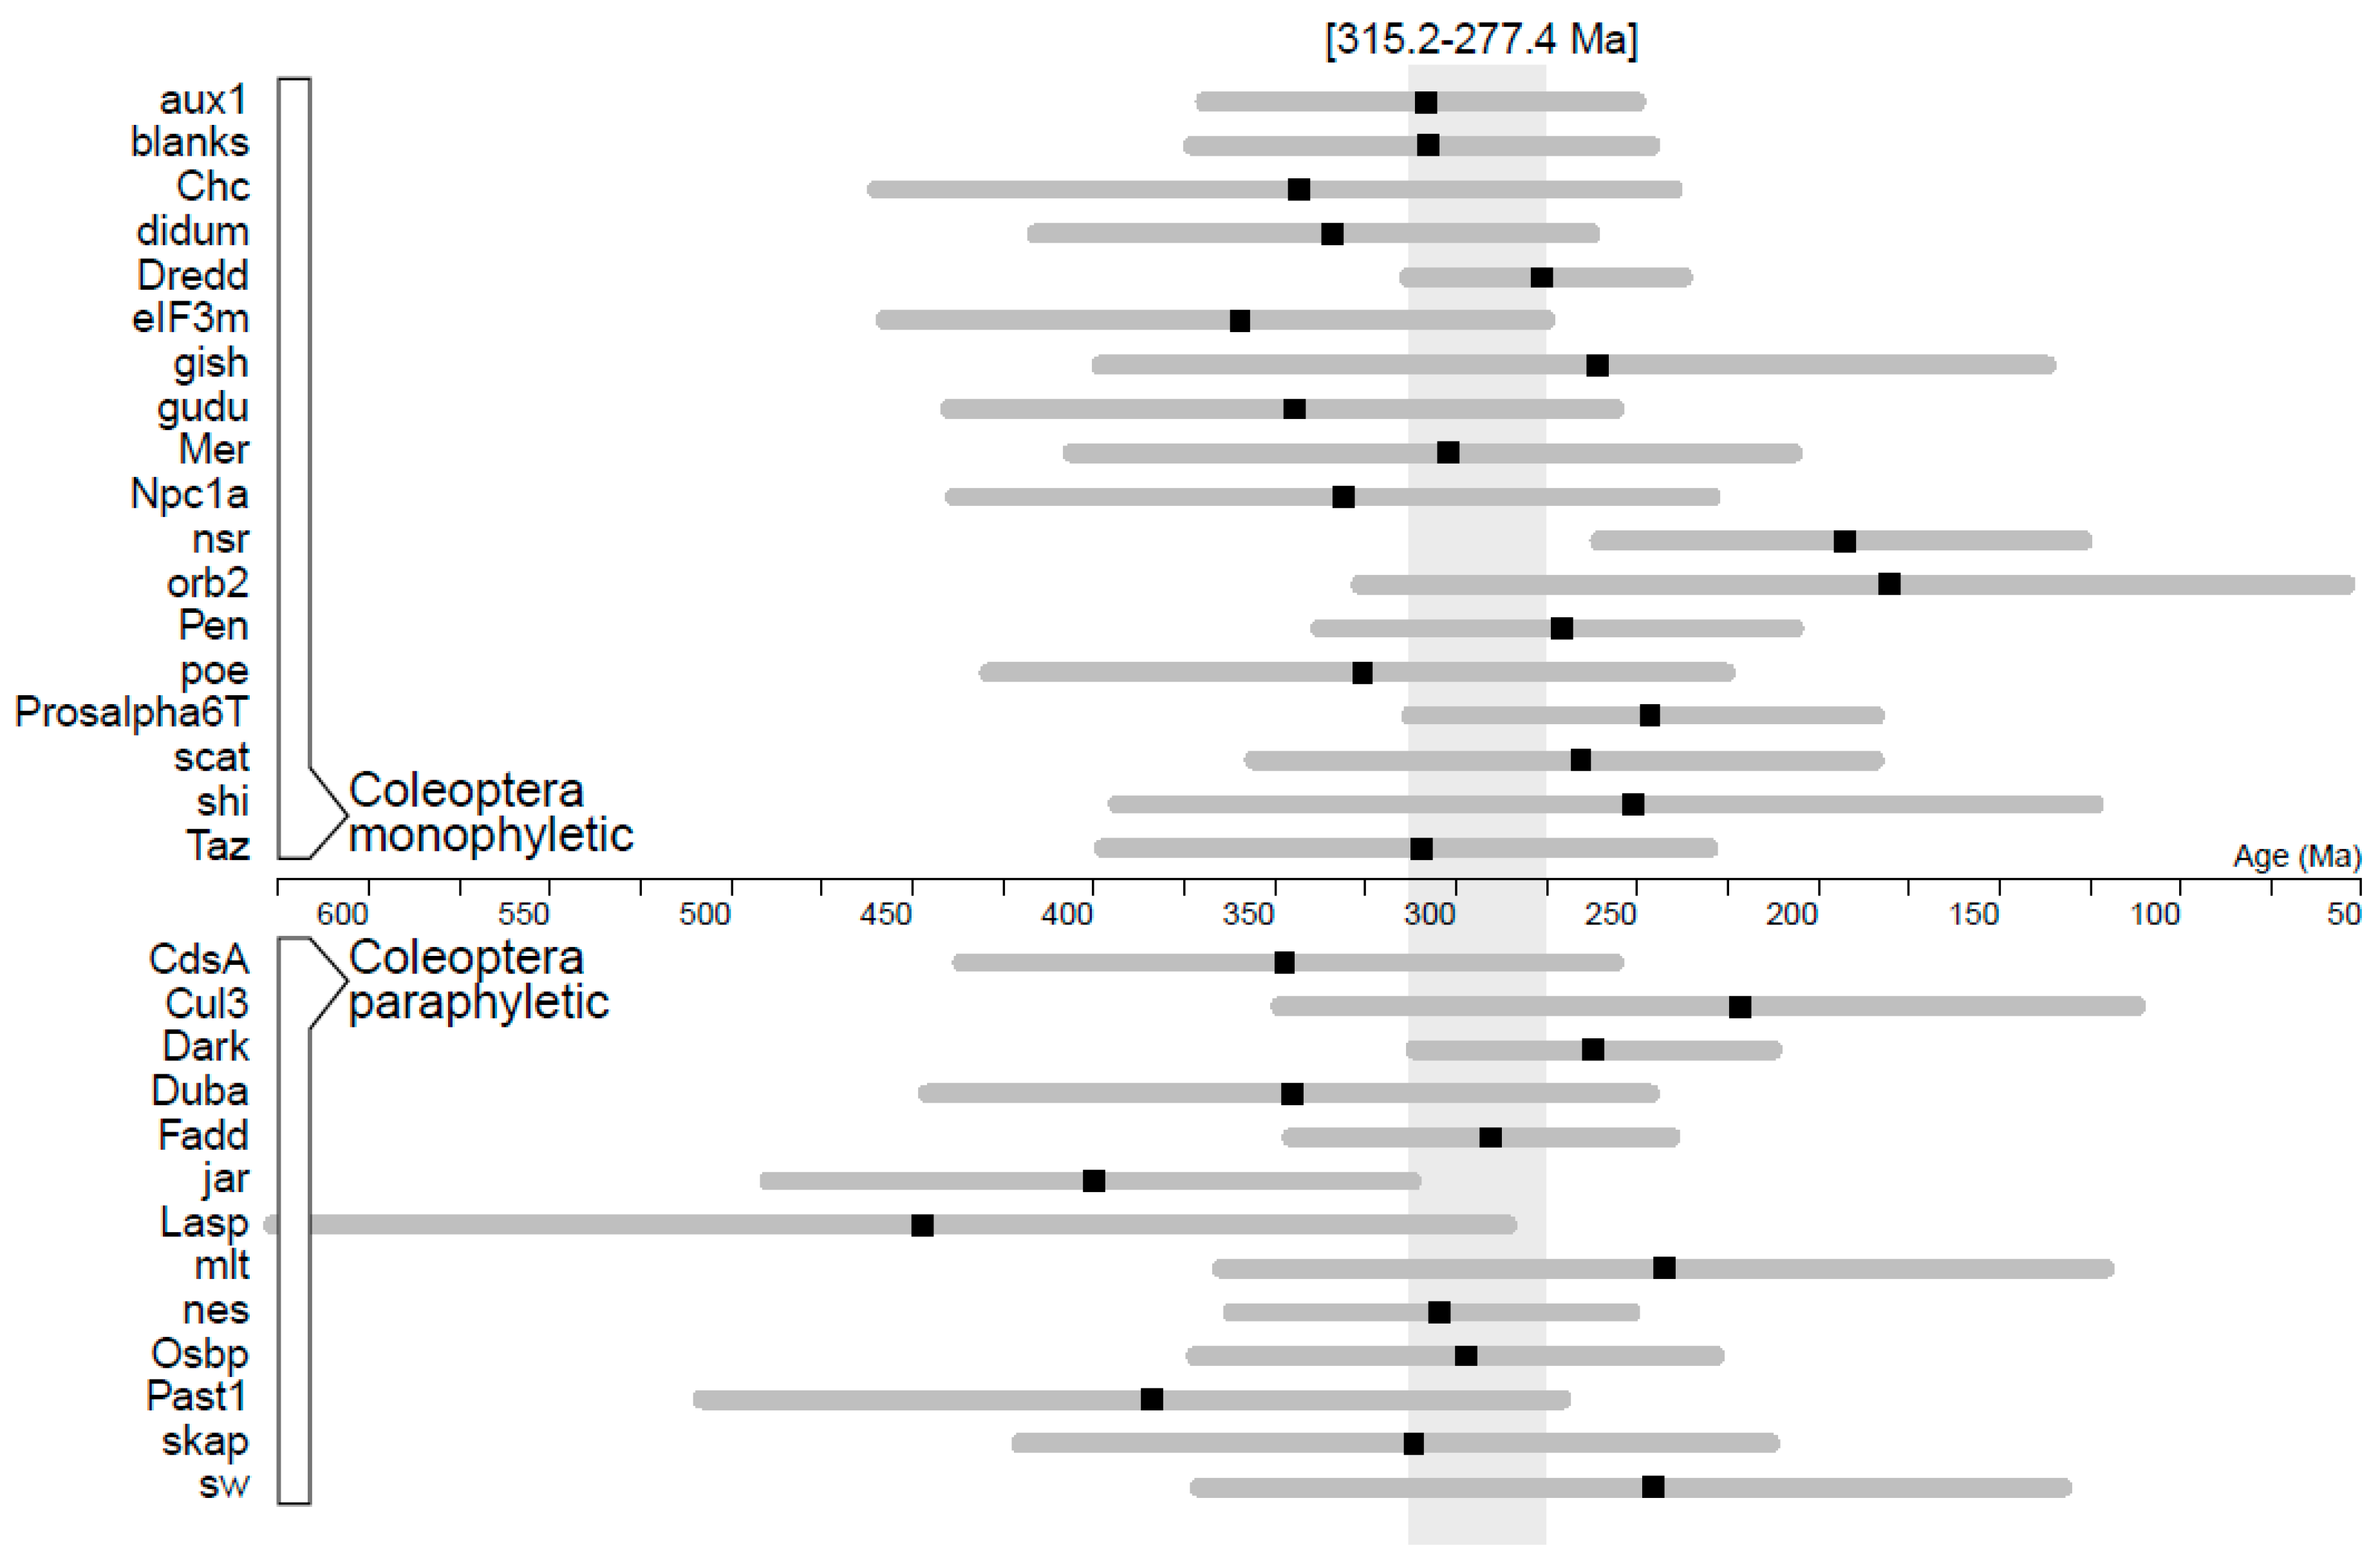
2.4. Phylogenetic Analyses of Nucleotide Sequences in Beetles

Nucleotide sequence matrices of the genes of interest for Coleoptera were generated by combining the sequences retrieved using Orthograph with the corresponding orthologs of model beetle species (Table 2). Data from model beetle species and from a hemipteroid (to be used as an outgroup in the analyses) were obtained with blastn searches against the nucleotide collection (nr/nt) at NCBI. The match of the retrieved nucleotide sequences with the amino acid sequence obtained from OrthoDB for the same organisms was confirmed with a subsequent blastx search against the reference proteins (refseq_protein) database, also at NCBI. Nucleotide sequences were aligned using the G-INS-i algorithm implemented in the program MAFFT. Low-quality ends were trimmed and short sequences removed, as above. The aligned sequences were also translated into amino acid sequences to assist the alignment by finding reading frame problems and highly divergent regions, which were secondarily removed. ML phylogenetic analyses were implemented using these aligned datasets and the same methods described above for the amino acid data.

2.5. Estimation of Evolutionary Rates

With very few exceptions, the ML gene trees based on amino acid sequences recovered Hymenoptera and Diptera each as monophyletic and usually with strong (typically 98–100%) bootstrap support. These two clades have particularly well-established age estimates based on independent analyses. They were used as calibration points in Bayesian analyses of evolutionary rates and node dating for each gene tree using the software BEAST v1.8.4 [42]. The nodes for these two clades were consistently constrained as monophyletic in all analyses to avoid uninformative topologies, particularly for genes with low phylogenetic signal, and the calibration densities for the time to their most recent ancestors were modeled as follows. For Hymenoptera, we specified a crown age of 309 Ma (291–347 Ma) after [43], approximately modeled in BEAST as a normal distribution with mean = 309 and Stdev = 10; in turn, the crown age of Diptera was assumed to be 265 Ma (256–269 Ma) according to [44] and approximately modeled as a normal distribution with mean = 265 and Stdev = 5. The analyses used substitution models as determined with SMS, an uncorrelated lognormal relaxed clock [45], and a tree prior under the Yule process. The analyses were run initially for 100 million generations, sampling every 10,000th generation, but in most cases, they had to be replicated and results combined until there was good mixing of parameters and all produced stable estimates with acceptably high effective sample sizes (ESS >> 200). In a few cases, typically involving datasets that clearly deviated from a molecular clock (i.e., value of ucld.stdev > 3), the multiple analyses produced erratic results; here, stable results were obtained using an exponential relaxed distribution. Evolutionary rates, as well as node ages, were calculated using Tracer 1.6 [46] on the annotated maximum clade credibility trees obtained by summarizing the post burn-in trees with LogCombiner 1.8.4 and TreeAnnotator 1.8.4 [42]. Nucleotide substitution rates in beetles were assessed using a similar strategy but with constraining the age of Coleoptera using a normal distribution covering the age range based on the estimate for this order as deduced from the previous analyses. Specifically, we extracted this age as the concordant overlap of all confidence intervals for this parameter in the amino-acid-based trees where Coleoptera was monophyletic.

2.6. Statistical Analyses

We tested the hypothesis of no differences in the evolutionary rates of sex-biased genes relative to unbiased genes using a Mann–Whitney U test [47] at a 0.05 significance level, as implemented in the function “wilcox.test” of the R package Stats 3.6.0 [48]. The same test was used to investigate rate differences between genes found as single-copy and as members of multigene families, as well as between genes coordinated in the gene cascade for sperm individualization versus genes participating in this function but not implicated in this interaction network (see below). Finally, genes were tested for differences in absolute evolutionary rates between two main categories based on the overall constancy of those evolutionary rates: genes with relatively homogeneous rates (parameter ucld.stdev < 0.6) and genes with heterogeneous rates (ucld.stdev > 0.6). These tests were conducted using substitution rates estimated from the insect amino acid data and substitution rates for beetles estimated from nucleotide data. In order to recognize possible interactions of the explanatory variables used in these tests, chi-squared permutation contingency tests of independence were run for each pair of categorical variables used to rank all genes, including expression bias, paralogy, network interaction, and rate heterogeneity. These tests used the “perm.ind.test” function of the R package wPerm 1.0.1 [49] with 9999 randomization replicates. In all tests, sample sizes allowed for low type I error rates, between 5% and 10% (Power = 0.80).

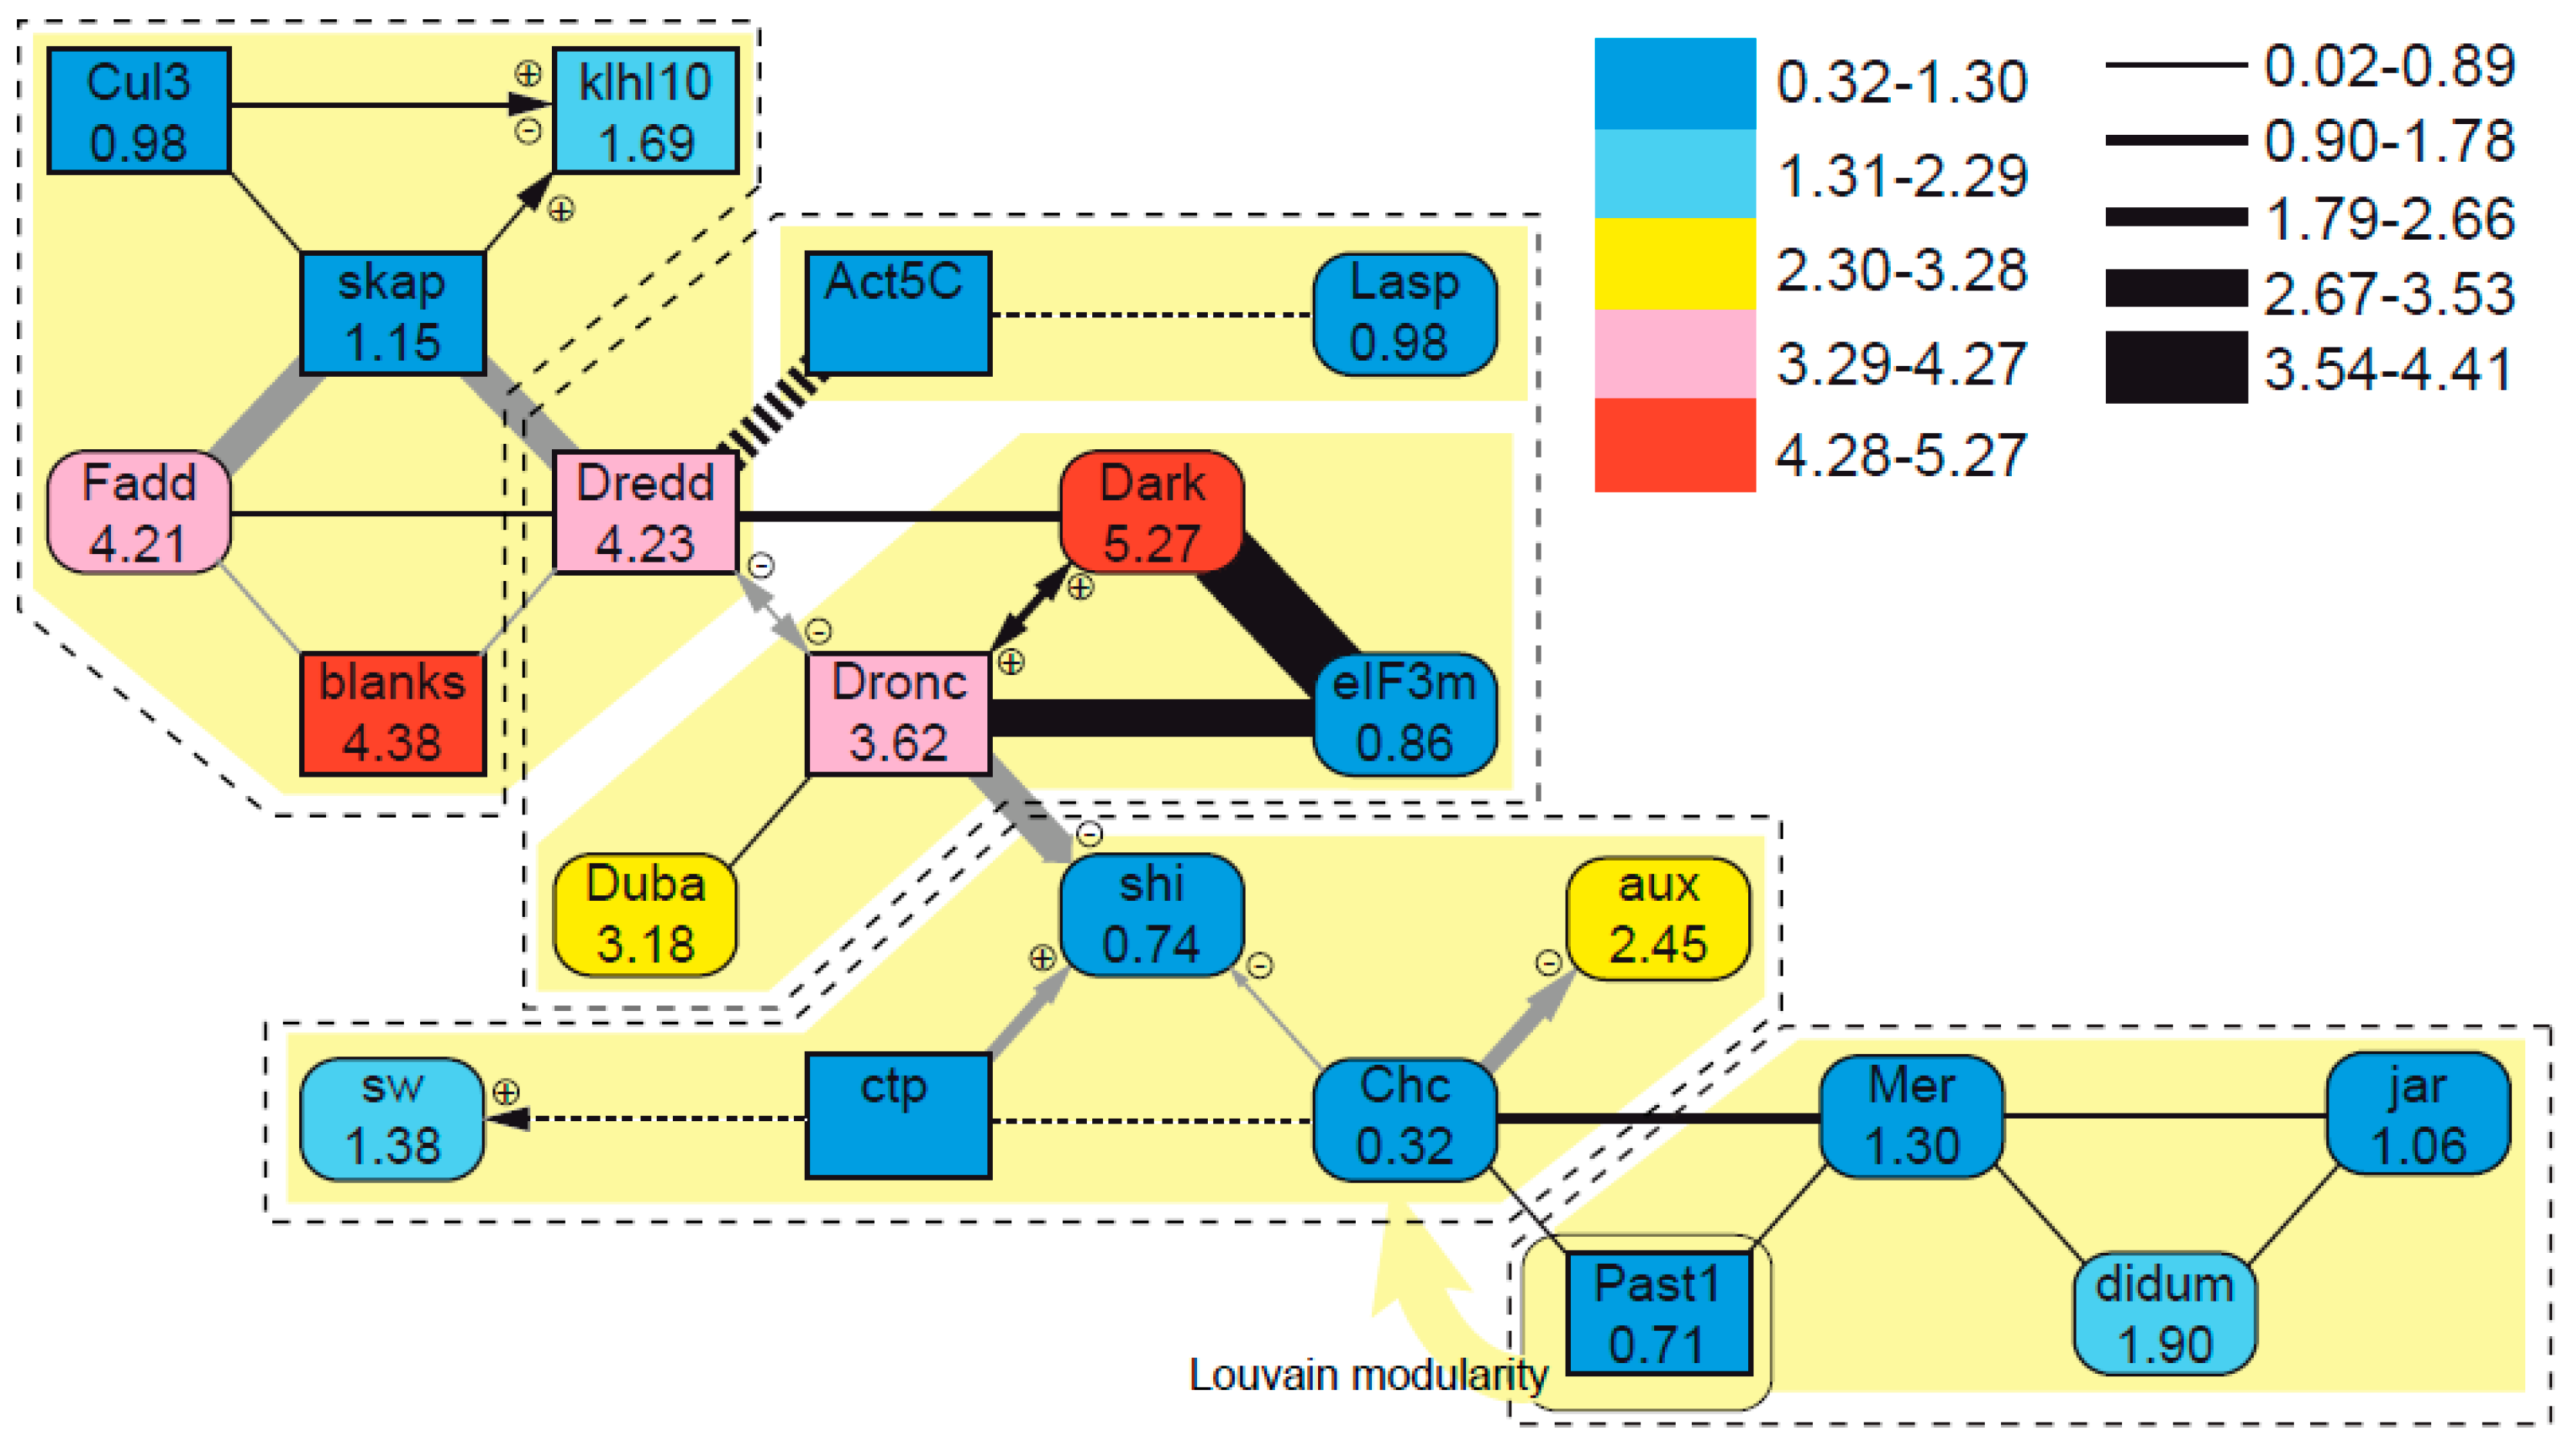
2.7. Analyses Constrained by Gene Interactions

Public databases were used to define the subset of physically or genetically interacting genes among those sharing sperm individualization as a unifying function. Specifically, we established the interaction network of Drosophila melanogaster as an interaction model by extracting the information about specific protein–protein physical interactions from BioGRID version 3.4 [50] and that about genetic interactions in metabolic pathways from FlyBase [31]. The obtained graph included 21 nodes (i.e., genes) and 28 edges (i.e., interactions), and the architecture of interactions was used to explore correlations with the evolutionary properties of this subset of genes and with other gene characteristics, including evolutionary rates, patterns of gene duplication, and sex-biased gene expression. Since these genes are not isolated in their function and their interactions, we also considered the total number of known interactions per gene, as shown in BioGRID, as a measure to modulate node importance. We tentatively corrected node importance in every case, calculating the logarithm of the product between node centrality and the absolute number of known interactions per node.
Statistical network analyses were carried out with the aid of R tools implemented in the “igraph” package [51] on the undirected connected graph representing all interacting genes. Measures of node centrality or node "importance" in the networks were obtained relative to the number of receiving edges (“closeness”) or their rank (“eigen_centrality”). We estimated the correlation between these variables and evolutionary rates and gene paralogy based on the Spearman rank-order correlation coefficients. Additionally, the network community structure was explored with several node modularity optimization algorithms in “igraph”, including the Clauset–Newman–Moore algorithm (command “cluster_fast_greedy”) and the Louvain method (command “cluster_louvain”; [52]), as well as exact modularity maximization (command “cluster_optimal”) using the algorithm published by [53]. Modularity was also estimated by considering edges instead of nodes and using the algorithm (command “cluster_edge_betweenness”) proposed by [54]. We tested for the existence of differences in evolutionary rates for each resulting group using the Kruskal–Wallis test [55]. Additionally, the homogeneity of rates between bipartitions of the network defined by each of the edges separating groups was investigated using a Mann–Whitney U test at a 0.05 significance level.

3. Results

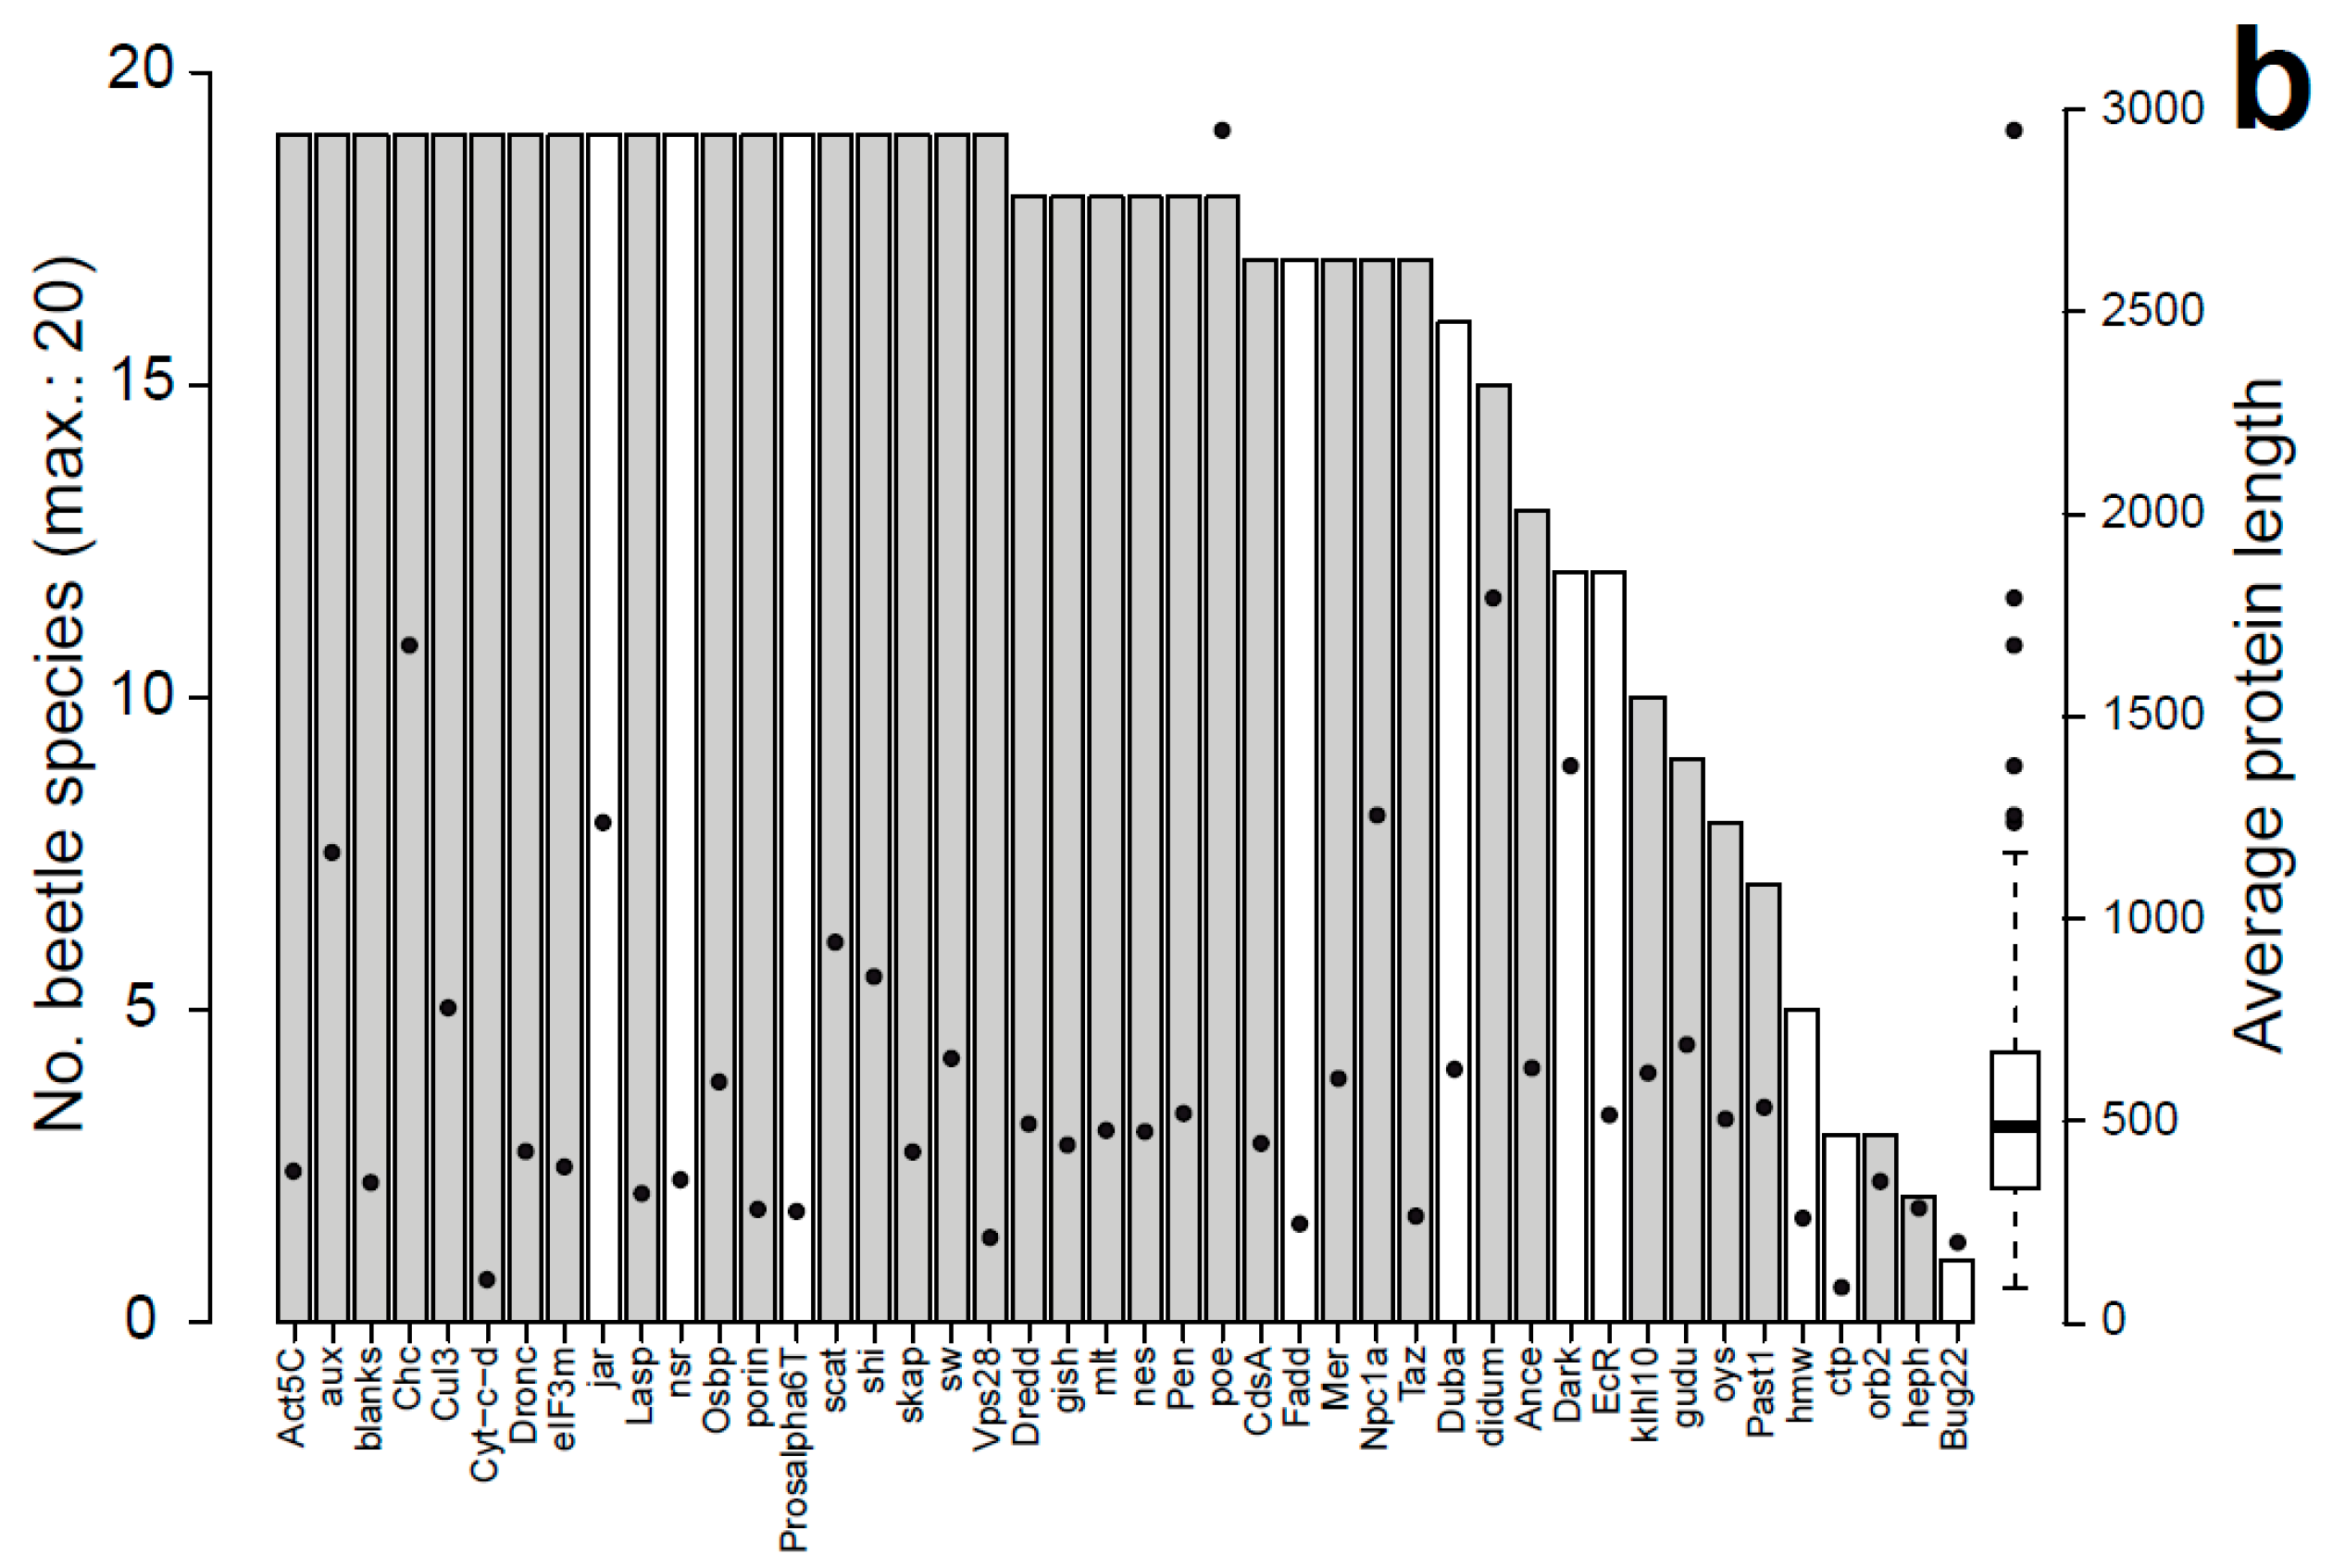
3.1. Characteristics of Datasets: Composition of Sequence Alignments

The 44 investigated genes involved in sperm individualization (GO:0007291) were present in the subclass Pterygota (winged insects), both in Palaeoptera (mayflies and odonates), which were used as outgroups in all analyses, and Neoptera (the remaining orders of winged insects). Most of these genes showed unbiased patterns of gene expression in Drosophila, except for eight genes (Table 1). Given the lack of similar functional studies in most other insects, these eight genes represented our hypothesis for biased expression in the insect and beetle datasets. The median length of the associated proteins ranged from 89 amino acids in the case of ctp to 2949 amino acids in the case of poe, with an average of 638 ± 529 amino acids per protein.
For most of the genes, OrthoDB contributed the amino acid sequences of the six beetle model species to the Coleoptera subset (Figure 2b). The only exceptions were Bug22, ctp, Dark, EcR, Fadd, jar, nsr, and Prosalpha6T, which lacked data for one of the species, Duba for two, and hmw for five. Mapping of orthologous genes using Orthograph from transcriptomes of a selection of 19 beetle species from the 1KITE Project and one testis-specific transcriptome from another beetle species resulted in positive hits in all cases, although with different success rates, possibly related to the quality or source of the transcriptomes. No single species yielded ortholog sequence data for all tested genes, with Rhyzobius pseudopulcher retrieving the highest number of genes (40 out of 44) and two water beetle species, Gyrinus marinus and Noterus clavicornis, retrieving the lowest (27 and 11 genes, respectively). For 70% of the beetle species, we retrieved at least 75% of the genes (Figure 2a). In turn, for all genes analyzed, we found orthologs in the beetle transcriptomes, but with different success rates (Figure 2b). A large proportion of genes (43.2%) were found in at least 19 out of 20 beetle species, and most of them (72.7%) were found in 15 or more beetle species. Conversely, eight genes could not be found in at least half of the species analyzed, with genes such as hmw, ctp, orb2, heph, and Bug22, showing the lowest recovery frequencies (n ≤ 5). The proteins encoded by these genes were shorter than the average but were also typically lacking recognized orthologs in some of the beetle model species (Figure 2b).

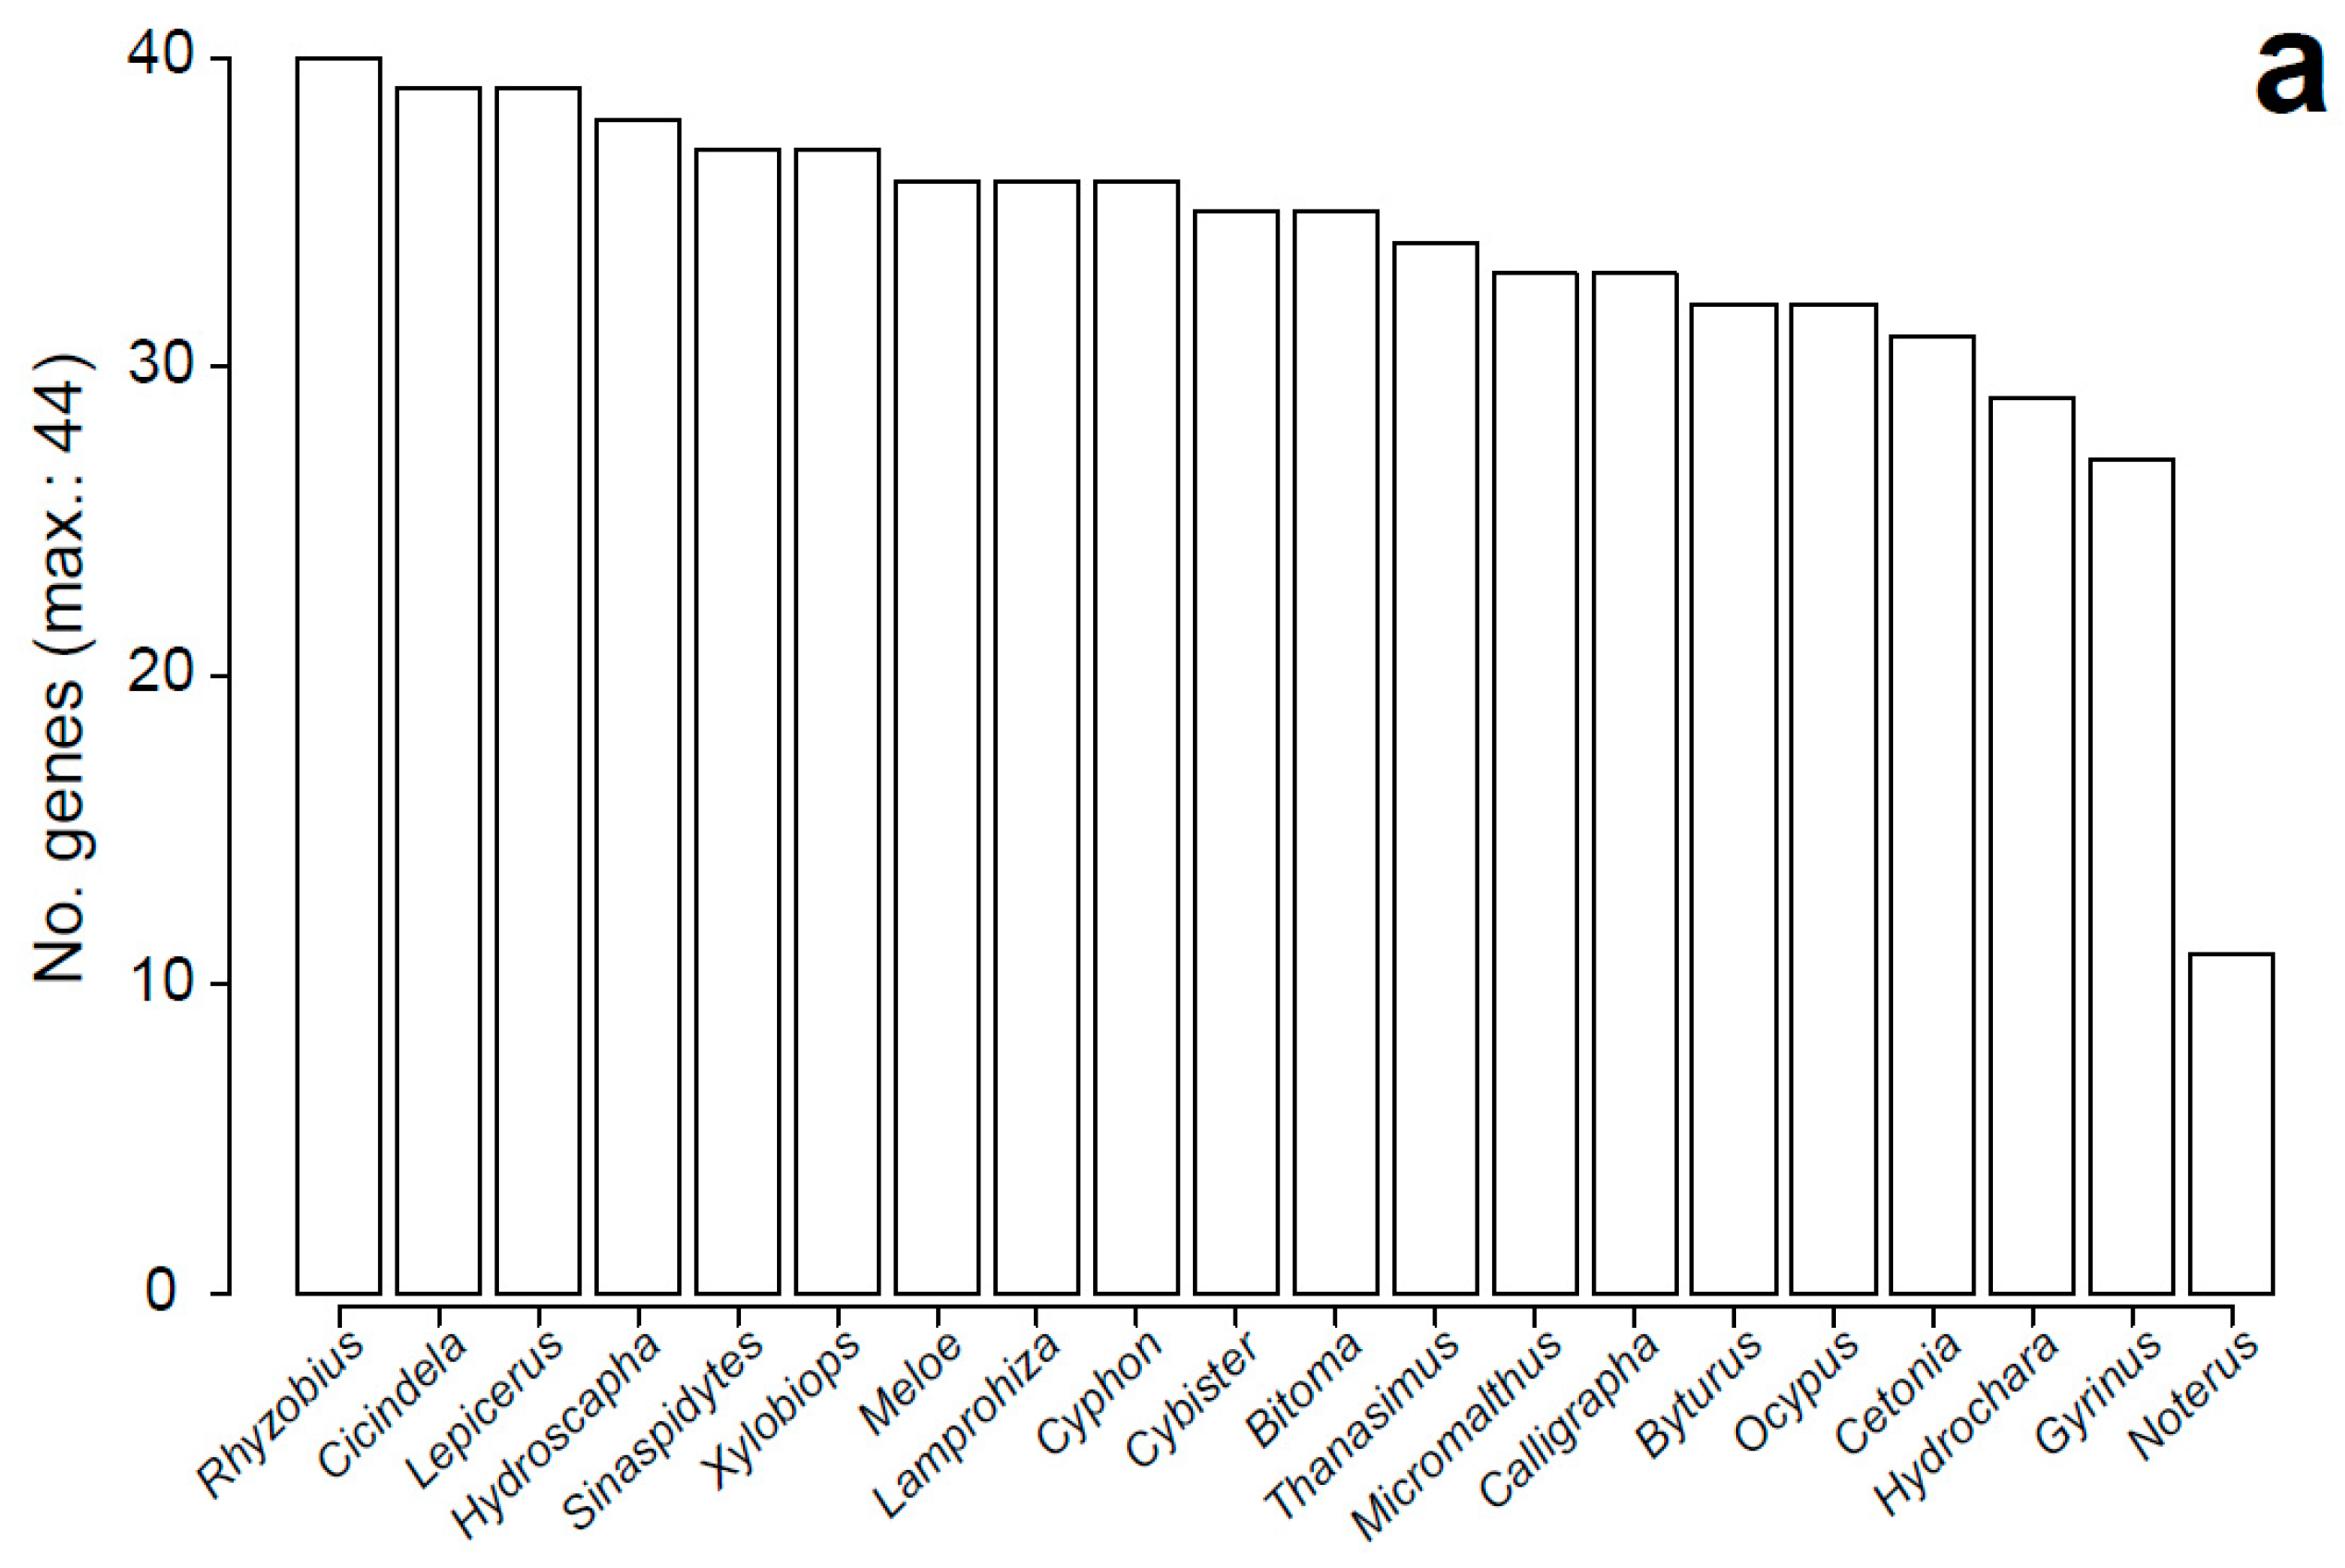
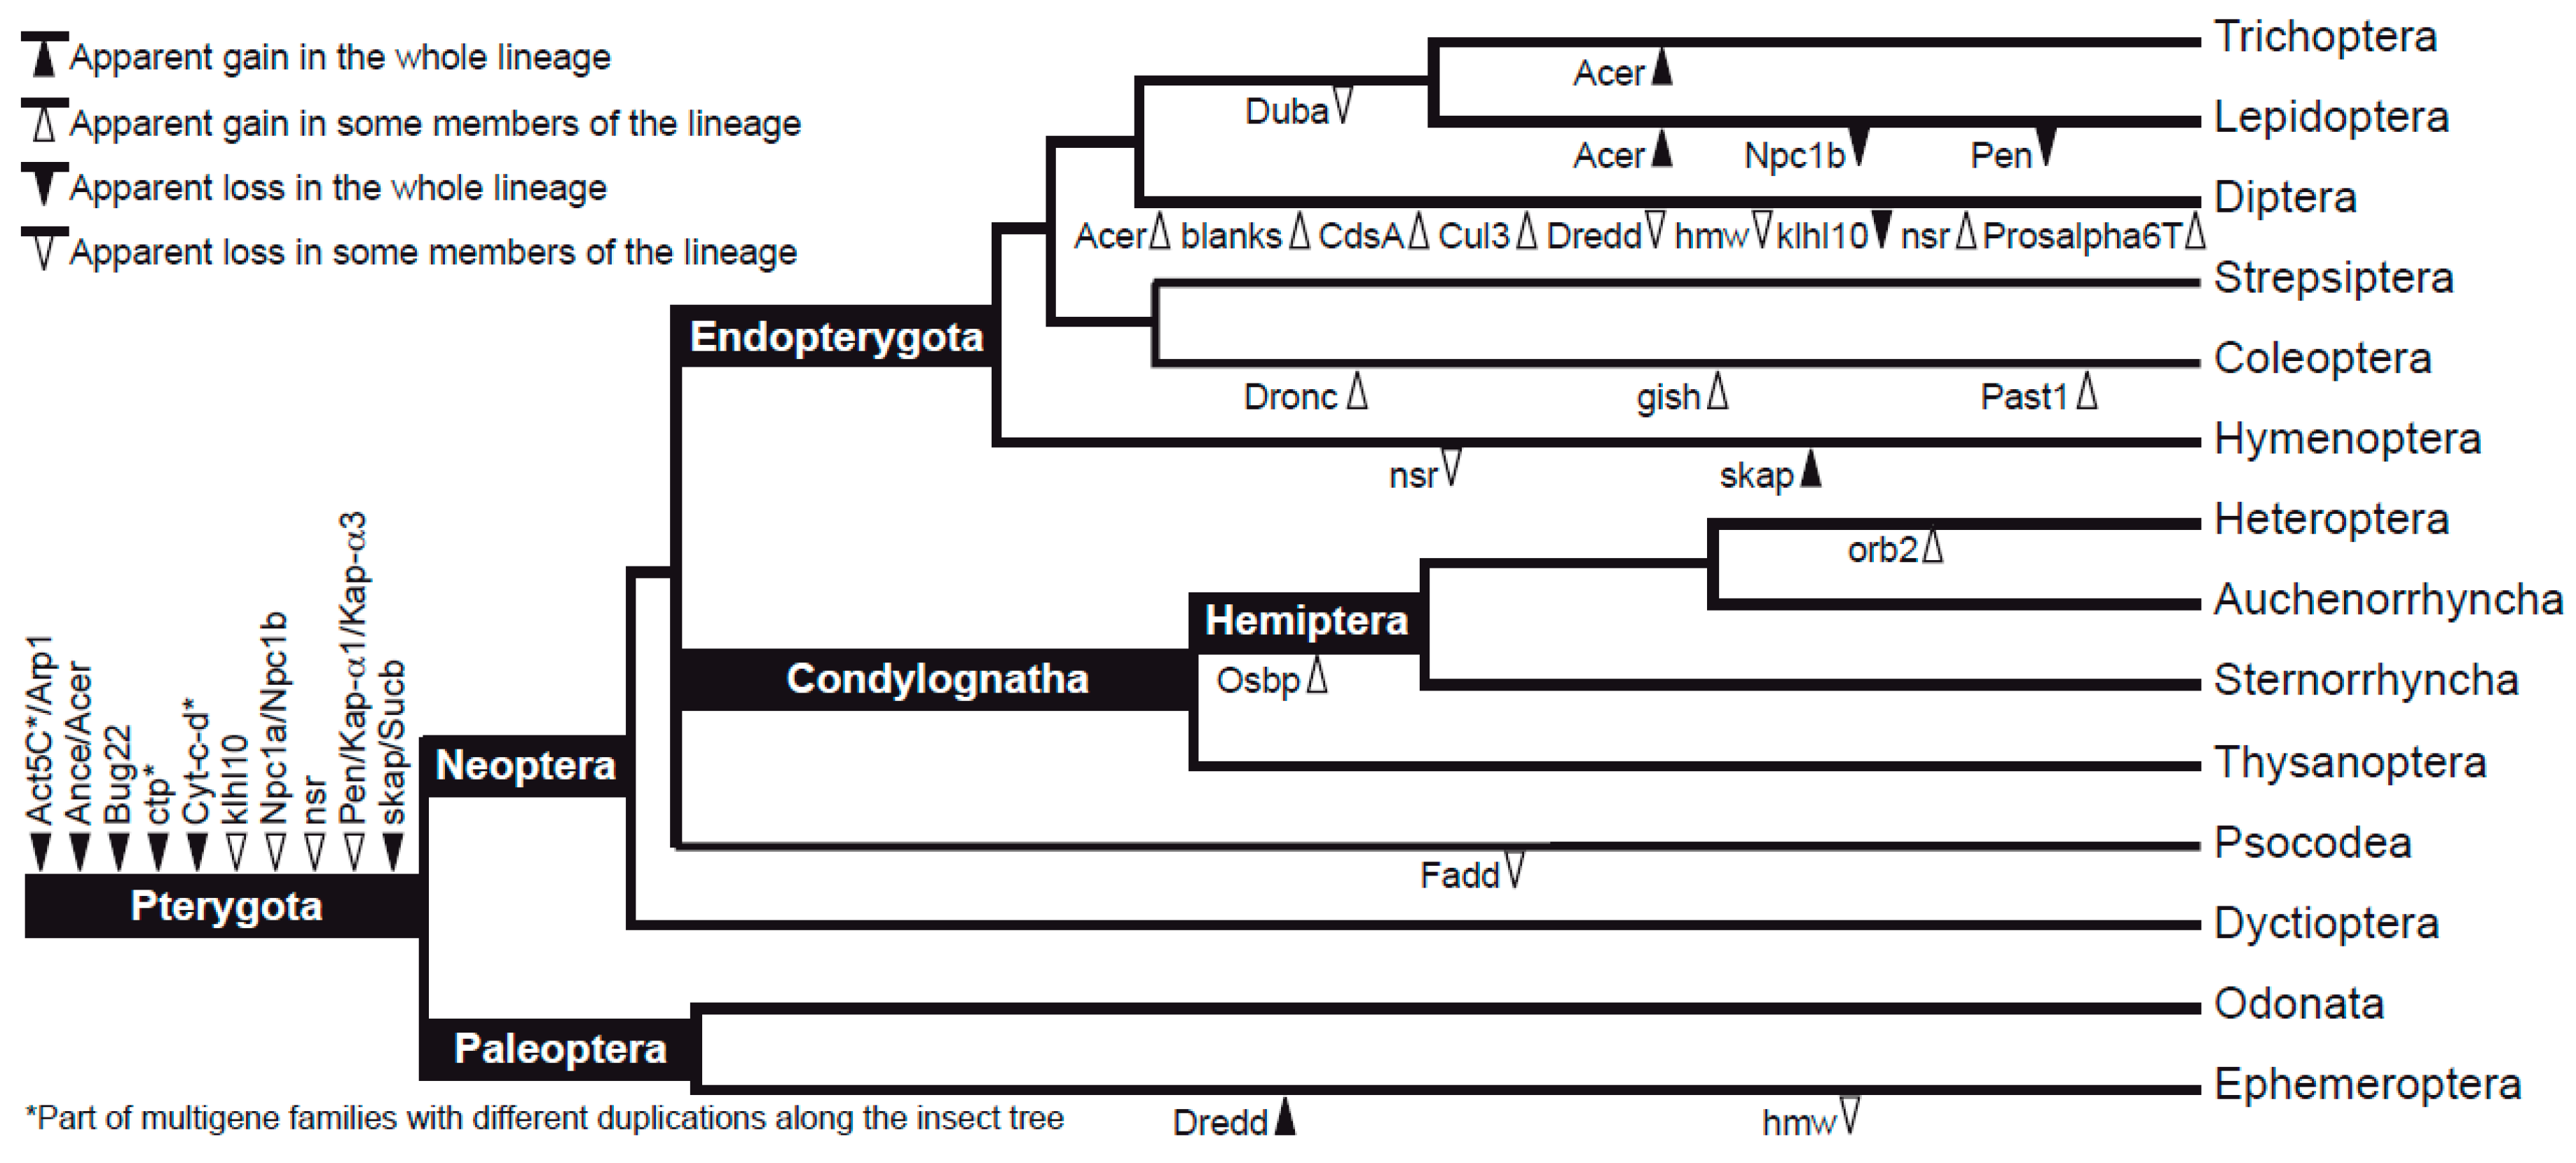
3.2. Characteristics of Datasets: Gene Duplications

At the time of this study, OrthoDB curated data for 119 insect species. When more than 119 sequences were retrieved for a particular gene, this informed in most cases of potential multi-copy genes (Table 3). Their actual presence was confirmed in the ML trees when including all the sequences retrieved from OrthoDB and the beetle sequences mined from 1KITE. In these cases, we used the annotation of the D. melanogaster sequence to recognize the sperm individualization paralog of interest. Figure 3 shows a diagram of gene duplications (and some secondary gene losses) as recognized in this study.
For a total of 21 genes, we had no evidence for duplications or losses in the winged insect lineage. However, 18 genes showed duplications in Pterygota or parts of this evolutionary lineage. Two of these genes, Act5C and Cyt-c-d, were found as part of multigene families, and it was difficult to tell individual copies apart with the available data and as a result of their high similarity. Act5C is part of a gene complex with a deep split in all insects, including actin-related proteins (Arp1 in Drosophila) and several actins resulting from various duplications. We found evidence for at least six actin-like gene copies in Acalyptratae flies (fruit and peacock flies, among others), five in mosquitoes, four in Hymenoptera and Palaeoptera, at least three in Coleoptera and the hemipteroids, and at least two among Lepidoptera. Act5C, in particular, is highly conserved in the whole of Pterygota, and most of the available beetle sequences were retrieved close to this specific Drosophila paralog in the phylogeny. In turn, Cyt-c-d was revealed as a member of a multigene family in most insect groups, including odonates, some hemipteroids, beetles, and some dipterans. The proteins encoded by these genes are short and highly conserved, so paralogs could not be resolved easily, but most beetle sequences retrieved by Orthograph were more similar to the Cyt-c-p copy of the gene in Drosophila. Finally, ctp corresponded to a very short fragment, highly conserved and with evidence for paralogy, though it was not possible to discriminate gene copies. Given the difficulty of discerning orthologs, these three genes were not considered in downstream analyses.
Seven of the duplicated genes—namely, Ance/Acer, Bug22, klhl10, Npc1a/Npc1b, nsr, Pen/Kap-α1/Kap-α3, and skap/Sucb—were duplicated in all studied insects and, in some cases, with one of the copies being subsequently lost or further multiplied in particular lineages. For example, orthologs of the Npc1b and Pen copies were lost in Lepidoptera, the sister copy of klhl10 was lost in Diptera, and one copy of nsr was lost in aculeate Hymenoptera. Acalyptratae (Diptera) had three additional copies of nsr (four in Bactrocera tephritid peacock flies); Acer was duplicated independently in Trichoptera, Lepidoptera, and some Diptera; and skap had an additional copy among the Hymenoptera. Overall, 10 genes had lineage-specific duplications. Dredd had several copies in Ephemera alone; orb2 and Osbp were duplicated in some hemipterans; and for Dronc, gish, and Past1, we found evidence for duplications in Coleoptera. Finally, the remaining four genes were duplicated in Diptera: blanks and Cul3, with fast-evolving copies in some dipterans; CdsA in some nematocerans (midges and moth-flies); and Prosalpha6 in Drosophila alone (wherein only the paralog Prosalpha6T, perhaps missing in all the other insects, is male biased). Apart from the lineage-specific losses found for Npc1b, Pen, and the sister copies of klhl10 and nsr, other gene losses detected in our data set affected Dredd (missing in mosquitoes [Diptera: Culicidae]), Duba (lacking in Trichoptera and Lepidoptera), Fadd (absent in some Hemiptera), and hmw (not recorded in Ephemera [Ephemeroptera] or Anopheles [Diptera]).

3.3. Evolutionary Rates of Sperm Individualization Genes in Insecta and Coleoptera

Amino acid sequence matrices of the orthologous sperm individualization genes of insects and nucleotide sequence data of Coleoptera were used to infer gene trees under ML and Bayesian inference and to estimate evolutionary rates (Supplementary Files S1–S4). In general, both methods produced similar gene trees, e.g., with respect to resolving the relationships of the insect orders and some infraordinal relationships (Figure 4a), usually with relatively strong nodal support, and consistent with the current systematic knowledge for insects [56]. However, most trees had relatively poorly resolved deep relationships, particularly within the hemimetabolous insect orders, which were represented by relatively few taxa. In turn, in most beetle trees, the suborders represented by several species were retrieved as monophyletic, but there was no consensus among trees on subordinal relationships (Figure 4b). However, in most cases the topologies were consistent with Polyphaga being sister to the other three suborders (Adephaga, Myxophaga, and Archostemata).
Based on the previous phylogenies, the amino acid substitution rates for 41 proteins encoded by sperm individualization genes (excluding the 3 proteins for which orthology could not be confirmed) spanned nearly two orders of magnitude, from 0.000237 amino acid changes per lineage and million years (subs./l./Ma) in the protein orb2 to 0.009667 subs./l./Ma in the protein hmw (Table 4). The average substitution rate for the whole dataset was 0.00239 ± 0.003012 subs./l./Ma. Slightly over half (56%) of these proteins, typically those with lower overall substitution rates, exhibited evolutionary rates inconsistent with a molecular clock, i.e., rates on individual branches with more substantial departures from the mean (ucld.stdev ≥ 0.6).
The analyses of evolutionary rates yielded age estimates for the clade Coleoptera with averages ranging between 180.4 Ma, in the case of orb2, and 451.5 Ma, in the case of Lasp, with broad confidence intervals of 186.2 ± 62.49 Ma on average (Table 4). Coleoptera was recovered as monophyletic in 18 of the analyses, and the overlap of the age confidence intervals obtained for each gene covered a period between 277.4 and 315.2 Ma (except in the case of nsr, which yielded an age much younger than the oldest known beetle fossils) (Figure 5). This time interval was used to restrict the age of Coleoptera in subsequent analyses, and it was consistent with most clade age estimates for Coleoptera obtained in analyses where the beetle clade also included Strepsiptera.
The above time constraint for Coleoptera produced instantaneous nucleotide substitution rates ranging from 0.00208 subs./l./Ma in the case of the gene nes to 0.01190 subs./l./Ma in the case of Cul3, with an average substitution rate for the whole set of genes investigated of 0.00452 ± 0.002083 subs./l./Ma (Table 5). Slightly over half these genes had substitution rates relatively consistent with a molecular clock (ucld.stdev < 0.6), and in contrast to the case of the amino acid sequence analyses, the genes departing from the molecular clock were those with higher nucleotide substitution rates.

3.4. Analysis of Rate Differences

Permutation tests of independence produced non-significant results for every pair of independent variables used in subsequent tests, suggesting that there were no interactions among them. The null hypothesis that sperm individualization genes with or without duplications in the insect lineage had the same evolutionary rates was not rejected (Mann–Whitney U = 183, p = 0.758; also treating hemipteroid orb2 and Osbp duplications as non-duplicated genes: U = 157, p = 0.497). Similarly, this hypothesis was not rejected in the case of genes working in coordination in a gene interaction network (like the one deduced for Drosophila) tested against genes dissociated from this network (Mann–Whitney U = 190, p = 0.632). However, when genes were split into two categories according to their predicted sex expression bias, or according to whether they evolved in a clocklike fashion, the null hypothesis of no differences in their evolutionary rates was rejected at the 0.05 significance level (Mann–Whitney U = 52, p = 0.019 and Mann–Whitney U = 323, p = 0.002, respectively). In these cases, sex-biased and clock-constrained genes would have slightly faster rates, except for the male-biased gene hmw, a fast-evolving protein departing nonetheless from a molecular clock. The same tests, when applied to nucleotide substitution rates of the genes of interest in beetles, produced non-significant results when rate differences were tested for predicted expression biases (U = 115, p = 0.817), gene duplications in the beetle lineage (U = 181, p = 0.551), or their predicted coordination in an interaction network (U = 156, p = 0.118). The test produced a clear significant result when rate differences were tested against the clocklike behavior of data (U = 5, p << 0.001), with the genes departing from the molecular clock having much higher rates (genes[ucld.stdev < 0.6]: 0.00314 ± 0.000533 versus genes[ucld.stdev ≥ 0.6]: 0.00620 ± 0.002030).

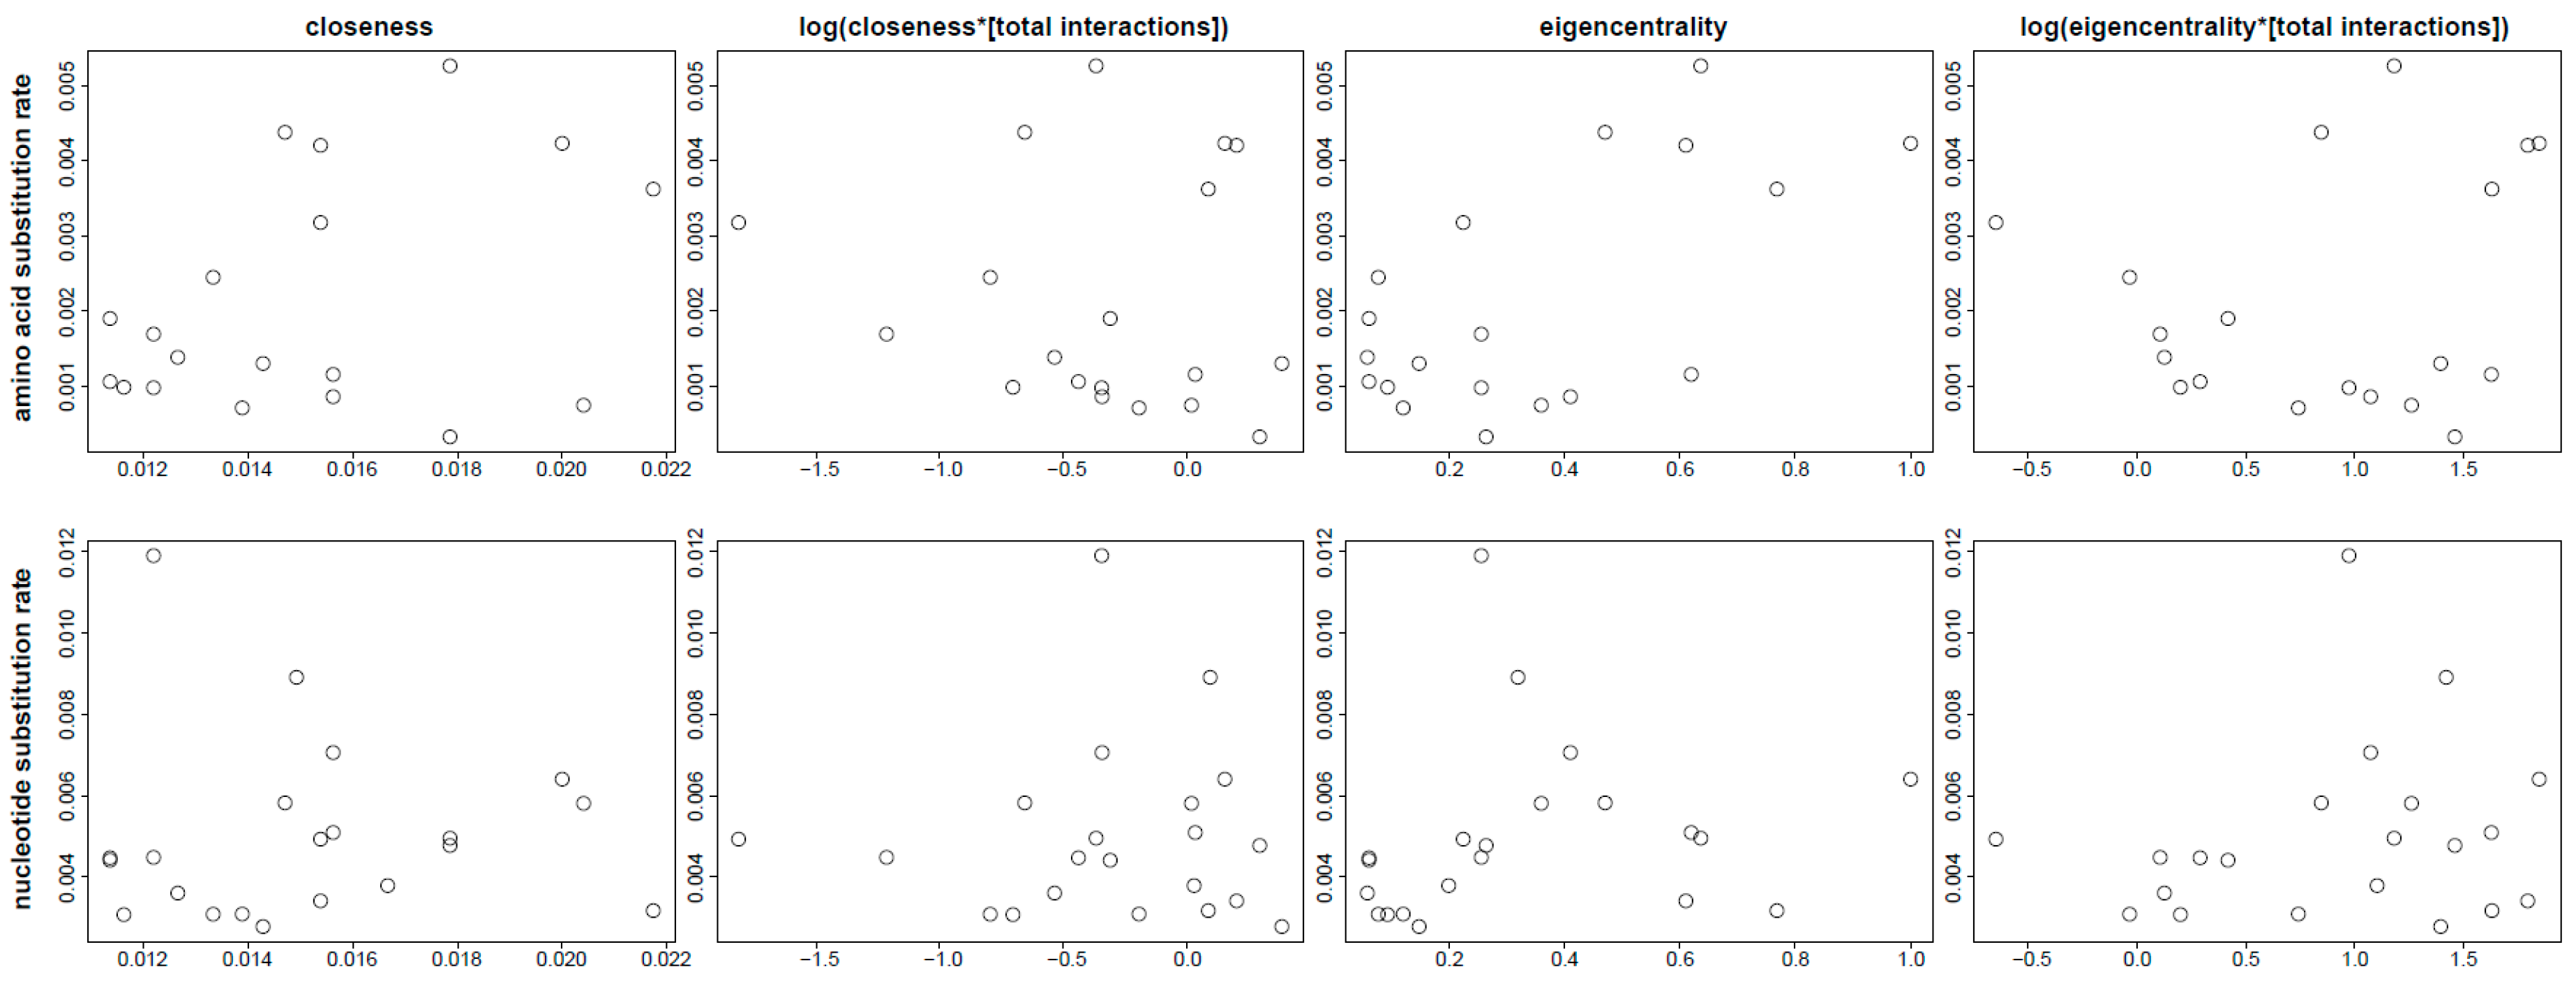
3.5. Evolutionary Patterns in the Sperm Individualization Interaction Network

The results of the Spearman’s rank correlation tests between amino acid substitution rates and measures of node importance based on the number of receiving edges (S = 956.6, rho = 0.1609, p = 0.5106), rank (S = 712.6, rho = 0.3749, p = 0.1138), or their respective corrections considering the total number of genetic interactions of the nodes of interest (S[edges] = 1340.0, rho = −0.1754, p = 0.4709; S[rank] = 1054.0, rho = 0.0754, p = 0.7592) were all non-significant (Figure 6). Similarly, the correlations between nucleotide substitution rates in beetles and node centrality measures based on the number of receiving edges (S = 1115.3, rho = 0.2758, p = 0.2263) or their tentative correction based on edges (S = 1520, rho = 0.0130, p = 0.9573) and rank (S = 1180, rho = 0.2338, p = 0.3063) were non-significant. However, when node centrality was assessed based on the first eigenvector of the adjacency matrix, their correlation with nucleotide substitution rates was significant (S = 770.5, rho = 0.4997, p = 0.0211), suggesting a slight effect of more densely connected regions of the network having significantly higher evolutionary rates. In turn, there was no evidence for a correlation between genes being single copy or duplicated and any centrality measure without (edges: S = 1772.9, rho = −0.1512, p = 0.5129; rank: S = 2127.7, rho = −0.3816, p = 0.0878) or with correction (edges: S = 1368.7, rho = 0.1112, p = 0.6312; rank: S = 1980.5, rho = −0.2860, p = 0.2088).
Network modularity measures split the gene interaction network into four groups when using edge-based partitioning or five groups when using node-based partitioning, with considerable agreement between strategies (Figure 7). Exact modularity and the Clauset–Newman–Moore algorithm produced identical groupings, differing from the edge-based solution in the transfer of one node (Dredd) to an adjacent group and the split of two nodes (Act5C and Lasp) as an additional group. The Louvain modularity produced groups identical to the other node-based methods, but transferring one node (Past1) into the adjacent group. None of these global partitioning strategies showed statistical differences in amino acid substitution rates (“edge_betweenness”, chi-sq = 2.8835, p = 0.4099; “optimal”, chi-sq = 2.5958, p = 0.6276; “louvain”, chi-sq = 2.4258, p = 0.6580) or nucleotide substitution rates (“edge_betweenness”, chi-sq = 4.9143, p = 0.1782; “optimal”, chi-sq = 5.4316, p = 0.2458; “louvain”, chi-sq = 4.9848, p = 0.2889). However, when different group bipartitions of the network were considered, the edge between Dronc and shi (ABC and DE clusters in Figure 7) delimited groups with different amino acid substitution rates (U = 72, p = 0.0279) and different nucleotide substitution rates when beetle data were considered both for edge (U = 83, p = 0.0409) and for node (U = 93, p = 0.0062) partitions. Nucleotide substitution rates were also statistically significantly different across the edges joining Dredd and Dronc (U = 80, p = 0.0200; AB and CDE clusters in Figure 7) and Chc and Past1 (U = 69, p = 0.0147; ABCD and E clusters in Figure 7).

4. Discussion

4.1. Data Mining Genomic and Transcriptomic Resources: Sequence Quality

The results of studies exploiting genomic and transcriptomic resources depend on their quality and curatorial status, regardless of how complex and efficient the bioinformatic approaches used to extract this information are [57,58]. Usually, the scale and complexity of studies using “big data” prevent end-user control of their quality [59], and data may include unnoticed errors (e.g., incorrect taxonomic assignments or shifts in reading frames) or may have escaped objective quality filters (e.g., low sequence quality or assembly problems). Here, we used several public databases of annotated sequence data, including GenBank, FlyBase, modENCODE, OrthoDB, and BioGRID, as well as the partially released 1KITE database. Each may have contributed particular biases to the results, but the amount of data was still amenable to manual control of the different analytical steps, allowing for the recognition of problems and for hopefully avoiding them by iterative analytical exploration and filtering of the data.
The first challenge we had to address after mining the sequence data, and before all analyses, was filtering what we interpreted as noisy sequence data or suspicious annotations in the data sets. Sequence quality was a major concern when using data directly mined from sequence repositories. Thus, we identified, through iterative assessment, two main criteria for the total or partial removal of potentially noisy data. These were (i) long autapomorphic insertions in amino acid sequences which may result from unrecognized introns and (ii) highly divergent, unalignable regions, typically at the ends of sequences, due to compensated nucleotide gains/losses in that part of the sequence, locally affecting the reading frame. Reiterated multiple sequence alignments also allowed recomposing the proteins that appeared in OrthoDB as non-overlapping fragments for some taxa into a single sequence. However, when this situation affected duplicated genes, there was a risk of joining fragments of non-orthologous proteins, which we addressed by using phylogenetic trees to inform manual curation [29]. We gained additional insight into the aforementioned problems by merging annotated and curated amino acid sequence data from OrthoDB with translated nucleotide sequence data from 1KITE beetle transcriptomes. Some of the latter sequences showed precisely the same translation problems affecting homology as were found for the insect protein data, and they were filtered according to the same criteria specified above.

4.2. Data Mining Genomic and Transcriptomic Resources: Orthology Assessment

Orthology assessment was particularly crucial in the examination of beetle data mined directly from raw transcriptomes, and here, this assessment was particularly important because orthology provided our best hypothesis for conserved gene function. For most EOGs of interest for which we searched the transcriptomes, the pipeline yielded a phylogenetically cohesive group of potentially orthologous sequences with their paralogs when they were present in the transcriptome. The efficiency of Orthograph in this respect was demonstrated when mistakes were made. For example, a bad specification of the EOG corresponding to the gene Pen initially resulted in predicted beetle orthologs for one of the other importin-alpha genes in insects, which could be identified and corrected in our iterative phylogenetic approach. For six genes, however, the analyses picked up at least two paralogs. Two corresponded to Act5C and Cyt-c-d, which we already described as challenging to separate in the respective duplicated copies, even using phylogenies. The other four are more difficult to explain, and recognizing them required phylogenetically informed decisions; they were removed from the analyses a posteriori. Of these, two were genes for which we revealed duplications in beetles, Dronc and gish (for the latter, we found the beetle-specific paralog only in Xylobiops [Bostrichidae]). The other two were Npc1a, for which the correct sperm individualization ortholog was identified in 16 beetle transcriptomes and its paralog Npc1b in Lepicerus sp., and klhl10, for which the copy missing in Diptera was found in Micromalthus debilis and Lamprohiza splendidula. For all of these genes, we have strong evidence hinting at them being duplicated in the beetle genomes, yet we retrieved one of the copies in most species and the other copy in one or just a few transcriptomes. If these genes are indeed duplicated, the reason why both copies were not found consistently in all beetle transcriptomes may be related to how the program Orthograph works, i.e., retrieving a single best reciprocal hit, the putative ortholog. In these circumstances, and analogously to ranked results of BLAST searches, the correct, biologically meaningful sequence may be missed after yielding a suboptimal hit, perhaps because of sequence quality and/or length issues or the absence of the ortholog of interest in some of the transcriptomes.

4.3. Evolutionary Dynamics of Sperm Individualization Genes

All qualitative traits that were used to rank sperm individualization genes in insects were statistically independent. This implies that, at least for this subset of genes, some evolutionary predictions do not apply, including the association of sex-biased gene expression with an origin attributed to gene duplications [18]. Apart from duplications, we also recorded gene losses, because it has been hypothesized that the rate of turnover (i.e., lack of 1:1 orthology) for sex-biased—particularly male-biased—genes may be higher than for other genes [60,61]. Among sperm individualization genes, we found lineage-specific losses for both biased and unbiased genes without statistical differences between groups (chi-sq = 2.4529, p = 0.1450), and our phylogenetic analyses, in fact, show that preservation and genomic dosage of sperm individualization genes are generally highly conserved across the Insecta despite their long evolutionary history.
In our analysis of the correlation between the different ways in which we ranked sperm individualization genes and their inferred evolutionary rates, only two instances of statistically significant differences were obtained. The first relates to the overall homogeneity of substitution rates both for insect amino acid and for beetle nucleotide sequence data (even if with opposite signs). The second and most interesting, considering the deep evolutionary time considered and the assumption of conservation of gene functionality across this time scale, was for sex-biased genes, which had different and significantly higher evolutionary rates than unbiased genes. The fact that sex-biased genes, and, more specifically, male-biased genes, evolve more rapidly than unbiased genes is a well-known general evolutionary pattern documented from a diversity of organisms [5,60,61,62,63,64,65,66,67,68,69]. However, it is surprising that this signature is still present across some 400 million years of evolution when it remains unclear whether gene functionality and sex bias in their expression have been conserved. If these features changed during the course of evolution, it is still possible that faster rates in this case could be related to other expression features, such as tissue specificity and narrow expression profiles [65]. Indeed, faster rates of evolution associated with sex-biased expression have been explained as the result of several potential causes, including participation in specific processes such as spermatogenesis [62,69], activation in reproductive tissues relative to genes expressed in several tissues [13,70], linkage to the homogametic sex chromosome [13,70], relatively low levels of expression [71], or circumscription to specific stages of development [5]. These correlations are far from universal, and there are exceptions to each of the proposed patterns [5,68,69], much depending on the organism under study but also on their life histories. For example, female mating behavior in different species of Anopheles [Diptera: Culicidae]—some species of which are polyandrous, while others mate once in their lifetime—may have different impacts on sperm competition and selection and, consequently, on the evolutionary dynamics of sperm-related genes [69]. Moreover, while these factors could potentially lead to faster rates of evolution in sex-biased genes, protein–protein interactions could effectively constrain them [72], a possibility that will be discussed below.

4.4. Evolutionary Dynamics of Interacting Sperm Individualization Genes

Genetic interactions act as a dominant force explaining evolutionary rates, and the nature and type of interaction may prevail over other factors, such as the characteristics of gene expression [73]. There are hypotheses on how these two features may interact, such as the expected negative correlation between the number of protein interactions and evolutionary rates, or the proposition that interacting proteins should evolve at similar rates [74]. The micro- and macroevolutionary analyses of the effect of these interactions have facilitated significant advances in our understanding of these processes. On the one hand, our knowledge on the structure of genetic interaction networks, also for non-model organisms, is more detailed. On the other hand, the development of explicit, quantitative methods allows us to evaluate the architecture and properties of the networks relative to the biological features of their elements, particularly in the case of metabolic networks [75,76,77,78].
Among typical macroevolutionary patterns related to the protein–protein interaction network structure, it has been proposed that duplicated genes tend to be more highly connected in such networks [77]. The sperm individualization network shows an area that concentrates duplicated and relatively highly connected proteins (e.g., Dredd, Dronc, and skap); however, there was no statistical support for a correlation between these features. Correlations were found, nonetheless, for evolutionary rates when the undirected network was bipartitioned, adding statistical support to the intuitive notion of faster-evolving genes and proteins (blanks, Dark, Dredd, Dronc, Duba, and Fadd) appearing concentrated in one region of the network. Furthermore, we found a positive correlation between rank-based centrality and nucleotide substitution rates for beetles. In general, the opposite trend tends to be the norm, and highly connected genes usually show slower rates of evolution, maybe because the protein function depends on more topological interactions with other proteins, which constrain the possibility of change [74,75]. However, this is a controversial topic, and other examples of faster-evolving core proteins in an interaction network exist, such as the analysis of transcriptional networks in yeast [79]. In any case, it is too early to draw conclusions about the evolutionary trends in sperm individualization genes. Significant results were only obtained for beetles, for which we lack empirical evidence of the same gene interactions known in Drosophila, and different evolutionary dynamics seem to operate depending on the overall function of the network. This highlights the necessity for further research in beetles beyond the model organism T. castaneum.
The lack of significant or consistent results between analyses employing insect amino acid and beetle nucleotide sequence data may be explained, in part, by the partial view of the actual interactions in which sperm individualization genes participate. It is possible that the real nature and number of these interactions is not captured by the necessarily crude correction applied here (i.e., total number of receiving edges in the interactome). The structural measures obtained from the interaction network are intrinsic and the represented network of interactions is not isolated; therefore, these measures can show some biases [75]. A poorly connected node in the sperm individualization network can have many connections to other functional domains of the cell. For example, the proteins Fadd and Mer physically interact with the products of three and four other sperm individualization genes, respectively; however, in the complete interactome of Drosophila, they are known to interact physically or genetically with 100 and 165 other proteins, respectively. As already mentioned, another possibility is that the interaction network described for Drosophila is not universal for insects, totally or partially, and that the enforced topology is unable to capture evolutionary constraints for these genes in insects, or that the actual evolutionary dynamics of beetles are different from general trends in insects. Nevertheless, we tried to find intrinsic patterns that could be associated with the coordination of the genes of interest in a specific function, and at least in the case of beetles, there could be a signature worth exploring from a functional point of view.
While we identified statistically significant differences in the rate of amino acid substitution in insects depending on hypothesized sex-biased expression, the study of nucleotide substitution rates in beetles for the same genes did not reveal any significant pattern. A somewhat reverse pattern was obtained in our exploration of evolutionary rates constrained by the architecture of a hypothesized network of interaction, wherein mainly nucleotide substitution rates of beetles showed some correlation with this architecture. This apparent contradiction and the complexity of the factors involved in explaining evolutionary rates make it difficult to fully explain these patterns satisfactorily. Before we can do that, we need more in-depth insight into the temporal and spatial expression profiles, effective function, genetic interactions, and pleiotropic effects of these genes in every single species, but also to incorporate information on their life history, which is likely to influence their evolutionary dynamics.

Supplementary Materials

The following are available online at https://www.mdpi.com/2073-4425/10/10/776/s1, File S1. Maximum likelihood trees based on the amino acid alignments of different sperm individualization proteins in insects. File S2. Bayesian inference trees based on the amino acid alignments of different sperm individualization proteins in insects. File S3. Maximum likelihood trees based on the nucleotide alignments of different sperm individualization genes in beetles. File S4. Bayesian inference trees based on the nucleotide alignments of different sperm individualization genes in beetles.

Author Contributions

J.G.-Z. conceived the study, analyzed and curated the data, interpreted the results, and wrote the original draft of the manuscript; D.D.K. and X.Z. contributed data as part of the 1KITE initiative; H.I.V.-R., C.M., and M.P. mined the data; J.G.-Z. and C.M. wrote the manuscript and covered publication expenses; M.P., D.D.K., and X.Z. contributed to the manuscript. All authors approved the manuscript.

Funding

This study was possible thanks to the project CGL2011-23820/BOS of the Spanish Ministry of Science and Innovation led by JGZ, which also included a predoctoral scholarship (BES-2012-051908) as well as two training stays (EEBB-I-14-08654 and EEBB-I-16-11559) at the Zoological Research Museum Alexander Koenig (Bonn, Germany), funded by the Spanish Ministry of Economy and Competitiveness and enjoyed by HIVR. One of us (CM) and Bernhard Misof hosted these stays and the support of the later is much appreciated, also in his role as one of the 1KITE leaders. Indeed, this study uses data from the 1KITE consortium (www.1kite.org), which was supported by the China National Genebank and Beijing Genomics Institute (Shenzhen). We are especially grateful to the 1KITE beetle group for granting access to partially unpublished data, particularly to Kai Schütte (Hamburg, Germany), Eric Anton (Jena, Germany), Hermes Escalona and Adam Ślipiński (Canberra, Australia), Dirk Ahrens (Bonn, Germany) and Michael Balke (Munich, Germany), who provided specimens or tissue for 1KITE beetle transcriptomes, and to Alexander Donath, Lars Podsiadlowski, Shanlin Liu, Guanliang Meng and Karen Meusemann for managing and making accessible 1KITE data and accompanying information that we used for this study. MP was funded by the Leibniz Graduate School on Genomic Biodiversity Research (GBR) and by the German Research Foundation (DFG, grant MI 649/16-1).

Conflicts of Interest

The authors declare no conflict of interest.

References

  1. Khaitovich, P.; Hellmann, I.; Enard, W.; Nowick, K.; Leinweber, M.; Franz, H.; Weiss, G.; Lachmann, M.; Pääbo, S. Parallel patterns of evolution in the genomes and transcriptomes of humans and chimpanzees. Science 2005, 309, 1850–1854. [Google Scholar] [CrossRef] [PubMed]
  2. Ranz, J.M.; Castillo-Davis, C.I.; Meiklejohn, C.D.; Hartl, D.L. Sex-dependent gene expression and evolution of the Drosophila transcriptome. Science 2003, 300, 1742–1745. [Google Scholar] [CrossRef] [PubMed]
  3. Graveley, B.R.; Brooks, A.N.; Carlson, J.W.; Duff, M.O.; Landolin, J.M.; Yang, L.; Artieri, C.G.; van Baren, M.J.; Boley, N.; Booth, B.W.; et al. The developmental transcriptome of Drosophila melanogaster. Nature 2011, 471, 473–479. [Google Scholar] [CrossRef] [PubMed]
  4. Singh, R.; Jagadeeshan, S. Sex and speciation: Drosophila reproductive tract proteins—Twenty five years later. Int. J. Evol. Biol. 2012, 2012, 191495. [Google Scholar] [CrossRef]
  5. Perry, J.C.; Harrison, P.W.; Mank, J.E. The ontogeny and evolution of sex-biased gene expression in Drosophila melanogaster. Mol. Biol. Evol. 2014, 31, 1206–1219. [Google Scholar] [CrossRef]
  6. Baker, D.A.; Nolan, T.; Fischer, B.; Pinder, A.; Crisanti, A.; Russell, S. A comprehensive gene expression atlas of sex- and tissue-specificity in the malaria vector, Anopheles gambiae. BMC Genom. 2011, 12, 296. [Google Scholar] [CrossRef]
  7. Prince, E.G.; Kirkland, D.; Demuth, J.P. Hyperexpression of the X chromosome in both sexes results in extensive female bias of X-linked genes in the flour beetle. Genome Biol. Evol. 2010, 2, 336–346. [Google Scholar] [CrossRef]
  8. Parsch, J.; Ellegren, H. The evolutionary causes and consequences of sex-biased gene expression. Nat. Rev. Genet. 2013, 14, 83–87. [Google Scholar] [CrossRef]
  9. Telonis-Scott, M.; Kopp, A.; Wayne, M.L.; Nuzhdin, S.V.; McIntyre, L.M. Sex-specific splicing in Drosophila: Widespread occurrence, tissue specificity and evolutionary conservation. Genetics 2009, 181, 421–434. [Google Scholar] [CrossRef]
  10. Hartmann, B.; Castelo, R.; Miñana, B.; Peden, E.; Blanchette, M.; Rio, D.C.; Singh, R.; Valcárcel, J. Distinct regulatory programs establish widespread sex-specific alternative splicing in Drosophila melanogaster. RNA 2011, 17, 453–468. [Google Scholar] [CrossRef]
  11. Meisel, R.P.; Malone, J.H.; Clark, A.G. Disentangling the relationship between sex-biased gene expression and X-linkage. Genome Res. 2012, 22, 1255–1265. [Google Scholar] [CrossRef] [PubMed] [Green Version]
  12. Lee, H.; Cho, D.Y.; Whitworth, C.; Eisman, R.; Phelps, M.; Roote, J.; Kaufman, T.; Cook, K.; Russell, S.; Przytycka, T.; et al. Effects of gene dose, chromatin, and network topology on expression in Drosophila melanogaster. PLoS Genet. 2016, 12, e1006295. [Google Scholar] [CrossRef] [PubMed]
  13. Ranz, J.M.; Parsch, J. Newly evolved genes: Moving from comparative genomics to functional studies in model systems. Bioessays 2012, 34, 477–483. [Google Scholar] [CrossRef] [PubMed]
  14. Gallach, M.; Domingues, S.; Betrán, E. Gene duplication and the genome distribution of sex-biased genes. Intl. J. Evol. Biol. 2011, 2011, 989438. [Google Scholar] [CrossRef] [PubMed]
  15. Chen, S.; Krinsky, B.H.; Long, M.y. New genes as drivers of phenotypic evolution. Nat. Rev. Genet. 2013, 14, 645–660. [Google Scholar] [CrossRef] [PubMed] [Green Version]
  16. Zhang, Z.; Hambuch, T.M.; Parsch, J. Molecular evolution of sex-biased genes in Drosophila. Mol. Biol. Evol. 2004, 21, 2130–2139. [Google Scholar] [CrossRef] [PubMed]
  17. Pröschel, M.; Zhang, Z.; Parsch, J. Widespread adaptive evolution of Drosophila genes with sex-biased expression. Genetics 2006, 174, 893–900. [Google Scholar] [CrossRef]
  18. Ellegren, H.; Parsch, J. The evolution of sex-biased genes and sex-biased gene expression. Nat. Rev. Genet. 2007, 8, 689–698. [Google Scholar] [CrossRef]
  19. Haerty, W.; Jagadeeshan, S.; Kulathinal, R.J.; Wong, A.; Ram, K.R.; Sirot, L.K.; Levesque, L.; Artieri, C.G.; Wolfner, M.F.; Civetta, A.; et al. Evolution in the fast lane: Rapidly evolving sex-related genes in Drosophila. Genetics 2007, 177, 1321–1335. [Google Scholar] [CrossRef]
  20. Yang, Y.; Smith, S.A. Orthology inference in nonmodel organisms using transcriptomes and low-coverage genomes: Improving accuracy and matrix occupancy for phylogenomics. Mol. Biol. Evol. 2014, 31, 3081–3092. [Google Scholar] [CrossRef]
  21. Sjölander, K. Phylogenomic inference of protein molecular function: Advances and challenges. Bioinformatics 2004, 20, 170–179. [Google Scholar] [CrossRef] [PubMed]
  22. Vizán-Rico, H.I.; Gómez-Zurita, J. Testis-specific RNA-Seq of Calligrapha (Chrysomelidae) as a transcriptomic resource for male-biased gene inquiry in Coleoptera. Mol. Ecol. Res. 2017, 17, 533–545. [Google Scholar] [CrossRef] [PubMed]
  23. Grath, S.; Parsch, J. Sex-biased gene expression. Ann. Rev. Genet. 2016, 50, 29–44. [Google Scholar] [CrossRef] [PubMed]
  24. Parisi, M.; Nuttall, R.; Edwards, P.; Minor, J.; Naiman, D.; Lü, J.; Doctolero, M.; Vainer, M.; Chan, C.; Malley, J.; et al. A survey of ovary-, tesits-, and soma-biased gene expression in Drosophila melanogaster adults. Genome Biol. 2004, 5, R40. [Google Scholar] [CrossRef] [PubMed]
  25. Fabrizio, J.J.; Hime, G.; Lemmon, S.K.; Bazinet, C. Genetic dissection of sperm individualization in Drosophila melanogaster. Development 1998, 125, 1833–1843. [Google Scholar]
  26. Fuller, M.T. Spermatogenesis. In The Development of Drosophila melanogaster; Bate, M., Arias, A.M., Eds.; Cold Spring Harbor Laboratory Press: New York, NY, USA, 1993; pp. 71–147. [Google Scholar]
  27. Celniker, S.E.; Dillon, L.A.; Gerstein, M.B.; Gunsalus, K.C.; Henikoff, S.; Karpen, G.H.; Kellis, M.; Lai, E.C.; Lieb, J.D.; MacAlpine, D.M.; et al. Unlocking the secrets of the genome. Nature 2009, 459, 927–930. [Google Scholar] [CrossRef] [Green Version]
  28. Kriventseva, E.V.; Tegenfeldt, F.; Petty, T.J.; Waterhouse, R.M.; Simão, F.A.; Pozdnyakov, I.A.; Ioannidis, P.; Zdobnov, E.M. OrthoDB v8: Update of the hierarchical catalog of orthologs and the underlying free software. Nucleic Acids Res. 2015, 43, D250–D256. [Google Scholar] [CrossRef]
  29. Gabaldón, T. Large-scale assignment of orthology: Back to phylogenetics? Genome Biol. 2008, 9, 235. [Google Scholar] [CrossRef]
  30. Carbon, S.; Ireland, A.; Mungall, C.J.; Shu, S.Q.; Marshall, B.; Lewis, S. AmiGO: Online access to ontology and annotation data. Bioinformatics 2009, 25, 288–289. [Google Scholar] [CrossRef]
  31. Gramates, L.S.; Marygold, S.J.; dos Santos, G.; Urbano, J.-M.; Antonazzo, G.; Matthews, B.B.; Rey, A.J.; Tabone, C.J.; Crosby, M.A.; Emmert, D.B.; et al. FlyBase at 25: Looking to the future. Nucleic Acids Res. 2017, 45, D663–D671. [Google Scholar] [CrossRef]
  32. Kalderimis, A.; Lyne, R.; Butano, D.; Contrino, S.; Lyne, M.; Heimbach, J.; Hu, F.; Smith, R.; Stěpán, R.; Sullivan, J.; et al. InterMine: Extensive web services for modern biology. Nucleic Acids Res. 2014, 42, W468–W472. [Google Scholar] [CrossRef] [PubMed]
  33. Zdobnov, E.M.; Tegenfeldt, F.; Kuznetsov, D.; Waterhouse, R.M.; Simão, F.A.; Panagiotis, I.; Seppey, M.; Loetscher, A.; Kriventseva, E.V. OrthoDB v9.1: Cataloguing evolutionary and functional annotations for animal, fungal, plant, archaeal, bacterial and viral orthologs. Nucleic Acids Res. 2017, 45, D744–D749. [Google Scholar] [CrossRef] [PubMed]
  34. Petersen, M.; Meusemann, K.; Donath, A.; Dowling, D.; Liu, S.; Peters, R.S.; Podsiadlowski, L.; Vasilikopoulos, A.; Zhou, X.; Misof, B.; et al. Orthograph: A versatile tool for mapping coding nucleotide sequences to clusters of orthologous genes. BMC Bioinform. 2017, 18, 111. [Google Scholar] [CrossRef] [PubMed]
  35. Attrill, H.; Falls, K.; Goodman, J.L.; Millburn, G.H.; Antonazzo, G.; Rey, A.J.; Marygold, S.J. FlyBase Consortium. FlyBase: Establishing a Gene Group resource for Drosophila melanogaster. Nucleic Acids Res. 2016, 44, D786–D792. [Google Scholar] [CrossRef] [PubMed]
  36. Kim, H.S.; Murphy, T.; Xia, J.; Caragea, D.; Park, Y.; Beeman, R.W.; Lorenzen, M.D.; Butcher, S.; Manak, J.R.; Brown, S.J. BeetleBase in 2010: Revisions to provide comprehensive genomic information for Tribolium castaneum. Nucleic Acids Res. 2010, 38, D437–D442. [Google Scholar] [CrossRef] [PubMed]
  37. Nygaard, S.; Zhang, G.; Schiott, M.; Li, C.; Wurm, Y.; Hu, H.F.; Zhou, J.J.; Ji, L.; Qiu, F.; Rasmussen, M.; et al. The genome of the leaf-cutting ant Acromyrmex echinatior suggests key adaptations to advanced social life and fungus farming. Genome Res. 2011, 21, 1339–1348. [Google Scholar] [CrossRef] [PubMed]
  38. Elsik, C.G.; Tayal, A.; Diesh, C.M.; Unni, D.R.; Emery, M.L.; Nguyen, H.N.; Hagen, D.E. Hymenoptera Genome Database: Integrating genome annotations in HymenopteraMine. Nucleic Acids Res. 2016, 44, D793–D800. [Google Scholar] [CrossRef]
  39. Katoh, S. MAFFT multiple sequence alignment software version 7: Improvements in performance and usability. Mol. Biol. Evol. 2013, 30, 772–780. [Google Scholar] [CrossRef]
  40. Lefort, V.; Longueville, J.E.; Gascuel, O. SMS: Smart Model Selection in PhyML. Mol. Biol. Evol. 2017, 34, 2422–2424. [Google Scholar] [CrossRef] [Green Version]
  41. Guindon, S.; Dufayard, J.-F.; Lefort, V.; Anisimova, M.; Hordijk, W.; Gascuel, O. New algorithms and methods to estimate maximum-likelihood phylogenies: Assessing the performance of PhyML 3.0. Syst. Biol. 2010, 59, 307–321. [Google Scholar] [CrossRef]
  42. Drummond, A.J.; Suchard, M.A.; Xie, D.; Rambaut, A. Bayesian phylogenetics with BEAUti and the BEAST 1.7. Mol. Biol. Evol. 2012, 29, 1969–1973. [Google Scholar] [CrossRef] [PubMed]
  43. Ronquist, F.; Klopfstein, S.; Vilhelmsen, L.; Schulmeister, S.; Murray, D.L.; Rasnitsyn, A.P. A total-evidence approach to dating with fossils, applied to the early radiation of the Hymenoptera. Syst. Biol. 2012, 61, 973–999. [Google Scholar] [CrossRef] [PubMed]
  44. Bertone, M.A.; Courtney, G.W.; Wiegmann, B.M. Phylogenetics and temporal diversification of the earliest true flies (Insecta: Diptera) based on multiple nuclear genes. Syst. Ent. 2008, 33, 668–687. [Google Scholar] [CrossRef]
  45. Drummond, A.J.; Ho, S.Y.; Phillips, M.J.; Rambaut, A. Relaxed phylogenetics and dating with confidence. PLoS Biol. 2006, 4, e88. [Google Scholar] [CrossRef]
  46. Rambaut, A.; Suchard, M.A.; Xie, D.; Drummond, A.J. Tracer v1.6. 2014. Available online: http://beast.bio.ed.ac.uk/Tracer (accessed on 10 March 2015).
  47. Mann, H.B.; Whitney, D.R. On a test of whether one of two random variables is stochastically larger than the other. Ann. Math. Stat. 1947, 18, 50–60. [Google Scholar] [CrossRef]
  48. R Core Team. R: A Language and Environment for Statistical Computing; R Foundation for Statistical Computing: Vienna, Austria, 2016. [Google Scholar]
  49. Weiss, N.A. wPerm. Permutation Tests. R package version 1.0.1. 2015. Available online: https://CRAN.R-project.org/package=wPerm (accessed on 15 February 2018).
  50. Stark, C.; Breitkreutz, B.-J.; Reguly, T.; Boucher, L.; Breitkreutz, A.; Tyers, M. BioGRID: A general repository for interaction datasets. Nucleic Acids Res. 2006, 34, D535–D539. [Google Scholar] [CrossRef]
  51. Csardi, G.; Nepusz, T. The igraph software package for complex network research. Int. J. Complex. Syst. 2006, 1695, 1–9. [Google Scholar]
  52. Blondel, V.; Guillaume, J.-L.; Lambiotte, R.; Lefebvre, E. Fast unfolding of communities in large networks. J. Stat. Mech. 2008, 10, P10008. [Google Scholar] [CrossRef]
  53. Brandes, U.; Delling, D.; Gaertler, M.; Görke, R.; Hoefer, M.; Nikoloski, Z.; Wagner, D. On modularity clustering. IEEE Trans. Knowl. Data Eng. 2008, 20, 172–188. [Google Scholar] [CrossRef]
  54. Brandes, U. A faster algorithm for betweenness centrality. J. Math. Sociol. 2001, 25, 163–177. [Google Scholar] [CrossRef]
  55. Kruskal, W.H.; Wallis, W.A. Use of ranks in one-criterion variance analysis. J. Am. Stat. Assoc. 1952, 47, 583–621. [Google Scholar] [CrossRef]
  56. Misof, B.; Liu, S.l.; Meusemann, K.; Peters, R.S.; Donath, A.; Mayer, C.; Frandsen, P.B.; Ware, J.; Flouri, T.; Beutel, R.G.; et al. Phylogenomics resolves the timing and pattern of insect evolution. Science 2014, 346, 763–767. [Google Scholar] [CrossRef] [PubMed]
  57. Pruitt, K.D.; Tatusova, T.; Maglott, D.R. NCBI Reference Sequence (RefSeq): A curated non-redundant sequence database of genomes, transcripts and proteins. Nucleic Acids Res. 2005, 33, D501–D504. [Google Scholar] [CrossRef] [PubMed]
  58. Klimke, W.; O’Donovan, C.; White, O.; Brister, J.R.; Clark, K.; Fedorov, B.; Mizrachi, I.; Pruitt, K.D.; Tatusova, T. Solving the problem: Genome annotation standards before the data deluge. Stand. Genom. Sci. 2011, 5, 168–193. [Google Scholar] [CrossRef]
  59. Holzinger, A.; Dehmer, M.; Jurisica, I. Knowledge Discovery and interactive data mining in Bioinformatics -state-of-the-art, future challenges and research directions. BMC Bioinform. 2014, 15, I1. [Google Scholar] [CrossRef]
  60. Zhang, Y.; Sturgill, D.; Parisi, M.; Kumar, S.; Oliver, B. Constraint and turnover in sex-biased gene expression in the genus Drosophila. Nature 2007, 450, 233–238. [Google Scholar] [CrossRef]
  61. Assis, R.; Zhou, Q.; Bachtrog, D. Sex-biased transcriptome evolution in Drosophila. Genome Biol. Evol. 2012, 4, 1189–1200. [Google Scholar] [CrossRef]
  62. Torgerson, D.G.; Kulathinal, R.J.; Singh, R.S. Mammalian sperm proteins are rapidly evolving: Evidence of positive selection in functionally diverse genes. Mol. Biol. Evol. 2002, 19, 1973–1980. [Google Scholar] [CrossRef]
  63. Jagadeeshan, S.; Singh, R.S. Rapidly evolving genes of Drosophila: Differing levels of selective pressure in testis, ovary, and head tissues between sibling. Mol. Biol. Evol. 2005, 22, 1793–1801. [Google Scholar] [CrossRef]
  64. Zhang, Z.; Parsch, J. Positive correlation between evolutionary rate and recombination rate in Drosophila genes with male-biased expression. Mol. Biol. Evol. 2005, 22, 1945–1947. [Google Scholar] [CrossRef]
  65. Meisel, R.P. Towards a more nuanced understanding of the relationship between sex-biased gene expression and rates of protein-coding sequence evolution. Mol. Biol. Evol. 2011, 28, 1893–1900. [Google Scholar] [CrossRef] [PubMed]
  66. Müller, L.; Grath, S.; von Heckel, K.; Parsch, J. Inter- and intraspecific variation in Drosophila genes with sex-biased expression. Int. J. Evol. Biol. 2012, 963–976. [Google Scholar] [CrossRef]
  67. Wang, X.; Werren, J.H.; Clark, A.G. Genetic and epigenetic architecture of sex-biased expression in the jewel wasps Nasonia vitripennis and giraulti. Proc. Natl. Acad. Sci. USA 2015, 112, E3545–E3554. [Google Scholar] [CrossRef] [PubMed]
  68. Darolti, I.; Wright, A.E.; Pucholt, P.; Berlin, S.; Mank, J.E. Slow evolution of sex-biased genes in the reproductive tissue of the dioecious plant Salix viminalis. Mol. Ecol. 2018, 27, 694–708. [Google Scholar] [CrossRef]
  69. Papa, F.; Windbichler, N.; Waterhouse, R.M.; Cagnetti, A.; D’Amato, R.; Persampieri, T.; Lawniczak, M.K.N.; Nolan, T.; Papathanos, P.A. Rapid evolution of female-biased genes among four species of Anopheles malaria mosquitoes. Genome Res. 2018, 27, 1536–1548. [Google Scholar] [CrossRef]
  70. Grath, S.; Parsch, J. Rate of amino acid substitution is influenced by the degree and conservation of male-biased transcription over 50 myr of Drosophila evolution. Genome Biol. Evol. 2012, 4, 346–359. [Google Scholar] [CrossRef] [PubMed]
  71. Drummond, D.A.; Bloom, J.D.; Adami, C.; Wilke, C.O.; Arnold, F.H. Why highly expressed proteins evolve slowly. Proc. Natl. Acad. Sci. USA 2005, 102, 14338–14343. [Google Scholar] [CrossRef] [Green Version]
  72. Wong, A.; Wolfner, M.F. Evolution of Drosophila seminal proteins and their networks. In Rapidly Evolving Genes & Genetic Systems; Singh, R.S., Xu, J.P., Kulathinal, R.J., Eds.; Oxford University Press: Oxford, UK, 2012; pp. 144–152. [Google Scholar]
  73. Fraser, H.B.; Wall, D.P.; Hirsh, A.E. A simple dependence between protein evolution rate and the number of protein-protein interactions. BMC Evol. Biol. 2003, 3, 11. [Google Scholar] [CrossRef] [PubMed]
  74. Fraser, H.B.; Hirsh, A.E.; Steinmetz, L.M.; Scharfe, C.; Feldman, M.W. Evolutionary rate in the protein interaction network. Science 2002, 296, 750–752. [Google Scholar] [CrossRef]
  75. Cork, J.M.; Purugganan, M.D. The evolution of molecular genetic pathways and networks. Bioessays 2004, 26, 479–484. [Google Scholar] [CrossRef]
  76. Wagner, A. Metabolic networks and their evolution. In Evolutionary Systems Biology; Soyer, O.S., Ed.; Springer: New York, NY, USA, 2012; pp. 29–52. [Google Scholar]
  77. Alvarez-Ponce, D.; Fares, M.A. Evolutionary rate and duplicability in the Arabidopsis thaliana protein-protein interaction network. Genome Biol. Evol. 2012, 4, 1263–1274. [Google Scholar] [CrossRef] [PubMed]
  78. Colombo, M.; Laayouni, H.; Invergo, B.M.; Bertranpetit, J.; Montanucci, L. Metabolic flux is a determinant of the evolutionary rates of enzyme-encoding genes. Evolution 2013, 68, 605–613. [Google Scholar] [CrossRef] [PubMed]
  79. Jovelin, R.; Phillips, P.C. Evolutionary rates and centrality in the yeast gene regulatory network. Genome Biol. 2009, 10, R35. [Google Scholar] [CrossRef] [PubMed]
Figure 1. Heatmap visualization of gene expression scores (log2 of the actual value) of sperm individualization genes in Drosophila melanogaster as derived from RNA-seq data from different stages of adult male and female flies [27].
Genes 10 00776 g001
Figure 2. Performance of Orthograph searches of sperm individualization gene orthologs in beetle transcriptomes. (a) Number of genes retrieved from each of the non-model beetle species transcriptomes. (b) Number of beetle species yielding ortholog sequences for each of the sperm individualization genes analyzed, with information on the average protein length and showing genes absent in one or more OrthoDB beetle model species as white columns.
Genes 10 00776 g002aGenes 10 00776 g002b
Figure 3. Schematic consensus phylogeny of insects (drawn from trees in [56,57,58]) showing the inferred evolutionary gains and losses of sperm individualization genes for major insect lineages.
Genes 10 00776 g003
Figure 4. Frequency of maximum likelihood (ML) and Bayesian inference (BI) sperm individualization gene trees resolving particular higher taxa or relationships among them in insects (a) and beetles (b). Key: Ad, Adephaga; Ar, Archostemata; C, Coleoptera; D, Diptera; H, Hymenoptera; Hm, Hemiptera; HOM, Holometabola; Ht, Heteroptera; L, Lepidoptera; My, Myxophaga; Po, Polyphaga; S, Strepsiptera; T, Trichoptera.
Genes 10 00776 g004
Figure 5. Inferred ages and 95% credibility intervals for the Coleoptera clade (top panel) or a Coleoptera + Strepsiptera clade (bottom panel) based on the molecular clock analyses of amino acid sequence data of sperm individualization genes. The full overlap of age estimates of monophyletic Coleoptera identifies an interval (shaded area) consistent with the proposed age of the group based on fossil data and used here as age prior for the evolutionary rate analyses in beetles.
Genes 10 00776 g005
Figure 6. Biplots of the correlation between different measures of node importance in the interaction network of sperm individualization genes and their amino acid evolutionary rates in insects (top panels) and nucleotide substitution rates in beetles (bottom panels).
Genes 10 00776 g006
Figure 7. Mutual interaction network of sperm individualization genes in Drosophila including protein–protein (lines) and genetic/regulatory interactions (arrows), the latter with information on the enhancing and/or repressing modulation effects. Nodes represent interacting proteins, and they are color coded according to their inferred amino acid evolutionary rates. Edges represent documented interactions between proteins, with their width being proportional to the evolutionary rate differences between interacting proteins (dashed lines are used when their evolutionary rate data are missing). Dashed-line and solid-background polygons show the edge-based and node-based partitions of the network, respectively. More details and alternative partitioning schemes are described in the main text.
Genes 10 00776 g007
Table 1. Genes belonging to the ontology category “sperm individualization” (GO:0007291) in insects. Genes are identified by their names and their corresponding FlyBase ID in the Drosophila melanogaster genome. Information on the general function of the gene and sex biases in expression profiles is also given.
GeneFlyBase IDFunctionExpression Profile
Act5CFBgn0000042cytoskeleton structureunbiased
AnceFBgn0012037peptidaseunbiased
auxFBgn0037218ATP binding cofactor of kinaseunbiased
blanksFBgn0035608siRNA bindingmale biased
Bug22FBgn0032248cilium organization and assemblyunbiased
CdsAFBgn0010350enzyme (CDP diglyceride synthetase)unbiased
ChcFBgn0000319coated vesicles structureunbiased
ctpFBgn0011760dynein complex assemblyunbiased
Cul3FBgn0261268protein bindingunbiased
Cyt-c-dFBgn0086907electron carriermale biased
DarkFBgn0263864apoptosome assemblyunbiased
didumFBgn0261397unconventional myosinunbiased
DreddFBgn0020381enzyme (caspase)unbiased
DroncFBgn0026404enzyme (caspase)unbiased
DubaFBgn0036180enzyme (deubiquitinase)unbiased
EcRFBgn0000546transcription factorunbiased
eIF3mFBgn0033902translation initiation factorunbiased
FaddFBgn0038928protein bindingunbiased
gishFBgn0250823enzyme (protein kinase)unbiased
guduFBgn0031905NAmale biased
hephFBgn0011224mRNA binding (translation repression)unbiased
hmwFBgn0038607motile cilium assemblymale biased
jarFBgn0011225myosinunbiased
klhl10FBgn0040038substrate recruiting for ubiquitin ligase complexmale biased
LaspFBgn0063485actin/myosin scaffoldingunbiased
MerFBgn0086384cytoskeletal protein bindingunbiased
mltFBgn0265512microtubule removalunbiased
nesFBgn0026630enzyme (lysophospholipid acyltransferase)unbiased
Npc1aFBgn0024320sterol metabolismunbiased
nsrFBgn0034740dynein complex assemblymale biased
orb2FBgn0264307translation factorunbiased
OsbpFBgn0020626protein bindingunbiased
oysFBgn0033476enzyme (lysophospholipid acyltransferase)unbiased
Past1FBgn0016693membrane assemblyunbiased
PenFBgn0011823protein bindingunbiased
poeFBgn0011230calmodulin bindingunbiased
porinFBgn0004363membrane channel proteinunbiased
Prosalpha6TFBgn0032492enzyme (protease)male biased
scatFBgn0011232protein bindingfemale biased
shiFBgn0003392GTPase for microtubule motilityunbiased
skapFBgn0037643ATP binding enzymeunbiased
swFBgn0003654dynein complex assemblyunbiased
TazFBgn0026619enzyme (phospholipid transacylase)unbiased
Vps28FBgn0021814vesicular traffickingunbiased
Table 2. Beetle species used in the current study and their current systematic placement. Unless specified otherwise, gene sequence data were obtained from 1KITE.
Suborder InfraorderSuperfamilyFamilySpeciesLibrary ID (1KITE)
Archostemata MicromalthidaeMicromalthus debilisINSqzbTABRAAPEI-210
Adephaga AspidytidaeSinaspidytes wraseiWHINSnuyTAAARAAPEI-47
CarabidaeCicindela hybridaINShauTBARAAPEI-21
DytiscidaeCybister lateralimarginalisINSnfrTADRAAPEI-16
GyrinidaeGyrinus marinusINSnfrTBERAAPEI-19
NoteridaeNoterus clavicornisINShkeTALRAAPEI-37
Myxophaga HydroscaphidaeHydroscapha redfordiINSntgTARRAAPEI-208
LepiceridaeLepicerus sp.INSytvTAJRAAPEI-19
Polyphaga
“basal Polyphaga”ScirtoideaScirtidaeCyphon laevipennisINSjdsTBDRAAPEI-47
BostrichiformiaBostrichoideaBostrichidaeXylobiops basilarisWHANIsrmTMCLRAAPEI-11
CucujiformiaChrysomeloideaCerambycidaeAnoplophora glabripennisa-
ChrysomelidaeCalligrapha multipunctatab-
Leptinotarsa decemlineataa-
CleroideaByturidaeByturus ochraceusINShkeTAORAAPEI-43
CleridaeThanasimus formicariusINShkeTCERAAPEI-79
CoccinelloideaCoccinellidaeRhyzobius pseudopulcherWHANIsrmTMABRAAPEI-9
CurculionoideaCurculionidaeDendroctonus ponderosaea-
TenebrionoideaMeloidaeMeloe violaceusINShauTAYRAAPEI-19
TenebrionidaeTribolium castaneuma-
ZopheridaeBitoma cylindricaWHANIsrmTMAPRAAPEI-39
ElateriformiaBuprestoideaBuprestidaeAgrilus planipennisa-
ElateroideaLampyridaeLamprohiza splendidulaINShkeTCGRAAPEI-87
ScarabaeiformiaScarabaeoideaScarabaeidaeCetonia aurata pisanaWHANIsrmTMAVRAAPEI-53
Onthophagus taurusa-
StaphyliniformiaHydrophiloideaHydrophilidaeHydrochara caraboidesINShauTASRAAPEI-13
StaphylinoideaStaphylinidaeOcypus brunnipesINShkeTCMRAAPEI-45
a Beetle model species and data obtained from OrthoDB; b Data available from [22].
Table 3. Summary of sequence characteristics of genes retrieved from OrthoDB. The table lists the number of sequences (N) and species (Sp; with a maximum of 119 species), number of species in which the gene is single copy (Single), the median protein length (L), and relative evolutionary rate (r) as tabulated in OrthoDB. Furthermore, the number (n) of aligned sequences in this study and the alignment lengths (Length), as well as the inferred optimal evolutionary model, are given.
GeneNSpSingleLrnLengthModel
Act5C51711573760.60---
Ance238109306310.9290621LG + G + I
aux1361129411641.211261755JTT + G + I + F
blanks172107713481.55122719JTT + G + I + F
Bug22201115362000.6183270LG + G + I
CdsA1181091014450.76122574JTT + G + I + F
Chc12311511016760.631301726JTT + G + I
ctp1219879890.57---
Cul3153116917800.73133858JTT + G + I
Cyt-c-d148110741080.65---
Dark1191069413781.991122193JTT + G + I + F
didum12611310217931.101242175LG + G + I
Dredd9181754931.7698676JTT + G + I + F
Dronc12896784251.67119654WAG + G + I + F
Duba10599936280.951131087JTT + G + I + F
EcR1211131055150.83120576JTT + G + I
eIF3m1161131113870.77130394JTT + G + I
Fadd9693902461.77108353JTT + G + I + F
gish129113994410.73124401JTT + G + I
gudu1251151066891.01124658LG + G + I
heph206114472850.78114597JTT + G + I + F
hmw7876742601.3880925JTT + G + I + F
jar1311119712380.861291375JTT + G + I + F
klhl10214109546190.96113630LG + G + I
Lasp113105973210.79121298JTT + G + I
Mer1201121056050.87129686JTT + G + I
mlt1241121034771.10130651LG + G + I + F
nes1221121044741.21128472LG + G + I + F
Npc1a2161162312560.981241435LG + G + I
nsr317115383550.92129563JTT + G + I
orb2115106983510.62105293JTT + G + I
Osbp158112795970.911301094JTT + G + I
oys121108975051.03115463LG + G + I
Past11241141045340.66120564LG + G + I
Pen34211675190.83121593LG + G + I + F
poe1831158429491.081293846JTT + G + I + F
porin124108982820.86127286LG + G + I + F
Prosalpha6T126108912770.77125312LG + G + I + F
scat1301161039421.111331233JTT + G + I
shi133113948570.671321005LG + G + I
skap24711684240.80128476LG + G + I
sw1251151096550.80133755JTT + G + I
Taz105102992650.91118303LG + G + I + F
Vps28135112942120.72131213LG + G + I
Table 4. Characteristics of amino acid datasets of sperm individualization proteins of insects deduced from information in public databases (B: unbiased [0] and sex-biased [1] genes; N: non-interacting [0] and interacting [1]), as well as information deduced from their phylogenetic analyses, including duplications (D: single [0] and multicopy [1]), evolutionary rates, evolutionary rate heterogeneity (ucld.stdev), and the estimated age of the clade Coleoptera.
GeneB/D/NSubstitution Rate (×10−3)ucld.stdevAge Coleoptera
hmw1/0/09.67 ± 1.3492.972-
Dark0/0/15.27 ± 0.2820.418264.2 [214.3–314.2]
blanks1/1/14.38 ± 0.3820.483310.6 [248.2–376.1]
Dredd0/0/14.23 ± 0.2190.309278.4 [239.2–315.8]
Fadd0/0/14.21 ± 0.2770.345-
Dronc0/1/13.62 ± 0.2210.391379.8 [339.5–426.0] b
Duba0/0/13.18 ± 0.2570.566348.2 [248.5–450.2] b
nsr1/1/03.00 ± 0.2790.672194.1 [127.4–262.5]
Bug220/1/02.82 ± 0.2780.559-
scat1/0/02.73 ± 0.259>3 a267.8 [185.8–359.0]
aux0/0/12.45 ± 0.1540.386311.0 [252.3–372.7]
nes0/0/02.27 ± 0.1300.423307.2 [253.7–365.2] b
poe0/0/02.10 ± 0.174>3 a328.7 [227.3–433.1]
Osbp0/1/02.05 ± 0.1800.601299.6 [230.3–375.4] b
Npc1a0/1/01.91 ± 0.157>3 a334.2 [231.5–442.6]
didum0/0/11.90 ± 0.1260.511337.0 [264.9–419.9]
Pen0/1/01.78 ± 0.1200.531273.2 [208.2–340.5]
klhl101/1/11.69 ± 0.1240.816-
Prosalpha6T1/1/01.68 ± 0.1510.559248.5 [185.6–315.1]
oys0/0/01.57 ± 0.1270.558-
gudu1/0/01.45 ± 0.1150.553347.7 [258.1–444.1]
Ance0/1/01.42 ± 0.0990.396-
sw0/0/11.38 ± 0.1713.712247.5 [133.2–374.3]
Taz0/0/01.33 ± 0.1110.607312.2 [231.9–401.0]
Mer0/0/11.30 ± 0.1300.936304.5 [208.4–409.9]
skap0/1/11.15 ± 0.1160.557314.4 [214.9–424.3] b
CdsA0/0/01.15 ± 0.1030.629350.5 [258.6–440.6] b
jar0/0/11.06 ± 0.0860.482403.2 [315.0–494.6] b
porin0/0/00.99 ± 0.1060.779-
Lasp0/0/10.98 ± 0.1380.930451.5 [288.4–633.0] b
Cul30/1/10.98 ± 0.1303.798223.1 [112.6–351.7] b
EcR0/0/00.93 ± 0.0910.789-
heph0/0/00.90 ± 0.1183.919-
eIF3m0/0/10.86 ± 0.0840.480363.0 [277.4–462.1]
shi0/0/10.74 ± 0.0923.847253.2 [124.3–397.0]
Past10/1/10.71 ± 0.0690.713387.4 [273.0–513.2] b
Vps280/0/00.63 ± 0.0790.822-
gish0/1/00.47 ± 0.0704.174262.9 [137.6–401.9]
mlt0/0/00.42 ± 0.5233.268244.6 [121.4–368.1] b
Chc0/0/10.32 ± 0.0350.700346.6 [242.1–464.4]
orb20/1/00.24 ± 0.0351.414180.4 [52.1–328.6]
a Data analyzed under exponential relaxed clock, with ucld.stdev estimated from inconclusive runs under an uncorrelated lognormal relaxed clock; b Coleoptera is rendered paraphyletic by the inclusion of Strepsiptera.
Table 5. Characteristics of the nucleotide phylogenetic data sets of sperm individualization genes in Coleoptera. The number of species (N), length of nucleotide sequence alignments (L), the determined evolutionary model, inferred evolutionary rates, and information on rate heterogeneity (ucld.stdev) are given for each gene.
GeneNLModelSubstitution Rate (×10−3)ucld.stdev
Cul3252196TN93 + G + I11.90 ± 2.6032.707
gish241197GTR + G + I9.34 ± 1.9812.821
Act5C151128GTR + G + I8.91 ± 2.2322.839
scat251974GTR + G + I7.26 ± 1.3972.958
eIF3m251155GTR + G + I7.06 ± 1.3942.872
poe233291GTR + G + I6.90 ± 1.3222.844
Dredd23732GTR + G + I6.41 ± 1.2553.012
CdsA211323GTR + G + I6.35 ± 1.2292.954
blanks25672GTR + G + I5.82 ± 1.1722.994
shi252610GTR + G + I5.81 ± 1.1612.918
skap241302GTR + G + I5.09 ± 0.9843.033
Dark141863GTR + G + I4.96 ± 0.9052.947
Duba20858GTR + G + I4.93 ± 0.9972.916
Prosalpha6T25822GTR + G + I4.90 ± 0.9593.041
Chc224944GTR + G + I4.78 ± 0.4100.270
klhl10141779GTR + G + I4.48 ± 0.8492.952
jar253393GTR + G + I4.47 ± 0.8403.005
didum215073GTR + G + I4.41 ± 0.8173.029
oys141347GTR + G + I4.41 ± 0.8393.019
ctp8267GTR + G3.79 ± 1.1070.232
mlt241248GTR + G + I3.61 ± 0.4640.474
sw251455GTR + G + I3.61 ± 0.3470.344
Taz23774GTR + G + I3.52 ± 0.2780.340
Fadd19228GTR + G + I3.41 ± 0.4950.463
nsr24780GTR + G + I3.39 ± 0.4640.409
orb28834GTR + G + I3.36 ± 0.8340.477
Npc1a233756GTR + G + I3.32 ± 0.2800.255
Dronc24954GTR + G + I3.17 ± 0.2650.221
EcR171278GTR + G + I3.13 ± 0.3960.382
Vps2826573GTR + G + I3.12 ± 0.5090.169
Osbp251881GTR + G + I3.09 ± 0.2850.365
Past1131566GTR + G + I3.09 ± 0.3440.186
aux182130GTR + G + I3.09 ± 0.2950.252
Lasp25423GTR + G + I3.08 ± 0.4950.110
gudu151848GTR + G + I2.93 ± 0.2800.450
Pen241440GTR + G + I2.92 ± 0.2520.296
porin25849GTR + G + I2.78 ± 0.3930.499
Mer231701GTR + G + I2.78 ± 0.2600.329
Ance181716GTR + G + I2.59 ± 0.1980.299
hmw8201GTR + G2.57 ± 0.4570.118
nes251317GTR + G + I2.08 ± 0.1710.538

