Article

Effects of Fat and Fatty Acids on the Formation of Autolysosomes in the Livers from Yellow Catfish Pelteobagrus Fulvidraco

1
Laboratory of Molecular Nutrition for Aquatic Economic Animals, Fishery College, Huazhong Agricultural University, Wuhan 430070, China
2
Laboratory for Marine Fisheries Science and Food Production Processes, Qingdao National Laboratory for Marine Science and Technology, Qingdao 266237, China
*
Author to whom correspondence should be addressed.
Genes 2019, 10(10), 751; https://doi.org/10.3390/genes10100751
Submission received: 4 July 2019 / Revised: 14 September 2019 / Accepted: 23 September 2019 / Published: 25 September 2019
(This article belongs to the Section Animal Genetics and Genomics)

Abstract

:
The autophagy-lysosome pathway, which involves many crucial genes and proteins, plays crucial roles in the maintenance of intracellular homeostasis by the degradation of damaged components. At present, some of these genes and proteins have been identified but their specific functions are largely unknown. This study was performed to clone and characterize the full-length cDNA sequences of nine key autolysosome-related genes (vps11, vps16, vps18, vps33b, vps41, lamp1, mcoln1, ctsd1 and tfeb) from yellow catfish Pelteobagrus fulvidraco. The expression of these genes and the transcriptional responses to a high-fat diet and fatty acids (FAs) (palmitic acid (PA) and oleic acid (OA)) were investigated. The mRNAs of these genes could be detected in heart, liver, muscle, spleen, brain, mesenteric adipose tissue, intestine, kidney and ovary, but varied with the tissues. In the liver, the mRNA levels of the nine autolysosome-related genes were lower in fish fed a high-fat diet than those fed the control, indicating that a high-fat diet inhibited formation of autolysosomes. Palmitic acid (a saturated FA) significantly inhibited the formation of autolysosomes at 12 h, 24 h and 48 h incubation. In contrast, oleic acid (an unsaturated FA) significantly induced the formation of autolysosomes at 12 h, but inhibited them at 24 h. At 48 h, the effects of OA incubation on autolysosomes were OA concentration-dependent in primary hepatocytes of P. fulvidraco. The results of flow cytometry and laser confocal observations confirmed these results. PA and OA incubation also increased intracellular non-esterified fatty acid (NEFA) concentration at 12 h, 24 h and 48 h, and influenced mRNA levels of fatty acid binding protein (fabp) and fatty acid transport protein 4 (fatp4) which facilitate FA transport in primary hepatocytes of P. fulvidraco. The present study demonstrated the molecular characterization of the nine autolysosome-related genes and their transcriptional responses to fat and FAs in fish, which provides the basis for further exploring their regulatory mechanism in vertebrates.

Graphical Abstract

1. Introduction

Autophagy is significantly conserved during evolution and plays important regulatory roles in the degradation of intracellular components through the lysosomes [1,2]. Lysosomes are acidic organelles responsible for the catabolism of damaged organelles and macromolecules following their fusion with autophagosomes [3]. Thus, the autophagy–lysosome pathway plays crucial roles in the maintenance of intracellular homeostasis by the degradation of damaged components. The important pathway involve many crucial genes and proteins, some of which have been identified but their specific functions are largely unknown. Among these genes and proteins, CORVET (class C core vacuole/ endosome tethering) and HOPS (homotypic fusion and protein sorting) belong to the members of the Vps-C complexes, regulate the membrane fusion and control membrane traffic [4,5]. HOPS controls the membrane fusion at the vacuolar lysosomes [5]. Accordingly, CORVET and HOPS play vital roles in the maintenance of the physiological integrity and functions of eukaryotic cells [6,7]. Class C Vps members include vacuolar protein sorting-associated protein (Vps) 11 (Vps11), Vps18, Vps16 and Vps33, which mediate the multiple pathways for vesicle transport [8,9]. Vps39 and Vps41 are two accessory subunits. They interact with the Vps-C core to form the large Class C Vps/HOPS complex [10]. Transcription factor EB (TFEB) modulates the expression of autophagy-related genes and mediates the formation of autophagosome and the degradation of lysosomes [11]. The members of the cathepsin family belong to the proteinase from the lysosomes [12]. Among these members, cathepsin D1 (CTSD1) plays an important role in the degradation of proteins mediated by lysosomes [13]. Lysosome-associated membrane glycoprotein1 (LAMP1) plays important roles in the auto (phago)-lysosomal fusion during the autophagic process [14]. Mucolipin-1 (MCOLN1) is one crucial lysosomal membrane protein and the calcium channel even involved in TFEB activation [15]. At present, the information of these genes and proteins has been investigated in many organisms, including Drosophila, Caenorhabditis elegans and mammals [16], suggesting that their functions were conserved among eukaryotes. However, in fish, studies involved in the sequence information of these genes have been very scarce. They have been reported in very limited numbers of fish, such as zebrafish Danio rerio vps11, vps18 and tfeb [17,18,19], ctsd1 in channel catfish [20], tilapia [21], sea bream [22]. Their mRNA tissue expression was also explored in several fish [21,22,23,24]. However, the molecular characterization and tissue distribution of lamp1, mcoln1, vps41, vps16 and vps33b genes are still unknown in teleosts. Identification of these autolysosome genes was a key step for elucidating the important roles autophagy plays in fish.
Fat is one of the main nutrients in the diet and provides essential fatty acids and energy for fish. Adequate dietary fat levels promote the growth of fish. However, high fat levels can lead to excessive lipid deposition in the liver and induce the occurrence of many metabolic diseases which is mediated by lipotoxicity [25,26]. Fatty acid-induced hepatic lipotoxicity results in the occurrence of non-alcoholic fatty liver disease [25,27]. At present, evidence indicates that the autophagy–lysosome pathway is involved in the lipid-induced physiological and pathological responses [28]. Singh et al. (2009) pointed out that autophagy-mediated lipophagy helped to remove excess lipid droplets in hepatocytes [29]. However, how autophagy is modulated by fatty acids remains largely unknown [27]. Based on their structure, fatty acids are classified as unsaturated and saturated fatty acids, respectively. Palmitic acid (PA) and oleic acid (OA) belong to the saturated and unsaturated fatty acids, respectively. They are also the predominant FAs present in the diet and in serum [30]. Studies suggested that PA and OA had different effects on TG (triglyceride) accumulation and autophagy [31,32]. However, this has not been explored in detail. High-fat foods have been consumed in higher quantities in recent decades, which has led to the occurrence of obesity worldwide. Therefore, understanding the mechanism involved high fat-induced obesity becomes extremely important.
Fish are the biggest category of vertebrates in the world, but relevant studies of autophagy are very scarce [27]. Here, we identified the full-length cDNA sequences of nine important genes involved in autophagy–lysosome docking and fusion (vps11, vps16, vps18, vps33b, vps41, lamp1, mcoln1, ctsd1 and tfeb) and explored their mRNA tissue expression in yellow catfish P. fulvidraco, an economic teleost in several Asian countries. Then, their mRNA expression for fish fed high-fat diets was also investigated, and the differential effects of PA and OA on mRNA levels of these genes and autophagy were understood.

2. Materials and Methods

Three experiments were performed. Experiment 1 was conducted to identify nine autolysosome-related genes, and study their mRNA tissue expression. Experiment 2 determined their expression in the liver of yellow catfish fed two lipid levels of diets. Experiment 3 explored the transcriptional responses of those genes and the formation of autolysosome in the hepatocytes of yellow catfish after PA and OA incubation, respectively. All experiments in the animals and cells followed the ethical guidelines of Huazhong Agricultural University (HZAU) and the manuscript conforms to the ARRIVE Guidelines for Reporting Animal Research. The experimental protocols were approved by the Ethical Committee of HZAU (identification code: Fish-2017-0219, Date: 28 September 2017).

2.1. Identification and Tissue Distribution of Gene Expression

Mixed sexes of yellow catfish P. fulvidraco (initial weight: 22.48 ± 3.15 g) were obtained from a farm in Wuhan (Hubei Province, China). Liver, spleen, muscle, brain, mesenteric fat, heart, intestine, kidney and ovary were collected from 12 similar-sized fish by using sterile scissors and pincers. They were frozen quickly in liquid nitrogen and kept at −80 °C for cloning and tissue expression analysis. In our study, tissue samples from 4 fish were mixed together and used as one biological replicate. The experimental procedures for RNA isolation and cDNA cloning were similar to those by Wei et al. [27]. Information of primers was shown in Supplementary Table S1. Their full-length cDNA sequences were obtained by the nested 3′ and 5′ RACE PCR (Rapid-Amplification of cDNA Ends PCR), and analyzed using the program EDITSEQ (DNA star) to search for the open reading frame (ORF). Standard genetic codes were used to translate them into amino acid sequences. We aligned these sequences, assessed the percentage of amino acid conservation by using Clustal-W tools, and analyzed their domains by the CDD (Conserved Domain Database) tool (http://www.ncbi.nlm.nih.gov/Structure/cdd/wrpsb.cgi). The neighbor-joining (NJ) method with MEGA 5.0 [33], was used to build the phylogenetic trees. The detailed protocols were described in our recent publication [27]. Bootstrap sampling was reiterated 1000 times.

2.2. Feed Preparation and Fish Culture

The feed formulation, culturing and management of P. fulvidraco were shown in our parallel study [34]. Briefly, two diets were formulated with dietary lipid levels at 11.34% and 15.41%, respectively. Fish oil and soybean oil (1:1, w/w) were used as the lipid sources. Dietary lipid levels were chosen based on our preliminary trial, and 11.34% and 15.41% of dietary lipid levels were considered to be adequate and excessive levels for P. fulvidraco, respectively. They were kept in the freezer at −20 °C until used. Each diet was assigned to three tanks in a completely randomized design, with 6 tanks for the experiment. Thirty uniform-sized fish (mean initial weight: 3.79 ± 0.16 g) were stocked in each fiberglass tank (300 L water volume), and were fed to apparent satiation twice daily. The experiment continued for 8 weeks.

2.3. In Vitro Studies

2.3.1. Primary Hepatocytes Culture and Treatments

Primary hepatocytes were isolated and cultured from P. fulvidraco, based on the methods previously described [35,36]. They were incubated in a 28 °C incubator with 5% CO2 with OA and PA, respectively. Sampling occurred at 12 h, 24 h and 48 h, respectively. For each FA incubation, four treatments were chosen: control, 0.1 mM, 0.25 mM and 0.4 mM PA/OA addition. The concentration was based on our pilot trials and these are in public publications [37,38]. Each treatment had three replicates.

2.3.2. Cell Viability and Non-Esterified Fatty Acid (NEFA) Concentrations Detection

MTT (3-(4, 5-dimethylthiazol-2-yl)-2,5 diphenyl tetrazolium bromide)was used to test the cell viability after Wu et al. [35]. Non-esterified fatty acid (NEFA) concentrations were determined by the commercial kits (Nanjing Jiancheng Bio-engineering Institute, China) according to the manufacturer’s instructions.

2.3.3. Flow Cytometry and the Laser Confocal Microscope for Detecting the Formation of Autolysosomes

Cells were cultured in 12-well plates and treated with the corresponding reagents for the designed times, respectively. Thereafter, cells were stained with LysoTrackerTM Red DND-99 (L7528; Thermo Fisher Scientific), and FA-induced changes of autolysosomes activity were detected by flow cytometry [29]. In addition, hepatocytes of yellow catfish were co-stained with Hoechst (blue) and Lyso Tracker (red). The intensity of fluorescence was visualized by a laser-scanning confocal microscope (Leica Microsystems, Wetzlar, Germany), and quantified on a CytoFLEX Flow Cytometer (Beckman Coulter, WA, USA) and data analysis was performed using FlowJo VX software (Beckman Coulter, WA, USA).

2.3.4. Real-Time Quantitative Polymerase Chain Reaction (qPCR)

The mRNA expression of nine genes were measured by the quantitative polymerase chain reaction (qPCR) methods described in our recent publications [27,34]. In order to test their transcriptional stability, we selected ten housekeeping genes (18s rRNA, β-actin, rpl7, tuba, b2m, elfa, gapdh, tbp, hprt and ubce). Supplementary Table S2 shows the primer sequences of all these genes. The 2-ΔΔCt method was used to calculate mRNA expression after normalizing to the geometric mean of the best combination of two genes, which was determined by geNorm. The present study found that gapdh and rpl7 (M = 0.1295), b2m and 18s rRNA (M = 0.1152) showed the most stable expression in mRNA tissue expression and feeding experiments, and that b2m and rpl7 (M = 0.2456), gapdh and 18s rRNA (M = 0.1887, M = 0.3412), tuba and β-actin (M = 0.1550), b2m and gapdh (M = 0.3417, M=0.1473) were the most stable in the in vitro studies.

2.4. Statistical Analysis

The data were presented as means ± standard error of the mean (SEM). Before statistical analysis, the Kolmogornov–Smirnov test was used to analyze their normality of distribution. Then, one-way analysis of variance (ANOVA) and Duncan′s multiple range tests were used to analyze the significant differences of the data among the treatments. Student’s t-tests were used to compare the differences between two groups. SPSS 19.0 (IBM, Armonk, NY, USA) was used to perform these analyses. Significant levels were set at p < 0.05.

3. Results

3.1. Molecular Characterization

We obtained the full-length cDNA sequences of nine autolysosome-related genes (vps11, vps16, vps18, vps33b, vps41, lamp1, mcoln1, ctsd1 and tfeb) from P. fulvidraco (Table 1). They ranged from 1496 bp to 3379 bp, with open reading frame (ORF) of 1245–2979 bp, respectively, encoding the protein of 396–992 amino acids (aa). We aligned these predicted polypeptide sequences and listed the amino acid sequences of nine autophagy-related genes among different species in Table 2. The structures of P. fulvidraco vps11, vps16, vps18, vps33b, vps41, lamp1, mcoln1, ctsd1 and tfeb exhibited 27.61%–96.02% amino acid sequence identities compared to those from other species.
Protein sequence analysis predicted that VPS11 was a soluble protein and had a Clathrin repeat domain, a RING-H2 domain, RING-H2 finger motif and Zn binding site (Supplementary Figure S1). The P. fulvidraco VPS16 consisted of an N-terminal domain, and a C-terminal domain with coiled coil domain (Supplementary Figure S2). The P. fulvidraco VPS18 structure was similar to those in mammals, and included the Clathrin repeat domain and the RING-H2 finger domain with RING-H2 finger motif and Zn binding site (Supplementary Figure S3). The P. fulvidraco VPS33B was cytosolic and contained a Sec1 domain (Supplementary Figure S4). P. fulvidraco VPS41 included the Clathrin repeat domain, RING-H2 domain with RING-H2 finger motif and several Zn binding sites (Supplementary Figure S5). P. fulvidraco LAMP1 included the conservative luminal domain, transmembrane helix domain, C-terminal tail and one hinge region (Supplementary Figure S6). We also found the conserved catalytic cysteine residue and N-glycosylation site in P. fulvidraco LAMP1 (Supplementary Figure S6). P. fulvidraco MCOLN1 showed similar architecture with mammals, containing six transmembrane domains, C-terminal cytoplasmic tails and channel pore (Supplementary Figure S7). CTSD1 from P. fulvidraco was composed of propeptide, signal peptide and N-glycosylation site, KKXX-like motif (Supplementary Figure S8). The conserved catalytic cysteine residues were also found in P. fulvidraco CTSD1. TFEB included conserved helix-loop-helix domain, the leucine zipper, glutamine-rich basic domain (QB), charged helical domain, consensus MAP kinase phosphorylation site (MAPK) and some DNA binding sites (Supplementary Figure S9). The analysis of the phylogenetic tree further verified the genes and visualised the inferred evolutionary relationship (Supplementary Figures S10–S18).

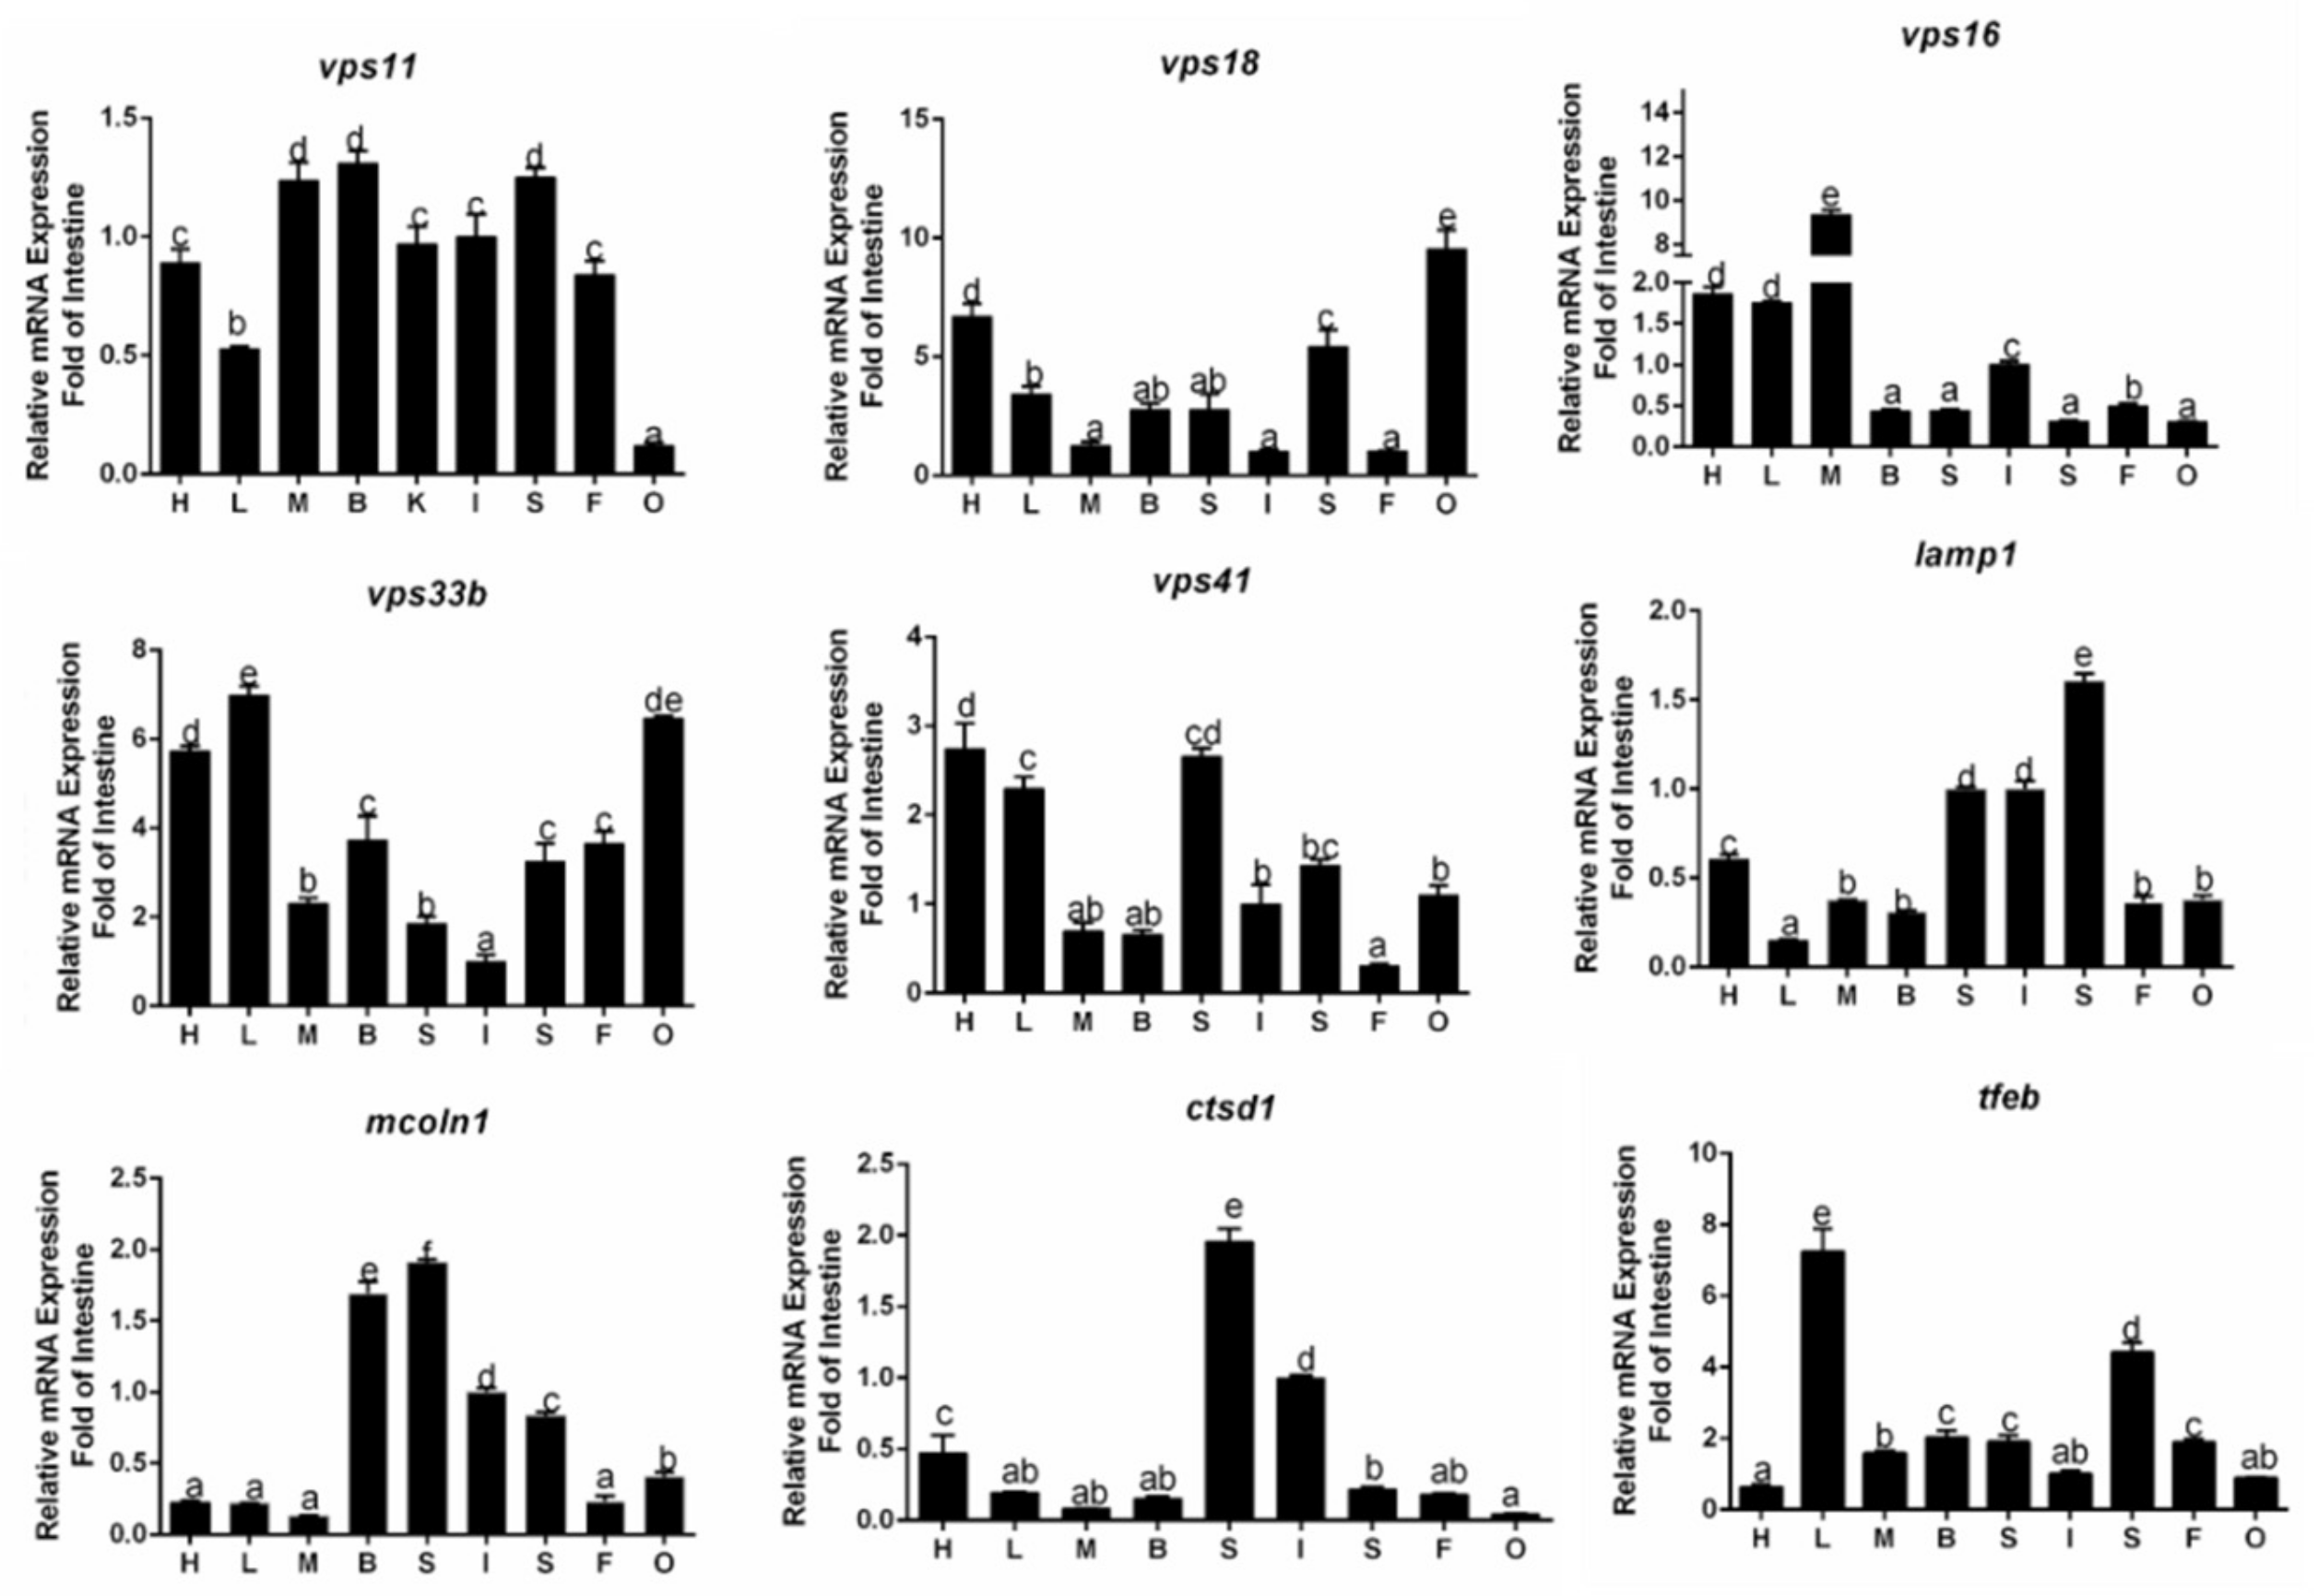
3.2. Tissue Distribution of Gene Expression

mRNAs of these nine genes were widely detected in all sampled tissues, but their abundances differed (Figure 1). The vps11 mRNA level was highest in the brain, muscle and spleen, followed by intestine, kidney, fat, heart, and liver, and lowest in the ovary (Figure 1). The vps16 mRNA was predominant in the muscle, then in the heart, liver and intestine, and lowest in the fat, ovary, brain, kidney and spleen. The vps18 mRNA was predominant in the ovary, then in heart, spleen, liver, brain and kidney, and lowest in muscle, intestine and fat. The vps33b had the highest expression in the liver and ovary, then in the heart, brain, fat, spleen, muscle and kidney, and lowest in the intestine. The vps41 mRNA was highest in the heart and kidney, then in the liver, spleen, ovary, intestine, muscle and brain, and lowest in fat. The lamp1 mRNA was predominant in the spleen, then in the intestine, kidney, heart, muscle, brain, fat and ovary, and lowest in the liver. The mcoln1 mRNA was highest in the kidney, then in the brain, intestine, spleen and ovary, and lowest in the heart, fat, liver and muscle. The mRNA expression of ctsd1 was predominant in the kidney, then in the intestine, heart, spleen, mesenteric fat, liver, brain and muscle, and lowest in the ovary. tfeb mRNA abundances were the highest in the liver, then in the spleen, brain, kidney, mesenteric fat, muscle, ovary and intestine, and lowest in the heart.

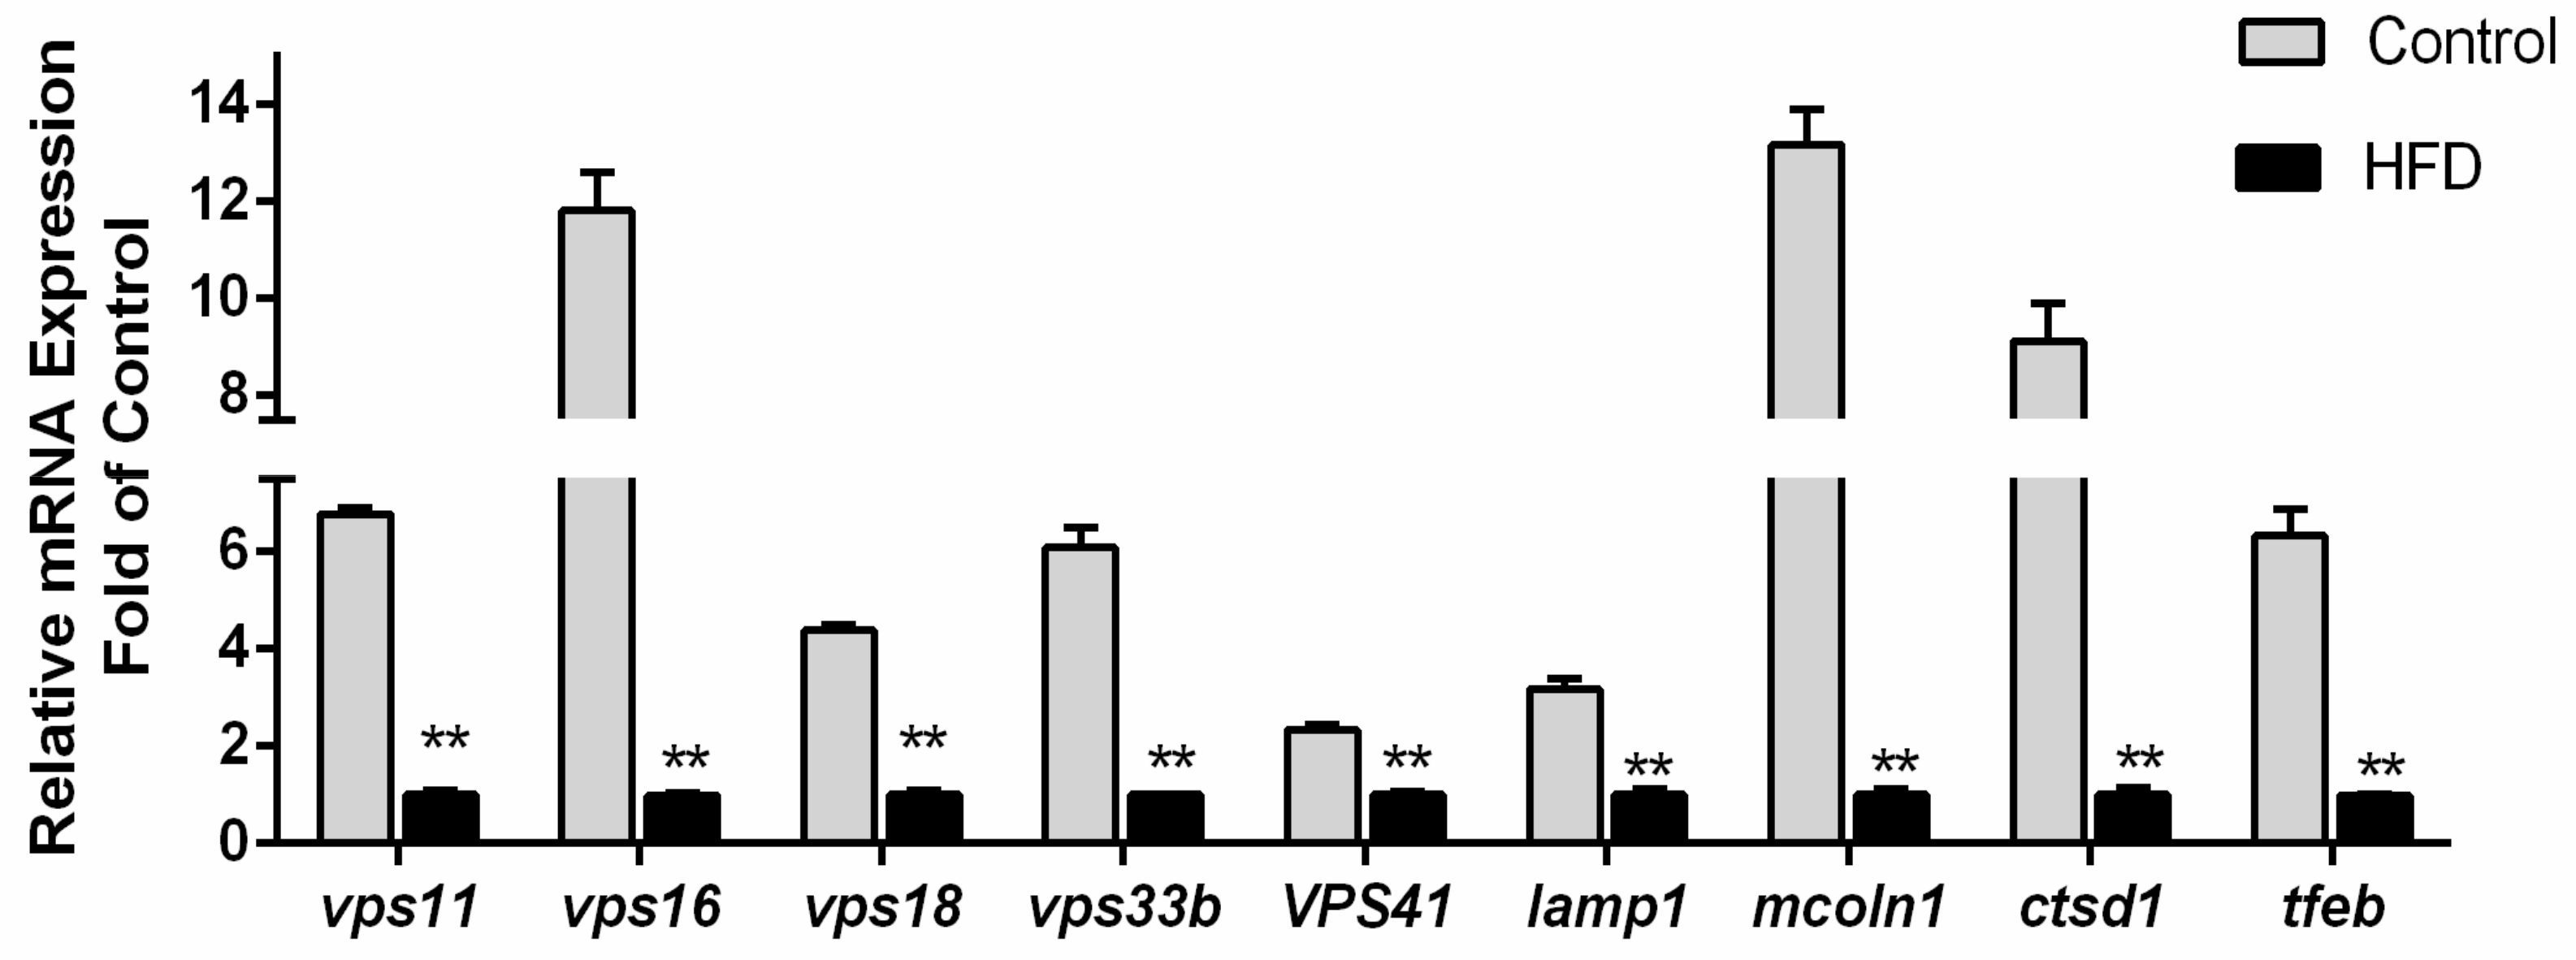
3.3. Transcriptional Responses of Nine Autolysosome-Related Genes by High-Fat Diet

Figure 2 showed the effects of a high-fat diet on the mRNA levels of the nine autolysosomes-related genes in the liver of yellow catfish. The mRNA levels of all these nine genes (vps11, vps16, vps18, vps33b, vps41, lamp1, mcoln1, ctsd1 and tfeb) were significantly down-regulated (p < 0.05) by high-fat diets.

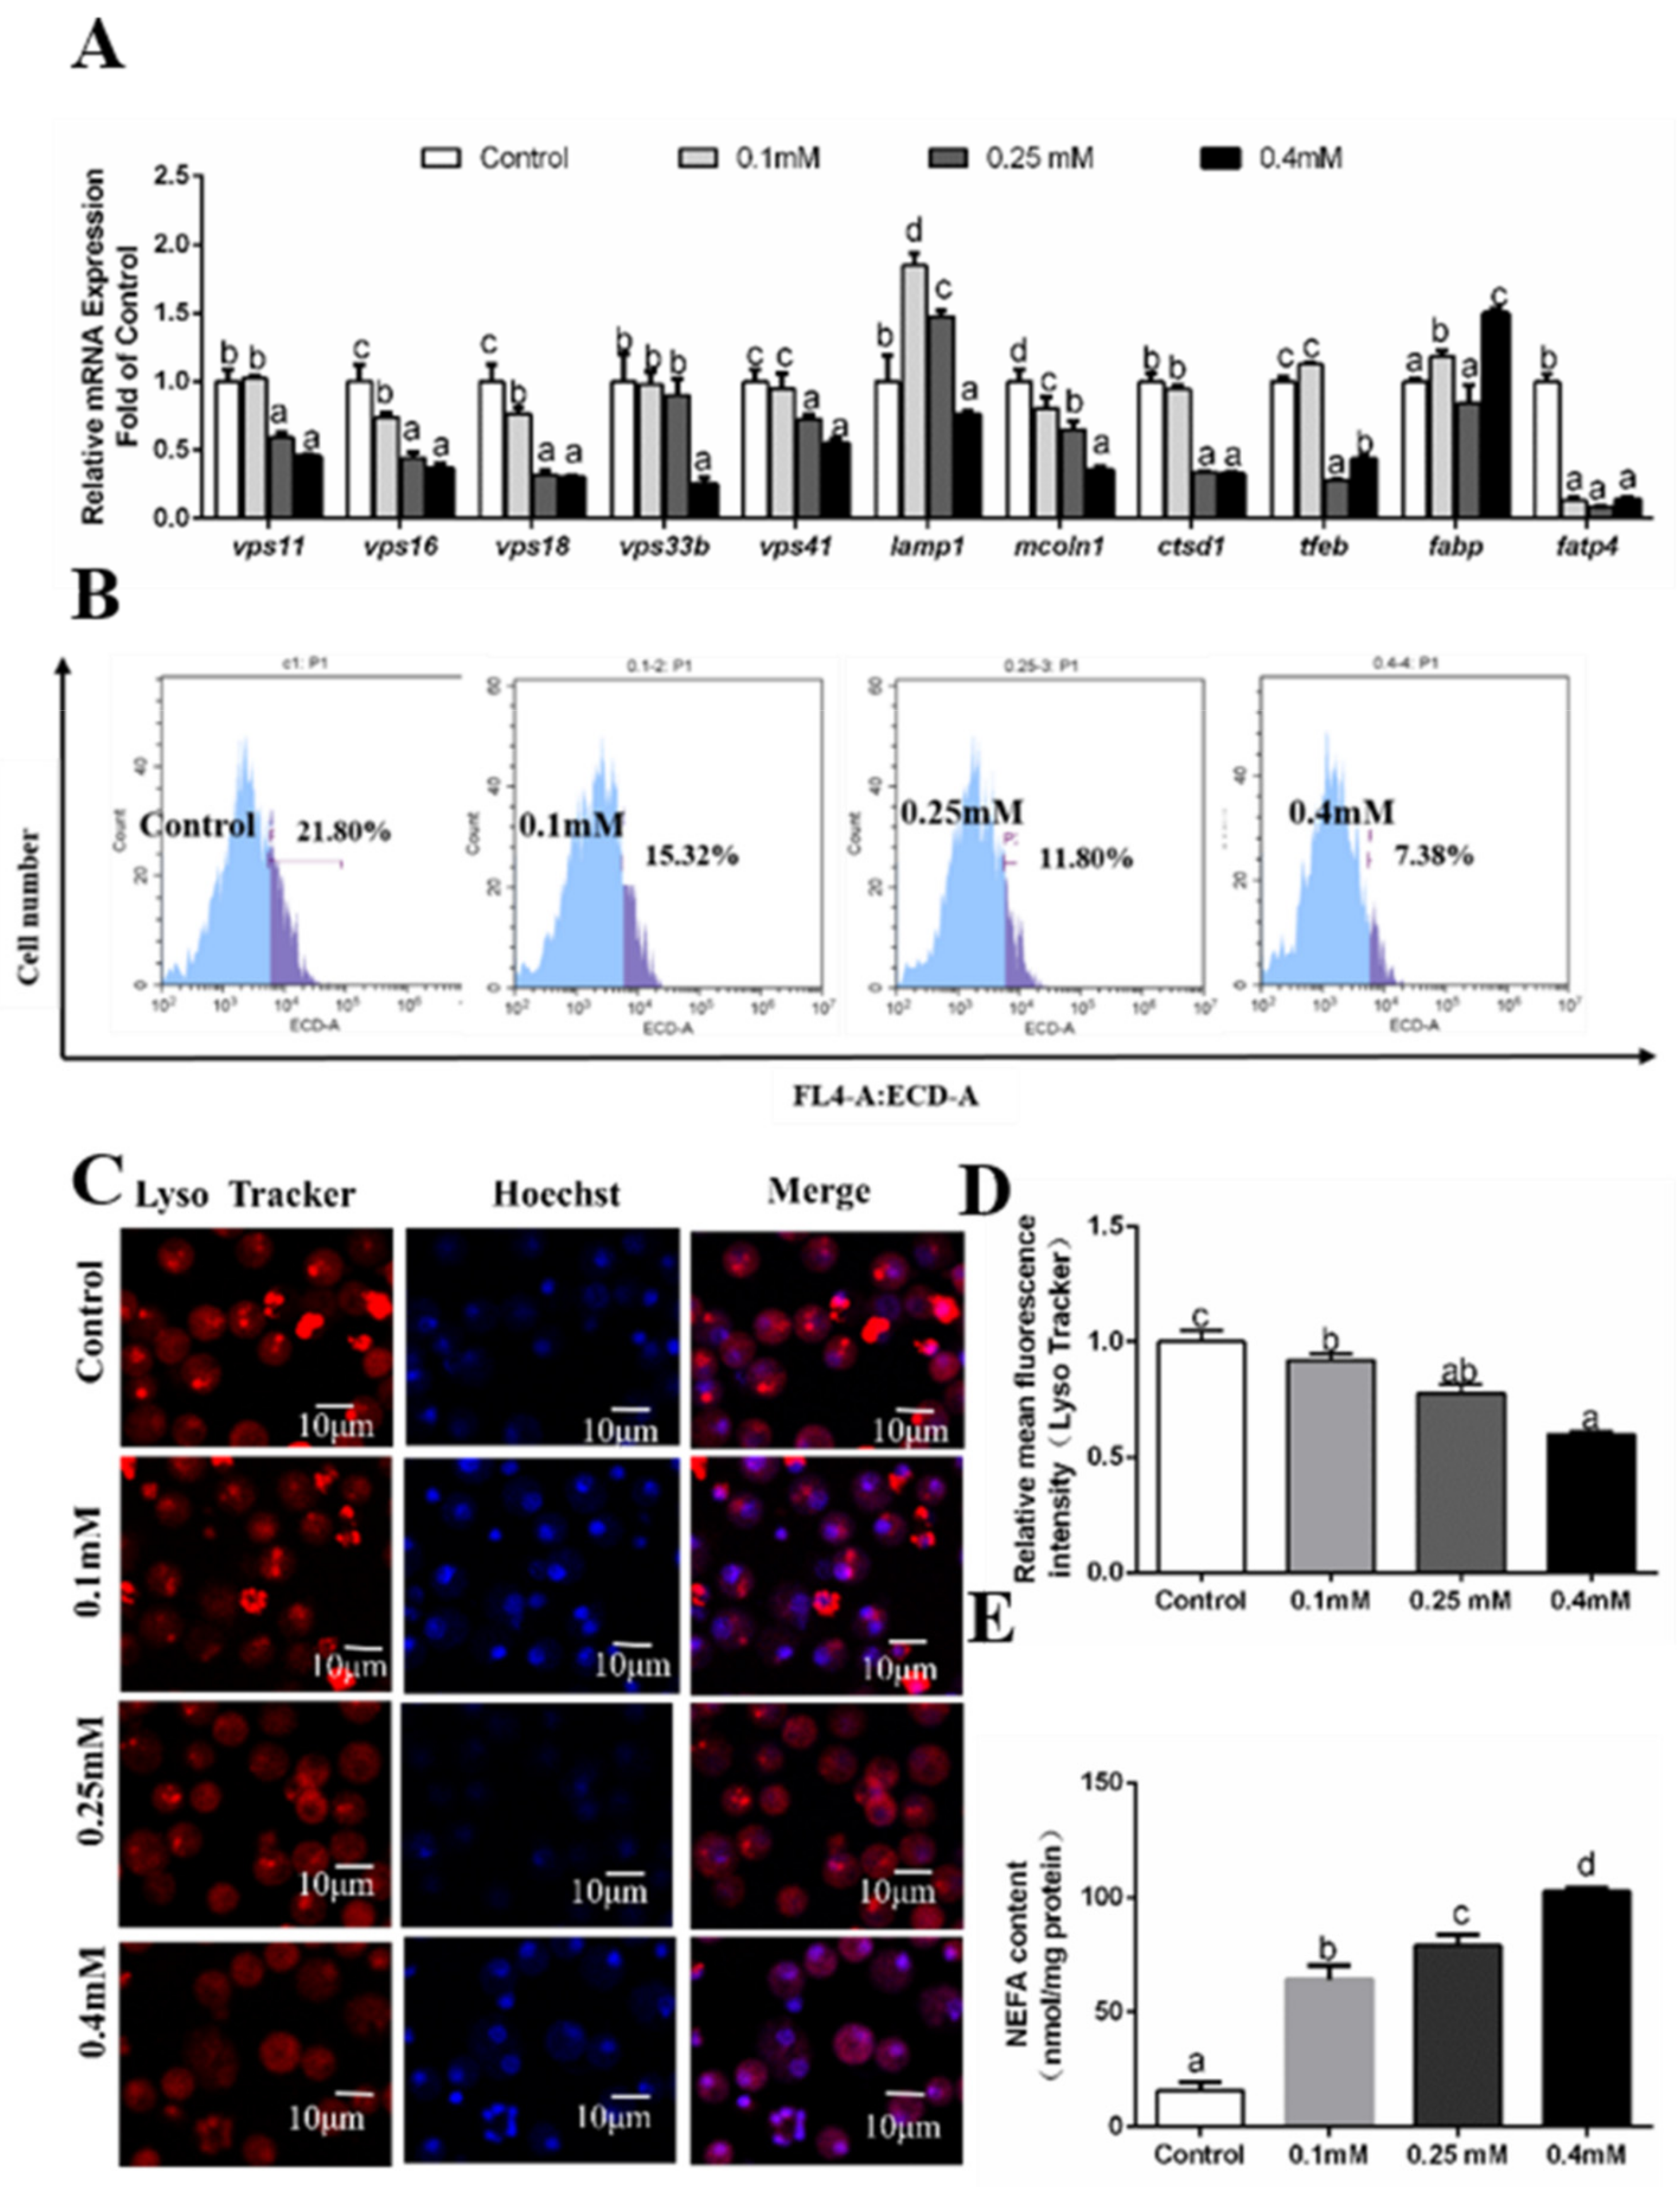
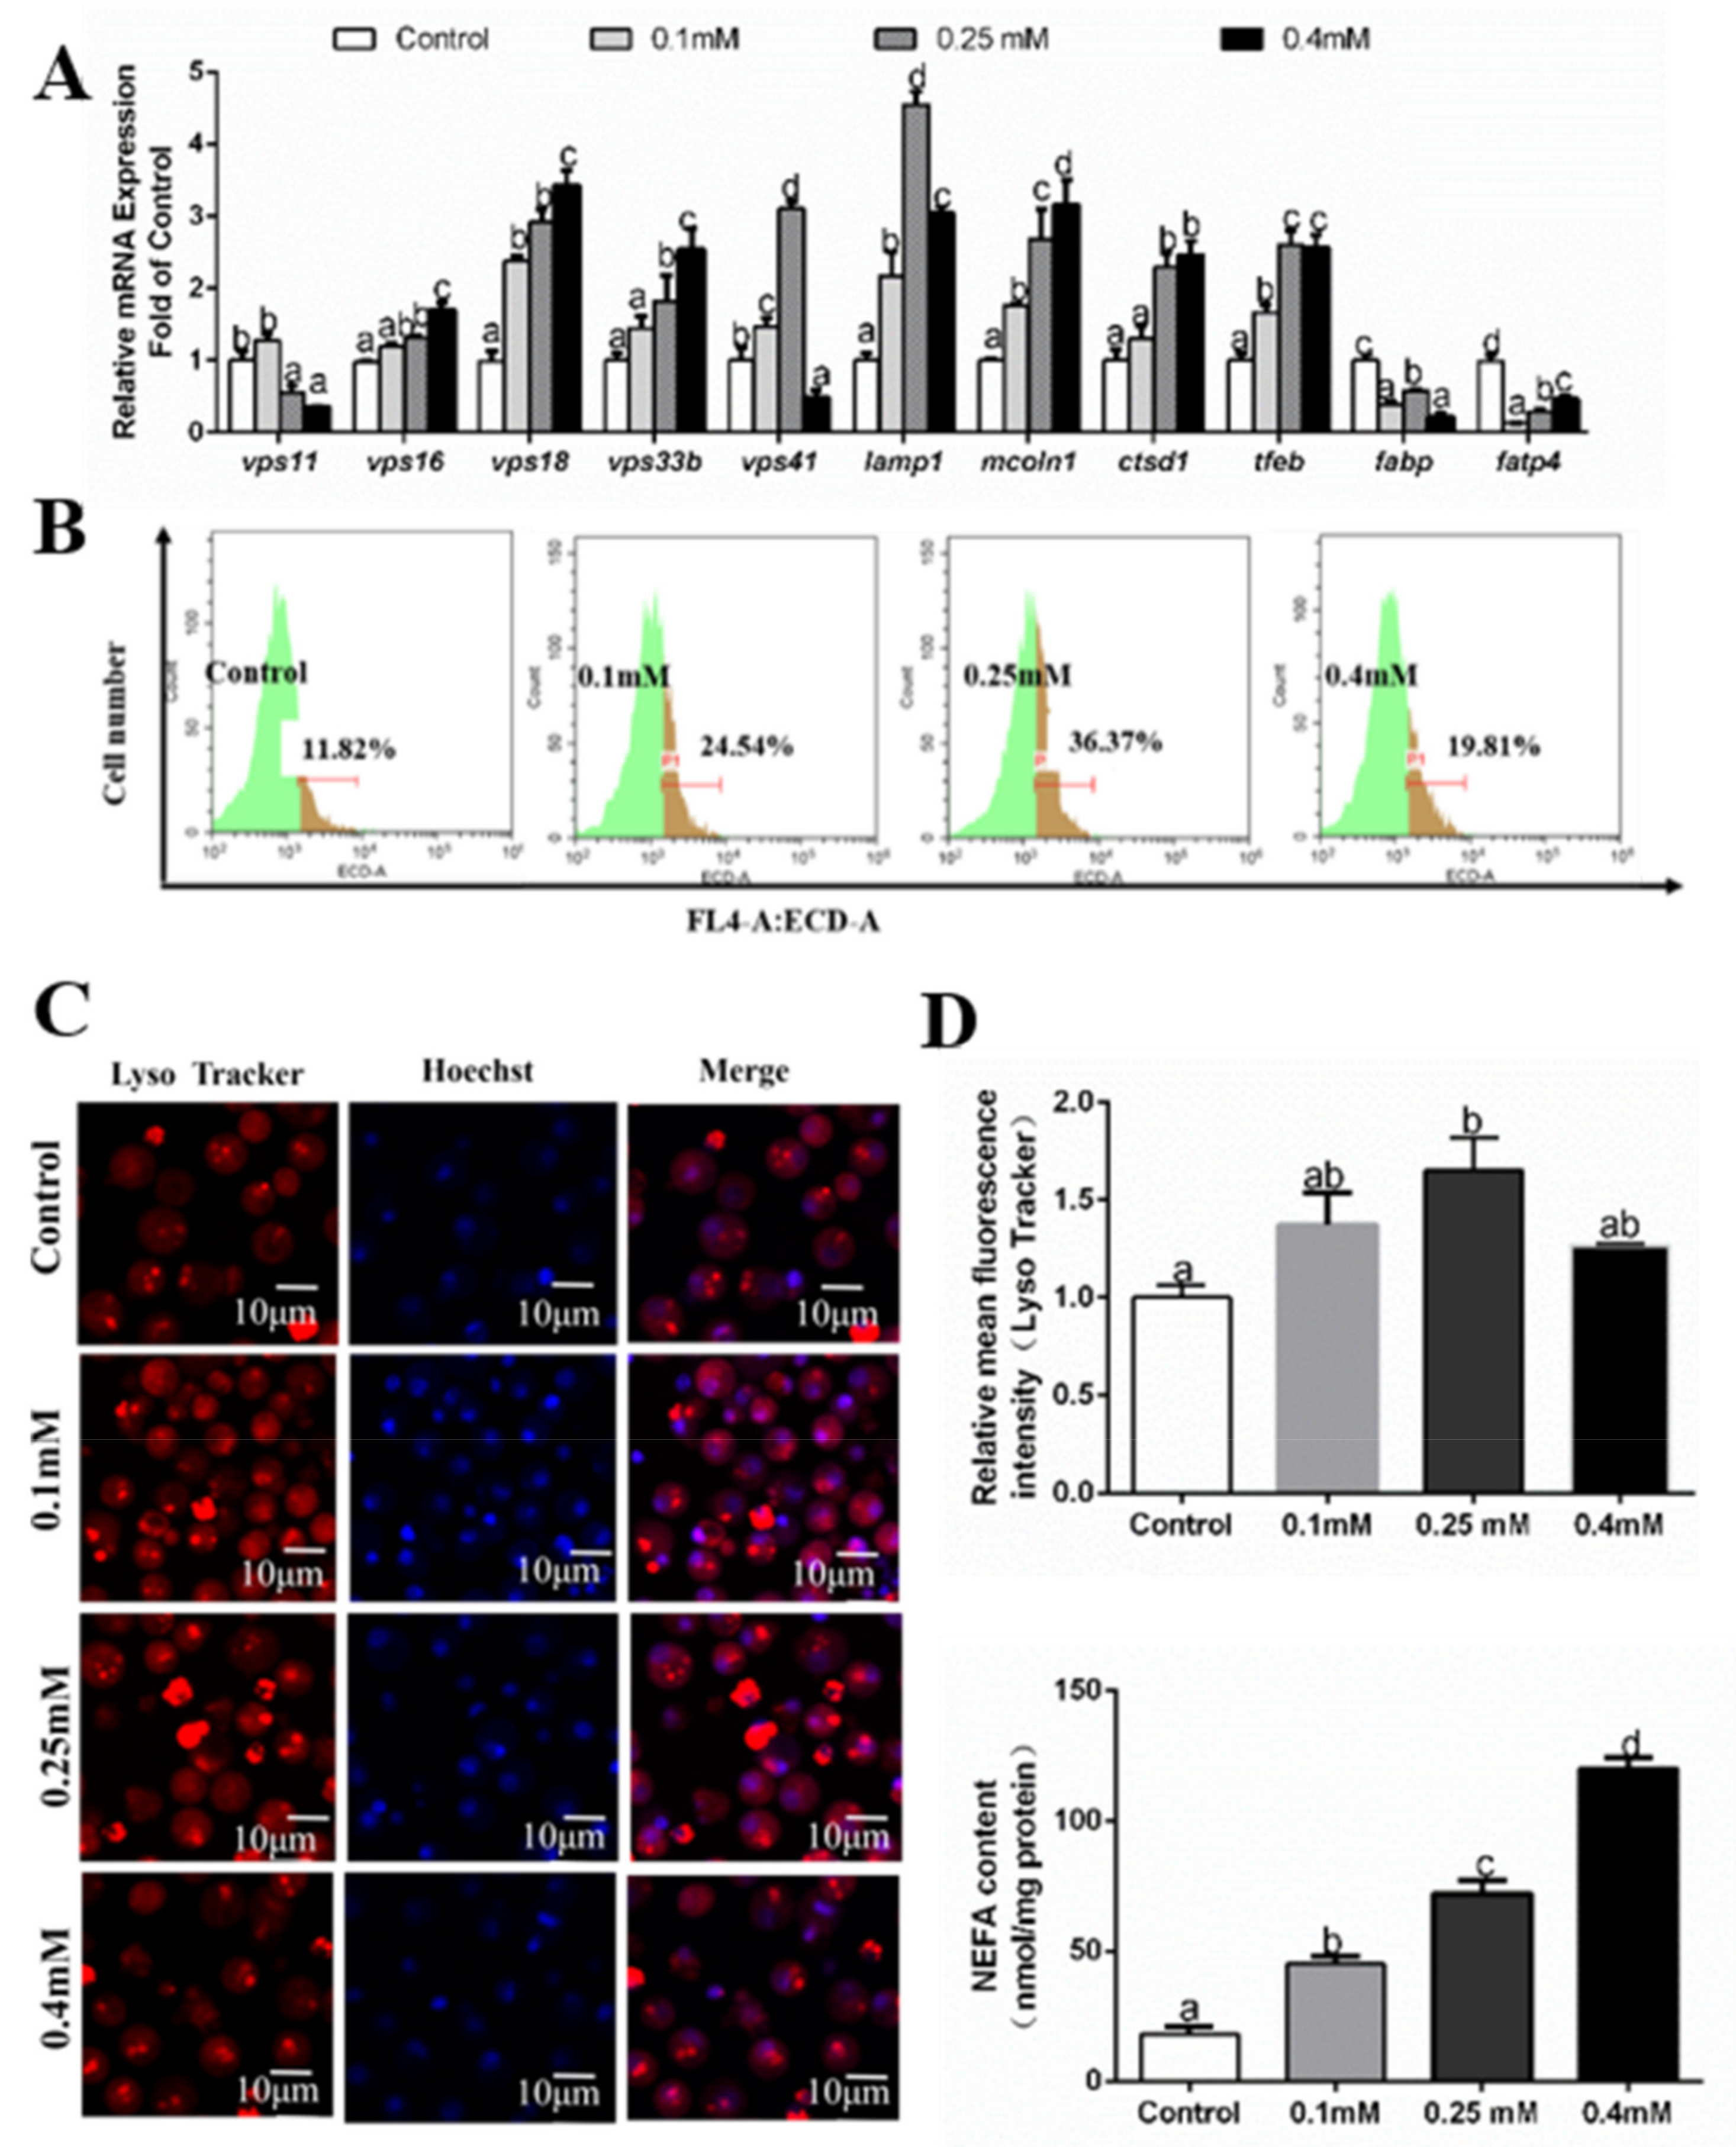
3.4. Effects of Palmitic Acid (PA) Incubations on the Formation of Autolysosomes

The MTT assay showed that PA concentrations of not more than 0.5 mM had no adverse influence on the viability of hepatocytes, which were chosen for the experiments. Among four PA groups, at 12 h, mRNA levels of vps11, vps16, vps33b, vps41, mcoln1 and ctsd1 were the highest for the 0.1 mM group and lowest for the 0.4mM PA group (Figure 3A). High PA concentrations (more than 0.25 mM) significantly reduced vps18 and tfeb mRNA levels. Among four PA treatments, the lamp1 mRNA expression was the lowest for 0.4 mM PA group (Figure 3A). The mRNA levels of fabp and fatp4 were very variable and not related to PA concentrations. NEFA contents increased with increasing PA concentrations (Figure 3E). We also used LysoTracker Red staining for detecting the formation of autolysosomes. Flow cytometry results showed that PA addition significantly inhibited the formation of autolysosomes (Figure 3B,D). The results of laser confocal microscopy confirmed that autolysosomes were significantly inhibited after 12 h PA incubation (Figure 3C).
At 24 h, mRNA expression of vps11 and ctsd1 was predominant for the control and 0.1 mM PA group and lowest for other two groups (Figure 4A). The mRNA levels of vps16, vps18, vps33b, vps41 and mccoln1 tended to decline with increasing PA concentrations. The lamp1 mRNAs were predominant for the 0.1 mM PA group and low for the 0.4 mM PA group. tfeb mRNAs were the lowest for the 0.25 mM PA group and highest for the 0.1 mM PA group and the control. fabp mRNAs were observed to be the highest in the 0.4 mM PA group and lowest in the control and 0.25 mM PA group (Figure 3C). PA addition in the medium reduced fatp4 mRNA level (Figure 4A). NEFA contents increased with increasing PA concentrations (Figure 4E). We also used LysoTracker Red staining for detecting the formation of autolysosomes. Flow cytometry results showed that PA addition significantly inhibited the formation of autolysosomes (Figure 4B,D). The results of laser confocal microscopy confirmed that autolysosomes were significantly inhibited after 24 h PA incubation (Figure 4C).
At 48 h, compared to the control, PA reduced mRNA abundances of vps11, vps33b and tfeb (Figure 5A), but tended to upregulate the vps16 mRNAs. The mRNA expression of vps18 and lamp1 was higher in the control and 0.1 mM PA group than those in 0.25 mM and 0.40 mM PA groups. The vps41 mRNA level was very variable and not related to PA incubation. The ctsd1 mRNA level showed no significant differences among the four groups. PA addition significantly up-regulated fabp mRNA level but down-regulated fatp4 mRNA level (Figure 5A). NEFA content increased with increasing PA incubation (Figure 5E). The flow cytometry analysis after Lyso Tracker staining indicated that 48 h PA incubation significantly reduced the formation of autolysosomes (Figure 5B,D). The laser confocal observation indicated that PA treatment significantly inhibited the formation of autolysosomes (Figure 5C).

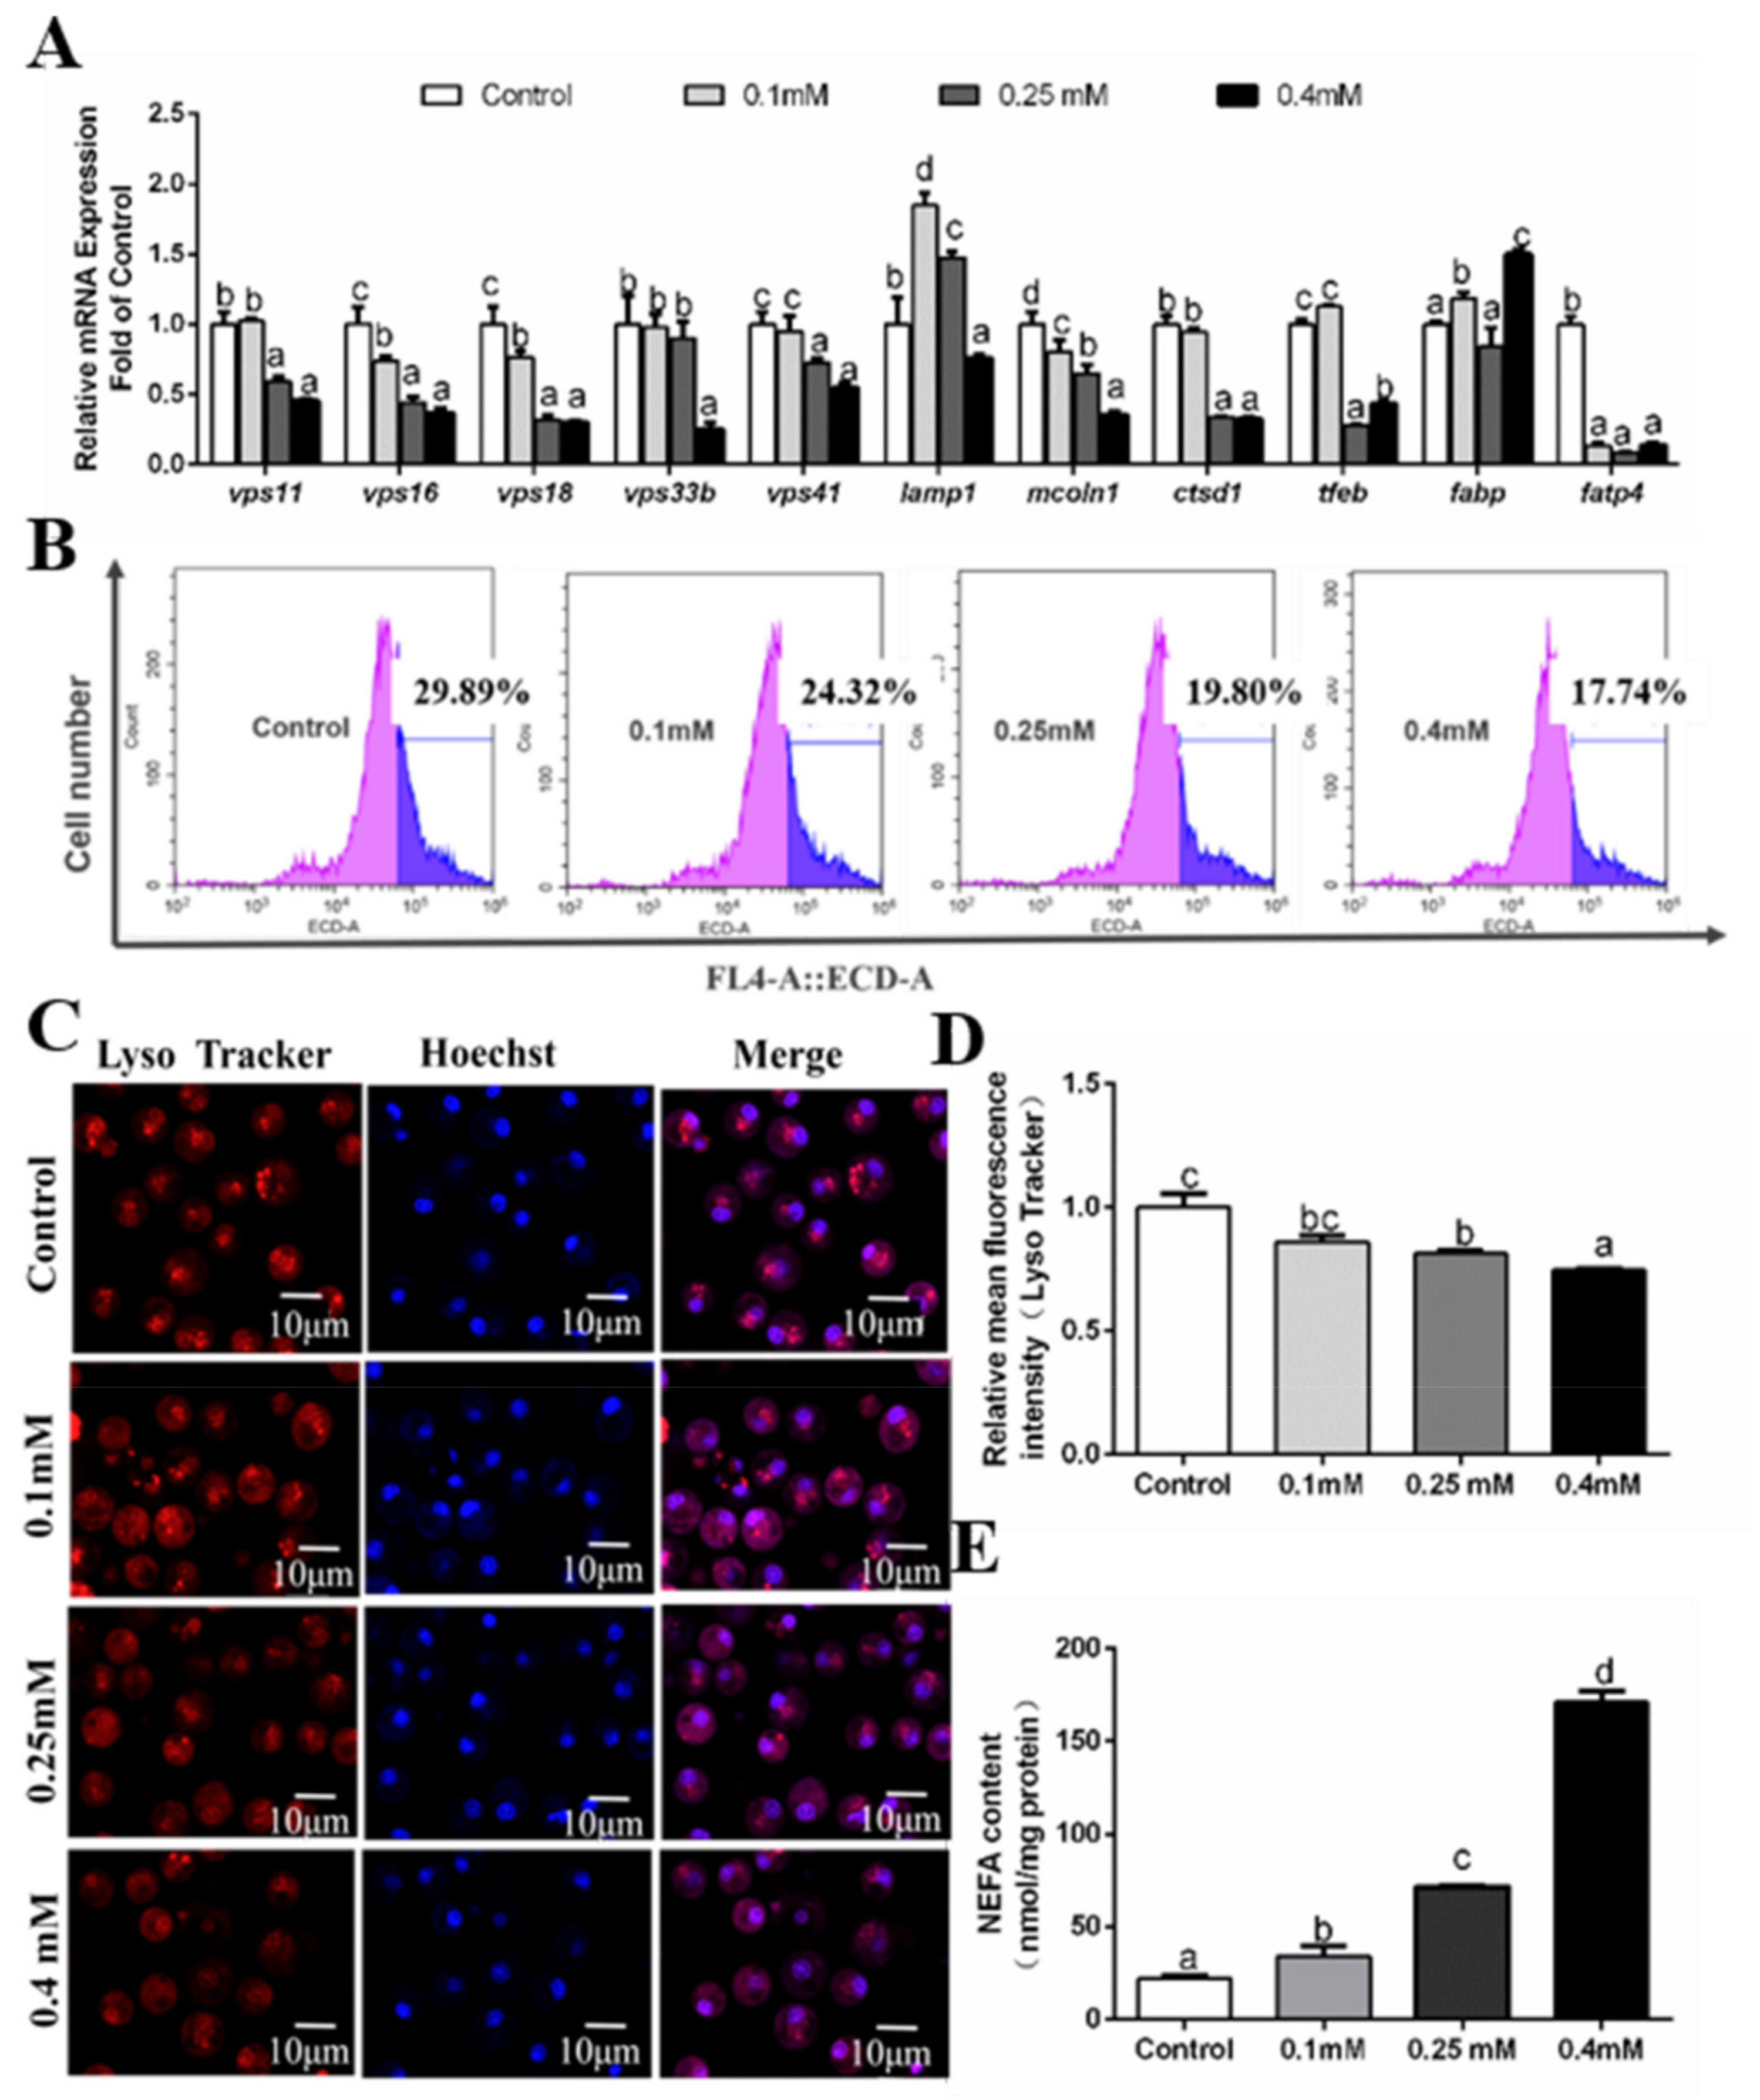
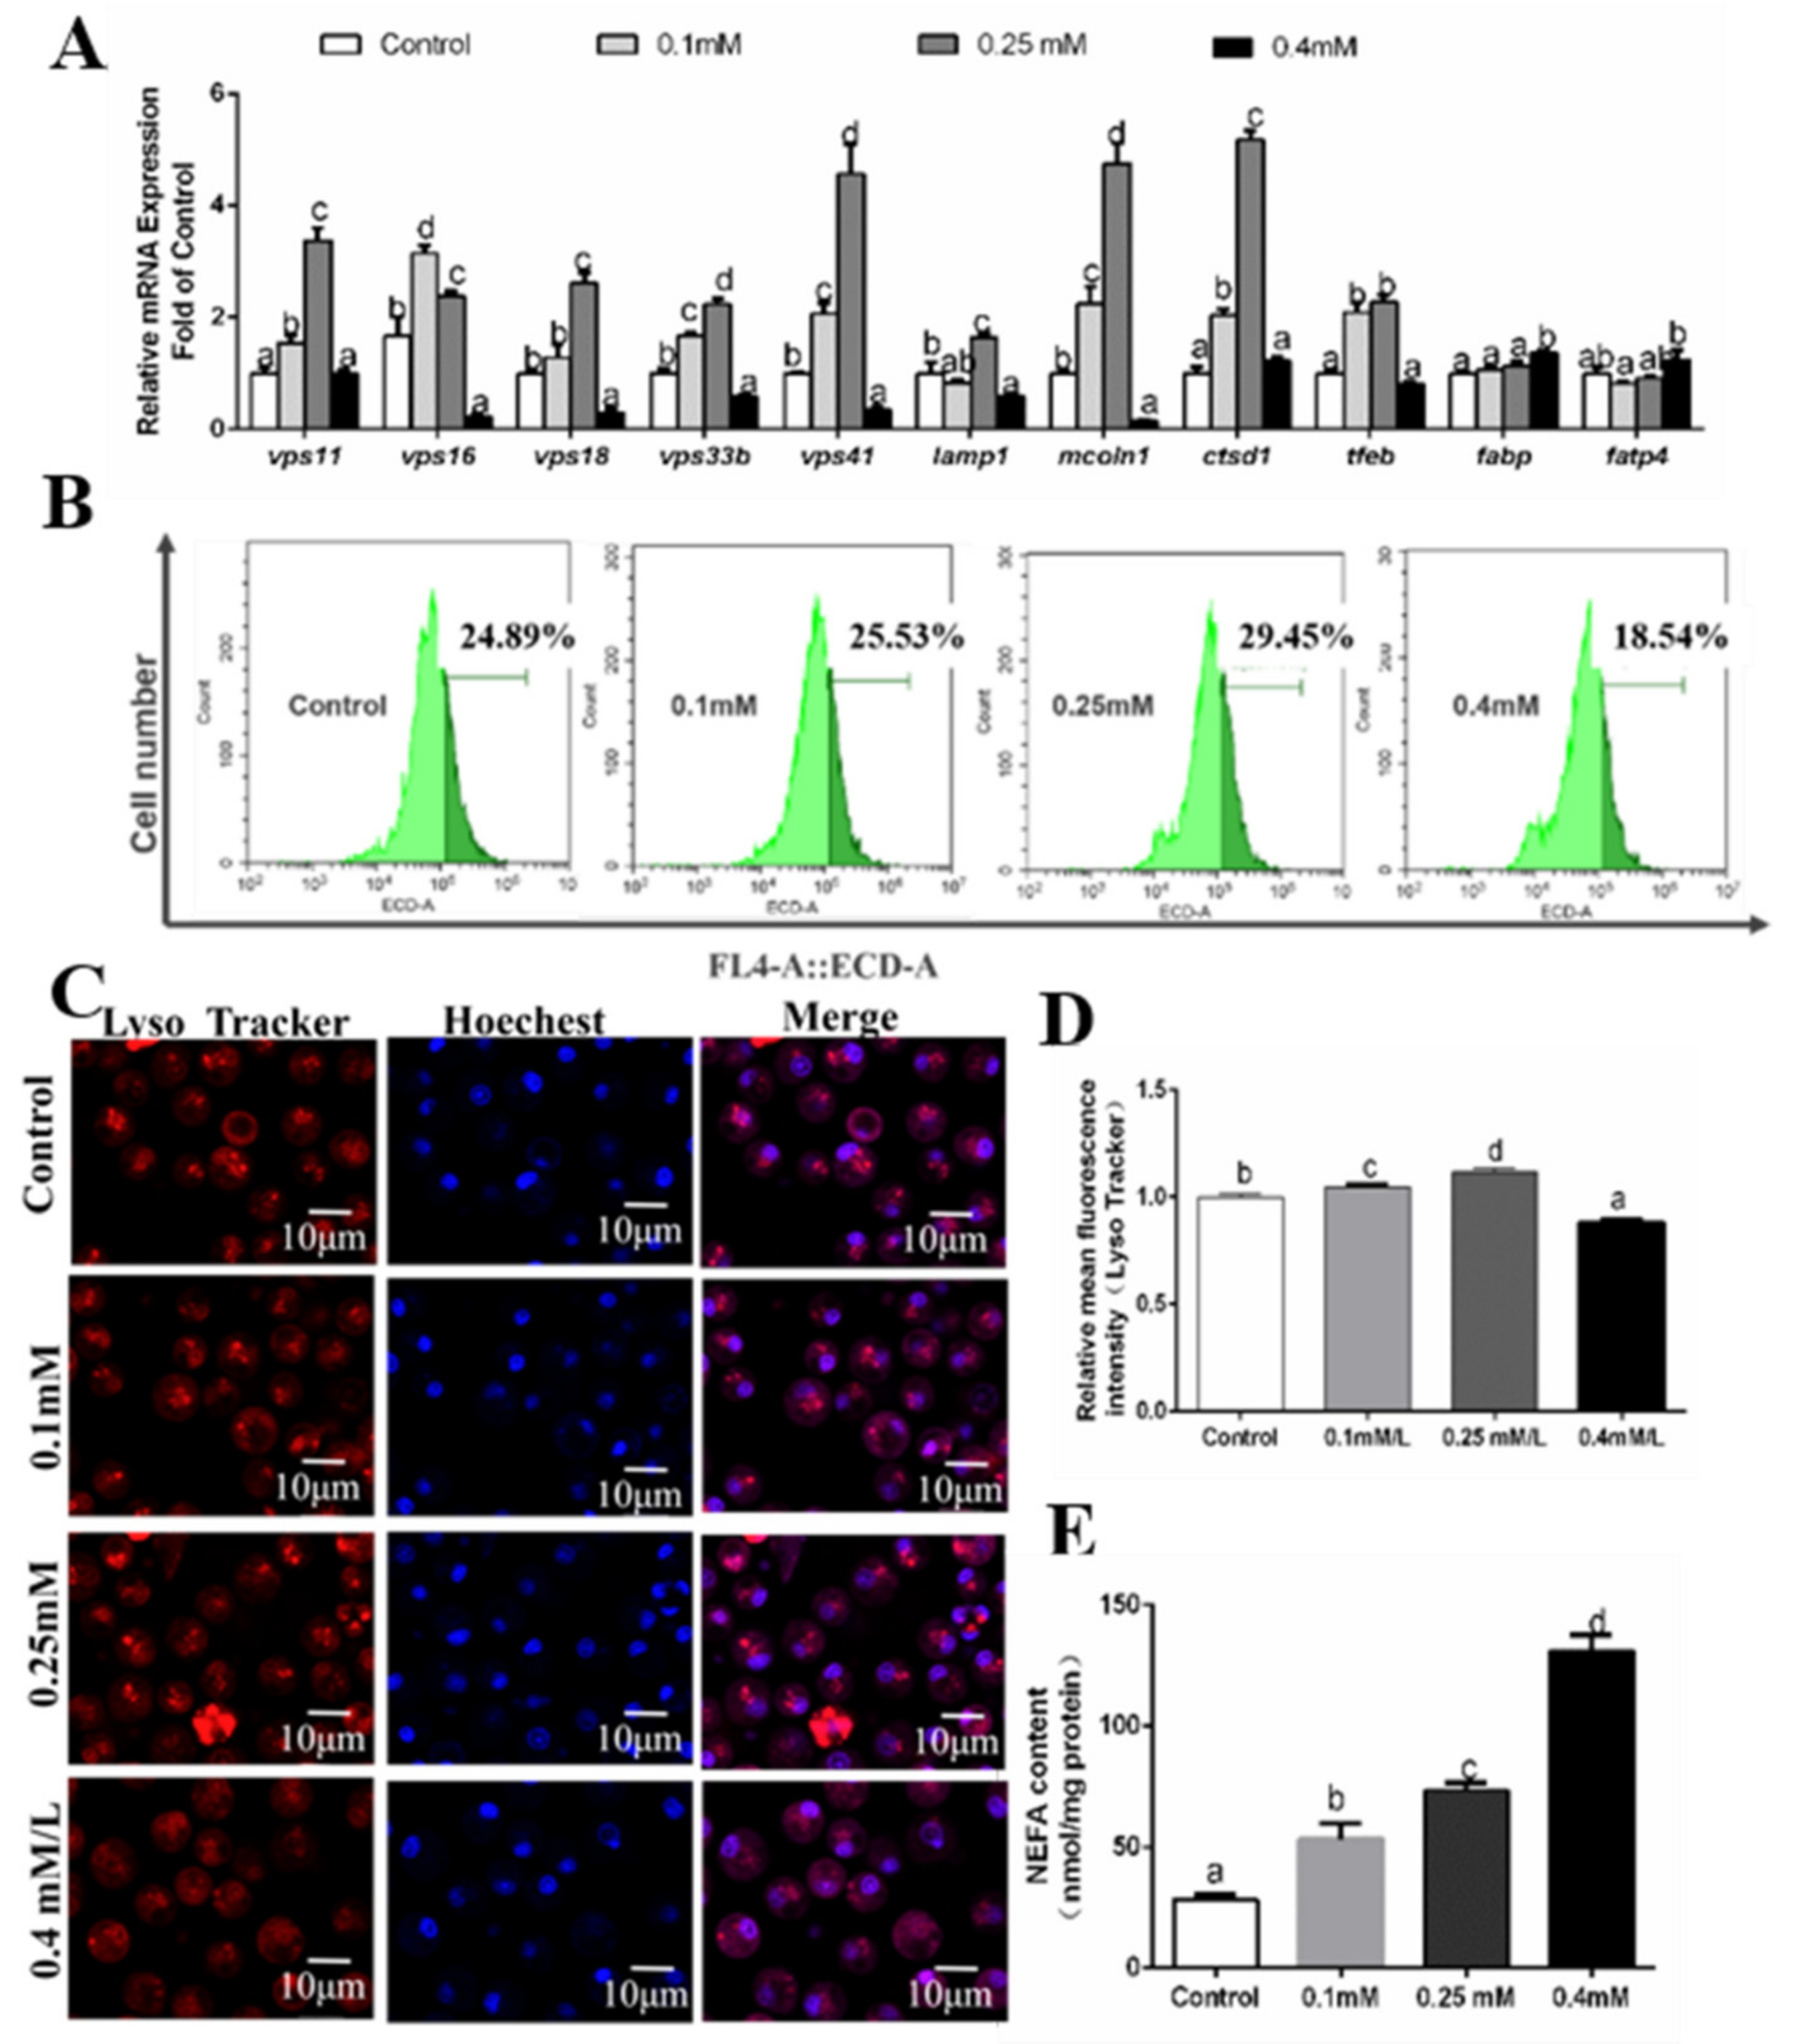
3.5. Effects of Oleic Acid (OA) Incubations on the Formation of Autolysosomes

At 12 h, compared to the control, OA incubation tended to increase the mRNA expression of vps16, vps18, vps33b, lamp1, mcoln1, ctsd1 and tfeb (Figure 6A). However, vps11 mRNA level was higher in the control and 0.1 mM OA group than those in 0.25 mM and 0.4 mM groups. vps41 mRNAs were predominant in the 0.25 mM OA group and lowest in the 0.4 mM group. Compared to the control, OA addition markedly reduced mRNA expression of fatp4 and fabp. Intracellular NEFA concentration increased with increasing OA concentration (Figure 6E). Moreover, we used flow cytometry and laser confocal microscopy to detect the OA-induced changes of autophagosomes, and results showed that OA incubation significantly inhibited the formation of autolysosomes (Figure 6B–D).
At 24 h, compared to the control, OA addition tended to decline mRNA levels of vps11, vps16, vps18, vps33b, lamp1, mcoln1 and tfeb (Figure 7A). vps41 and ctsd1 mRNA levels were higher in the control and 0.1 mM OA group than those in other two groups. OA addition increased fabp mRNA expression but reduced fatp4 mRNA level (Figure 7A). Intracellular NEFA content increased with increasing OA concentration (Figure 7E). Then, we used flow cytometry and laser confocal microscopy to detect the OA-induced changes of autophagosomes, and our results showed that OA incubation significantly inhibited the formation of autolysosomes (Figure 7B–D).
At 48 h, compared to the control, vps11, ctsd1 and tfeb mRNA levels were higher in the 0.1 mM and 0.25 mM, but there were no significant differences for 0.4 mM OA group. mRNA levels of vps16, vps18, vps33b, vps41 and mcoln1 were higher in the 0.1 mM and 0.25 mM OA groups than in the control and lowest in the 0.4 mM OA group. lamp1 mRNA expression was predominant in the control and 0.25 mM OA group. Compared to the control, OA addition up-regulated fabp and fatp4 mRNA levels (Figure 8A). Intracellular NEFA content increased with OA concentration (Figure 8E). Lyso Tracker staining and flow cytometry analysis indicated that autolysosomes formation was induced when OA concentration increased from the control to 0.25 mM and then was inhibited at the 0.4 mM OA group (Figure 8B,D). Laser confocal microscope observation also confirmed this result (Figure 8C).

4. Discussion

The autophagy–lysosomal pathway was considered to play essential roles in maintaining metabolic homeostasis and regulating lipid metabolism [29], but whether fat and FAs can regulate the activity of the autophagosome–lysosome pathway remains unknown. Here, we identified nine genes involved in the autophagosome–lysosome pathway from P. fulvidraco, and explored their tissue distribution profiles and transcriptional responses to a high-fat diet. Moreover, we also explored the influences of PA and OA on their mRNA abundances and the formation of autolysosomes, which would contribute to our understanding of these genes’ function, and provide new insights into the mechanism of fat and FAs influencing lipid metabolism in vertebrates.
The elucidation of the structures of autophagy-related genes is significant for understanding their functional mechanisms. The present study indicated that all nine autophagosomal–lysosome pathway-related genes and proteins possessed conservative domains among multiple species [39,40,41], indicating that they share essential roles in common. For example, P. fulvidraco vps11, vps18 and vps41 possessed the conservative RING-H2 finger domain, which participated in protein/protein interactions [42,43]. The coiled coil domain in P. fulvidraco VPS16 was conserved in a variety of SNARE (soluble N-ethylmaleimide sensitive factor attachment protein receptor) proteins that mediated membrane docking and fusion pathways [44]. The P. fulvidraco VPS33B was cytosolic and contained a Sec1 domain, similar to several reports [34,35]. In fact, the HOPS complex, essential for homotypic vacuole fusion and vacuole protein sorting, consisted of VPS11, VPS33, VPS18, VPS16, VPS41 and VPS39 [8]. Thus, it appeared that the HOPS complex was conserved in similar vesicle-trafficking pathways between P. fulvidraco and other organisms. N-glycosylation is important for the protein stability in the lysosomal membrane [45], which was also observed in P. fulvidraco LAMP1. P. fulvidraco CTSD1 was composed of propeptide, signal peptide and a N-glycosylation site, similar to other reports [20,46]. These N-glycosylation sites were important for the transportation of cathepsins into lysosomes [47]. TFEB of P. fulvidraco contained HLH domain and LZ domain, similar to other reports [48]. The HLH and LZ domains have been shown to facilitate protein dimerization between different members of the same HLH or LZ family [48,49]. P. fulvidraco MCOLN1 showed similar architecture with mammals, containing six transmembrane domains, C-terminal cytoplasmic tails and channel pore. These results provided evidence that the autophagic process can be reconstituted in fish, which opened the possibility to further explore the molecular mechanism in the docking and fusion of autophagosomes and lysosomes in P. fulvidraco.
Our study determined their tissue distribution profiles in yellow catfish, which would provide some basic insights into their functions. Our results indicated that nine autolysosomess-related genes were widely detected in all sampled tissues, but their abundances were distinctly different, similar to other reports [20,23,44,46,50]. However, species–specific tissue distribution was also observed in yellow catfish. For example, yellow catfish vps11 mRNA expression was predominant in the brain, muscle and spleen, then in the intestine, kidney, fat, heart, liver and lowest in the ovary. In contrast, Huizing et al. (2001) observed that vps11 possessed a high expression in heart and pancreas in humans [41]. The expression of yellow catfish ctsd1 mRNA was the highest in the kidney, then in the intestine, heart, spleen, fat, liver, brain and muscle, and lowest in the ovary. Liu et al. (2012) reported that the ctsd1 transcripts were highest in the muscle, then in the liver and spleen, and low in other tissues [46]. To our best knowledge, for the first time we determined mRNA tissue expression of vps33b, vps41 lamp1 mcoln1 and tfeb in fish. The observations in different tissue distribution in P. fulvidraco may represent the regulation of tissue specificity in physiology, indicating the different functions these issues play.
Our study clearly demonstrated that vps11, vps16, vps18, vps33b, vps41, lamp1, mcoln1, ctsd1 and tfeb were negatively regulated at a transcriptional level by high-fat diets, indicating that the high dietary fat inhibited the fusion of autophagosomes and lysosomes. At present, the effects of dietary lipid levels on the response of autophagosomes and lysosomes are controversial. For example, Ebato et al. (2008) reported that high fat intake upregulated β-cell autophagy [51]. Koga et al. (2010) reported that a high-fat diet reduced autophagosome/lysosome fusion and downregulated autophagy [52]. These conflicting results are attributable to differences in cell types, experimental duration and dietary lipid levels. Our results supported that maintained lipid stimuli results in a primary defect in autophagosome/lysosome fusion, which could reinforce the importance of changes in intracellular lipid content on autophagic vesicular fusion.
FA-induced lipotoxicity plays critical roles in inducing the occurrence of non-alcoholic liver disease. However, the types of fatty acids influenced autophagy. Mei et al. (2011) found that saturated and unsaturated FAs regulated autophagy in a different manner. They pointed out that only OA but not PA induced autophagy [32]. The present study indicated that PA and OA incubation increased the concentration of intracellular NEFA in hepatocytes of yellow catfish. Moreover, our study for the first time indicated that PA and OA differentially influenced mRNA levels of the nine autophagosome–lysosome pathway-related genes and these effects seemed to be concentration- and time-dependent. Furthermore, flow cytometry results and laser confocal microscopy showed that PA addition significantly inhibited the formation of autolysosomes at 12 h, 24 h and 48 h. In contrast, OA incubation significantly inhibited the formation of autolysosomes at 24 h. At 12 h, OA significantly induced formation of autolysosomes, and at 48 h, autolysosomes formation was induced when OA concentration increased from the control to 0.25 mM and then inhibited at 0.40 mM OA group. Tan et al. (2012) pointed out that PA but not OA activated the autophagy [53]. On the other hand, Koga et al. (2010) reported that both PA and OA treatment inhibited autophagy by preventing the fusion of the autophagosome and lysosome [52]. Again, these conflicting results were attributable to the differences in the cell types, and the concentration and duration of FA treatment [53]. Thus, elucidation of molecular mechanisms underlying the FA-induced autophagy awaits further investigation.
In summary, we identified the cDNA sequences of nine autolysosome-related genes from yellow catfish, detected their tissue expression and mRNA levels in yellow catfish fed a high-fat diet. Our results revealed the differential effects of saturated and unsaturated FAs on these genes’ expression. Further investigation should focus on the elucidation of molecular mechanisms during these processes.

Supplementary Materials

The following are available online at https://www.mdpi.com/2073-4425/10/10/751/s1: Table S1: Nucleotide sequences of the primers used for the cDNA cloning from P. fulvidraco; Table S2. Feed formulation and proximate analysis of experimental diets; Table S3: Primers used for real-time quantitative PCR analysis; Figure S1: Multiple amino acid sequence alignment of VPS11 from P. fulvidraco and other species; Figure S2: Multiple amino acid sequence alignment of VPS16 from P. fulvidraco and other species; Figure S3: Multiple amino acid sequence alignment of VPS18 from P. fulvidraco and other species; Figure S4: Multiple amino acid sequence alignment of VPS33B from P. fulvidraco and other species; Figure S5. Multiple amino acid sequence alignment of VPS41 from P. fulvidraco and other species; Figure S6. Multiple amino acid sequence alignment of LAMP1 from P. fulvidraco and other species; Figure S7. Multiple amino acid sequence alignment of MCOLN1 from P. fulvidraco and other species; Figure S8. Accession numbers as follows: P. fulvidraco (Pf), MH301098; Ictalurus punctatus (Ip), NP_001244039.1; Danio rerio (Dr), AAI64814.1; Rattus norvegicus (Rn), NP_599161.2; Homo sapiens (Hs), CAG33228.1; Figure S9. Multiple amino acid sequence alignment of transcription factor EB (TFEB) from P. fulvidraco and other species; Figure S10. Phylogenetic tree based on the protein sequences of VPS11 from P. fulvidraco and other vertebrate species using the neighbor-joining (NJ) method in MEGA 5.0 based on the JTT+G model. Branch support values represent a percentage of 1000 bootstrap replicates; Figure S11. Phylogenetic tree based on the protein sequences of VPS16 from P. fulvidraco and other vertebrate species using the neighbor-joining (NJ) method in MEGA 5.0 based on the JTT+G model. Branch support values represent a percentage of 1000 bootstrap replicates; Figure S12. Phylogenetic tree based on the protein sequences of VPS18 from P. fulvidraco and other vertebrate species using the neighbor-joining (NJ) method in MEGA 5.0 based on the JTT+G model. Branch support values represent a percentage of 1000 bootstrap replicates; Figure S13. Phylogenetic tree based on the protein sequences of VPS33B from P. fulvidraco and other vertebrate species using the neighbor-joining (NJ) method in MEGA 5.0 based on the JTT+G model. Branch support values represent a percentage of 1000 bootstrap replicates; Figure S14. Phylogenetic tree based on the protein sequences of VPS41 from P. fulvidraco and other vertebrate species using the neighbor-joining (NJ) method in MEGA 5.0 based on the JTT+G model. Branch support values represent a percentage of 1000 bootstrap replicates; Figure S15. Phylogenetic tree based on the protein sequences of LAMP1 from P. fulvidraco and other vertebrate species using the neighbor-joining (NJ) method in MEGA 5.0 based on the JTT+G model. Branch support values represent a percentage of 1000 bootstrap replicates; Figure S16. Phylogenetic tree based on the protein sequences of MCOLN1 from P. fulvidraco and other vertebrate species using the neighbor-joining (NJ) method in MEGA 5.0 based on the JTT+G model. Branch support values represent a percentage of 1000 bootstrap replicates; Figure S17. Phylogenetic tree based on the protein sequences of CTSD1 from P. fulvidraco and other vertebrate species using the neighbor-joining (NJ) method in MEGA 5.0 based on the JTT+G model. Branch support values represent a percentage of 1000 bootstrap replicates; Figure S18. Phylogenetic tree based on the protein sequences of TFEB from P. fulvidraco and other vertebrate species using the neighbor-joining (NJ) method in MEGA 5.0 based on the JTT+G model Branch support values represent a percentage of 1000 bootstrap replicates.

Author Contributions

Data curation, C.-C.W.; Funding acquisition, Z.L.; Investigation, L.-X.W.; Methodology, C.-C.W., S.-B.Y. and T.Z.; Project administration, Z.L.; Supervision, Z.L.; Writing – original draft, L.-X.W.; Writing – review and editing, C.-C.W., S.-B.Y., T.Z. and Z.L.

Acknowledgments

This work was funded by the National Natural Science Foundation of China (grant no.: 31422056), National Key R&D Program of China (grant nos.: 2018YFD0900400, 2018YFD0900600) and the project for Innovative Research Group of Molecular Nutrition for Aquatic Economic Animals from Hubei Provincial Department of Education (grant no.: T201933).

Conflicts of Interest

The authors declare no conflict of interest.

Abbreviations

b2m: beta-2-microglobulin; ctsd1, cathepsin D; elfa, translation elongation factor; fabp, fatty acid binding protein; fatp, fatty acid transport protein; gapdh, glyceraldehyde-3-phosphate dehydrogenase; hprt, hypoxanthine-guanine phosphoribosyltransferase; lamp1, lysosome-associated membrane glycoprotein1; mcoln1, mucolipin-1; OA: oleic acid; PA: palmitic acid; rpl7, ribosomal protein L7; SEM, standard error of mean; tuba, tubulin alpha chain; tfeb, transcription factor EB; ubce, ubiquitin-conjugating enzyme; vps, vacuolar protein sorting-associated protein.

References

  1. Klionsky, D.J.; Emr, S.D. Autophagy as a regulated pathway of cellular degradation. Science 2000, 290, 1717–1721. [Google Scholar] [CrossRef] [PubMed]
  2. Ren, S.Y.; Xu, X. Role of autophagy in metabolic syndrome-associated heart disease. Biochim. Biophys. Acta 2015, 1852, 225–231. [Google Scholar] [CrossRef]
  3. Kornfeld, S.; Mellman, I. The biogenesis of lysosomes. Annu. Rev. Cell. Dev. Biol. 2003, 5, 483–525. [Google Scholar] [CrossRef]
  4. Levine, B.; Klionsky, D.J. Development by self-digestion: Molecular mechanisms and biological functions of autophagy. Dev. Cell. 2004, 6, 463–477. [Google Scholar] [CrossRef]
  5. Nickerson, D.P.; Brett, C.L.; Merz, A.J. Vps-C complexes: Gatekeepers of endolysosomal traffic. Curr. Opin. Cell. Biol. 2009, 21, 543–551. [Google Scholar] [CrossRef] [PubMed]
  6. Pfeffer, S.R. Transport vesicle docking: SNAREs and associates. Annu. Rev. Cell. Dev. Biol. 1996, 12, 441–461. [Google Scholar] [CrossRef]
  7. Jahn, R.; Sudhof, T.C. Membrane fusion and exocytosis. Annu. Rev. Biochem. 1999, 68, 863–911. [Google Scholar] [CrossRef]
  8. Seals, D.F.; Eitzen, G.; Margolis, N.; Wickner, W.T.; Price, A. A Ypt/Rab effector complex containing the Sec1 homolog VPS33p is required for homotypic vacuole fusion. Proc. Natl. Acad. Sci. USA 2000, 97, 9402–9407. [Google Scholar] [CrossRef]
  9. Sato, T.K.; Rehling, P.; Peterson, M.R.; Emr, S.D. Class C VPS protein complex regulates vacuolar SNARE pairing and is required for vesicle docking/fusion. Mol. Cell 2000, 6, 661–671. [Google Scholar] [CrossRef]
  10. Rieder, S.E.; Emr, S.D. A novel RING finger protein complex essential for a late step in protein transport to the yeast vacuole. Mol. Biol. Cell 1997, 8, 2307–2327. [Google Scholar] [CrossRef]
  11. Settembre, C. TFEB Links Autophagy to Lysosomal Biogenesis. Science 2011, 332, 1429–1433. [Google Scholar] [CrossRef] [PubMed] [Green Version]
  12. Liaudet-Coopman, E.; Beaujouin, M.; Derocq, D.; Garcia, M.; Glondu-Lassis, M.; Laurent-Matha, V. Newly discovered functions of a long-standing aspartic protease in cancer and apoptosis. Cancer. Lett. 2006, 237, 167–179. [Google Scholar] [CrossRef] [PubMed]
  13. Tang, J.; Wong, R.N.S. Evolution in the structure and function of aspartic proteases. J. Cell. Biochem. 1987, 33, 53–63. [Google Scholar] [CrossRef] [PubMed]
  14. Eskelinen, E.L. Roles of LAMP-1 and LAMP-2 in lysosome biogenesis and autophagy. Mol. Aspects. Med. 2006, 27, 495–502. [Google Scholar] [CrossRef] [PubMed]
  15. Medina, D.L.; Di Paola, S.; Peluso, I.; Armani, A.; De Stefani, D.; Venditti, R. Lysosomal calcium signaling regulates autophagy through calcineurin and TFEB. Nat. Cell. Biol. 2015, 17, 288–299. [Google Scholar] [CrossRef] [PubMed]
  16. Sevrioukov, E.A.; He, J.P.; Moghrabi, N.; Sunio, A.; Kramer, H. A role for the deep orange and carnation eye color genes in lysosomal delivery in Drosophila. Mol. Cell 1999, 4, 479–486. [Google Scholar] [CrossRef]
  17. Maldonado, E.; Hernandez, F.; Lozano, C.; Castro, M.E.; Navarro, R.E. The zebrafish mutant vps18 as a model for vesicle-traffic related hypopigmentation diseases. Pigm. Cell. Melanoma 2010, 19, 315–326. [Google Scholar] [CrossRef]
  18. Thomas, J.L.; Vihtelic, T.S.; Dendekker, A.D.; Willer, G.; Luo, X.; Murphy, T.R.; Ronald, G.G.; David, R.H.; Thummel, R. The loss of vacuolar protein sorting 11 (vps11) causes retinal pathogenesis in a vertebrate model of syndromic albinism. Invest. Ophth. Vis. Sci. 2011, 52, 3119. [Google Scholar] [CrossRef]
  19. Lister, J.A.; Lane, B.M.; Nguyen, A.; Lunney, K. Embryonic expression of zebrafish MiT family genes tfe3b, tfeb, and tfec. Dev. Dyn. 2011, 240, 2529–2538. [Google Scholar] [CrossRef] [Green Version]
  20. Feng, T.; Zhang, H.; Liu, H.; Zhou, Z.C.; Niu, D.H.; Wong, L.L.; Kucuktas, H.; Liu, X.L.; Peatman, E.; Liu, Z.J. Molecular characterization and expression analysis of the channel catfish cathepsin D genes. Fish. Shellfish. Immun. 2011, 31, 164–169. [Google Scholar] [CrossRef]
  21. Jiang, S.T.; Wang, Y.T.; Chen, C.S. Purification and characterization of a proteinase identified as cathepsin D from tilapia muscle (Tilapia nilotica × Tilapia aurea). J. Agric. Food Chem. 1991, 39, 1597–1601. [Google Scholar] [CrossRef]
  22. Carnevali, O. Molecular Cloning and Expression of Ovarian Cathepsin D in Seabream, Sparus aurata. Biol. Reprod. 1999, 61, 785–791. [Google Scholar] [CrossRef] [PubMed]
  23. Nielsen, L.B.; Nielsen, H.H. Purification and characterization of cathepsin D from herring muscle (Clupea harengus). Comp. Biochem. Physiol. 2001, 128, 351–363. [Google Scholar] [CrossRef]
  24. Cho, J.H.; Park, I.Y.; Kim, H.S.; Lee, W.T.; Kim, M.S.; Kim, S.C. Cathepsin D produces antimicrobial peptide parasin I from histone H2A in the skin mucosa of fish. FASEB J. 2002, 16, 429–431. [Google Scholar] [CrossRef] [Green Version]
  25. Malhi, H.; Gores, G.J. Molecular mechanisms of lipotoxicity in nonalcoholic fatty liver disease. Semin. Liver. Dis. 2008, 28, 360–369. [Google Scholar] [CrossRef]
  26. Brookheart, R.T.; Michel, C.I.; Schaffer, J.E. As a matter of fat. Cell. Metab. 2009, 10, 9–12. [Google Scholar] [CrossRef]
  27. Wei, C.C.; Luo, Z.; Hogstrand, C.; Xu, Y.H.; Wu, L.X.; Chen, G.H.; Pan, Y.X.; Song, Y.F. Zinc reduces hepatic lipid deposition and activates lipophagy via Zn2+/MTF-1/PPARα and Ca2+/CaMKKß/AMPK pathways. FASEB J. 2018, 32, 6666–6680. [Google Scholar] [CrossRef]
  28. Chen, C.Y.; Liu, C.H.; Tsai, Y.C.; Hsu, H.C.; Chen, M.F. ER stress, but not autophagy, was activated for cadioprotection during short-term receiving the high/fat sucrose diet. Eur. Heart. J. 2013, 34, 693. [Google Scholar]
  29. Singh, R.; Kaushik, S.; Wang, Y.; Xiang, Y.; Novak, I.; Komatsu, M.; Tanaka, K.; Cuervo, A.M.; Czaja, M.J. Autophagy regulates lipid metabolism. Nature 2009, 458, 1131–1135. [Google Scholar] [CrossRef] [Green Version]
  30. Baylin, A.; Kabagambe, E.K.; Siles, X.; Campos, H. Adipose tissue biomarkers of fatty acid intake. Am. J. Clin. Nutr. 2002, 76, 750–757. [Google Scholar] [CrossRef] [Green Version]
  31. Listenberger, L.L.; Han, X.; Lewis, S.E.; Cases, S.; Farese, R.V., Jr.; Ory, D.S.; Schaffer, J.E. Triglyceride accumulation protects against fatty acid-induced lipotoxicity. Proc. Natl. Acad. Sci. USA 2003, 100, 3077–3082. [Google Scholar] [CrossRef] [PubMed] [Green Version]
  32. Mei, S.; Ni, H.M.; Manley, S.; Bockus, A.; Kassel, K.M.; Luyendyk, J.P.; Copple, B.L.; Ding, W.X. Differential roles of unsaturated and saturated fatty acids on autophagy and apoptosis in hepatocytes. J. Pharmacol. Exp. Ther. 2011, 339, 487–498. [Google Scholar] [CrossRef] [PubMed]
  33. Jones, D.T.; Taylor, W.R.; Thornton, J.M. The rapid generation of mutation data matrices from proteins equences. Comput. Appl. Biosci. 1992, 8, 275–282. [Google Scholar] [PubMed]
  34. Ling, S.C.; Wu, K.; Zhang, D.G.; Luo, Z. Endoplasmic reticulum stress mediated autophagy and apoptosis alleviate dietary fat-induced triglyceride accumulation in the intestinal and isolated intestinal epithelial cells of yellow catfish. J. Nutr. 2019. [Google Scholar] [CrossRef] [PubMed]
  35. Wu, K.; Huang, C.; Shi, X.; Chen, F.; Xu, Y.H.; Pan, Y.X.; Luo, Z.; Liu, X. Role and mechanism of the AMPK pathway in waterborne Zn exposure influencing the hepatic energy metabolism of Synechogobius hasta. Sci. Rep. 2016, 6, 38716. [Google Scholar] [CrossRef] [PubMed]
  36. Wei, C.C.; Luo, Z.; Song, Y.F.; Pan, Y.X.; Wu, K.; You, W.J. Identification of autophagy related genes LC3 and ATG4 from Pelteobagrus fulvidraco and their transcriptional responses to waterborne and dietborne zinc exposure. Chemosphere 2017, 175, 228–238. [Google Scholar] [CrossRef]
  37. Las, G.; Serada, S.B.; Wikstrom, J.D.; Twig, G.; Shirihai, O.S. Fatty acids suppress autophagic turnover in β-cells. J. Biol. Chem. 2011, 286, 42534–42544. [Google Scholar] [CrossRef]
  38. Yamamoto, T.; Takabatake, Y.; Takahashi, A.; Kimura, T.; Namba, T.; Matsuda, J. High-fat diet-induced lysosomal dysfunction and impaired autophagic flux contribute to lipotoxicity in the kidney. Jasn 2017, 28, 1534. [Google Scholar] [CrossRef]
  39. Radisky, D.C.; Snyder, W.B.; Emr, S.D.; Kaplan, J. Characterization of VPS41, a gene required for vacuolar trafficking and high-affinity iron transport in yeast. Proc. Natl. Acad. Sci. USA 1997, 94, 5662–5668. [Google Scholar] [CrossRef]
  40. Gerhardt, B.; Kordas, T.J.; Thompson, C.M.; Patel, P.; Vida, T. The vesicle transport protein vps33p is an atp-binding protein that localizes to the cytosol in an energy-dependent manner. J. Biol. Chem. 1998, 273, 15818–15829. [Google Scholar] [CrossRef]
  41. Huizing, M.; Didier, A.; Walenta, J.; Anikster, Y.; Gahl, W.A.; Krämer, H. Molecular cloning and characterization of human VPS18, VPS 11, VPS16, and VPS33. Gene 2001, 264, 241–247. [Google Scholar] [CrossRef]
  42. Borden, K.L.; Freemont, P.S. The RING finger domain: A recent example of a sequence-structure family. Current Opinion in Structural. Biology 1996, 6, 395–401. [Google Scholar]
  43. Lorick, K.L.; Jensen, J.P.; Fang, S.; Ong, A.M.; Hatakeyama, S.; Weissman, A.M. RING fingers mediate ubiquitin-conjugating enzyme (E2)-dependent ubiquitination. Proc. Natl. Acad. Sci. USA 1999, 96, 11364–11369. [Google Scholar] [CrossRef] [PubMed] [Green Version]
  44. Kim, B.Y.; Ueda, M.; Kominami, E.; Akagawa, K.; Kohsaka, S.; Akazawa, C. Identification of mouse vps16 and biochemical characterization of mammalian class c vps complex. Biochem. Biophys. Res. Commun. 2003, 311, 577–582. [Google Scholar] [CrossRef]
  45. Barriocanal, J.G.; Bonifacino, J.S.; Yuan, L.; Sandoval, I.V. Biosynthesis, glycosylation, movement through the Golgi system, and transport to lysosomes by an N-linked carbohydrate-independent mechanism of three lysosomal integral membrane proteins. J. Biol. Chem. 1986, 261, 16755–16763. [Google Scholar] [PubMed]
  46. Liu, X.; Shi, G.; Cui, D.; Wang, R.; Xu, T. Molecular cloning and comprehensive characterization of cathepsin D in the Miiuy croaker Miichthys miiuy. Fish. Shellfish. Immun. 2012, 32, 464–468. [Google Scholar] [CrossRef]
  47. Shi, G.P.; Munger, J.S.; Meara, J.P.; Rich, D.H.; Chapman, H.A. Molecular cloning and expression of human alveolar macrophage cathepsin S, an elastinolytic cysteine protease. J. Biol. Chem. 1992, 267, 7258e62. [Google Scholar]
  48. Fisher, D.E.; Carr, C.S.; Parent, L.A.; Sharp, P.A. TFEB has DNA-binding and oligomerization properties of a unique helix-loop-helix/leucine-zipper family. Genes. Dev. 1991, 5, 2342–2352. [Google Scholar] [CrossRef]
  49. O’Shea, E.K.; Rutkowski, R.; Kim, P.S. Evidence that the leucine zipper is a coiled coil. Science 1989, 243, 538–542. [Google Scholar] [CrossRef] [PubMed]
  50. Baricos, W.H.; Zhou, Y.W.; Fuerst, R.S.; Barrett, A.J.; Shah, S.V. The role of aspartic and cysteine proteinases in albumin degradation by rat kidney cortical lysosomes. Arch. Biochem. Biophys. 1987, 256, 687–691. [Google Scholar] [CrossRef]
  51. Ebato, C.; Uchida, T.; Arakawa, M.; Komatsu, M.; Ueno, T.; Komiya, K.; Azuma, K.; Hirose, T.; Tanaka, K.; Kominami, E.; et al. Autophagy is important in islet homeostasis and compensatory increase of beta cell mass in response to high-fat diet. Cell. Metab. 2008, 8, 325–332. [Google Scholar] [CrossRef] [PubMed]
  52. Koga, H.; Kaushik, S.; Cuervo, A.M. Altered lipid content inhibits autophagic vesicular fusion. FASEB J. 2010, 24, 3052–3065. [Google Scholar] [CrossRef] [PubMed] [Green Version]
  53. Tan, S.H.; Shui, G.; Zhou, J.; Li, J.J.E.; Bay, B.H.; Wenk, M.R.; Shen, H.M. Induction of autophagy by palmitic acid via protein kinase C-mediated signaling pathway independent of mTOR (mammalian target of rapamycin). J. Biol. Chem. 2012, 287, 14364–14376. [Google Scholar] [CrossRef] [PubMed]
Figure 1. Real-time quantitative polymerase chain reaction (qPCR) analysis for tissue distribution of gene expression across the heart (H), liver (L), muscle (M), spleen (S), brain (B), mesenteric fat (F), intestine (I), kidney (K) and ovary (O) of P. fulvidraco. Bars that share different letters indicate significant differences among the tissues (p < 0.05).
Genes 10 00751 g001
Figure 2. Effect of dietary fat levels on hepatic mRNA level of autolysosomes-related genes in P. fulvidraco. a,b,c Values are mean ± standard error of the mean (SEM), n = 3 (replicates of 3 fish); Asterisks indicate significant differences between two groups within the same gene (p < 0.05). CD = Control diet: HFD = High-fat diet.
Genes 10 00751 g002
Figure 3. Effects of 12 h PA incubation on autophagosomes in hepatocytes of P. fulvidraco. (A) Effects of 12 h palmitic acid (PA) incubation on the mRNA levels of autolysosomes-related genes; data (mean ± SEM, n = 3) were expressed relative to expression of housekeeping genes (b2m and rpl7 (M = 0.2456)). (B) The effect of 12h PA incubation on intracelluar autolysosomes demonstrated by flow cytometry analysis of the presence of Lyso Tracker-stained intracellular autolysosomes. (C) Representative confocal microscopy image of hepatocytes co-stained with Hoechest (blue) and Lyso Tracker (red) after 12 h PA incubation. (D) The effect of 12h PA incubation on intracelluar autolysosomes demonstrated by flow cytometric analysis of red (FL4) mean fluorescence intensity. (E) Effects of 12h PA incubation on non-esterified fatty acid (NEFA) content. Letters (a–d) denote significance, p < 0.05.
Genes 10 00751 g003
Figure 4. Effects of 24 h PA incubation on autophagosomes in hepatocytes of P. fulvidraco. (A) Effects of 24 h PA incubation on the mRNA levels of autolysosomes related genes; data (mean ± SEM, n = 3) were expressed relative to expression of housekeeping genes (gapdh and 18s rRNA (M = 0.1887)). (B) The effect of 24 h PA incubation on intracelluar autolysosomes demonstrated by flow cytometry analysis of the presence of Lyso Tracker-stained intracellular autolysosomes. (C) Representative confocal microscopy image of hepatocytes co-stained with Hoechest (blue) and Lyso Tracker (red) after 2 4h PA incubation. (D) The effect of 24 h PA incubation on intracelluar autolysosomes demonstrated by flow cytometric analysis of red (FL4) mean fluorescence intensity. (E) Effects of 24 h PA incubation on NEFA content. Letters (a–d) denote significance, p < 0.05.
Genes 10 00751 g004
Figure 5. Effects of 48 h PA incubation on autophagosomes in hepatocytes of P. fulvidraco. (A) The effect of 48 h PA incubation on the mRNA levels of autolysosome-related genes; data (mean ± SEM, n = 3) were expressed relative to expression of housekeeping genes (b2m and gapdh (M = 0.1550)). (B) The effect of 48 h PA incubation on intracelluar autolysosomes demonstrated by flow cytometry analysis of the presence of Lyso Tracker-stained intracellular autolysosomes. (C) Representative confocal microscopy image of hepatocytes co-stained with Hoechest (blue) and Lyso Tracker (red) after 48 h PA incubation. (D) The effect of 48 h PA incubation on intracelluar autolysosomes demonstrated by flow cytometric analysis of red (FL4) mean fluorescence intensity. (E) Effects of 48 h PA incubation on NEFA content. Letters (a–d) denote significance, p < 0.05.
Genes 10 00751 g005
Figure 6. Effects of 12 h oleic acid (OA) incubation on autophagosomes in hepatocytes of P. fulvidraco. (A) Effects of 12 h OA incubation on the mRNA levels of autolysosome-related genes; data (mean ± SEM, n = 3) were expressed relative to expression of housekeeping genes (b2m and rpl7 (M = 0.2456)). (B) The effect of 12 h OA incubation on intracelluar autolysosomes demonstrated by flow cytometry analysis of the presence of Lyso Tracker-stained intracellular autolysosomes. (C) Representative confocal microscopy image of hepatocytes co-stained with Hoechest (blue) and Lyso Tracker (red) after 12 h OA incubation. (D) The effect of 12 h OA incubation on intracelluar autolysosomes demonstrated by flow cytometric analysis of red (FL4) mean fluorescence intensity. (E) Effects of 12 h OA incubation on NEFA content. Letters (a–d) denote significance, p < 0.05.
Genes 10 00751 g006
Figure 7. Effects of 24 h OA incubation on autophagosomes in hepatocytes of P. fulvidraco. (A) Effects of 24 h OA incubation on the mRNA levels of autolysosomes related genes; data (mean ± SEM, n = 3) were expressed relative to expression of housekeeping genes (gapdh and 18s rRNA (M = 0.1887)). (B) The effect of 24 h OA incubation on intracelluar autolysosomes demonstrated by flow cytometry analysis of the presence of Lyso Tracker-stained intracellular autolysosomes. (C) Representative confocal microscopy image of hepatocytes co-stained with Hoechest (blue) and Lyso Tracker (red) after 24 h OA incubation. (D) The effect of 24 h OA incubation on intracelluar autolysosomes demonstrated by flow cytometric analysis of red (FL4) mean fluorescence intensity. (E) Effects of 24 h OA incubation on NEFA content. Letters (a–d) denote significance, p < 0.05.
Genes 10 00751 g007
Figure 8. Effects of 48 h OA incubation on autophagosomes in hepatocytes of P. fulvidraco. (A) The effect of 48 h OA incubation on the mRNA levels of autolysosome-related genes; data (mean ± SEM, n = 3) were expressed relative to expression of housekeeping genes (b2m and gapdh (M = 0.1550)). (B) The effect of 48 h OA incubation on intracelluar autolysosomes demonstrated by flow cytometry analysis of the presence of Lyso Tracker-stained intracellular autolysosomes. (C) Representative confocal microscopy image of hepatocytes co-stained with Hoechest (blue) and Lyso Tracker (red) after 48 h OA incubation. (D) The effect of 48 h OA incubation on intracelluar autolysosomes demonstrated by flow cytometric analysis of red (FL4) mean fluorescence intensity. (E) Effects of 48 h OA incubation on NEFA content. Letters (a–d) denote significance, P < 0.05.
Genes 10 00751 g008
Table 1. The sequence information of autolysosome-related genes from P. fulvidraco.
GeneAccession No.5′ Untranslated Regions (UTR)(bp)ORF (bp)3′ UTR (bp)Full Length (bp)Protein (aa)
vps11MH3010912227842743080928
vps16MH3010924825085893144835
vps18MH3010933052979983379992
vps33bMH301094691853 2302230617
vps41MH3010956725644272991854
lamp1MH3010968412451671496415
mcoln1MH3010972171745196 2158581
ctsd1MH3010988611905691845396
tfebMH45900418114753672023491
Table 2. Amino acid sequence identity of autolysosome-related genes between P. fulvidraco and other species (%).
GenesIctalurus punctatusDanio rerioXenopus tropicalisRattus norvegicusHomo sapiens
vps1195.189.384.184.684.4
vps1694.7385.8762.8065.6767.71
vps1892.0485.9970.6763.6164.61
vps33b93.1988.0175.1274.6463.65
vps4196.0291.8077.5280.0980.56
lamp176.6886.827.6142.6142.24
mcoln187.4479.965.8260.9160.90
ctsd192.9385.9363.2663.8367.08
tfeb86.6069.8244.2048.6546.55
Notes: Accession numbers for each gene are given with the species in the following order for each gene: The order is Ictalurus punctatus, Danio rerio, Xenopus tropicalis, Rattus norvegicus and Homo sapiens: vps11 (AAI66363.1, NP_001032797.1, XP_017344206, 1AAI68871.1, AAH12051.2); vps16 (XP_017336907.1, NP_001091659.1, AAH75508.1, NP_001005541.1, AAH73959.1); vps18 (AHH37325.1, AAI54757.1, NP_001121454, 1AAI69083.1, AAH01513.1); vps33b (XP_017314277.1, NP_001014370.1, NP_001096504.2, NP_071622.1, CAB93109.1); vps41 (AHH39036.1, XP_691671.2, XP_012814859.1, NP_001100825, NP_055211.2); lamp1 (XP_017312814.1, NP_001313461.1, NP_001106388.1, NP_001101811.1, NP_003556.1); mcoln1 (XP_017329106.1, NP_001299842.1, AAH80326.1, AAH61575.1, NP_003891.1); ctsd1 (NP_001244039.1, AAI64814.1, AAH75272.1, NP_599161.2, CAG33228.1); tfeb (XP_017306305.1, NP_001244121.1, AAI23931.1, NP_001020878.1, NP_001161299.2).

