The Alkaline Phosphatase (ALPL) Locus Is Associated with B6 Vitamer Levels in CSF and Plasma

 , , ,
, , , 
_Verhoeven-Duif.png)

Abstract
1. Introduction
2. Subjects and Methods
2.1. Subjects and Sample Collection
2.2. Determination of B6 Vitamer Concentrations
2.3. Phenotyping
2.4. Genotyping, Imputation and Quality Control Procedures
2.5. Multivariate Analysis
2.6. Univariate Analysis
2.7. Gene-Based Association Using PrediXcan
3. Results
4. Discussion
Supplementary Materials
Author Contributions
Funding
Acknowledgments
Conflicts of Interest
References
- Jansonius, J.N. Structure, evolution and action of vitamin B6-dependent enzymes. Curr. Opin. Struct. Biol. 1998, 8, 759–769. [Google Scholar] [CrossRef]
- Catazaro, J.; Caprez, A.; Guru, A.; Swanson, D.; Powers, R. Functional evolution of PLP-dependent enzymes based on active-site structural similarities. Proteins 2014, 82, 2597–2608. [Google Scholar] [CrossRef] [PubMed]
- Mooney, S.; Leuendorf, J.E.; Hendrickson, C.; Hellmann, H. Vitamin B6: A long known compound of surprising complexity. Molecules 2009, 14, 329–351. [Google Scholar] [CrossRef] [PubMed]
- Lotto, V.; Choi, S.W.; Friso, S. Vitamin B6: A challenging link between nutrition and inflammation in CVD. Br. J. Nutr. 2011, 106, 183–195. [Google Scholar] [CrossRef] [PubMed]
- Paul, L.; Ueland, P.M.; Selhub, J. Mechanistic perspective on the relationship between pyridoxal 5′-phosphate and inflammation. Nutr. Rev. 2013, 71, 239–244. [Google Scholar] [CrossRef] [PubMed]
- Galluzzi, L.; Vacchelli, E.; Michels, J.; Garcia, P.; Kepp, O.; Senovilla, L.; Vitale, I.; Kroemer, G. Effects of vitamin B6 metabolism on oncogenesis, tumor progression and therapeutic responses. Oncogene 2013, 32, 4995–5004. [Google Scholar] [CrossRef] [PubMed]
- Zuo, H.; Ueland, P.M.; Eussen, S.J.; Tell, G.S.; Vollset, S.E.; Nygard, O.; Midttun, O.; Meyer, K.; Ulvik, A. Markers of vitamin B6 status and metabolism as predictors of incident cancer: The Hordaland Health Study. Int. J. Cancer 2015, 136, 2932–2939. [Google Scholar] [CrossRef] [PubMed]
- Hvas, A.M.; Juul, S.; Bech, P.; Nexo, E. Vitamin B6 level is associated with symptoms of depression. Psychother. Psychosom. 2004, 73, 340–343. [Google Scholar] [CrossRef] [PubMed]
- Moorthy, D.; Peter, I.; Scott, T.M.; Parnell, L.D.; Lai, C.Q.; Crott, J.W.; Ordovas, J.M.; Selhub, J.; Griffith, J.; Rosenberg, I.H.; et al. Status of vitamins B-12 and B-6 but not of folate, homocysteine, and the methylenetetrahydrofolate reductase C677T polymorphism are associated with impaired cognition and depression in adults. J. Nutr. 2012, 142, 1554–1560. [Google Scholar] [CrossRef] [PubMed]
- Mulder, C.; van der Flier, W.M.; Veerhuis, R.; Bouwman, F.; Jakobs, C.; Verhoeven, N.M.; Barkhof, F.; Scheltens, P.; Blankenstein, M.A. Association between vitamin B6 and white matter hyperintensities in patients with Alzheimer’s disease not mediated by homocysteine metabolism. J. Am. Geriatr. Soc. 2007, 55, 956–958. [Google Scholar] [CrossRef] [PubMed]
- Mulder, C.; Scheltens, P.; Barkhof, F.; Gundy, C.; Verstraeten, R.A.; de Leeuw, F.E. Low vitamin B6 levels are associated with white matter lesions in Alzheimer’s disease. J. Am. Geriatr. Soc. 2005, 53, 1073–1074. [Google Scholar] [CrossRef] [PubMed]
- Stockler, S.; Plecko, B.; Gospe, S.M., Jr.; Coulter-Mackie, M.; Connolly, M.; van Karnebeek, C.; Mercimek-Mahmutoglu, S.; Hartmann, H.; Scharer, G.; Struijs, E.; et al. Pyridoxine dependent epilepsy and antiquitin deficiency: Clinical and molecular characteristics and recommendations for diagnosis, treatment and follow-up. Mol. Genet. Metab. 2011, 104, 48–60. [Google Scholar] [CrossRef] [PubMed]
- Mills, P.B.; Struys, E.; Jakobs, C.; Plecko, B.; Baxter, P.; Baumgartner, M.; Willemsen, M.A.; Omran, H.; Tacke, U.; Uhlenberg, B.; et al. Mutations in antiquitin in individuals with pyridoxine-dependent seizures. Nat. Med. 2006, 12, 307–309. [Google Scholar] [CrossRef] [PubMed]
- Mills, P.B.; Surtees, R.A.; Champion, M.P.; Beesley, C.E.; Dalton, N.; Scambler, P.J.; Heales, S.J.; Briddon, A.; Scheimberg, I.; Hoffmann, G.F.; et al. Neonatal epileptic encephalopathy caused by mutations in the PNPO gene encoding pyridox(am)ine 5’-phosphate oxidase. Hum. Mol. Genet. 2005, 14, 1077–1086. [Google Scholar] [CrossRef] [PubMed]
- Walker, V.; Mills, G.A.; Peters, S.A.; Merton, W.L. Fits, pyridoxine, and hyperprolinaemia type II. Arch. Dis. Child. 2000, 82, 236–237. [Google Scholar] [CrossRef] [PubMed]
- Rathbun, J.C. Hypophosphatasia: A new developmental anomaly. Am. J. Dis. Child. 1948, 75, 822–831. [Google Scholar] [CrossRef]
- Rathbun, J.C.; Macdonald, J.W.; Robinson, H.M.; Wanklin, J.M. Hypophosphatasia: A genetic study. Arch. Dis. Child. 1961, 36, 540–542. [Google Scholar] [CrossRef]
- Bok, L.A.; Halbertsma, F.J.; Houterman, S.; Wevers, R.A.; Vreeswijk, C.; Jakobs, C.; Struys, E.; Van Der Hoeven, J.H.; Sival, D.A.; Willemsen, M.A. Long-term outcome in pyridoxine-dependent epilepsy. Dev. Med. Child. Neurol. 2012, 54, 849–854. [Google Scholar] [CrossRef]
- Lumeng, L.; Li, T.K. Characterization of the pyridoxal 5′-phosphate and pyridoxamine 5′-phosphate hydrolase activity in rat liver. Identity with alkaline phosphatase. J. Biol. Chem. 1975, 250, 8126–8131. [Google Scholar]
- Keene, K.L.; Chen, W.M.; Chen, F.; Williams, S.R.; Elkhatib, S.D.; Hsu, F.C.; Mychaleckyj, J.C.; Doheny, K.F.; Pugh, E.W.; Ling, H.; et al. Genetic Associations with Plasma B12, B6, and Folate Levels in an Ischemic Stroke Population from the Vitamin Intervention for Stroke Prevention (VISP) Trial. Front. Public Health 2014, 2, 112. [Google Scholar] [CrossRef]
- Carter, T.C.; Pangilinan, F.; Molloy, A.M.; Fan, R.; Wang, Y.; Shane, B.; Gibney, E.R.; Midttun, O.; Ueland, P.M.; Cropp, C.D.; et al. Common Variants at Putative Regulatory Sites of the Tissue Nonspecific Alkaline Phosphatase Gene Influence Circulating Pyridoxal 5’-Phosphate Concentration in Healthy Adults. J. Nutr. 2015, 145, 1386–1393. [Google Scholar] [CrossRef] [PubMed]
- Hazra, A.; Kraft, P.; Lazarus, R.; Chen, C.; Chanock, S.J.; Jacques, P.; Selhub, J.; Hunter, D.J. Genome-wide significant predictors of metabolites in the one-carbon metabolism pathway. Hum. Mol. Genet. 2009, 18, 4677–4687. [Google Scholar] [CrossRef]
- Tanaka, T.; Scheet, P.; Giusti, B.; Bandinelli, S.; Piras, M.G.; Usala, G.; Lai, S.; Mulas, A.; Corsi, A.M.; Vestrini, A.; et al. Genome-wide association study of vitamin B6, vitamin B12, folate, and homocysteine blood concentrations. Am. J. Hum. Genet. 2009, 84, 477–482. [Google Scholar] [CrossRef] [PubMed]
- Fong, C.C.; Lai, W.P.; Leung, Y.C.; Lo, S.C.; Wong, M.S.; Yang, M. Study of substrate-enzyme interaction between immobilized pyridoxamine and recombinant porcine pyridoxal kinase using surface plasmon resonance biosensor. Biochim. Biophys. Acta 2002, 1596, 95–107. [Google Scholar] [CrossRef]
- Musayev, F.N.; Di Salvo, M.L.; Ko, T.P.; Schirch, V.; Safo, M.K. Structure and properties of recombinant human pyridoxine 5′-phosphate oxidase. Protein Sci. 2003, 12, 1455–1463. [Google Scholar] [CrossRef] [PubMed]
- Jang, Y.M.; Kim, D.W.; Kang, T.C.; Won, M.H.; Baek, N.I.; Moon, B.J.; Choi, S.Y.; Kwon, O.S. Human pyridoxal phosphatase. Molecular cloning, functional expression, and tissue distribution. J. Biol. Chem. 2003, 278, 50040–50046. [Google Scholar] [CrossRef]
- Merrill, A.H., Jr.; Henderson, J.M.; Wang, E.; McDonald, B.W.; Millikan, W.J. Metabolism of vitamin B-6 by human liver. J. Nutr. 1984, 114, 1664–1674. [Google Scholar] [CrossRef]
- Bender, D. Water-soluble vitamins: Vitamin B6. In Human Nutrition; Elsevier/Churchill Livingstone: London, UK, 2005; pp. 194–196. [Google Scholar]
- Said, H.M.; Ortiz, A.; Ma, T.Y. A carrier-mediated mechanism for pyridoxine uptake by human intestinal epithelial Caco-2 cells: Regulation by a PKA-mediated pathway. Am. J. Physiol. Cell Physiol. 2003, 285, C1219–C1225. [Google Scholar] [CrossRef]
- Said, Z.M.; Subramanian, V.S.; Vaziri, N.D.; Said, H.M. Pyridoxine uptake by colonocytes: A specific and regulated carrier-mediated process. Am. J. Physiol. Cell Physiol. 2008, 294, C1192–C1197. [Google Scholar] [CrossRef]
- Spector, R.; Johanson, C.E. Vitamin transport and homeostasis in mammalian brain: Focus on Vitamins B and E. J. Neurochem. 2007, 103, 425–438. [Google Scholar] [CrossRef]
- Albersen, M.; Bosma, M.; Jans, J.J.; Hofstede, F.C.; van Hasselt, P.M.; de Sain-van der Velden, M.G.; Visser, G.; Verhoeven-Duif, N.M. Vitamin B6 in plasma and cerebrospinal fluid of children. PLoS ONE 2015, 10, e0120972. [Google Scholar] [CrossRef] [PubMed]
- Albersen, M.; Bosma, M.; Luykx, J.J.; Jans, J.J.; Bakker, S.C.; Strengman, E.; Borgdorff, P.J.; Keijzers, P.J.; van Dongen, E.P.; Bruins, P.; et al. Vitamin B-6 vitamers in human plasma and cerebrospinal fluid. Am. J. Clin. Nutr. 2014, 100, 587–592. [Google Scholar] [CrossRef] [PubMed]
- Luykx, J.J.; Vinkers, C.H.; Bakker, S.C.; Visser, W.F.; van Boxmeer, L.; Strengman, E.; van Eijk, K.R.; Lens, J.A.; Borgdorff, P.; Keijzers, P.; et al. A common variant in ERBB4 regulates GABA concentrations in human cerebrospinal fluid. Neuropsychopharmacology 2012, 37, 2088–2092. [Google Scholar] [CrossRef] [PubMed]
- Luykx, J.J.; Bakker, S.C.; Lentjes, E.; Neeleman, M.; Strengman, E.; Mentink, L.; DeYoung, J.; de Jong, S.; Sul, J.H.; Eskin, E.; et al. Genome-wide association study of monoamine metabolite levels in human cerebrospinal fluid. Mol. Psychiatry 2014, 19, 228–234. [Google Scholar] [CrossRef] [PubMed]
- Hetsroni, I.; Lyman, S.; Do, H.; Mann, G.; Marx, R.G. Symptomatic pulmonary embolism after outpatient arthroscopic procedures of the knee: The incidence and risk factors in 418,323 arthroscopies. J. Bone Jt. Surg. Br. 2011, 93, 47–51. [Google Scholar] [CrossRef] [PubMed]
- Van der Ham, M.; Albersen, M.; de Koning, T.J.; Visser, G.; Middendorp, A.; Bosma, M.; Verhoeven-Duif, N.M.; de Sain-van der Velden, M.G. Quantification of vitamin B6 vitamers in human cerebrospinal fluid by ultra performance liquid chromatography-tandem mass spectrometry. Anal. Chim. Acta 2012, 712, 108–114. [Google Scholar] [CrossRef]
- Albersen, M.; Groenendaal, F.; van der Ham, M.; de Koning, T.J.; Bosma, M.; Visser, W.F.; Visser, G.; de Sain-van der Velden, M.G.; Verhoeven-Duif, N.M. Vitamin B6 vitamer concentrations in cerebrospinal fluid differ between preterm and term newborn infants. Pediatrics 2012, 130, e191–e198. [Google Scholar] [CrossRef]
- Gieger, C.; Geistlinger, L.; Altmaier, E.; Hrabe de Angelis, M.; Kronenberg, F.; Meitinger, T.; Mewes, H.W.; Wichmann, H.E.; Weinberger, K.M.; Adamski, J.; et al. Genetics meets metabolomics: A genome-wide association study of metabolite profiles in human serum. PLoS Genet. 2008, 4, e1000282. [Google Scholar] [CrossRef]
- Petersen, A.K.; Krumsiek, J.; Wagele, B.; Theis, F.J.; Wichmann, H.E.; Gieger, C.; Suhre, K. On the hypothesis-free testing of metabolite ratios in genome-wide and metabolome-wide association studies. BMC Bioinform. 2012, 13, 120. [Google Scholar] [CrossRef]
- Purcell, S.; Neale, B.; Todd-Brown, K.; Thomas, L.; Ferreira, M.A.; Bender, D.; Maller, J.; Sklar, P.; de Bakker, P.I.; Daly, M.J.; et al. PLINK: A tool set for whole-genome association and population-based linkage analyses. Am. J. Hum. Genet. 2007, 81, 559–575. [Google Scholar] [CrossRef]
- International HapMap, C.; Altshuler, D.M.; Gibbs, R.A.; Peltonen, L.; Altshuler, D.M.; Gibbs, R.A.; Peltonen, L.; Dermitzakis, E.; Schaffner, S.F.; Yu, F.; et al. Integrating common and rare genetic variation in diverse human populations. Nature 2010, 467, 52–58. [Google Scholar] [CrossRef] [PubMed]
- Das, S.; Forer, L.; Schönherr, S.; Sidore, C.; Locke, A.E.; Kwong, A.; Vrieze, S.I.; Chew, E.Y.; Levy, S.; McGue, M.; et al. Next-generation genotype imputation service and methods. Nat. Genet. 2016, 48, 1284–1287. [Google Scholar] [CrossRef]
- Allison, D.B.; Thiel, B.; St Jean, P.; Elston, R.C.; Infante, M.C.; Schork, N.J. Multiple phenotype modeling in gene-mapping studies of quantitative traits: Power advantages. Am. J. Hum. Genet. 1998, 63, 1190–1201. [Google Scholar] [CrossRef] [PubMed]
- Ferreira, M.A.; Purcell, S.M. A multivariate test of association. Bioinformatics 2009, 25, 132–133. [Google Scholar] [CrossRef] [PubMed]
- Galesloot, T.E.; van Steen, K.; Kiemeney, L.A.; Janss, L.L.; Vermeulen, S.H. A comparison of multivariate genome-wide association methods. PLoS ONE 2014, 9, e95923. [Google Scholar] [CrossRef]
- Gamazon, E.R.; Wheeler, H.E.; Shah, K.P.; Mozaffari, S.V.; Aquino-Michaels, K.; Carroll, R.J.; Eyler, A.E.; Denny, J.C.; Consortium, G.T.; Nicolae, D.L.; et al. A gene-based association method for mapping traits using reference transcriptome data. Nat. Genet. 2015, 47, 1091–1098. [Google Scholar] [CrossRef] [PubMed]
- Consortium, G.T. Human genomics. The Genotype-Tissue Expression (GTEx) pilot analysis: Multitissue gene regulation in humans. Science 2015, 348, 648–660. [Google Scholar] [CrossRef]
- Chambers, J.C.; Zhang, W.; Sehmi, J.; Li, X.; Wass, M.N.; Van der Harst, P.; Holm, H.; Sanna, S.; Kavousi, M.; Baumeister, S.E.; et al. Genome-wide association study identifies loci influencing concentrations of liver enzymes in plasma. Nat. Genet. 2011, 43, 1131–1138. [Google Scholar] [CrossRef]
- Kamatani, Y.; Matsuda, K.; Okada, Y.; Kubo, M.; Hosono, N.; Daigo, Y.; Nakamura, Y.; Kamatani, N. Genome-wide association study of hematological and biochemical traits in a Japanese population. Nat. Genet. 2010, 42, 210–215. [Google Scholar] [CrossRef]
- Yuan, X.; Waterworth, D.; Perry, J.R.; Lim, N.; Song, K.; Chambers, J.C.; Zhang, W.; Vollenweider, P.; Stirnadel, H.; Johnson, T.; et al. Population-based genome-wide association studies reveal six loci influencing plasma levels of liver enzymes. Am. J. Hum. Genet. 2008, 83, 520–528. [Google Scholar] [CrossRef]


| Number | Median | Range | ||
|---|---|---|---|---|
| Sex | 353 male 140 female | n.a. | n.a. | |
| Age (years) | 493 | 42 | 18–63 | |
| PL | Plasma | 480 | 10.5 | 3.0–56.2 |
| CSF | 399 | 30.0 | 13.5–66.4 | |
| PLP | Plasma | 480 | 55.7 | 10.2–335 |
| CSF | 399 | 16.0 | 5.3–45.8 | |
| PA | Plasma | 480 | 23.6 | 2.7–243 |
| PLP:PL | Plasma | 480 | 5.4 | 1.1–36.8 |
| CSF | 399 | 0.5 | 0.2–1.8 | |
| PA:PL | Plasma | 480 | 2.4 | 0.3–15.1 |
| PA:PLP | Plasma | 480 | 0.44 | 0.03–2.5 |
| PL in CSF:plasma | 386 | 2.9 | 0.9–10.6 | |
| PLP in CSF:plasma | 386 | 0.3 | 0.1–0.9 | |
| Index SNP | Chr | Allele | Position (bp) | MAF | Genes | F | Significance (p-Value) | OMIM | Weights | ||||
|---|---|---|---|---|---|---|---|---|---|---|---|---|---|
| PLP in CSF | PLP in Plasma | PLP:PL in CSF | PLP:PL in Plasma | PA:PLP in Plasma | |||||||||
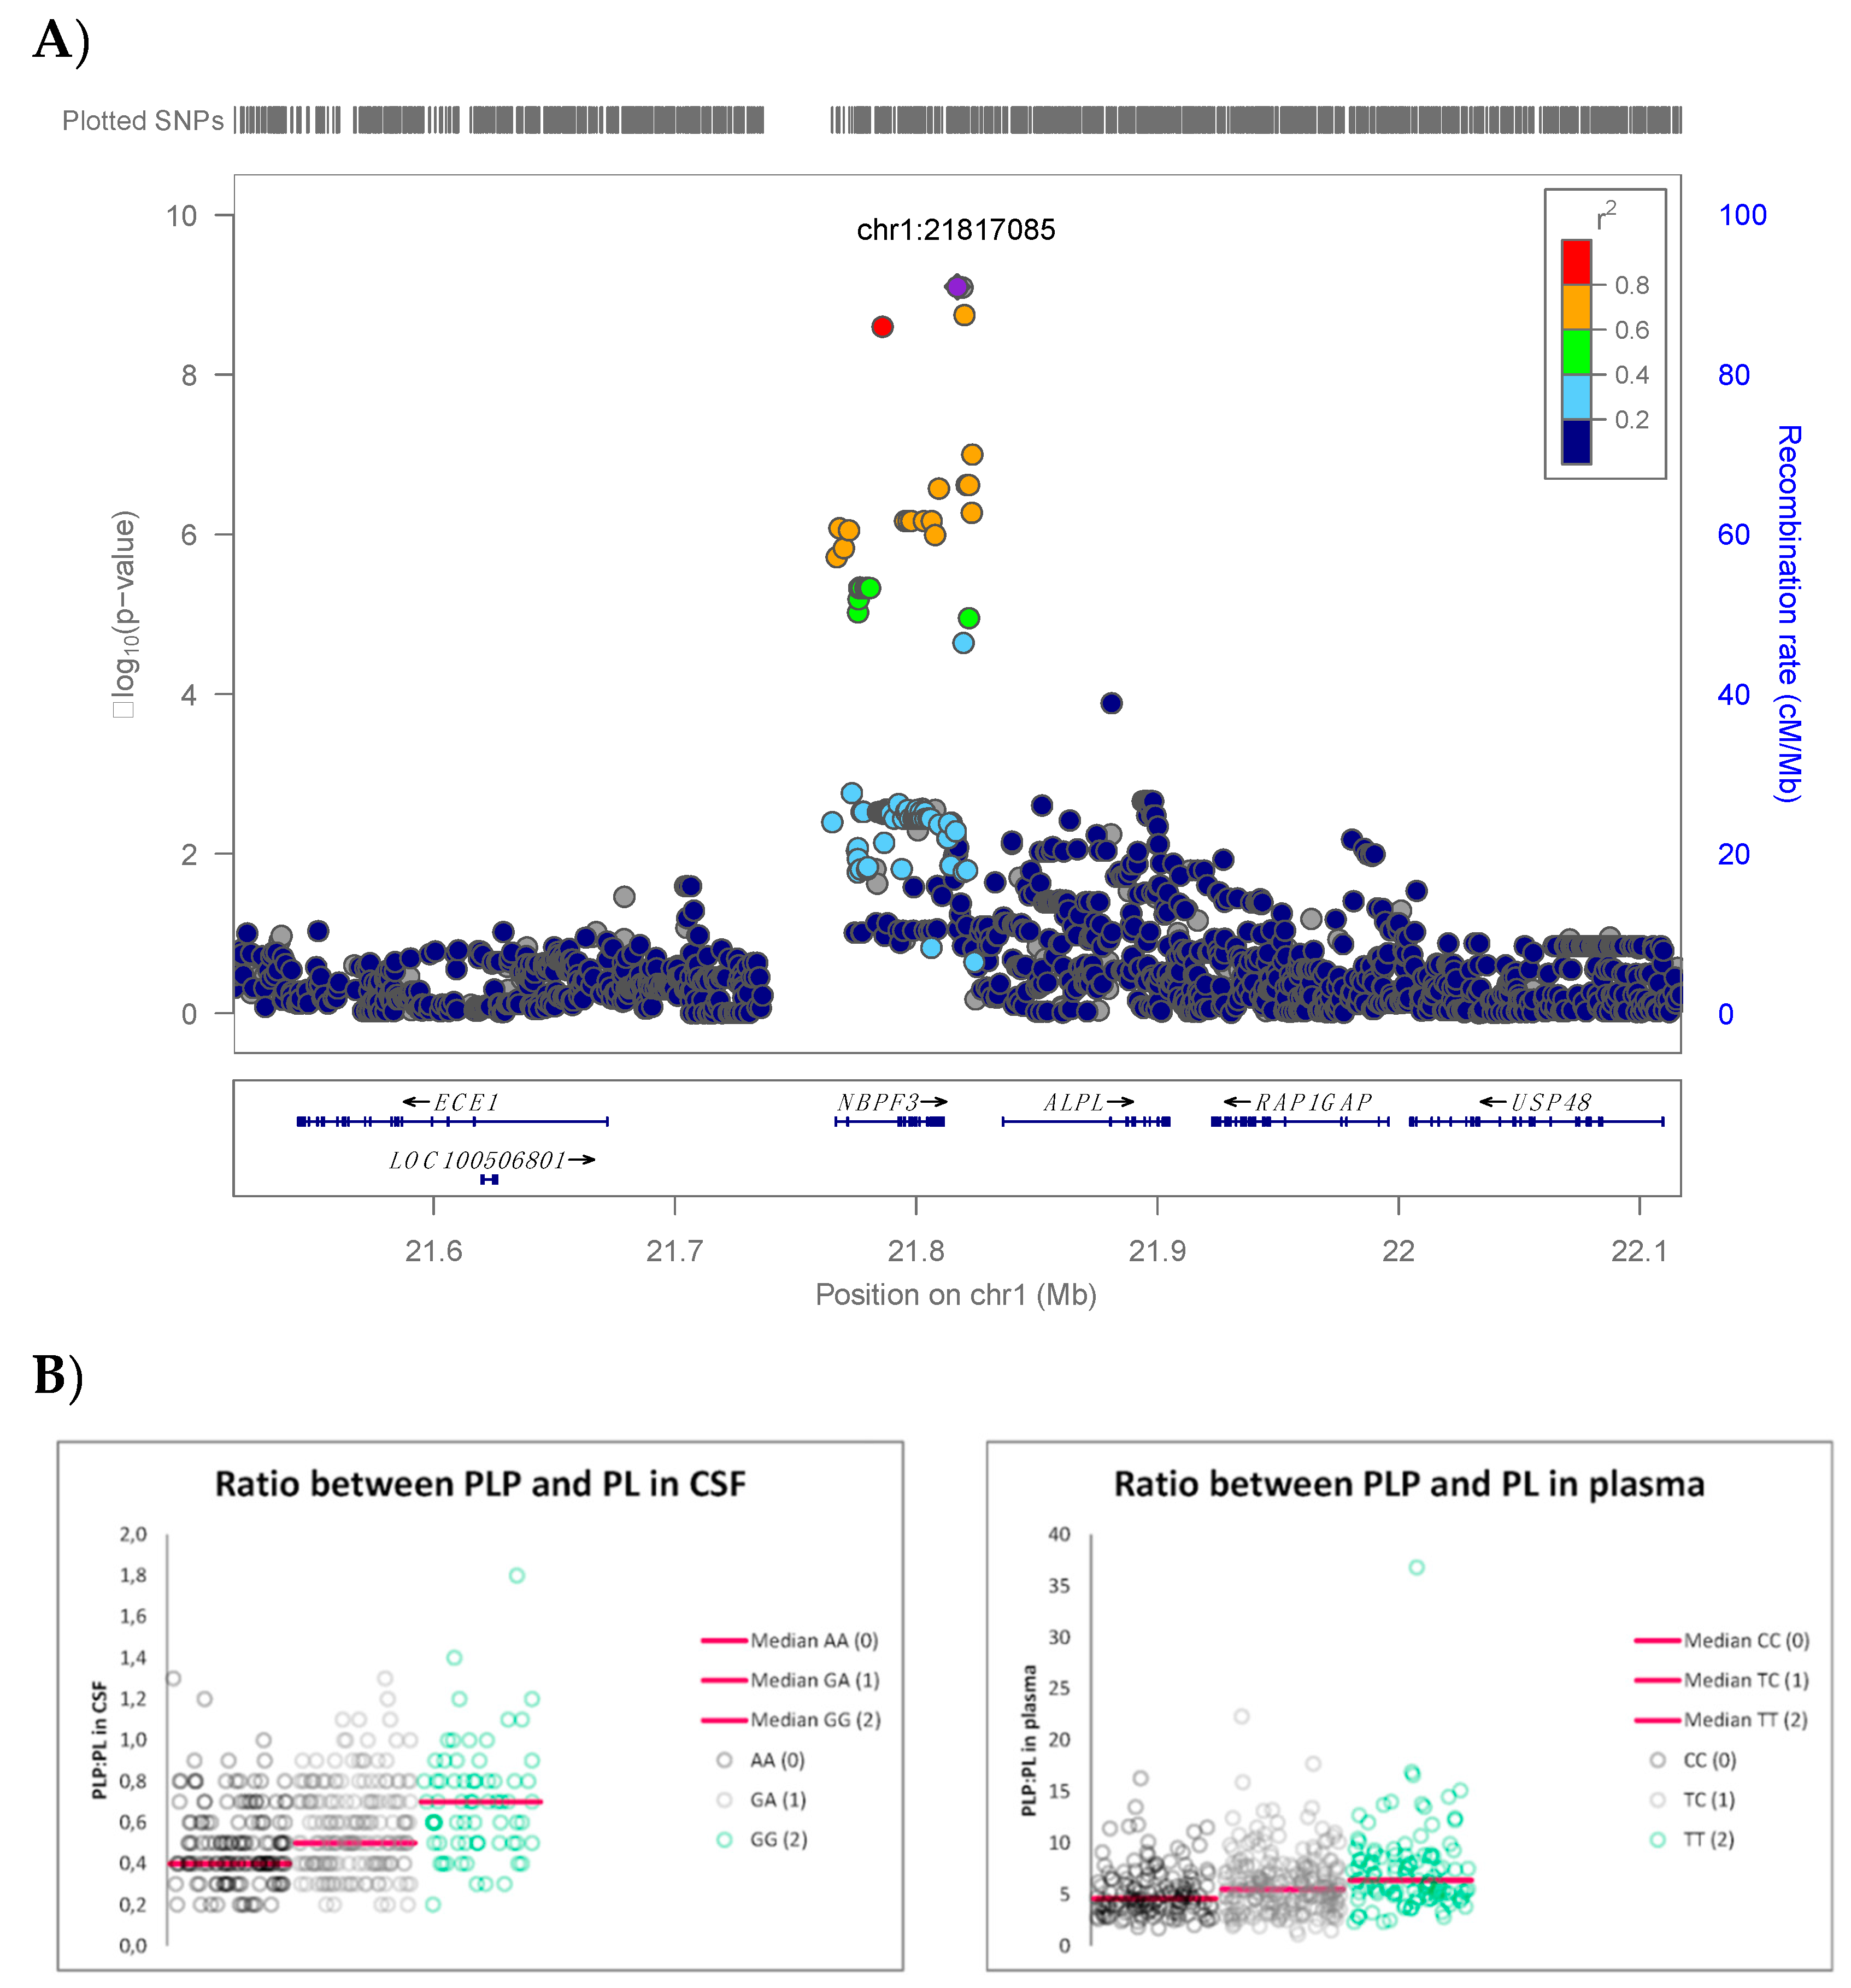
| rs1106357 | 1 | T/C | 2,181,7085 | 0.46 | NBPF3, ALPL | 6.34 | 7.89 × 10⁻¹⁰ | #146300 #241500 #241510 | 0.58 | 0.48 | 0.65 | 0.66 | −0.58 |
| SNP | Chr | Genotype (n) | PLP:PL in Plasma (Median (Range)) | Significance (p-Value) * | PLP:PL in CSF (Median (Range)) | Significance (p-Value) * |
|---|---|---|---|---|---|---|
| rs1106357 | 1 | 0 (143) | 4.6 (1.7–16.3) | 0 vs. 1 3.23 × 10⁻³ 0 vs. 2 <5.0 × 10⁻⁷ 1 vs. 2 5.95 × 10⁻⁴ | 0.4 (0.2–1.3) | 0 vs. 1 3.26 × 10⁻³ 0 vs. 2 <5.0 × 10⁻⁷ 1 vs. 2 4.45 × 10⁻⁴ |
| 1 (233) | 5.5 (1.1–22.3) | 0.5 (0.2–1.3) | ||||
| 2 (104) | 6.4 (2.3–36.8) | 0.7 (0.2–1.8) |
| Index SNP | Chr | Allele | Position (bp) | MAF | Beta * | Significance (p-Value) | Body Fluid & B6 Vitamer | Methods | Reference |
|---|---|---|---|---|---|---|---|---|---|
| rs1256335 | 1 | A/G | 21,890,386 | 0.21 | −0.14 | 1.40 × 10⁻¹⁵ | Plasma PLP | Meta-analysis of three GWAS (n = 4763) | [22] |
| rs4654748 | C/T | 21,786,068 | 0.50 | −1.45 | 8.30 × 10⁻¹⁸ | Plasma vitamin B6 | Four GWAS cohort meta-analysis (n = 1864) | [23] | |
| rs1697421 | G/A | 21,823,292 | 0.47 | 0.173 | 7.06 × 10⁻¹⁰ | Plasma PLP | GWAS (n = 2100) | [20] | |
| rs1772719 | A/C | 21,904,374 | 0.23 | −0.06 | 2.48 × 10⁻¹⁶ | Plasma PLP | GWAS (n = 2158) | [21] |
© 2018 by the authors. Licensee MDPI, Basel, Switzerland. This article is an open access article distributed under the terms and conditions of the Creative Commons Attribution (CC BY) license (http://creativecommons.org/licenses/by/4.0/).
Share and Cite
Olde Loohuis, L.M.; Albersen, M.; De Jong, S.; Wu, T.; Luykx, J.J.; Jans, J.J.M.; Verhoeven-Duif, N.M.; Ophoff, R.A. The Alkaline Phosphatase (ALPL) Locus Is Associated with B6 Vitamer Levels in CSF and Plasma. Genes 2019, 10, 8. https://doi.org/10.3390/genes10010008
Olde Loohuis LM, Albersen M, De Jong S, Wu T, Luykx JJ, Jans JJM, Verhoeven-Duif NM, Ophoff RA. The Alkaline Phosphatase (ALPL) Locus Is Associated with B6 Vitamer Levels in CSF and Plasma. Genes. 2019; 10(1):8. https://doi.org/10.3390/genes10010008
Chicago/Turabian StyleOlde Loohuis, Loes M., Monique Albersen, Simone De Jong, Timothy Wu, Jurjen J. Luykx, Judith J. M. Jans, Nanda M. Verhoeven-Duif, and Roel A. Ophoff. 2019. "The Alkaline Phosphatase (ALPL) Locus Is Associated with B6 Vitamer Levels in CSF and Plasma" Genes 10, no. 1: 8. https://doi.org/10.3390/genes10010008
APA StyleOlde Loohuis, L. M., Albersen, M., De Jong, S., Wu, T., Luykx, J. J., Jans, J. J. M., Verhoeven-Duif, N. M., & Ophoff, R. A. (2019). The Alkaline Phosphatase (ALPL) Locus Is Associated with B6 Vitamer Levels in CSF and Plasma. Genes, 10(1), 8. https://doi.org/10.3390/genes10010008