Article

Transcriptomic Profiling of Ca2+ Transport Systems during the Formation of the Cerebral Cortex in Mice

Genetics and Chemogenomics Lab, Université Grenoble Alpes, CNRS, CEA, INSERM, Bâtiment C3, 17 rue des Martyrs, 38054 Grenoble, France
Cells 2020, 9(8), 1800; https://doi.org/10.3390/cells9081800
Submission received: 29 June 2020 / Revised: 20 July 2020 / Accepted: 24 July 2020 / Published: 29 July 2020
(This article belongs to the Section Cells of the Nervous System)

Abstract

:
Cytosolic calcium (Ca2+) transients control key neural processes, including neurogenesis, migration, the polarization and growth of neurons, and the establishment and maintenance of synaptic connections. They are thus involved in the development and formation of the neural system. In this study, a publicly available whole transcriptome sequencing (RNA-Seq) dataset was used to examine the expression of genes coding for putative plasma membrane and organellar Ca2+-transporting proteins (channels, pumps, exchangers, and transporters) during the formation of the cerebral cortex in mice. Four ages were considered: embryonic days 11 (E11), 13 (E13), and 17 (E17), and post-natal day 1 (PN1). This transcriptomic profiling was also combined with live-cell Ca2+ imaging recordings to assess the presence of functional Ca2+ transport systems in E13 neurons. The most important Ca2+ routes of the cortical wall at the onset of corticogenesis (E11–E13) were TACAN, GluK5, nAChR β2, Cav3.1, Orai3, transient receptor potential cation channel subfamily M member 7 (TRPM7) non-mitochondrial Na+/Ca2+ exchanger 2 (NCX2), and the connexins CX43/CX45/CX37. Hence, transient receptor potential cation channel mucolipin subfamily member 1 (TRPML1), transmembrane protein 165 (TMEM165), and Ca2+ “leak” channels are prominent intracellular Ca2+ pathways. The Ca2+ pumps sarco/endoplasmic reticulum Ca2+ ATPase 2 (SERCA2) and plasma membrane Ca2+ ATPase 1 (PMCA1) control the resting basal Ca2+ levels. At the end of neurogenesis (E17 and onward), a more numerous and diverse population of Ca2+ uptake systems was observed. In addition to the actors listed above, prominent Ca2+-conducting systems of the cortical wall emerged, including acid-sensing ion channel 1 (ASIC1), Orai2, P2X2, and GluN1. Altogether, this study provides a detailed view of the pattern of expression of the main actors participating in the import, export, and release of Ca2+. This work can serve as a framework for further functional and mechanistic studies on Ca2+ signaling during cerebral cortex formation.

1. Introduction

The divalent cation calcium (Ca2+) is a universal intracellular signaling messenger [1]. The cytosolic concentration of free ionized Ca2+ ([Ca2+]i) in quiescent cells is estimated to be in the 10–100 nM range. However, various pathophysiological conditions elevate [Ca2+]i, which, in turn, influences a myriad of biological processes, such as gene expression, neurogenesis, neuronal migration, axon growth, synaptic transmission, synaptic plasticity, and the maintenance of synaptic networks [1,2,3,4]. The duration, magnitude, and spatiotemporal characteristics (subcellular localization and frequency) of the cytosolic Ca2+ rise are crucial parameters controlling the Ca2+-dependent intracellular signaling cascades. Schematically, [Ca2+]i changes reflect an entry of Ca2+ from the extracellular milieu or a release from internal stores. These two processes are often interrelated and, thus, cooperate to influence [Ca2+]i.
An influx of Ca2+ is mainly mediated by Ca2+-conducting channels. These channels constitute a rather complex and diverse family, comprising structurally, pharmacologically, and functionally different proteins with distinct patterns of expression and subcellular localization. [Ca2+]i rises are counterbalanced by systems that maintain low [Ca2+]i levels. This is achieved via the extrusion, storage, and/or intracellular accumulation of Ca2+ into compartments. Therefore, at the cellular level, a vast number of proteins (e.g., channels, pumps, exchangers, and Ca2+-binding proteins) are involved in the handling of Ca2+ and the shaping of its cytosolic variations. Any insult modifying the abundance, distribution, and activity of these proteins is likely to affect cell functions and survival.
In the mammalian brain, the cerebral cortex is composed of six superimposed cellular layers formed during embryogenesis. In mice, this formation takes place between embryonic days 10–11 (E10–E11) and E17–E18 [5,6] and requires coordinated and regulated sequences of cell proliferation, migration, morphological differentiation, and synaptogenesis [7,8,9]. Any alteration of these key stages can ultimately alter the growth and development of the cerebral cortex. Understanding the formation of this brain area is of crucial importance as a variety of developmental neuropathologies and neurological disorders are associated with cortical abnormalities [8,10]. As changes in [Ca2+]i levels play pivotal roles during the formation of the cortex [2,3,11], it is important to characterize the repertoire of actors participating in the transport of Ca2+ through membranes.
The aim of this report was to provide a detailed picture of the expression of genes encoding the putative plasma membrane and organellar Ca2+-transporting proteins during embryonic cortical formation and development. The work is based on a recent genome-wide transcriptome sequencing (RNA-Seq) analysis estimating gene expression [12]. Tissues were collected at four ages: embryonic days 11 (E11), 13 (E13), and 17 (E17), and post-natal day 1 (PN1) corresponding to four crucial stages: when the neural progenitor cells begin to differentiate into neurons (E11), the peak (E13) and end of neurogenesis (E17), followed by the beginning of the maturation process and circuit assembly (PN1). The report is divided into two parts: the first part is a genome-scale profile of gene expression that is further subdivided into five chapters covering the following topics: (1) channels, (2) Ca2+ ATPases, (3) exchangers, (4) antiporters, and (5) mitochondrial actors. The second part of the report is devoted to the main functional Ca2+ transport systems present in E13 cortical cells.

2. Materials and Methods

2.1. Animals

The experiments were conducted in accordance with the French legislation and the European Community Council Directive of 24 November 1986 (86/609/EEC). C57Bl6/J mice (Charles River, l’Arbresle, France) were housed in the same room under a 12 h light/12 h dark cycle with ad libitum access to food and water. They were exposed to an enriched environment in agreement with the Animal Welfare Committee of the Commissariat à l’énergie atomique et aux énergies alternatives (CEA) Grenoble. To enable the dating of the embryos, we crossed the animals at night once a week and then males were removed before 9 a.m. This day was counted as E0.

2.2. Primary Cultures of Cortical Cells

Primary cultures of embryonic cortical neurons were prepared from E13 C57BL6/J mice as previously described [13,14,15], according to an experimental protocol approved by the ethical committee of the CEA’s Life Sciences Division (CETEA) (#A14-006).

2.3. Single-Cell Calcium Imaging

These experiments were conducted with the Ca2+ probe Fluo4 as previously described [13,16,17]. Briefly, cells were loaded with 5 µM Fluo4/AM for 25 min, washed, and kept for another 5–10 min in a standard recording saline solution containing (in mM) 150 NaCl, 5 KCl, 1 MgCl2, 2 CaCl2, 5.5 glucose, and 10 4-(2-hydroxyethyl)-1-piperazineethanesulfonic acid (HEPES) (pH 7.4). All these procedures were performed at room temperature and in the dark. Coverslips were then mounted on the stage of an inverted Axio Observer A1 microscope with a Fluar 40× oil immersion objective lens (1.3 NA) (Carl Zeiss, Marly le Roi, France) and a charge-coupled device camera (CoolSnap HQ2, Princeton Instruments, Roper Scientific, Evry, France). The experimental setup, equipped with a DG-4 wavelength switcher (Princeton Instruments, Roper Scientific, France), was driven by MetaFluor (Universal Imaging, Roper Scientific, Evry, France). The cytosolic Ca2+ signals were acquired from cells bodies at a sampling rate of 0.2 Hz.

2.4. Single-Cell Zinc Imaging

Cytosolic zinc (Zn2+) rises were monitored following the same experimental conditions and setup as described above, except the cells were incubated with the fluorescent Zn2+ dye FluoZin3 [15,18]. When used, the Ca2+ and Mg2+ free recording solution consisted of (in mM): 150 NaCl, 5 KCl, 5.5 glucose, and 10 HEPES (pH 7.4). The Fluo4 and FluoZin-3 signals were expressed as F/F0, with F being the fluorescence at each time point and F0 being the mean baseline fluorescence monitored for 1 min before the addition of any substance. The coverslips were used once and never reused.

3. Results and Discussion

3.1. Transcriptomic Analysis
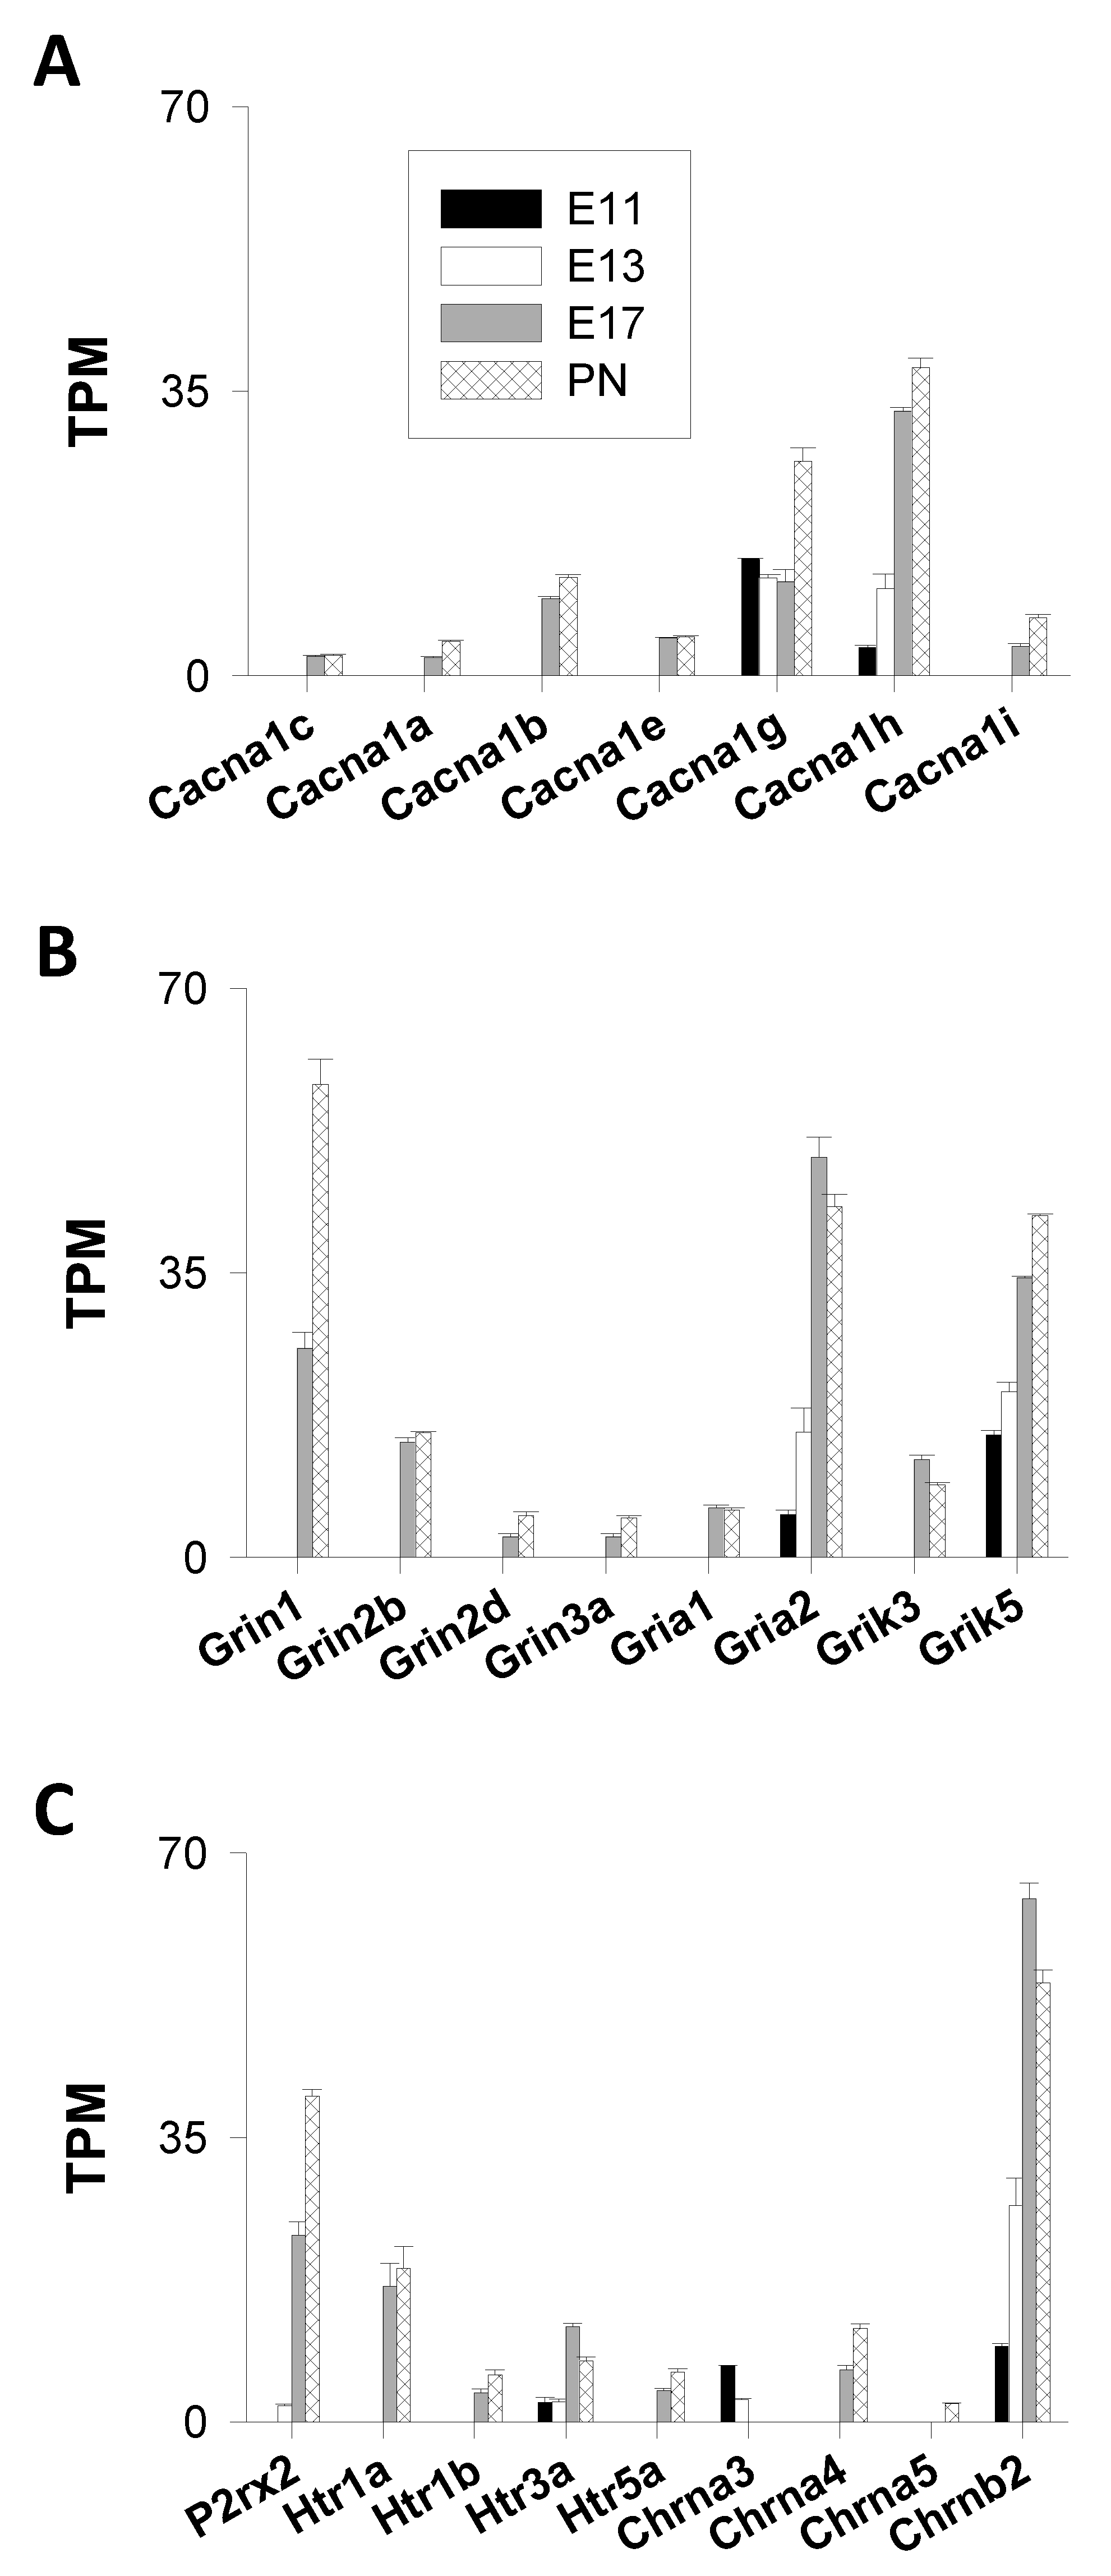
The results are expressed in transcripts per million (TPM) [12]. The complete dataset is accessible on the GEO repository at the following address: https://www.ncbi.nlm.nih.gov/geo/query/acc.cgi?acc=GSE154677.

3.1.1. Channels

Voltage-Gated Ca2+ Channels (VGCC)

Ten genes (Cacna1s, Cacna1c, Cacna1d, Cacna1f, Cacna1a, Cacna1b, Cacna1e, Cacna1g, Cacna1h, and Cacna1i) encoding the pore-forming subunits Cav1.1-1.4, Cav2.1-2.3, and Cav3.1-3.3 were analyzed. Transcripts of the following three genes coding for L-type VGCC were not detected in this RNA-Seq analysis: Cacna1s, Cacna1d, and Cacna1f. They had TPM values < 2 at each time point. Five transcripts were not detected at the beginning of corticogenesis (E11 and E13); however, their abundance increased thereafter: Cacna1c (Cav1.2, L-type), Cacna1a (Cav2.1, P/Q-type), Cacna1b (Cav2.2, N-type), Cacna1e (Cav2.3, R-type), and Cacna1i (Cav3.3, T-type) (Figure 1A). On the other hand, two genes (Cacna1g and Cacna1h) were expressed at all time points. They code for Cav3.1 (Cacna1g) and Cav3.2 (Cacna1h), two low-threshold T-type Ca2+ channels. These two genes were the most expressed VGCC genes with TPM values ranging from ≈10 to ≈35 (Figure 1A). At E11 and E13, Cacna1g mRNA (Cav3.1) was the major VGCC transcript, whereas Cacna1h mRNA (Cav3.2) predominated at E17 and PN1, showing a clear shift in the expression pattern of genes encoding T-type VGCC. Cacna1h was the most strongly induced gene with a number of transcripts increasing by a factor ≈10 from E11 to PN1. The third most expressed gene of this group was Cacna1b (Cav2.2, N-type) with TPM values of ≈10. The other VGCC genes displayed much lower TPM values (<5) (Figure 1A).
Overall, cells of the immature cortical wall were found to be equipped with distinct types of VGCC even at E11 and E13. Their mRNA levels increased with a clear augmentation noted at E17 compared to E13. Western blot experiments showed the presence of Cav3.1 proteins in the E14 murine forebrain [19]. Electrophysiological recordings provided evidence for the presence of functional T-type VGCC in cells of the ventricular zone at E15 [20], and in E13 and E15 cortical neurons in primary culture [21,22]. An entry of Ca2+ via functional VGCC was also observed at E14 in the ventricular zone [23]. Altogether, these data point to the expression of functional T-type VGCC at very early stages of the cortical development [19,20]. They were the predominant VGCC transcripts throughout corticogenesis, from E11 to PN1, indicating that Ca2+ influx through low-threshold VGCC plays important roles during the formation of the rodent cortex.

Ligand-Gated Cation Channels (LGCC)

The following cationic ionotropic neurotransmitter receptors were studied: glutamate, ATP/purinergic, nicotinic acetylcholine, and 5-hydroxytryptamine (serotonin) receptors.
  • Ionotropic Glutamatergic Receptors
A total of 18 genes were selected (Gria, Grin, Grik, and Grid) covering the four classes of ionotropic glutamate receptors α-amino-3-hydroxy-5-methyl-4-isoxazolepropionic acid (AMPA) (or GluA1-4), N-methyl-d-aspartate (NMDA) (or GluN1-3), kainate (or GluK1-5), and delta (or GluD) receptors, respectively [24]. No transcripts of the Grid1–2 genes (coding for ionotropic glutamate receptors delta 1 and 2) were found.
(a)
AMPA Receptors (GluA1-4)
Among the four genes studied (Gria1–4), two had TPM < 2 (Gria3, Gria4) and one gene (Gria1) was detected only at the end of corticogenesis (E17 and PN1), whereas Gria2 (GluA2) was expressed at all ages tested. The number of Gria2 transcripts increased by a factor ≈10 between E11 and the end of corticogenesis (E17), indicating a strong regulation in the expression of this AMPA receptor gene (Figure 1B).
(b)
NMDA Receptors (GluN1–3)
The distinct types of NMDA receptor subunits (GluN1, GluN2A–2D, and Glu3A–3B) are encoded by seven genes. Transcripts of three of them (Grin2a, Grin2c, and Grin3b) could not be detected (TPM values < 2). Transcripts of the other four genes (Grin1, Grin2b, Grin2d, and Grin3a) could not be appreciated before E17. The predominantly expressed NMDA receptor gene was Grin1. There was a marked enhancement of the Grin1 expression between E17 and PN1, with TPM values increasing from 25 to 58 (around a twofold change) (Figure 1B). Grin1 encodes GluN1, an NMDA subunit widely distributed in the brain [25].
(c)
Kainate Receptors (GluK1-5)
Grik5 and, to a lesser extent, Grik3 were the predominant genes of this subgroup. They encode GluK5 and GluK3, high and low affinity kainate receptor subunits, respectively. Grik5 was the only kainate receptor gene to be expressed throughout corticogenesis. GluK5 forms functional receptors when associated with other kainate receptor subunits, such as GluK1-3. When expressed alone, they are mainly found in the endoplasmic reticulum and are not targeted to the cell surface [26]. Together with Gria2, Grik5 was the main ionotropic glutamatergic subunit gene expressed at the onset of corticogenesis. Grik5 expression was strongly enhanced with TPM values increasing from 15 to 42 (around a threefold change) (Figure 1B).
2.
Ionotropic Purinergic Receptors
Seven genes coding for ionotropic purinergic receptors (P2XR) were considered: P2rx1–7. The RNAseq analysis indicated that P2rx2 (encoding P2X2 receptors) was the sole gene of this subgroup expressed during corticogenesis and that P2rx2 transcripts were not detected at E11 (with TPM < 2). The TPM values were 2, 23, and 40 at E13, E17, and PN1 (Figure 1B). Expression of the P2rx2 gene was considerably enhanced between E13 and E17 (with a ≈10-fold change in the TPM values), indicating an important role during the formation of the cortical layers. The abundance of transcripts were augmented by a factor of two between E17 and PN1. Overall, this represented a 20-fold increase in the P2rx2 mRNA abundance between the peak of corticogenesis (E13) and the postnatal period. The P2rx2 gene was one of the most upregulated genes of this study.
3.
Ionotropic Serotoninergic (5-HT) Receptors
Only one ionotropic 5-HT receptor gene was expressed throughout corticogenesis: Htr3a. The TPM values of Htr3a increased from ≈2–3 at E11–E13 to ≈12 at E17 before declining to ≈7 at PN1. Three other transcripts were detected but only starting at E17 (the end of corticogenesis) and onward: Htr1a, Htr1b, and Htr5a. With TPM values of 16–18 (at E17 and PN1), the Htr1a gene predominated over the other members (Htr1b and Htr5a) that displayed TPM values of 3–6 at the same ages (Figure 1C). 5-HT3 was the sole type of ionotropic serotoninergic receptor present at the early stages of corticogenesis, whereas 5-HT1A predominated at the end of corticogenesis. As for VGCC, there was a shift in the expression pattern of genes encoding 5-HT receptors.
4.
Nicotinic Acetylcholine Receptors
Concerning nicotinic acetylcholine receptors (nAChR), 16 genes were considered: Chrna1–10 (nAChR alpha 1–10 subunits); Chrnb1–Chrnb4 (nAChR beta 1–4 subunits); and Chrnd, Chrne, and Chrng (nAChR delta, epsilon, and gamma subunits, respectively). Transcripts of only three genes were detected: Chrna3 (nAChR α3), Chrna4 (nAChR α4), and Chrnb2 (nAChR β2). Overall, Chrnb2 was, by far, the most expressed gene of this subfamily of cation channels. Chrnb2 was expressed at all ages. The abundance of Chrnb2 transcripts exhibited a sevenfold increase throughout corticogenesis with TPM values of 9, 27, 64, and 54 at E11, E13, E17, and PN1, respectively (Figure 1C). The other two transcripts, Chrna3 (nAChR α3) and Chrna4 (nAChR α4), were found at much lower levels (TPM values around 7–3 and 6–11 for Chrna3 and Chrna4, respectively). These two genes were oppositely regulated—βon the one hand, Chrna3 was expressed at the onset of corticogenesis; on the other hand, the expression of the Chrna4 gene began at the end of corticogenesis (E17). Both observations were in agreement with previous findings [27]. In summary, this transcriptomic analysis indicated that (α3, β2) and (α4, β2) were the predominant nicotinic subunits of the cortical wall at the beginning (E11–E13) and the end of neurogenesis (E17–PN1), respectively.
When analyzing the genes encoding cationic ionotropic neurotransmitter receptor subunits at the four time points (E11, E13, E17, and PN1) (Figure 1B,C), there appeared to be an overall rise in the TPM values—starting at 2–15 TPM at the beginning of corticogenesis (E11), and reaching values of 15–65 TPM at the end of corticogenesis (E17 and PN1). This reflects an increase in the abundance of transcripts throughout corticogenesis. The most highly expressed genes were kainate Grik5 (GluK5), nicotinic cholinergic Chrnb2 (nAChR β2), and AMPA Gria2 (GluA2). At the end of neurogenesis (E17–PN1), the major transcripts of this subgroup were Grin1 (GluN1), Grin2b (GluN2B), and P2rx2 (P2X2 receptors). Of note, among the five most expressed genes at the end of corticogenesis (E17 and PN1) and encoding cationic ionotropic neurotransmitter receptor subunits, two of them (Grin1 and Grin2b) encoded NMDA subunits (GluN1 and GluN2B).
This study was focused on the expression of the genes encoding Ca2+-permeable channels. In this context, it is important to recall that the mRNA of the AMPA receptor GluA2 undergoes a post-transcriptional editing process giving rise to functionally distinct channels deriving from the same gene (Gria2)—in its edited form, GluA2 forms Ca2+-impermeable channels. In the absence of edited GluA2 subunits, multimeric GluA2 receptors are Ca2+-conducting channels [28,29]. The non-edited form (giving rise to Ca2+-permeable GluA2 subunit) is detectable during embryogenesis only, found, for instance, in neuronal progenitor cells where the post-transcriptional regulation process of the GluA2 mRNA could be involved in the induction of neurogenesis [30]. However, even in the immature brain, the great majority (>99%) of the GluA2 mRNA is considered to be in the edited form, implying that most AMPA receptors are Ca2+-impermeable [28]. Therefore, the Ca2+ permeability of AMPA channels is merely dictated by the absence or presence of GluA2 subunits.

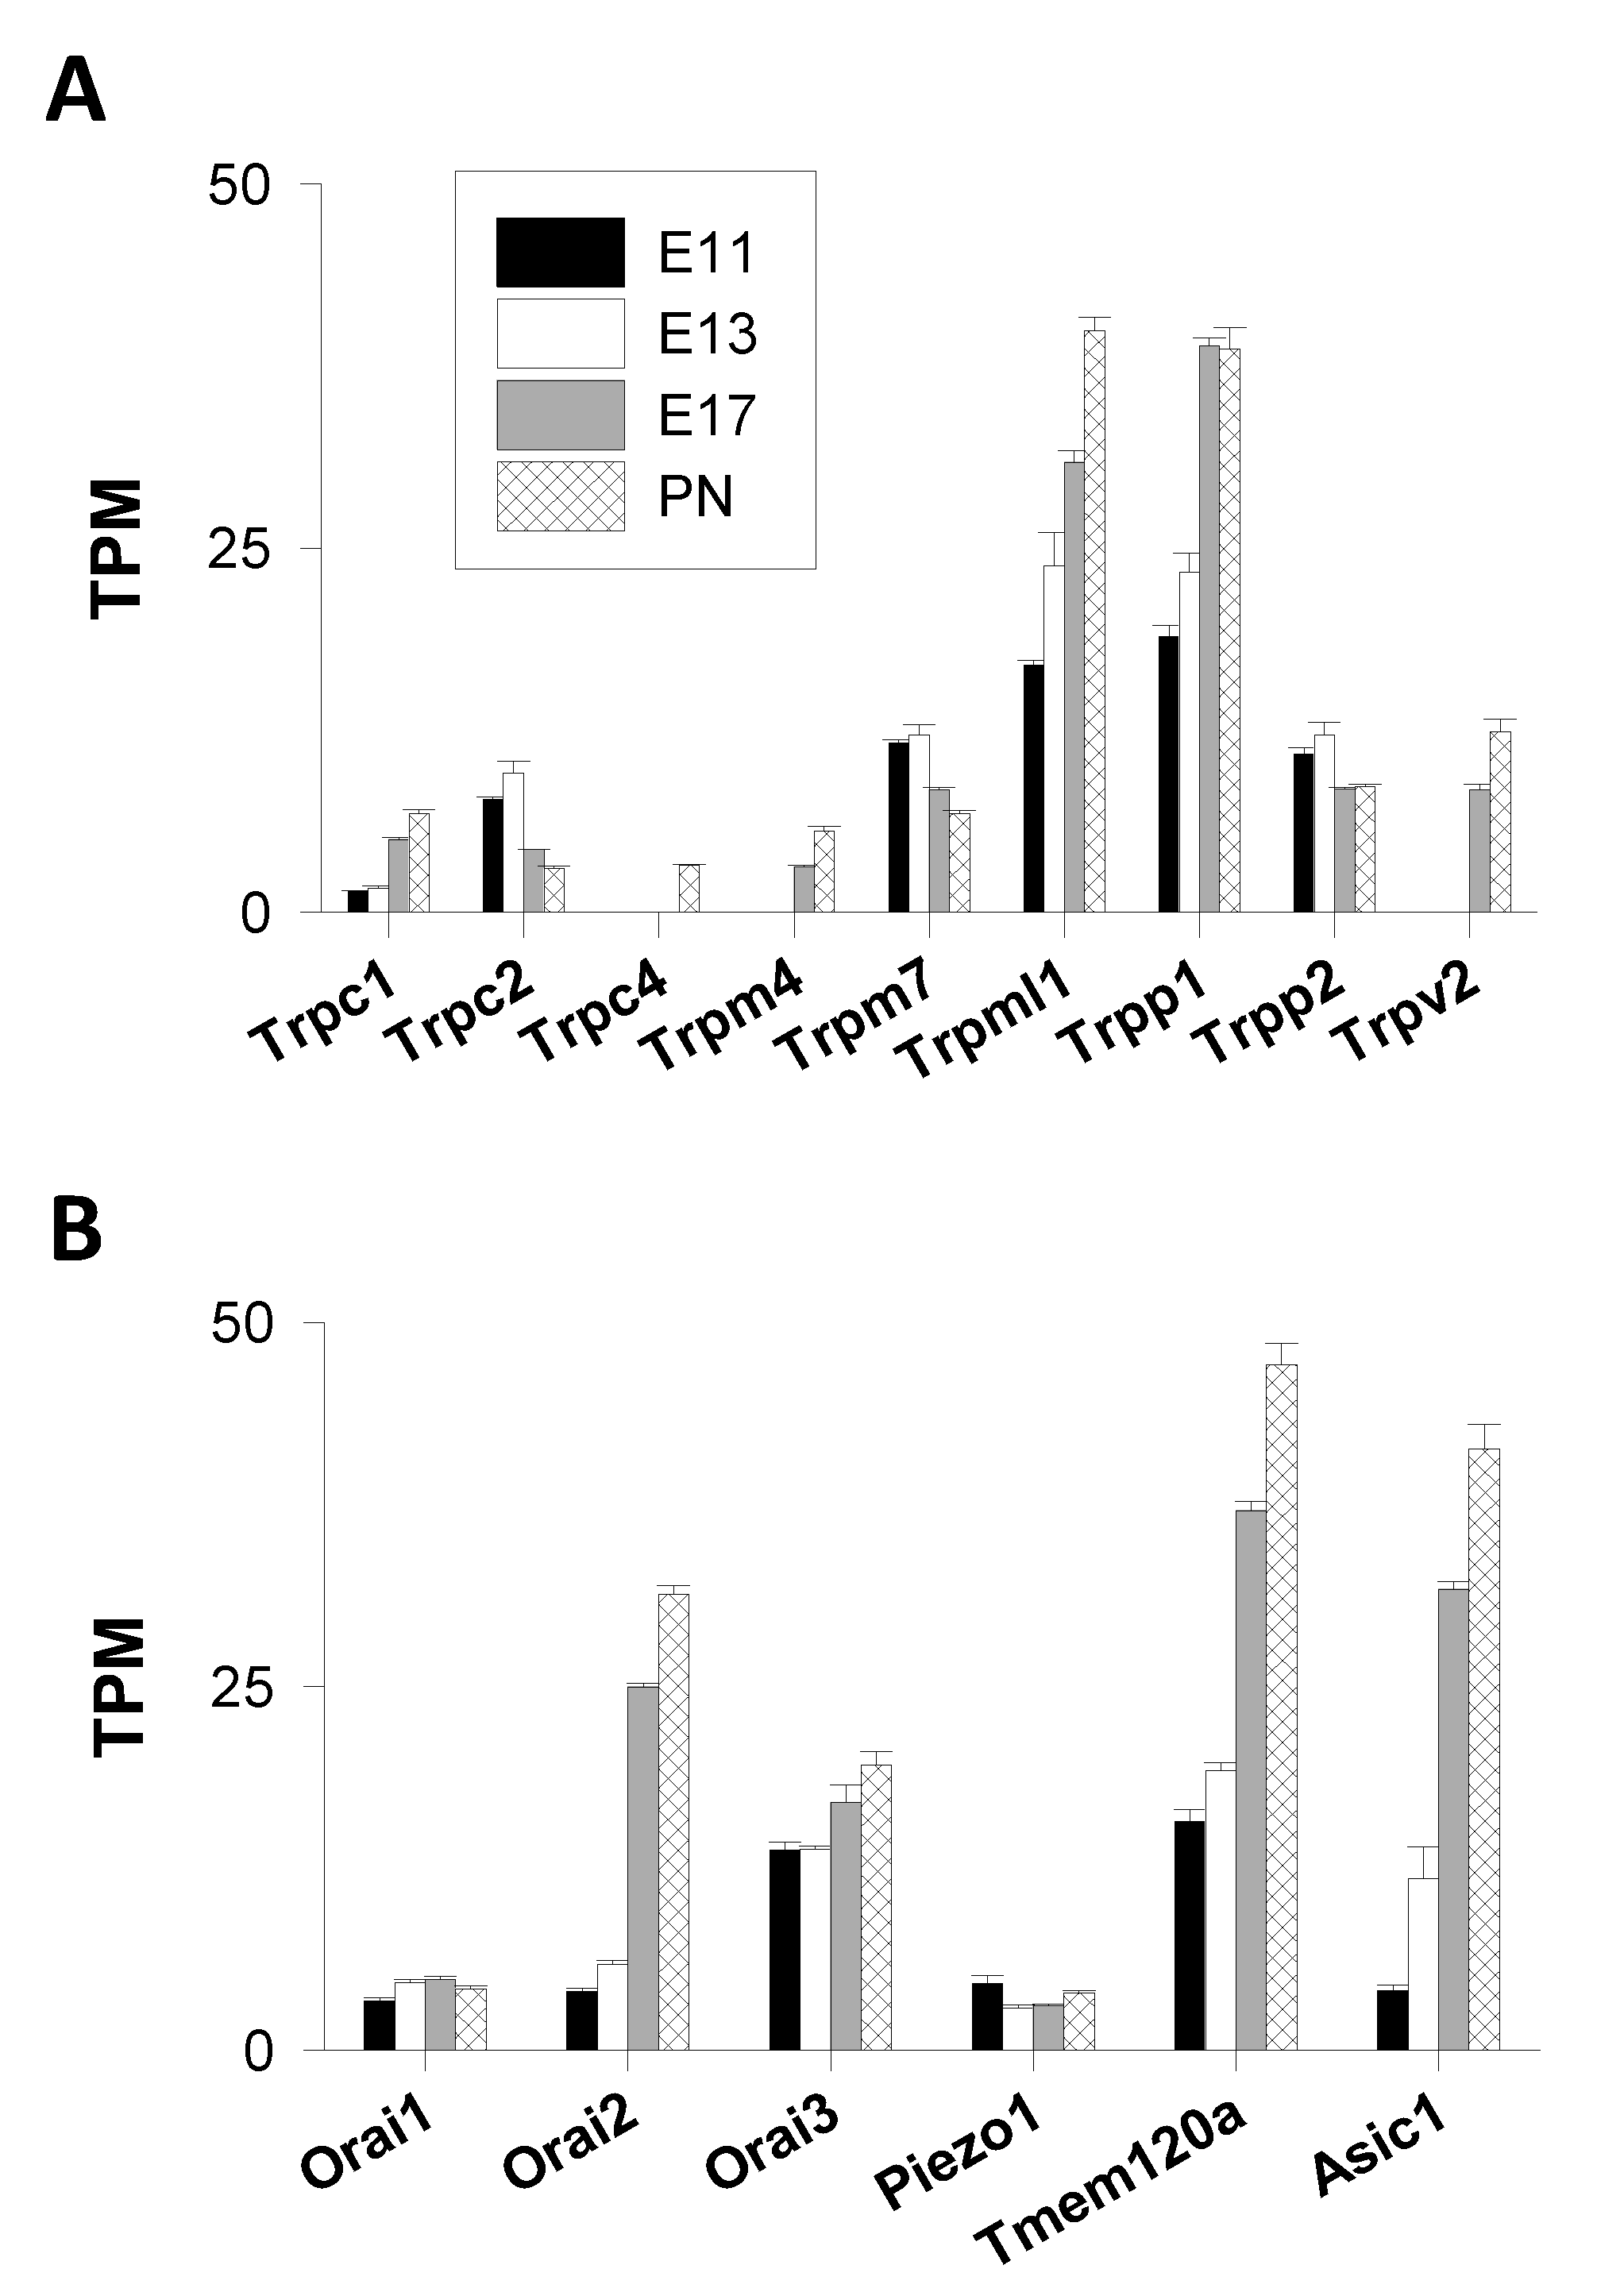
Transient Receptor Potential (TRP) Channels

Mammalian TRP channels form a large superfamily of cation channels that is divided into six subfamilies: TRPA (ankyrin), TRPC (canonical), TRPM (melastatin), TRPML (mucolipin), TRPP (polycystin), and TRPV (vanilloid) [31,32]. The expression of 28 TRP channel genes was analyzed. Apart from TRPV5 and TRPV6, two highly Ca2+-selective permeable TRP channels, most TRP channels are non-selective cation channels that are permeable to Na+ and Ca2+ ions, with the exception of TRPM4 and TRPM5, which are Ca2+-impermeable [33].
  • TRPA Channels
This subgroup of TRP channels is restricted to one member—TRPA1, but no transcript of the Trpa1 gene could be detected.
2.
TRPC Channels
Three Trpc genes (Trpc1, Trpc2, and Trpc4) out of seven were found to be expressed but at very low levels (TPM values < 10). Transcripts of Trpc1 and Trpc4 were present at the end of corticogenesis, whereas the Trpc2 gene was expressed throughout cortical development. However, the Trpc2 mRNA abundance peaked at E13 and then declined at later stages, indicating a repression of the expression of the Trpc2 gene (Figure 2A).
3.
TRPM Channels
Two Trpm genes (out of eight) were expressed: Trpm7 and Trpm4. The latter codes for a Ca2+-impermeable channel [33] and was thus excluded from the analysis. The expression of the Trpm7 gene was repressed during corticogenesis with TPM values declining from ≈11 at E11 to ≈6 at PN1 (Figure 2A).
4.
TRPML Channels
High levels of Trpml1 mRNAs were observed, and their abundance was augmented throughout corticogenesis (from 17 to 40 TPM) (Figure 2A). With TPM values < 2, the other Trpml genes (Trpml2–3) did not appear to be expressed.
5.
TRPP Channels
The expression of the following Trpp genes was analyzed: Trpp1 (Pkd1, polycystin 1 or PC1), Trpp2 (Pkd2 or polycystin 2), Trpp3 (PKD2L1), and Trpp5 (PKD2L2). Only two Trpp genes had TPM values > 2: Trpp1 and -2. They exhibited distinct regulation patterns—Trpp1 expression was induced, whereas Trpp2 expression was slightly repressed during corticogenesis (Figure 2A). For all time points considered, Trpp1 mRNAs predominated over Trpp2 mRNAs. The Trpp1 gene (Pkd1) encodes a plasma membrane protein (named TRPP1 or PC1) that is not regarded as an ion channel per se [34]. TRPP1 is rather a component of a receptor–ion channel complex comprising TRPP2, a non-selective Ca2+-conducting cation channel [35].
6.
TRPV Channels
Trpv2 was the only Trpv gene expressed, but not before E17, indicating an induction of the gene expression at late stages of corticogenesis (Figure 2A). The TPM values of Trpv2 were comparable to Trpm7 and Trpp2 (around 10 TPM). As no other Trpv transcripts were found, TRPV2 is likely to form homomultimeric channels in the cortex, which is in agreement with previous data [36].
Only four Trp channel genes displayed TPM values > 2 at the beginning of corticogenesis (E11–E13): Trpml1, Trpp2, Trpm7, and Trpc2. The other Trp members had TPM values < 2, a finding consistent with the notion that most Trp channel transcripts are present at low levels in many organs [37]. Transcripts of Trpc1 and Trpv2 could be quantified at the end of corticogenesis (E17) whereas Trpc4 transcripts were noticeable only postnatally. Previous studies addressed the question of the expression of murine Trp channel genes but focused on a specific subset of genes, without considering, for instance, the TRPP and TRPML channel subfamilies [37,38]. Here, all mammalian TRP subfamilies were analyzed. This provides a clearer picture of the Trp gene expression profile during murine corticogenesis.
TRPML1 is an endo/lysosomal channel ubiquitously expressed and permeable to cations. This channel plays crucial roles in intracellular trafficking and membrane fusion/fission. Mutations in the Trpml1 gene are associated with a childhood neurodegenerative lysosomal storage disorder known as mucolipidosis type IV [39,40]. Trpml1 is the major Trp gene expressed in the murine cortex with TPM values two to three times larger than those of the other TRP members. Its gene expression is positively regulated from E11 to PN1.
Like TRPML1, TRPP2 (Pkd2) is also an intracellular non-selective Ca2+-permeable channel but is primarily located in the endoplasmic reticulum (ER). Found in primary cilia, TRPP2 appears to play a critical role in organ morphogenesis, required for the left–right body axis formation [35]. TRPP2 has been described as a mechanosensitive channel, and mutations in the human Trpp2 gene are associated with an autosomal dominant polycystic kidney disease. However, its roles in brain cells are unclear. This study uncovered that Trpml1 and Trpp2 were the two most highly expressed Trp channel genes. In addition, Trpm7 was also one of the most prominent Trp genes (Figure 2A), which is in agreement with previous reports [37,38].
Trpv transcripts appeared at later stages, with Trpv2 being one of the most expressed Trp genes at the end of corticogenesis (E17 and PN1). Several functions were ascribed to TRPV2, including noxious heat sensing and osmo- and chemo-sensation. However, the physiological roles, as well as the mechanism of activation, of native TRPV2 channels in the brain are still largely unknown. TRPV2 is expressed by astrocytes, and Ca2+ entry through TRPV2 was proposed as playing a role in neurite outgrowth [36].
Concerning Trpc, genes were expressed either at early stages (E11 and 13) or postnatally (at PN1), with a shift in the gene expression pattern—Trpc2 predominated early on, whereas Trpc1 was the predominant Trpc member at later stages. Ca2+ entry through TRPC channels was proposed as participating in various aspects of neuronal development, such as neuronal survival or synaptogenesis [41]. TRPC2 was originally described as a diacylglycerol-activated channel that is highly expressed in vomeronasal sensory neurons, playing a role in pheromone detection in mice [42]. Unexpectedly, Trpc2 was identified as the most expressed Trpc gene at the onset of corticogenesis, with a marked repression of its expression after E17. Whether TRPC2 channels are involved in corticogenesis is unknown. TRPC1, the founding member of the TRPC subfamily, has a broad tissue expression. TRPC1 appears to form heteromultimeric complexes comprising other TRP proteins (TRPC4/5, TRPV4/6, and TRPP1) or stromal interaction molecule 1(STIM1). However, studies aiming at understanding its role in cellular Ca2+ signaling have raised much debate and therefore the functions of TRPC1 proteins remain elusive. The expression of the Trpc1 gene was induced at the end of corticogenesis.

Orai Channels

Orai are highly selective plasma membrane Ca2+ channels [43,44]. Orai3 was the major Orai gene at E11 with mRNA levels that remained nearly constant during corticogenesis. The Orai2 gene was the most upregulated Orai gene (the TPM values increased by a factor ≈8 between E11 and PN1), as well as the predominantly expressed Orai gene at the end of corticogenesis and postnatally (with ≈30 TPM at PN1). This result is consistent with the view that Orai2 is a major Orai channel in cells of the neural system, at least in the cerebral cortex [45,46]. Conversely, Orai1, with TPM values <5, had the weakest mRNA level at each time point (Figure 2B). The expression of Orai1 was not developmentally regulated.

Stretch-Activated Channels

This family comprises two members: Piezo1 and -2 [47]. Only the Piezo1 gene was expressed with TPM values of 3–4 throughout corticogenesis, indicating no developmental regulation in its expression (Figure 2B). Mechanosensitive Piezo1 channels were shown to play a role in axon growth in the developing brain [48]. TACAN (or Tmem120A) is a recently identified mechanosensitive ion channel permeable to Ca2+ [49]. It is highly expressed in the sensory neurons of the dorsal root ganglia but RNA-Seq analysis showed that it was also present in the immature cerebral cortex. The expression of the gene was strongly upregulated—the number of TPM increased from 14 to 37 between E11 and E17, a 2.6-fold increase in transcript abundance (Figure 2B). The exact contribution of TACAN in Ca2+ signaling is unknown; however, the high expression of the Tmem120A gene indicates that mechanical forces, via mechanosensitive channels, could play a role in the growth, migration, and/or differentiation of cortical cells.

Acid-Sensing Ion Channels (ASIC)

Channels of the ASIC family are proton-gated channels. Six members are known in rodents (ASIC1–6). They form Na+- and K+-conducting ion channels, apart from homomeric ASIC1a, which displays a low permeability for Ca2+ [50]. Interestingly, the Asic1 gene was the only Asic gene expressed during corticogenesis. A 10-fold increase in its TPM values was noted, increasing from 4 (at E11) to 41 TPM (at PN1) (Figure 2B). Therefore, the expression of this gene was strongly upregulated. The other Asic genes were not expressed (TPM values < 2), except for Asic4, which was detected at PN1 only (with TPM values of 3), indicating that the expression of this gene was induced postnatally (not shown). ASIC1 channels are present in central nervous system neurons with high levels of ASIC1 proteins in the hippocampal and cortical regions of mice brains [51]. Activation of ASIC1 causes an intracellular Ca2+ rise in cultured embryonic cortical neurons [52]. ASIC1 participates in the central treatment of noxious messages [51]. This protein is involved in synaptic plasticity as its loss impairs hippocampal long-term potentiation and learning tasks [53,54]. In vitro data indicated that ASIC1-dependent currents were developmentally regulated during the maturation of cortical neurons, with a decrease in their Ca2+ permeability [52].
The following two chapters (I.1.7 and I.1.8) cover the expression of genes encoding intracellular Ca2+-conducting channels.

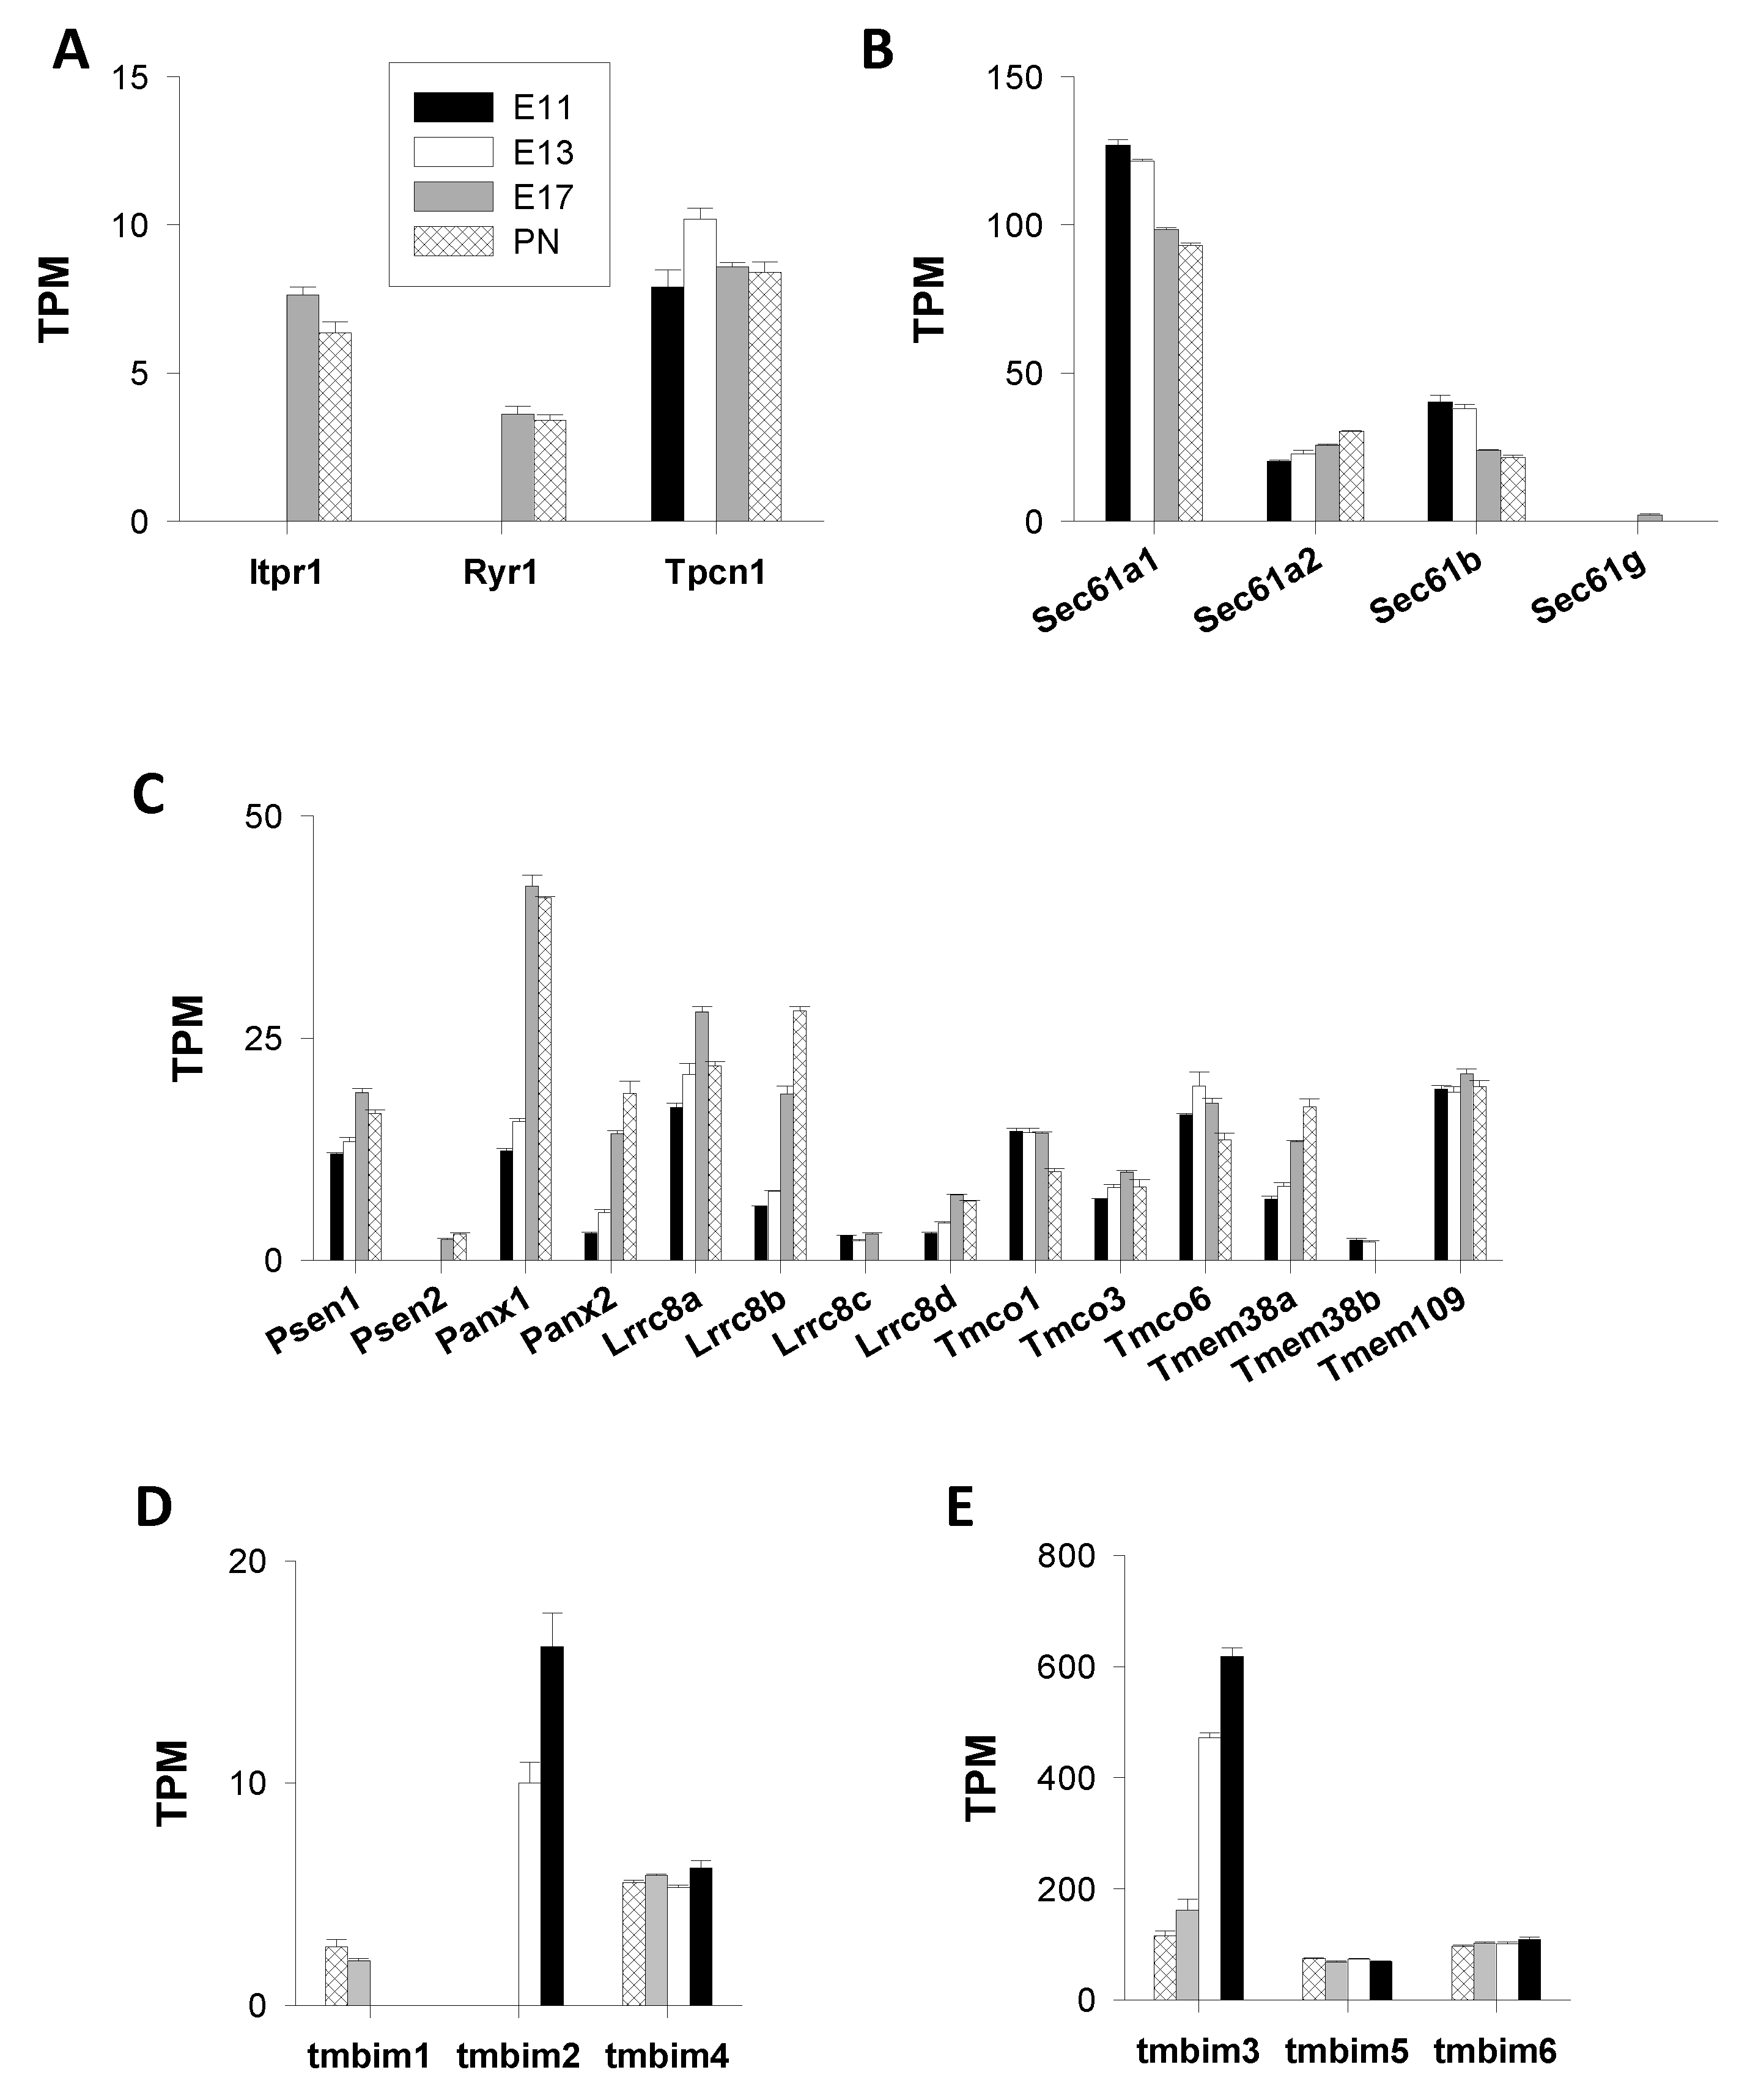
Inositol 1,4,5-Trisphosphate and Ryanodine Receptors (IP3R, RyR), and Two-Pore Channels (TPC)

The genes Itpr1–3, Ryr1–2, and Tpcn1–2 code for inositol 1,4,5-trisphosphate receptors (IP3R1–3), ryanodine receptors (RyR1–2), and two-pore channels (TPC), respectively. These proteins constitute three important families of intracellular Ca2+ channels that are mainly found in the ER (IP3R and RyR) and endo/lysosomes (TPC). The RNA-Seq data showed that Tpcn1 was the most expressed gene, with a peak in its mRNA abundance at E13 (Figure 3A). No other gene of this subgroup was expressed at E11–E13. TPCs are principally found in the membrane of acidic compartments, such as endo-lysosomes where they appear to function as regulators of vesicle fusion [55]. The expression of Itpr1–3 and Ryr1–2 was increased at later stages, notably Itpr1 (IP3R1) and (RyR1) with TPM values of ≈8 and ≈4 at PN1, respectively (Figure 3A). Of note, genes coding for the organellar Ca2+ channels IP3R, RyR, and TPC had TPM values far below those of the plasmalemmal Ca2+ channel genes described in the previous paragraphs.

Intracellular “leak Channels”

The pharmacological blockade of sarco/endoplasmic reticulum Ca2+ ATPases (SERCA) (see below, paragraph I.2 “Ca2+ ATPases”) initiates a passive release of Ca2+ mediated by so-called “leak channels” that appear to be molecularly distinct from the classical ER Ca2+ channels (e.g., IP3R and RyR) (but see [56]). Thus far, many putative candidates have been postulated, including translocons, pannexins, leucine-rich repeat-containing 8 (LRRC8), mitsugumin 23 (MG23), presenilin [57], TRPC1 [58], Orai3 [59], and members of the Bax inhibitor-1 motif containing (TMBIM) protein family [60]. Here, the following gene transcripts were considered:
  • Translocons
Translocons are protein complexes forming pores that allow the translocation of polypeptides across membranes. The functional core of mammalian translocons involves Sec61 proteins [61]. These can mediate ER Ca2+ release, making Ca2+ leak channels ubiquitous, particularly Sec61A1 [62,63]. The following Sec61 transcripts were analyzed: Sec61a1–a2, Sec61b, and Sec61g. Sec61a1 was the major Sec61 gene with a high abundance of transcripts (TPM values >90). Interestingly, the expression of Sec61a1 was repressed with TPM values diminishing from 127 (at E11) to 93 TPM (at PN1). A similar trend was observed for the less-expressed gene Sec61b, with TPM values declining from 40 to 22 (Figure 3B). Conversely, Sec61a2, although less expressed, was positively regulated (from 20 to 30 TPM). The expression of Sec61g was detected only at PN1 (Figure 3B). For the sake of clarity, the analysis of the other putative leak channel genes is shown in a distinct graph because the TPM values were much smaller, ranging from 2 to 40 (see Figure 3C).
2.
Presenilins
Presenilins are ER proteins that are suggested to contribute to ER Ca2+ leak channels [64]. This view has, however, been challenged by [65], who found no evidence for a role of presenilins in ER Ca2+ leak channels. The primarily expressed presenilin gene was Psen1 (Figure 3C). The abundance of transcripts in the cortical wall raised by ≈50% during corticogenesis (from ≈12 TPM at E11 to ≈19 TPM at E17). The presenilin 2 gene (Psen2) was weakly expressed, and Psen2 transcripts were detected only at E17 and PN1 (Figure 3C).
3.
Pannexins
The family of pannexin channels comprises three members (Panx1-3) [66,67]. Two genes (Panx1 and Panx2) were expressed and the abundance of the transcripts increased throughout corticogenesis, with Panx1 being the predominant pannexin gene at all ages. The expression of Panx1 was upregulated after E13, where the TPM values increased from 15 (at E13) to 42 (at PN1), which corresponds to a ≈3.5-fold increase (Figure 3C). The expression of the minor Panx2 gene was further stimulated as the TPM values increased from 3 to 18, reflecting an approximate sixfold augmentation.
4.
LRRC8
Pannexins have significant sequence similarity with leucine-rich repeat-containing 8 (LRRC8) proteins. Among the five LRRC8 proteins known thus far, one of them (LRRC8B) behaves as a Ca2+ leak channel [68]. The analysis of the abundance of the transcripts of the five Lrrc8 genes (Lrrca to Lrrce) indicated that Lrrc8a was the most expressed Lrrc gene throughout corticogenesis; however, Lrrc8b, displaying higher TPM values at E17 and PN1, exhibited strong developmental regulation as its mRNA abundance increased approximately fivefold between E11 (≈6 TPM) and PN1 (≈28 TPM) (Figure 3C). This regulation pattern displayed some similarities with Panx2. Collectively, Lrrc8b transcripts were less abundant than Panx1 transcripts.
5.
TMCO1
The transmembrane and coiled-coil domains 1 (Tmco1) gene encodes a channel (TMCO1) preventing ER Ca2+ overload [69]. In the Tmco gene family, three members dominated: Tmco6, Tmco1, and Tmco3 (Figure 3C). Their levels of transcripts varied weakly during corticogenesis. The other Tmco genes did not appear to be expressed.
6.
TRIC
Two subtypes of trimeric intracellular cation channels (TRIC) are known: TRIC-A and -B, deriving from distinct genes (Tmem38a–b). Recent studies identified TRICA–B proteins as central actors controlling the release of Ca2+ out of the ER [57,70]. Figure 3C shows that Tmem38a was the most highly expressed Tmem38 gene throughout corticogenesis with TPM values increasing from ≈7 to 17. Transcripts of the minor Tmem38b gene were found principally at the beginning of corticogenesis (E11–E13) and then declined (Figure 3C). TRIC-A has been shown to co-cluster with STIM1/Orai1 proteins and functions as negative modulator of store-operated Ca channels and oscillatory Ca2+ signals [71].
7.
Mitsugumin23
This protein, localized in intracellular membranes, was proposed to participate in the ER Ca2+ release [72]. Transcripts of the gene (also named transmembrane protein 109 or Tmem109) were found at all time points with TPM values of 19–20; however, no developmental regulation was noticed (Figure 3C).
8.
Bax Inhibitor-1 Motif-Containing (TMBIM) Proteins
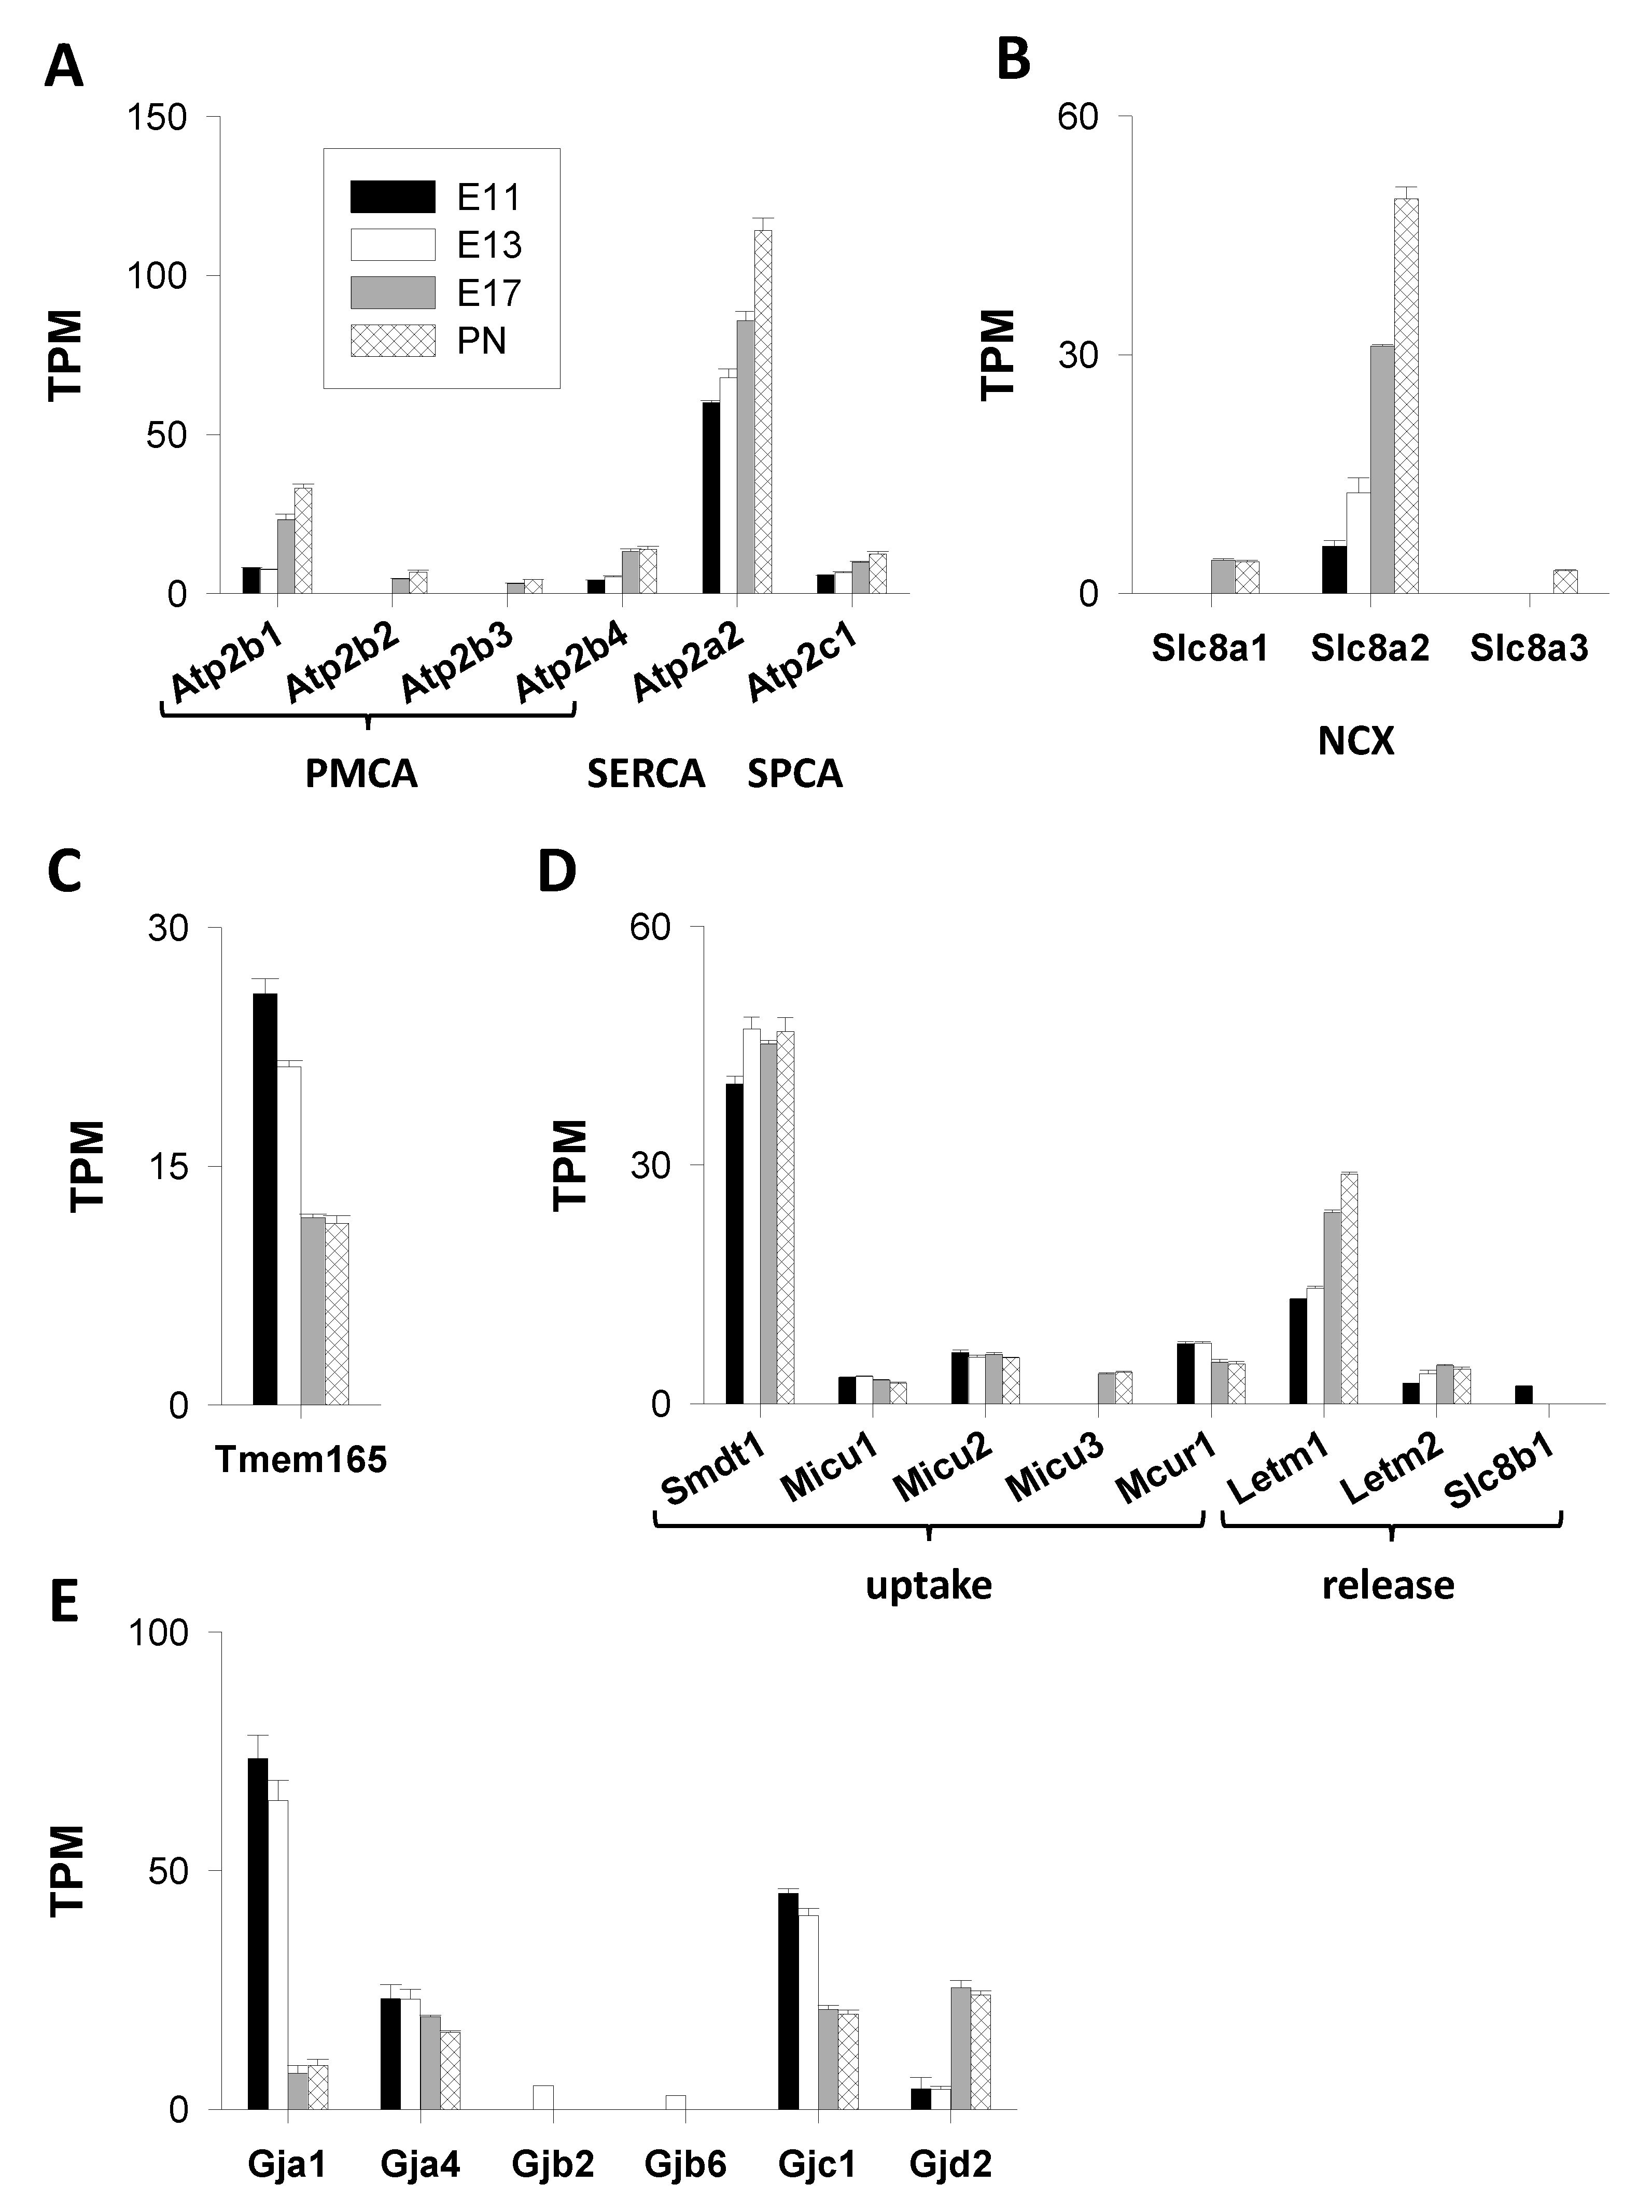
Members of the Bax inhibitor-1 motif-containing (TMBIM) protein family are important regulators of intracellular Ca2+ homeostasis. They have been suggested to form Ca2+ leak channels of the ER [60,73]. The expression of the six known genes (Tmbim1–6) is given in Figure 3D,E. Tmbim3 and Tmbim5–6 were the most expressed genes; however, they displayed distinct expression patterns—Tmbim5–6 expression was constant whereas Tmbim3 was strongly upregulated with a marked increase at the end of corticogenesis (E17).
Overall, Tmbim3 and Tmbim5–6 were, far behind Sec61a1, the most strongly expressed genes coding for putative intracellular Ca2+ leak channels.

3.1.2. Ca2+ ATPases

The group of Ca2+ ATPases encompasses diverse types of pumps with distinct subcellular localizations and pharmacological properties [74]. Plasma membrane Ca2+ ATPases (PMCA) are encoded by four genes (Atp2b1–4). The RNA-seq data showed that Atp2b1 (encoding PMCA1) was the major PMCA gene, followed by Atp2b4 (PMCA4). Transcripts of Atp2b1 and Atp2b4 (PMCA4) were detected at each age and their abundance increased during development, particularly at E17. The expression of these two PMCA genes was thus positively regulated at later stages of cortical formation. This was also the case of the minor Atp2b2 and Atp2b3 genes encoding PMCA2 and PMCA3, whose expression was not detected at early ages (E11–E13) (Figure 4A).
Intracellular Ca2+ pumps are derived from two gene families: Atp2c (Atp2c1–c2) and Atp2a (Atp2a1–a3), encoding Ca2+ ATPases of the Golgi network (secretory pathway Ca2+-ATPase or SPCA1–2) and of the sarco/endoplasmic reticulum (SERCA1–3), respectively [74]. The Atp2a2 gene, encoding SERCA2, was by far the main actor. In addition to SERCA genes, only one gene encoding SPCA was expressed—Atp2c1. This mRNA expression profile was comparable to that of Atp2b4 (PMCA4). A general feature of these Ca2+ ATPase genes (PMCA, SPCA, and SERCA) is the enhancement of their expression throughout corticogenesis. The most induced gene was Atp2b1 (PMCA1) with mRNA levels increasing by a factor of around four from E11 to PN1 (Figure 4A).

3.1.3. Exchangers

The Slc8a1-a3 and Slc24a1-a5 genes encode the non-mitochondrial Na+/Ca2+ (NCX) and Na+/Ca2+/K+ (NCKX) exchangers. As shown in Figure 4B, only Slc8a genes were expressed, with Slc8a2, coding for NCX2, being by far the major Ncx gene. Its expression increased steadily from ≈6 to ≈50 TPM, revealing a greater than eightfold rise in transcript abundance between E11 and PN1. At E19, virtually all cortical neurons displayed a functional NCX mechanism but not glial progenitors [75]. This finding likely explains the strong induction of the Slc8a2 gene after E13 where the neurons outnumbered the progenitor cells. It has been proposed that, during cortical development, NCX activity may play an important role in Ca2+ homeostasis of differentiating neurons but not in glial progenitor cells [75]. The Slc8a1 and Slc8a3 genes were much less expressed, with transcripts detected solely at the end of corticogenesis (Figure 4B).

3.1.4. Cation Antiporter

Although detected in endosomes, lysosomes, and at the cell surface, the transmembrane protein 165 (TMEM165) is described as a Golgi-localized protein and thought to function as a putative cation (Ca2+/H+) antiporter. Recent data demonstrated that TMEM165 can transport ions, such as Ca2+ and Mn2+, that are required for protein glycosylation [76,77]. Transcripts of the Tmem165 gene were found at all time points (Figure 4C). They were more abundant at the onset of neuro-corticogenesis with TPM values of >20 at E11–E13, declining thereafter to 11 at E17–PN1. This indicates that, at embryonic ages corresponding to important sequences of cell division and neurogenesis (such as E11–E13), which are associated with important phases of synthesis and post-translation modifications (such as glycosylation) of proteins, there is a substantial need for Ca2+ in the Golgi apparatus.

3.1.5. Mitochondrial Actors (Figure 4D)

This section covers the actors participating in mitochondrial Ca2+ uptake and release.

Mitochondrial Ca2+ Uptake

The mitochondrial Ca2+ uniporter (MCU) is regarded as the primary entry route for Ca2+. MCU is a multi-molecular complex of the inner mitochondrial membrane that is highly selective for Ca2+. The core components consist of MCU, mitochondrial calcium uniporter dominant negative beta subunit (MCUb), and Emre (an essential MCU regulator), with MCU and MCUb being the pore-forming subunits. No transcripts of the Mcu and Mcub genes were detected (TPM < 2) but single-pass membrane protein with aspartate rich tail 1 Smdt1, the gene encoding for the non-pore-forming subunit Emre (important for the assembly and function of the MCU complex [78]), was highly expressed (with TPM values of 40–50) (Figure 4D). The Micu1–3 genes, encoding MICU1–3, three key regulators of the MCU complex [78], were, however, weakly expressed (TPM values of 5–6). Micu2 was the major Micu gene. Although its roles in MCU complex assembly and function remain unclear, MCUR1 appears to play a role in mitochondrial Ca2+ homeostasis [78]. Its gene (Mcur1) was also weakly expressed with TPM values of approximately 5–7. The expression of these mitochondrial genes was not developmentally regulated (Figure 4D).

Mitochondrial Ca2+ Release

Extrusion of Ca2+ from the mitochondrial matrix appeared to be achieved by the Na+/Ca2+/Li+ exchanger (NCLX), encoded by the Slc8b1 gene, distinct from the plasma membrane Na+/Ca2+ exchanger. Transcripts of this Slc8b1 gene were found exclusively at E11 (2 TPM) but not at later stages. The mitochondrial exchanger NCLX is thought to participate in Ca signaling. The failure to detect transcripts may be due to detection problems. Although this issue remains disputed [79], leucine zipper EF hand-containing transmembrane protein 1 (LETM1), a protein coded by the Letm1 gene, was identified as a putative mitochondrial H+/Ca2+ exchanger [80] that could extrude Ca2+ out of the mitochondria [81]. The expression of the Letm genes, Letm1 and Letm2, was analyzed. The abundance of transcripts increased after E13 and peaked at later ages. Overall, Letm1 was the primary gene, with TPM values increasing twofold between E13 and PN1 (from 13 to 29 TPM, respectively), pointing to a clear regulation of this gene during corticogenesis (Figure 4D). LETM1 maintains the mitochondrial osmotic balance [82]; however, its role in mitochondrial Ca2+ dynamics is not firmly established.

3.1.6. Connexins

Alongside channels, pumps, exchangers, and transporters, gap junctions formed by connexins participate in Ca2+ movements through membranes. They are, for instance, found in neuroblasts of the rodent ventricular zone, allowing the coupling between adjacent cells within a cluster [83]. In the embryonic brain, gap junctions are required for the occurrence of spontaneous cytosolic fluctuations [84]. The expression of the connexin genes is reported in Figure 4E. Out of the 21 connexin genes [85], only four were expressed at all ages (Gja1, Gja4, Gjc1, and Gjd2). They code for gap junction proteins alpha-1 (connexin 43 or CX43), alpha-4 (CX37), gamma-1 (CX45), and delta 2 (CX36), respectively. Gja1, the major connexin gene, was highly expressed at the beginning of corticogenesis (with TPM values of ≈75 at E11). As with Gja4 and Gjc1, Gja1 expression was repressed particularly after E13. TPM values decreased nearly eightfold between E11 and PN1.
The Gjd2 gene displayed a completely different expression pattern—weakly expressed at E11–E13, it became the major gene of this family at the end of corticogenesis (E17–PN1). The TPM values increased by a factor of six between E11 and PN1 (from 4 to 24 TPM) (Figure 4E). In addition, transcripts of two genes were detected at one age only (E13): Gjb2 and Gjb6 (gap junction proteins beta-2 and -6, CX26 and CX30, respectively). They had low TPM values (≈2–4). In terms of copy numbers, the Gja1 gene was expressed at a much higher level than any other plasma membrane actor, such as Cacna1g, Grik5, or Chrnb2. This highlights the key roles played by these gap junction-dependent Ca2+ signals during the early phases of cortical development [84,86]. These gap junctions are prominent structures of the ventricular zone at the beginning of neurogenesis. Hence, neurons uncouple from clusters of coupled cells while migrating out of the ventricular zone [83].

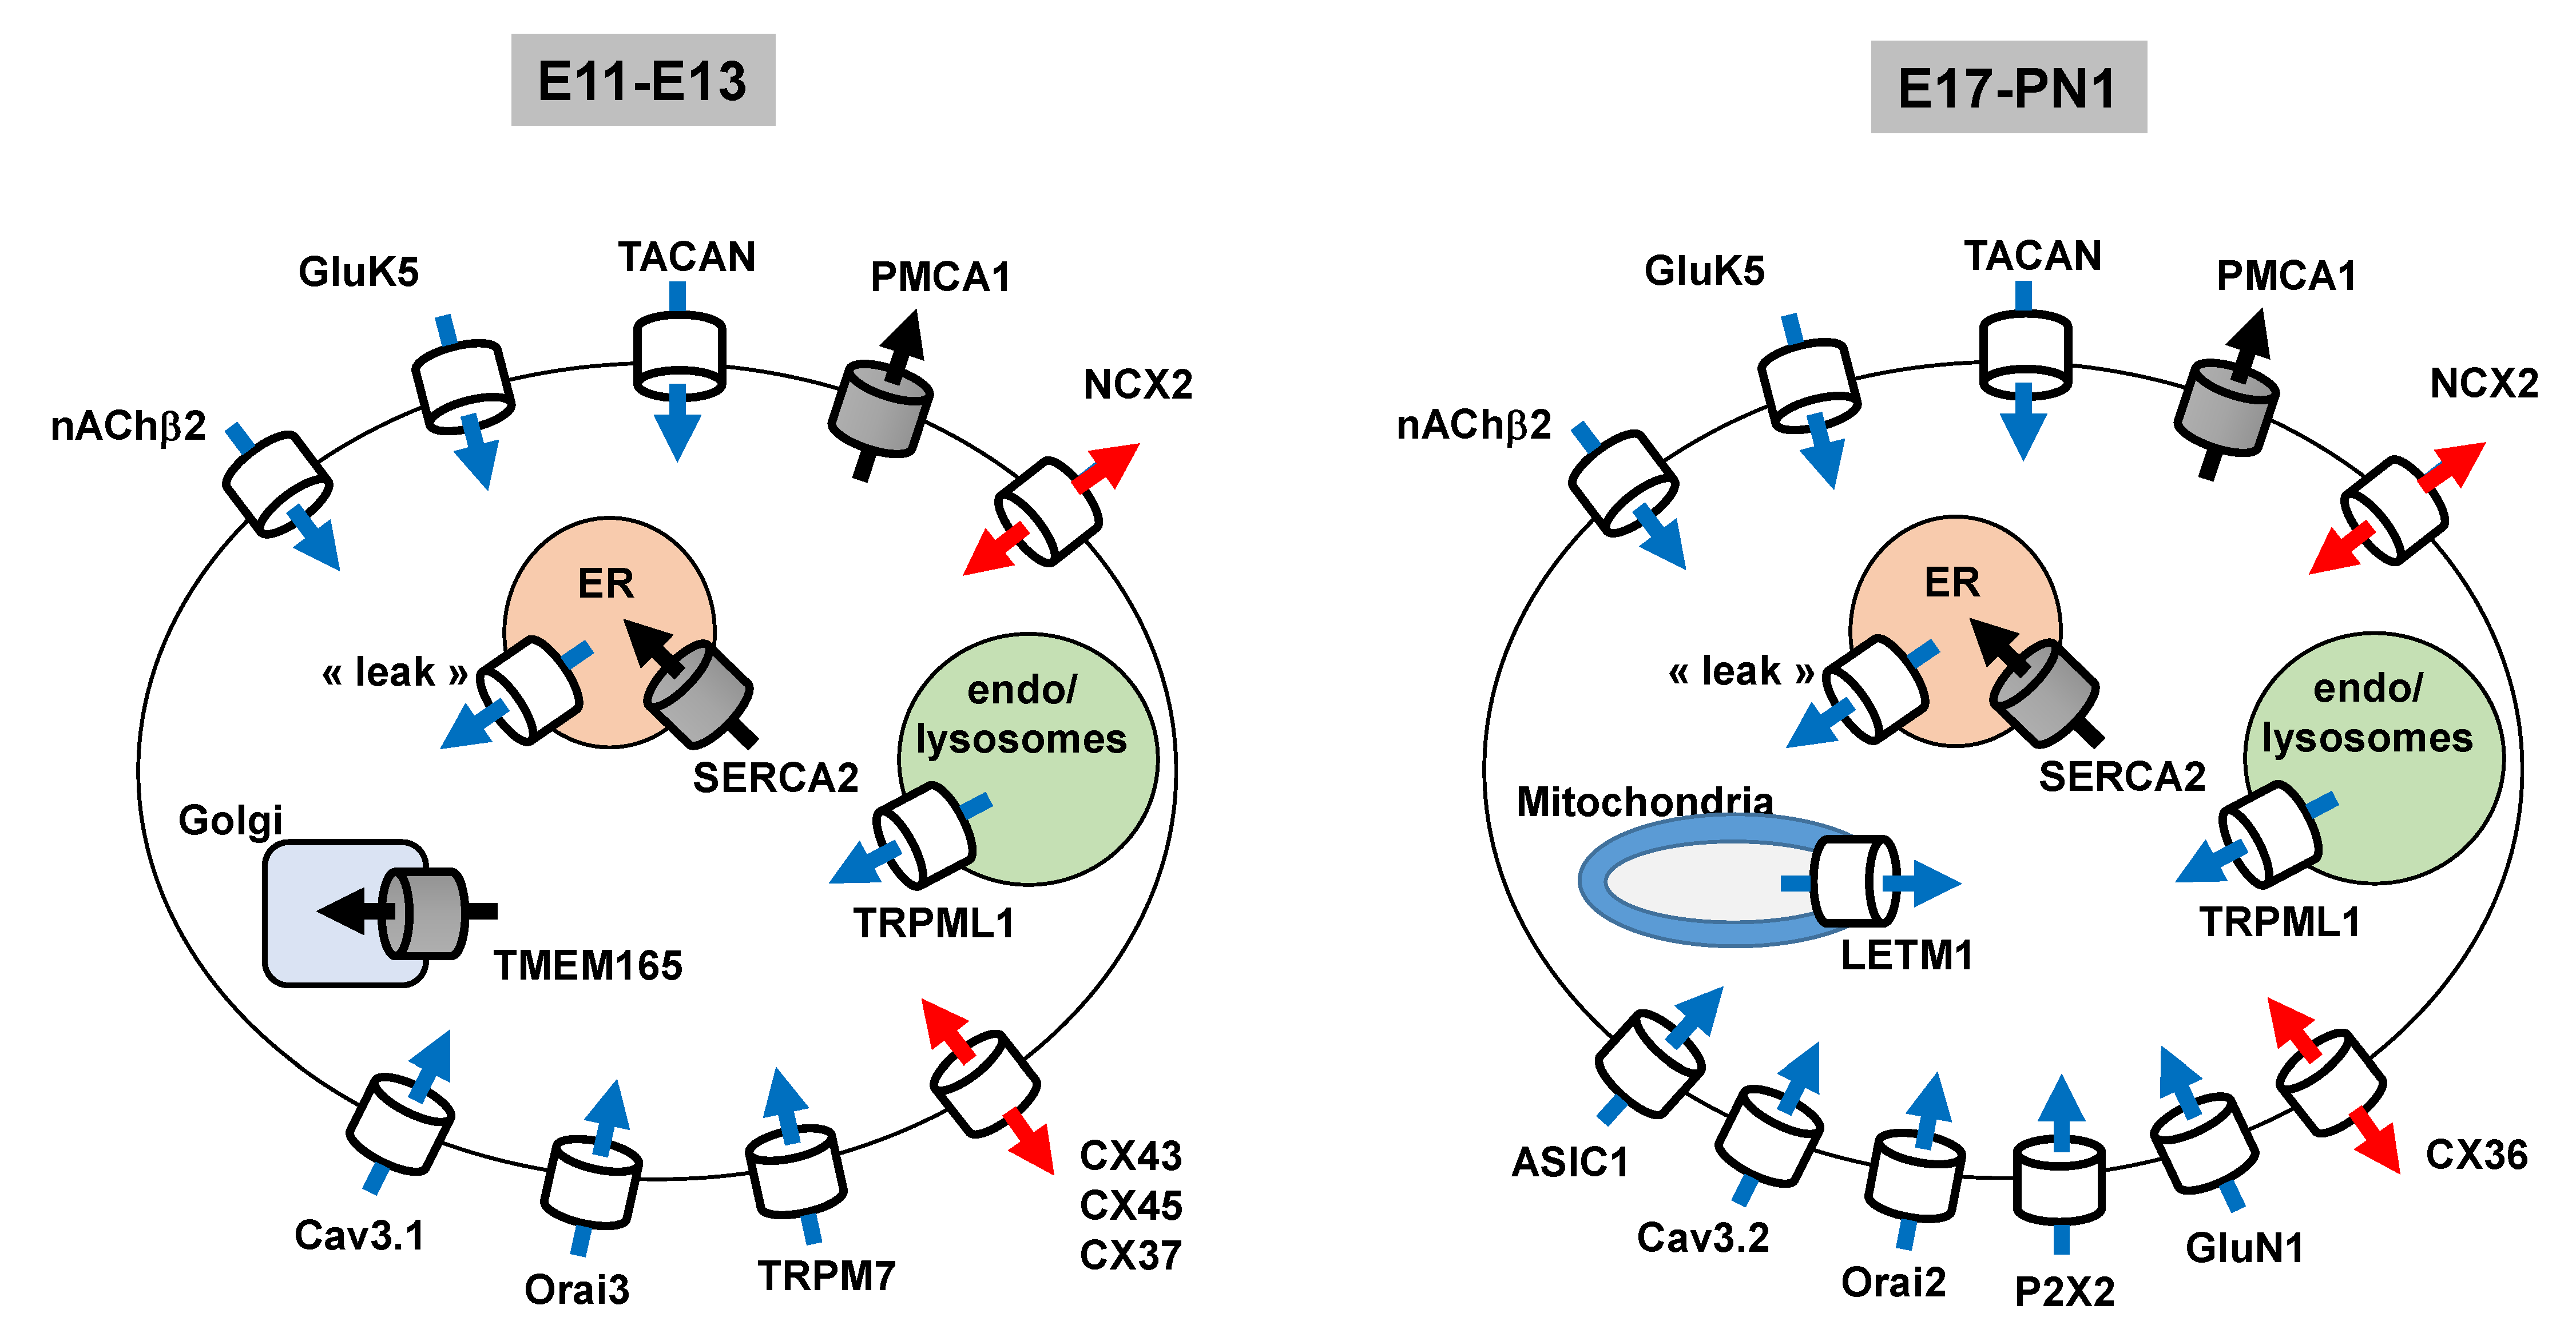
3.1.7. Expression Profile of The Main Ca2+ Transport Systems Throughout Corticogenesis

The 10 most abundant transcripts at each age (E11, E13, E17, and PN1) were examined. Table 1 and Table 2 give an overview of the top 10 genes coding for plasma membrane (Table 1) and intracellular (Table 2) Ca2+ transport systems. This provides an overview of the temporal pattern of the expression of the major genes.

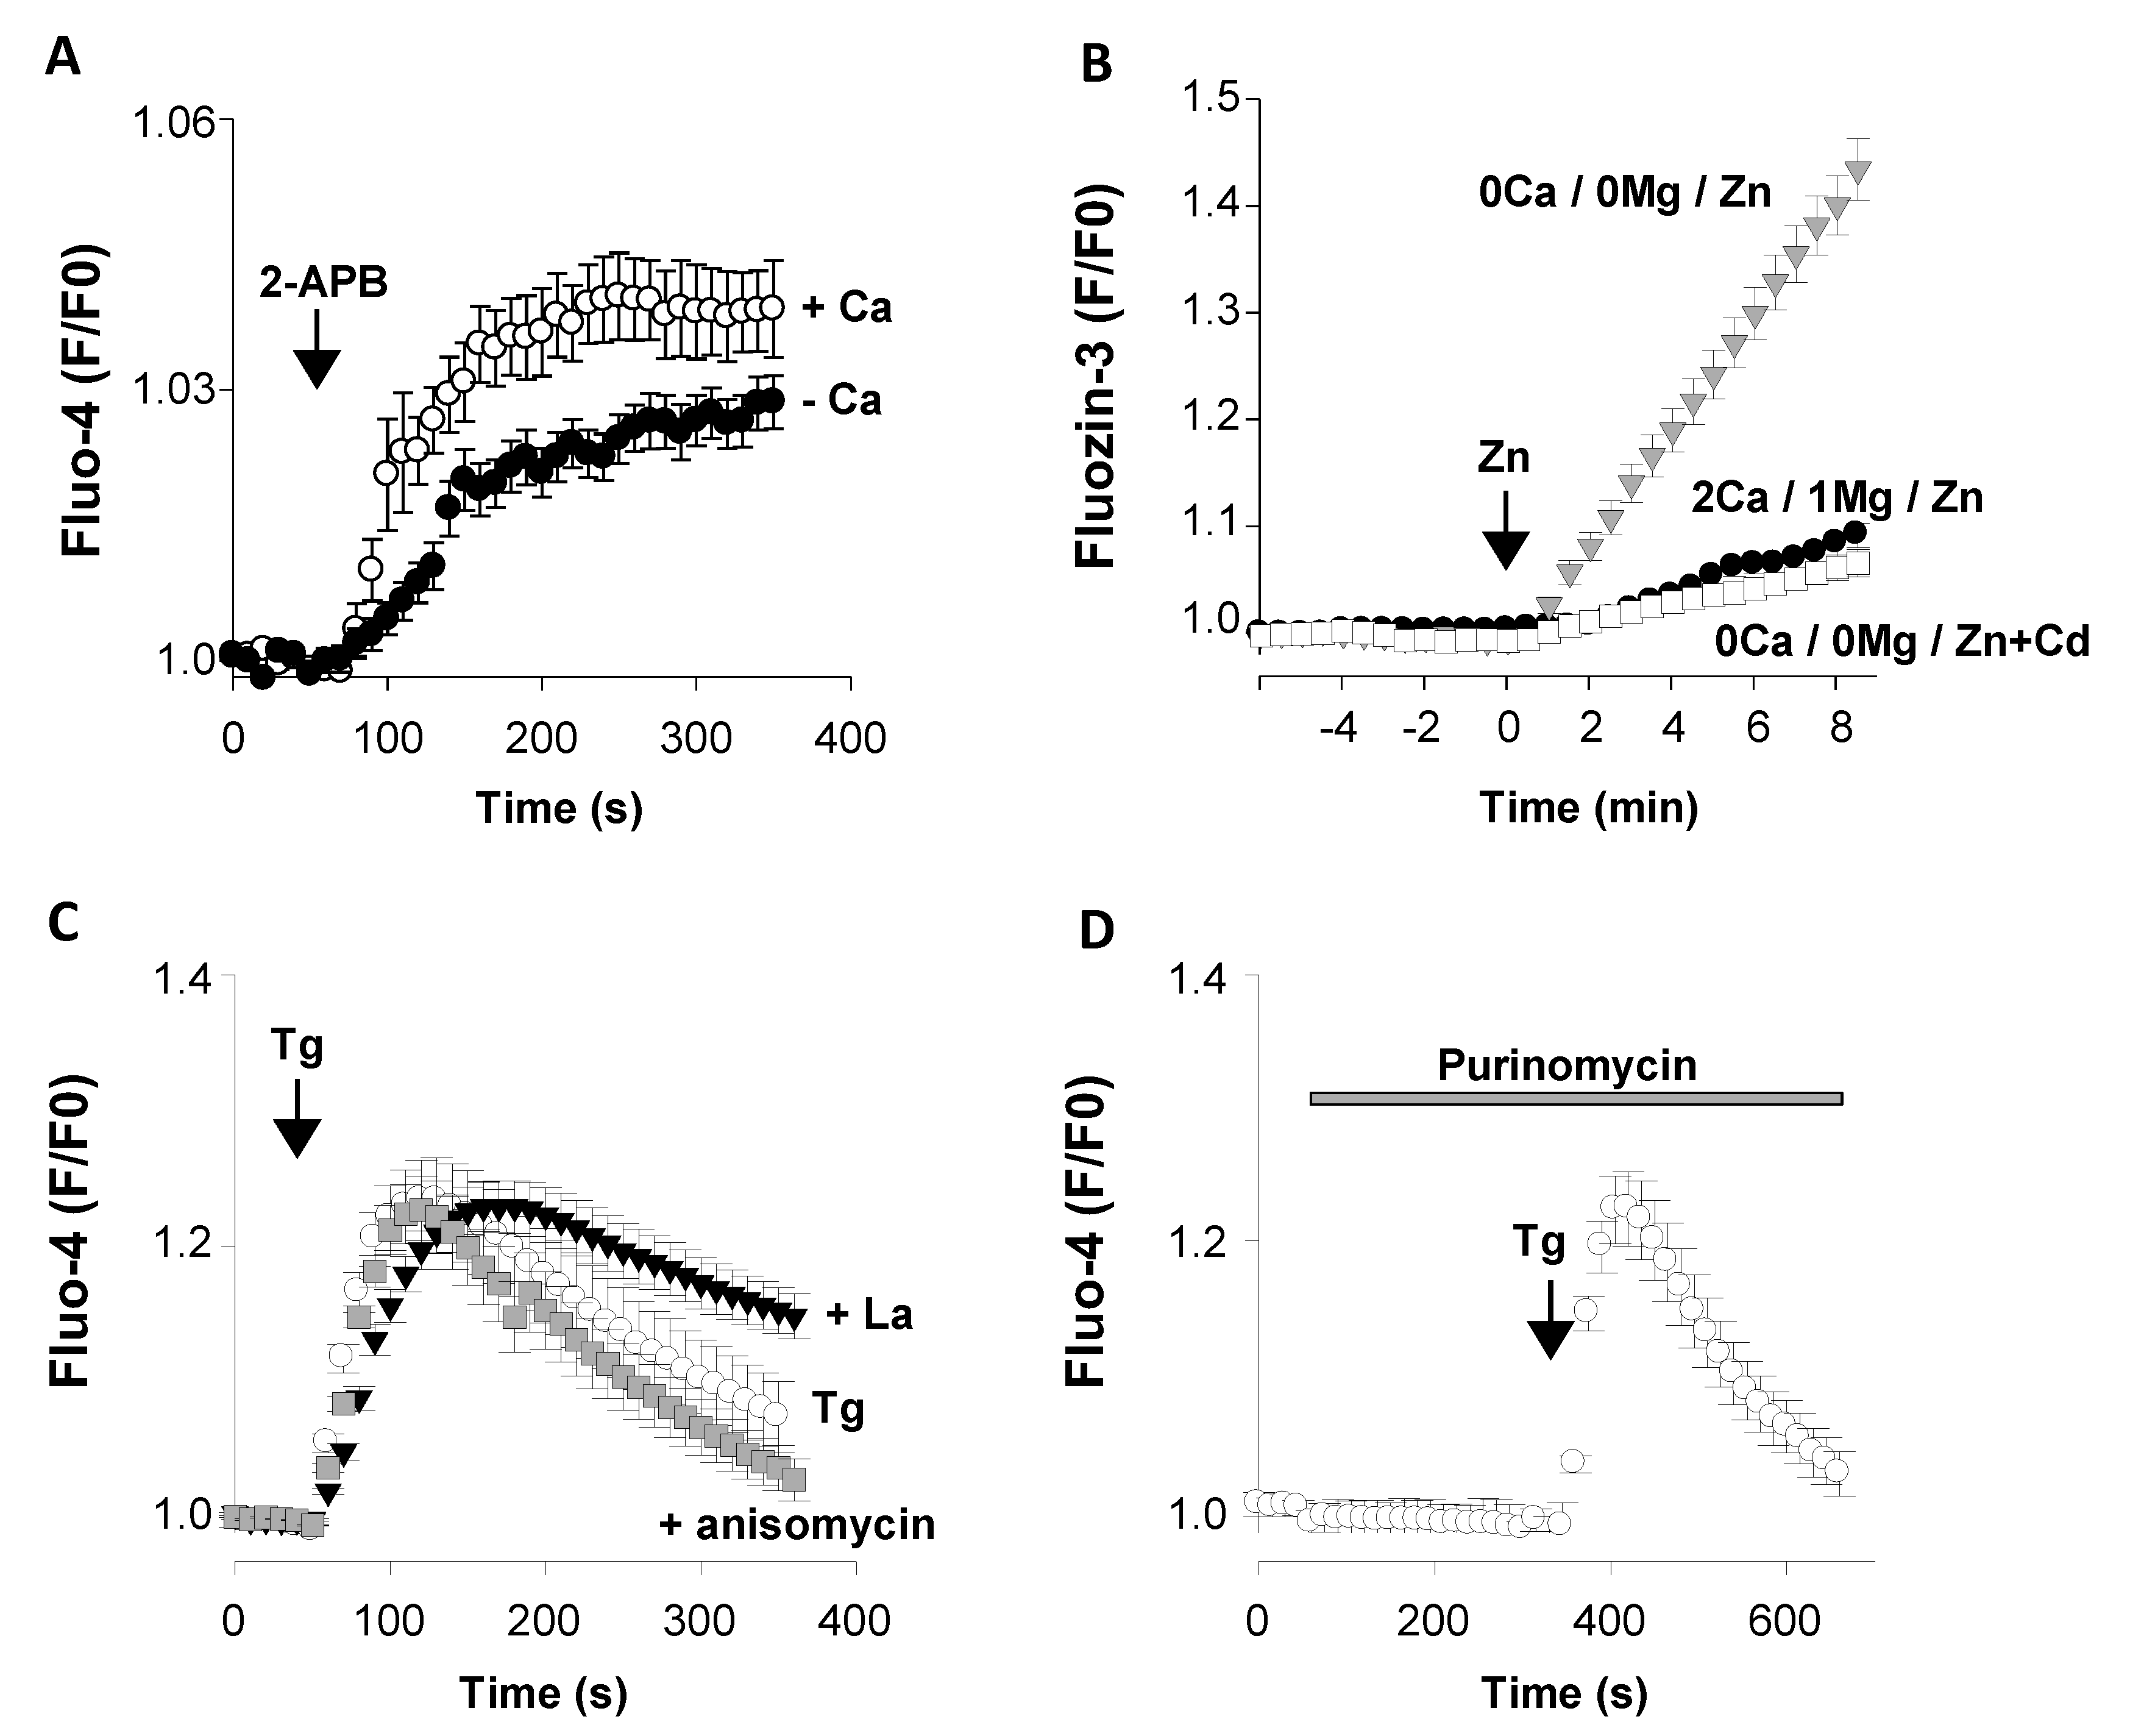
3.2. Presence of Functional Ca2+ Transport Systems at E13

The second part of this study focuses on the functional Ca2+ transport systems of E13 cortical cells. The different layers of the cortical wall are formed sequentially, following an inside-out order. Therefore, the first post-mitotic neurons generated reside in the deepest cortical layers and fulfil important roles during corticogenesis. Any Ca2+ dyshomeostasis at the early stages of neurogenesis is likely to influence the growth and formation of the neocortex, which, in turn, may affect the cognitive, motor, and sensory functions.

3.2.1. Functional Ca2+ Transport Systems of The Plasma Membrane

A list of the 10 most expressed genes encoding plasma membrane Ca2+ channels is given in Table 1. The presence of functional channels generating intracellular Ca2+ changes was tested by single-cell fluorescent Ca2+ imaging with the fluorescent probe Fluo-4. This study focused its attention on Chrnb2 (AchR β2), Grik5 (GluK5), Orai3 (Orai3), and Trpm7 (TRPM7). The contribution of the connexin genes and TACAN was not addressed. E13 cortical neurons express NCX2 proteins and display a functional Na+/Ca2+ exchanger [87]. Therefore, the Slc8a2 gene product was also not covered.

Acetylcholine Nicotinic Receptors AChR β2

In this set of experiments, the recording saline contained atropine (10 µM) to block muscarinic acetylcholine receptors. The application of nicotine (10 µM) generated a cytosolic Ca2+ elevation in only 1 out of 172 cells tested from two distinct batches of cells (not shown). This suggests that E13 cortical cells lack functional Ca2+-conducting acetylcholine nicotinic receptors.

Orai3

Orai3 channel activity can be enhanced by 2-aminoethyl diphenyl borate (2-APB, 50 µM) independently of STIM1-2 and of the filling status of the ER Ca2+ stores [88,89]. As illustrated in Figure 5A, the application of 50 µM 2-APB to primary E13 cortical neurons provoked a small but consistent cytosolic Ca2+ rise (open circles) that was significantly reduced upon the removal of external Ca2+ (filled circles; Figure 5A). This showed that 2-APB stimulated a release as well as an entry of Ca2+ in E13 cortical cells. Orai3 was detected at the cell surface and intracellularly in the membrane of the ER, mediating a 2-APB-trigerred Ca2+ release. This Orai3-dependent Ca2+ route is distinct from the thapsigargin-evoked Ca2+ leak pathway [59]. In aggregate, E13 cortical cells expressed 2-APB-sensitive channels located at the cell surface and intracellularly, generating Ca2+ signals of small amplitudes. At the mRNA level, all types of Orai channels were found in the cortical wall at E13. E13 cortical cells also display a functional store-operated Ca entry (SOCE) pathway [15,90].

TRPM7

Although TRPM7 can be found intracellularly [91], it is assumed to function primarily as a plasma membrane conductance sensitive to external cations. In neurons, lowering the extracellular concentrations of Ca2+ and Mg2+ activates TRPM7 channels that are highly permeable to Zn2+ ions [92,93]. This property was exploited to examine the presence of functional TRPM7 channels at E13. To that aim, cortical cells were loaded with the fluorescent Zn2+ probe FluoZin-3 [18]. The cells were first maintained in a saline containing 2 mM Ca2+ and 1 mM Mg2+ before introducing 100 µM Zn acetate into the recording saline (time 0, arrow). This was associated with a small elevation of the FluoZin-3 fluorescence (Figure 5B, filled circles). In another set of experiments, the cells were bathed for 4 min in a nominally Ca2+- and Mg2+-free saline to enhance TRPM7 activity [93] prior to the addition of zinc acetate (at time 0). Removing the Ca2+ and Mg2+ ions had no effect on the basal FluoZin-3 fluorescence. However, the external application of 100 µM Zn acetate caused a robust and sustained elevation of the FluoZin-3 fluorescence (Figure 5B, gray triangles). This response, observed in all cells tested (167 cells from 7 dishes), was strongly depressed by a low concentration of the cation channel blocker gadolinium (5 µM GdCl3) (Figure 5B, open squares). Altogether, E13 cortical cells expressed functional TRPM7-like channels sensitive to the removal of extracellular Ca2+ and Mg2+ ions and permeable to Zn2+ [93,94,95].

3.2.2. Functional Intracellular Ca2+ Transport Systems

A list of the 10 most expressed E13 genes involved in the transport of Ca2+ through intracellular membranes is given in Table 2. In this section, two genes were considered: Atp2a2 (SERCA2) and Sec61a1 (translocon).

The Ca2+ Pump SERCA2

Atp2a2 was the most expressed SERCA gene throughout corticogenesis (Figure 4A). The presence of functional SERCA2 pumps was assessed with the specific inhibitor thapsigargin (Tg) [96]. In cells with replete ER Ca stores, the application of Tg was followed by a [Ca2+]i rise, revealing a passive leakage of Ca2+ out of Tg-sensitive Ca2+ compartments.
To exclude the contribution of external Ca2+, the following experiments were performed with a nominally Ca2+-free saline. At E13, Tg elevated [Ca2+]i in a majority of cells (117 cells out of 130 cells tested, 90%) (Figure 5C, open circles) [14,15,90]. This Tg-induced Ca2+ signal showed that E13 cells possessed a functional Ca2+ storage system able to deliver Ca2+ into Tg-sensitive stores. The transient elevation of [Ca2+]i provoked by Tg reflected the presence of efficient Ca2+ homeostatic mechanisms able to restore low cytosolic levels of Ca2+. The Atp2b1 gene encodes PMCA1, which pumps Ca2+ out of cells. The activity of this Ca2+ ATPase is blocked by the trivalent cation lanthanum (La3+) [97,98]. When added together with Tg, La3+ (0.1 µM) delayed the decaying phase to resting basal Ca2+ levels (Figure 5C, filled triangles). This La3+-induced impairment of the extrusion of Ca2+ indicated that E13 cortical neurons express functional PMCA1. When compared to PMCA, SERCA appeared as the major Ca2+ ATPase at E13. Atp2a2 (SERCA) and Atp2b1 (PMCA) transcripts were found at high and low levels, respectively, indicating that E13 cells possessed a very efficient ER Ca2+ storage system in comparison to the extrusion route via Ca2+ pumps.

The Leak Channel Translocon

The Sec61a1 gene was one of the most expressed genes coding for putative Ca2+ leak channels. The contribution of Sec61a1 to the passive release of Ca2+ was investigated using the protein synthesis inhibitor puromycin that opens the translocon. For instance, puromycin (200 µM) depletes the Ca2+ stores of the ER in vascular smooth muscle cells [99]. However, when tested on E13 cortical cells, 250 µM puromycin did not affect the resting basal [Ca2+]i levels (Figure 5D). It also did not abolish the Tg-evoked Ca2+ rise. This showed that the ER Ca2+ stores were unaffected by puromycin (Figure 5D). Anisomycin, another inhibitor of the protein synthesis that closes the translocon, had no effect on the Tg-evoked Ca2+ release (Figure 5C, gray squares). As indicated in Chapter I.1.8, many candidates have been postulated to contribute to the ER Ca2+ leak, such as translocons, pannexins, LRRC8, MG23, presenilin, TRPC1, Orai3, and members of the Bax inhibitor-1 motif-containing (TMBIM) protein family. Our data indicated that the protein encoded by the Sec61a1 gene was not expressed or did not contribute to the Ca2+ leak pathway, as has been reported by others [99,100].

3.3. Summary

Figure 6 summarizes some of the main results of this study. The scheme presents the putative subcellular localization of the products of the 10 most expressed genes and their expression pattern between the beginning (E13–E17) and end of corticogenesis (E17–PN1). At the transcriptomic level, the most important Ca2+ uptake routes of the cell surface at the onset of corticogenesis (Figure 6) are channels formed by TACAN, GluK5, Orai3, Cav3.1, TRPM7, and nAChR β2. These are mechano-sensitive (TACAN), ligand-gated (GluK5 and nAChR β2), voltage-gated (Cav3.1), and Mg/ATP-regulated constitutively activated channels (TRPM7). Orai3 has been described as a store-operated Ca channel; however, it also appears to be a component of arachidonic acid-regulated calcium-selective (ARC) channels.
In addition, the connexins CX43/CX45/CX37 allow an intercellular coupling, whereas NCX2, depending on its reversal potential, can work in a forward (Ca2+ export) or backward (Ca2+ uptake) mode. These actors (CX and NCX) permit a bidirectional transport of Ca2+ through the plasma membrane (or between adjacent cells). Intracellularly, TRPML1 and the uncharacterized “leak” channels form the two prominent Ca2+ release pathways at all ages. In front of these numerous routes that contribute to elevating cytosolic Ca2+ levels, SERCA2 and PMCA1 appeared as the crucial systems to bring Ca2+ back to its resting basal levels. TMEM165 is another actor able to store Ca2+ in internal compartments; however, this contribution is less prominent at the end of corticogenesis. A more numerous and diverse population of Ca2+ uptake systems was observed in the cortical wall at the end of neurogenesis (E17 and onward). In addition to the actors listed above, certain prominent Ca2+-conducting systems emerged, including ASIC1, Orai2, P2X2, and GluN1.

4. Conclusions

The major purpose of this study was to perform a transcriptional profiling to survey the global expression patterns of genes coding for Ca2+ transport systems of the cortical wall during mouse corticogenesis. This permitted the establishment of the developmental expression profiles of the major genes involved in Ca2+ transport through membranes. In the second part of the report, certain genes were selected and live-cell Ca2+ (or Zn2+) imaging experiments were performed to verify the presence of functional proteins at E13. Overall, numerous Ca2+ transporter genes were expressed in the embryonic cerebral cortex. Collectively, there is a large diversity of Ca2+ transport systems at the cell surface that contrasts with the paucity of prominent internal Ca2+ transport systems.
One limitation of this work is the possibility that some transcripts were missed due to the existence of genes with unknown functions. New ion channels are continuously being uncovered. For instance, it was recently shown that the stretch-activated nonselective cation channel TMEM63B is an osmosensor that can mediate the Ca2+ influx [101]. This example indicates that it cannot be excluded that genes coding for Ca2+-transport proteins and contributing to Ca2+ signaling were missed in the present work. Another limitation of this work is the fact that many, if not all, ion channels require dedicated and specific auxiliary subunits that are of the upmost physiological importance for their assembly/maturation/trafficking/surface expression and/or ion transport activities and properties. Although crucial for the biogenesis and appropriate activity of ion channels, the mRNA expression of these regulatory subunits was not investigated.
It is also important to consider that some actors selected in this report may function as pathways for cations distinct from Ca2+. For example, TRPM7 is a Ca2+-conducting pathway but it may function as a physiological Mg2+ transport system [102]. In addition, two other limitations must be introduced: only certain transcripts are translated to proteins, and this transcriptomic approach did not consider the post-translational modifications known to influence the activity and/or subcellular localization of proteins. Altogether, this study provided a detailed view of the pattern of expression of the main actors participating in the import, export, and release of Ca2+ during the formation and development of the cerebral cortex. This study can serve as a valuable resource and provide a framework for further functional and mechanistic studies on Ca2+ signaling during cerebral cortex formation.

Supplementary Materials

Supplementary File 1

Funding

This research was funded by Agence Nationale de la Recherche (ANR-16-CE29-0024), Centre National de la Recherche Scientifique (CNRS), Commissariat à l’Energie Atomique et aux Energies Alternatives (CEA), Université de Grenoble Alpes (UGA). The animal facility platform financed within the University Grenoble Alpes graduate school (Ecoles Universitaires de Recherche) CBH-EUR-GS (ANR-17-EURE-0003) is also acknowledged.

Acknowledgments

I wish to thank Laurence Aubry, Laurent Combettes, and Agnès Journet for their helpful comments on earlier versions of this article. I also wish to thank J. Gibon for preliminary experiments on TRPM7.

Conflicts of Interest

The author declares no conflict of interest.

References

  1. Berridge, M.J.; Lipp, P.; Bootman, M.D. The Versatility and Universality of Calcium Signalling. Nat. Rev. Mol. Cell Biol. 2000, 1, 11–21. [Google Scholar] [CrossRef] [PubMed]
  2. Komuro, H.; Rakic, P. Intracellular Ca2+ Fluctuations Modulate the Rate of Neuronal Migration. Neuron 1996, 17, 275–285. [Google Scholar] [CrossRef] [Green Version]
  3. Owens, D.F.; Kriegstein, A.R. Patterns of Intracellular Calcium Fluctuation in Precursor Cells of the Neocortical Ventricular Zone. J. Neurosci. 1998, 18, 5374–5388. [Google Scholar] [CrossRef] [PubMed]
  4. Gomez, T.M.; Spitzer, N.C. Regulation of Growth Cone Behavior by Calcium: New Dynamics to Earlier Perspectives. J. Neurobiol. 2000, 44, 174–183. [Google Scholar] [CrossRef]
  5. Kriegstein, A.R.; Noctor, S.C. Patterns of Neuronal Migration in the Embryonic Cortex. Trends Neurosci. 2004, 27, 392–399. [Google Scholar] [CrossRef]
  6. Jabaudon, D. Fate and Freedom in Developing Neocortical Circuits. Nat. Commun. 2017, 8, 16042. [Google Scholar] [CrossRef]
  7. Finlay, B.L.; Uchiyama, R. Developmental Mechanisms Channeling Cortical Evolution. Trends Neurosci. 2015, 38, 69–76. [Google Scholar] [CrossRef]
  8. Sun, T.; Hevner, R.F. Growth and Folding of the Mammalian Cerebral Cortex: From Molecules to Malformations. Nat. Rev. Neurosci. 2014, 15, 217–232. [Google Scholar] [CrossRef] [Green Version]
  9. Kriegstein, A.; Parnavelas, J.G. Changing Concepts of Cortical Development. Cereb. Cortex 2003, 13, 541. [Google Scholar] [CrossRef] [Green Version]
  10. Barkovich, A.J.; Guerrini, R.; Kuzniecky, R.I.; Jackson, G.D.; Dobyns, W.B. A Developmental and Genetic Classification for Malformations of Cortical Development: Update 2012. Brain A J. Neurol. 2012, 135, 1348–1369. [Google Scholar] [CrossRef]
  11. Behar, T.N.; Schaffner, A.E.; Catherine, A.S.; Casey, O.C.; Jeffery, L.B. Differential Response of Cortical Plate and Ventricular Zone Cells to Gaba as a Migration Stimulus. J. Neurosci. 1998, 18, 6378–6387. [Google Scholar] [CrossRef] [PubMed] [Green Version]
  12. Hasna, J.; Bohic, S.; Lemoine, S.; Blugeon, C.; Bouron, A. Zinc Uptake and Storage during the Formation of the Cerebral Cortex in Mice. Mol. Neurobiol. 2019, 56, 6928–6940. [Google Scholar] [CrossRef] [PubMed]
  13. Gibon, J.; Deloulme, J.C.; Chevallier, T.; Ladeveze, E.; Abrous, D.N.; Bouron, A. The Antidepressant Hyperforin Increases the Phosphorylation of Creb and the Expression of Trkb in a Tissue—Specific Manner. Int. J. Neuropsychopharmacol. 2013, 16, 189–198. [Google Scholar] [CrossRef] [Green Version]
  14. Chauvet, S.; Louis, J.; Mireille, C.; Niroj, S.; Klaus, G.; Alexandre, B. Pharmacological Characterization of the Native Store-Operated Calcium Channels of Cortical Neurons from Embryonic Mouse Brain. Front. Pharmacol. 2016, 7, 486. [Google Scholar] [CrossRef] [Green Version]
  15. Bouron, A. Phyto and Endocannabinoids Exert Complex Actions on Calcium and Zinc Signaling in Mouse Cortical Neurons. Biochem. Pharm. 2018, 152, 244–251. [Google Scholar] [CrossRef] [PubMed]
  16. Bouron, A.C.; Mbebi, C.; Loeffler, J.P.; Waard, M.D. The Beta-Amyloid Precursor Protein Controls a Store-Operated Ca2+ Entry in Cortical Neurons. Eur. J. Neurosci. 2004, 20, 2071–2078. [Google Scholar] [CrossRef] [PubMed]
  17. Deveci, A.; Hasna, J.; Bouron, A. Inhibition of Store-Operated Calcium Channels by N-Arachidonoyl Glycine (Nagly): No Evidence for the Involvement of Lipid-Sensing G Protein Coupled Receptors. Sci. Rep. 2020, 10, 2649. [Google Scholar] [CrossRef]
  18. Tu, P.; Gibon, J.; Bouron, A. The Trpc6 Channel Activator Hyperforin Induces the Release of Zinc and Calcium from Mitochondria. J. Neurochem. 2010, 112, 204–213. [Google Scholar] [CrossRef]
  19. Yunker, A.M.; Sharp, A.H.; Sundarraj, S.; Ranganathan, V.; Copeland, T.D.; McEnery, M.W. Immunological Characterization of T-Type Voltage-Dependent Calcium Channel Cav3.1 (Alpha 1g) and Cav3.3 (Alpha 1i) Isoforms Reveal Differences in Their Localization, Expression, and Neural Development. Neuroscience 2003, 117, 321–335. [Google Scholar] [CrossRef]
  20. Frischknecht, F.; Randall, A.D. Voltage- and Ligand-Gated Ion Channels in Floor Plate Neuroepithelia of the Rat. Neuroscience 1998, 85, 1135–1149. [Google Scholar] [CrossRef]
  21. Bouron, A.S.; Boisseau, A.; Waard, M.D.; Peris, L. Differential Down-Regulation of Voltage-Gated Calcium Channel Currents by Glutamate and Bdnf in Embryonic Cortical Neurons. Eur. J. Neurosci. 2006, 24, 699–708. [Google Scholar] [CrossRef] [PubMed]
  22. Timmermann, D.B.; Lund, T.M.; Belhage, B.; Schousboe, A. Localization and Pharmacological Characterization of Voltage Dependent Calcium Channels in Cultured Neocortical Neurons. Int. J. Dev. Neurosci. 2001, 19, 1–10. [Google Scholar] [CrossRef]
  23. Bahrey, H.L.; Moody, W.J. Voltage-Gated Currents, Dye and Electrical Coupling in the Embryonic Mouse Neocortex. Cereb. Cortex 2003, 13, 239–251. [Google Scholar] [CrossRef] [PubMed] [Green Version]
  24. Hadzic, M.; Jack, A.; Wahle, P. Ionotropic Glutamate Receptors: Which Ones, When, and Where in the Mammalian Neocortex. J. Comp. Neurol. 2017, 525, 976–1033. [Google Scholar] [CrossRef]
  25. Monyer, H.; Burnashev, N.; Laurie, D.J.; Sakmann, B.; Seeburg, P.H. Developmental and Regional Expression in the Rat Brain and Functional Properties of Four Nmda Receptors. Neuron 1994, 12, 529–540. [Google Scholar] [CrossRef]
  26. Gallyas, F., Jr.; Ball, S.M.; Molnar, E. Assembly and Cell Surface Expression of Ka-2 Subunit-Containing Kainate Receptors. J. Neurochem. 2003, 86, 1414–1427. [Google Scholar] [CrossRef] [Green Version]
  27. Zoli, M.; Le, N.; Novere, J.A.; Hill, J.; Changeux, J.P. Developmental Regulation of Nicotinic Ach Receptor Subunit Mrnas in the Rat Central and Peripheral Nervous Systems. J. Neurosci. 1995, 15, 1912–1939. [Google Scholar] [CrossRef]
  28. Tanaka, H.; Grooms, S.Y.; Bennett, M.V.; Zukin, R.S. The Ampar Subunit Glur2: Still Front and Center-Stage. Brain Res. 2000, 886, 190–207. [Google Scholar] [CrossRef]
  29. Henley, J.M.; Wilkinson, K.A. Synaptic Ampa Receptor Composition in Development, Plasticity and Disease. Nat. Rev. Neurosci. 2016, 17, 337–350. [Google Scholar] [CrossRef] [Green Version]
  30. Whitney, N.P.; Peng, H.; Erdmann, N.B.; Tian, C.; Monaghan, D.T.; Zheng, J.C. Calcium-Permeable Ampa Receptors Containing Q/R-Unedited Glur2 Direct Human Neural Progenitor Cell Differentiation to Neurons. FASEB J. Off. Publ. Fed. Am. Soc. Exp. Biol. 2008, 22, 2888–2900. [Google Scholar] [CrossRef] [Green Version]
  31. Nilius, B.; Owsianik, G. Transient Receptor Potential Channelopathies. Pflug. Arch. 2010, 460, 437–450. [Google Scholar] [CrossRef] [PubMed]
  32. Wu, L.J.; Sweet, T.B.; Clapham, D.E. International Union of Basic and Clinical Pharmacology. Lxxvi. Current Progress in the Mammalian Trp Ion Channel Family. Pharm. Rev. 2010, 62, 381–404. [Google Scholar] [CrossRef] [PubMed]
  33. Owsianik, G.; Talavera, K.; Voets, T.; Nilius, B. Permeation and Selectivity of Trp Channels. Annu. Rev. Physiol. 2006, 68, 685–717. [Google Scholar] [CrossRef] [PubMed]
  34. Fliniaux, I.; Germain, E.; Farfariello, V.; Prevarskaya, N. Trps and Ca(2+) in Cell Death and Survival. Cell Calcium. 2018, 69, 4–18. [Google Scholar] [CrossRef]
  35. Busch, T.; Kottgen, M.; Hofherr, A. Trpp2 Ion Channels: Critical Regulators of Organ Morphogenesis in Health and Disease. Cell Calcium 2017, 66, 25–32. [Google Scholar] [CrossRef]
  36. Nilius, B.; Szallasi, A. Transient Receptor Potential Channels as Drug Targets: From the Science of Basic Research to the Art of Medicine. Pharm. Rev. 2014, 66, 676–814. [Google Scholar] [CrossRef]
  37. Jang, Y.; Lee, Y.; Kim, S.M.; Yang, Y.D.; Jung, J.; Oh, U. Quantitative Analysis of Trp Channel Genes in Mouse Organs. Arch. Pharm. Res. 2012, 35, 1823–1830. [Google Scholar] [CrossRef]
  38. Kunert-Keil, C.; Bisping, F.; Krüger, J.; Brinkmeier, H. Tissue-Specific Expression of Trp Channel Genes in the Mouse and Its Variation in Three Different Mouse Strains. BMC Genom. 2006, 7, 159. [Google Scholar] [CrossRef] [Green Version]
  39. Cheng, X.; Shen, D.; Samie, M.; Xu, H. Mucolipins: Intracellular Trpml1-3 Channels. FEBS Lett. 2010, 584, 2013–2021. [Google Scholar] [CrossRef] [Green Version]
  40. Venkatachalam, K.; Wong, C.O.; Zhu, M.X. The Role of Trpmls in Endolysosomal Trafficking and Function. Cell Calcium 2015, 58, 48–56. [Google Scholar] [CrossRef] [Green Version]
  41. Tai, Y.; Feng, S.; Du, W.; Wang, Y. Functional Roles of Trpc Channels in the Developing Brain. Pflug. Arch. 2009, 458, 283–289. [Google Scholar] [CrossRef]
  42. Lucas, P.; Ukhanov, K.; Leinders-Zufall, T.; Zufall, F.A. Diacylglycerol-Gated Cation Channel in Vomeronasal Neuron Dendrites Is Impaired in Trpc2 Mutant Mice: Mechanism of Pheromone Transduction. Neuron 2003, 40, 551–561. [Google Scholar] [CrossRef] [Green Version]
  43. Hoth, M.; Niemeyer, B.A. The Neglected Crac Proteins: Orai2, Orai3, and Stim2. Curr. Top. Membr. 2013, 71, 237–271. [Google Scholar] [CrossRef] [PubMed]
  44. Prakriya, M.; Lewis, R.S. Store-Operated Calcium Channels. Physiol. Rev. 2015, 95, 1383–1436. [Google Scholar] [CrossRef] [PubMed] [Green Version]
  45. Kraft, R. Stim and Orai Proteins in the Nervous System. Channels 2015, 9, 245–252. [Google Scholar] [CrossRef] [Green Version]
  46. Berna-Erro, A.; Braun, A.; Kraft, R.; Kleinschnitz, C.; Schuhmann, M.K.; Stegner, D.; Meuth, G.S.; Nieswandt, B. Stim2 Regulates Capacitive Ca2+ Entry in Neurons and Plays a Key Role in Hypoxic Neuronal Cell Death. Sci. Signal. 2009, 2, 67. [Google Scholar] [CrossRef] [Green Version]
  47. Honoré, E.; Martins, J.R.; Penton, D.; Patel, A.; Demolombe, S. The Piezo Mechanosensitive Ion Channels: May the Force Be with You! Rev. Physiol. Biochem. Pharm. 2015, 169, 25–41. [Google Scholar] [CrossRef]
  48. Koser, D.E.; Thompson, A.J.; Foster, S.K.; Dwivedy, A.; Pillai, E.K.; Sheridan, G.K.; Svoboda, H.; Viana, M.; Costa, L.D.; Guck, C.E.; et al. Mechanosensing Is Critical for Axon Growth in the Developing Brain. Nat. Neurosci. 2016, 19, 1592–1598. [Google Scholar] [CrossRef] [Green Version]
  49. Beaulieu-Laroche, L.; Christin, M.; Donoghue, A.; Agosti, F.; Yousefpour, N.; Petitjean, H.; Davidova, A.; Petitjean, H.; Faure, E.; Stanton, C.; et al. Tacan Is an Ion Channel Involved in Sensing Mechanical Pain. Cell 2020, 180, 956–967. [Google Scholar] [CrossRef]
  50. Grunder, S.; Pusch, M. Biophysical Properties of Acid-Sensing Ion Channels (Asics). Neuropharmacology 2015, 94, 9–18. [Google Scholar] [CrossRef]
  51. Deval, E.; Lingueglia, E. Acid-Sensing Ion Channels and Nociception in the Peripheral and Central Nervous Systems. Neuropharmacology 2015, 94, 49–57. [Google Scholar] [CrossRef] [PubMed]
  52. Li, M.; Kratzer, E.; Inoue, K.; Simon, R.P.; Xiong, Z.G. Developmental Change in the Electrophysiological and Pharmacological Properties of Acid-Sensing Ion Channels in Cns Neurons. J. Physiol. 2010, 588, 3883–3900. [Google Scholar] [CrossRef] [PubMed]
  53. Wemmie, J.A.; Askwith, C.C.; Lamani, E.; Cassell, M.D.; Freeman, J.H.; Welsh, M.J. Acid-Sensing Ion Channel 1 Is Localized in Brain Regions with High Synaptic Density and Contributes to Fear Conditioning. J. Neurosci. 2003, 23, 5496–5502. [Google Scholar] [CrossRef] [PubMed]
  54. Wemmie, J.A.; Chen, J.; Askwith, C.C.; Hruska-Hageman, A.M.; Price, M.P.; Nolan, B.C.; Welsh, M.J. The Acid-Activated Ion Channel Asic Contributes to Synaptic Plasticity, Learning, and Memory. Neuron 2002, 34, 463–477. [Google Scholar] [CrossRef] [Green Version]
  55. Ruas, M.; Galione, A.; Parrington, J. Two-Pore Channels: Lessons from Mutant Mouse Models. Messenger 2015, 4, 4–22. [Google Scholar] [CrossRef] [Green Version]
  56. Szlufcik, K.; Missiaen, L.; Parys, J.B.; Callewaert, G.; De Smedt, H. Uncoupled Ip3 Receptor Can Function as a Ca2+-Leak Channel: Cell Biological and Pathological Consequences. Biol. Cell. 2006, 98, 1–14. [Google Scholar] [CrossRef]
  57. Takeshima, H.; Venturi, E.; Sitsapesan, R. New and Notable Ion-Channels in the Sarcoplasmic/Endoplasmic Reticulum: Do They Support the Process of Intracellular Ca(2)(+) Release? J. Physiol. 2015, 593, 3241–3251. [Google Scholar] [CrossRef] [Green Version]
  58. Berbey, C.; Weiss, N.; Legrand, C.; Allard, B. Transient Receptor Potential Canonical Type 1 (Trpc1) Operates as a Sarcoplasmic Reticulum Calcium Leak Channel in Skeletal Muscle. J. Biol. Chem. 2009, 284, 36387–36394. [Google Scholar] [CrossRef] [Green Version]
  59. Leon-Aparicio, D.; Pacheco, J.; Chavez-Reyes, J.; Galindo, J.M.; Valdes, J.; Vaca, L.; Guerrero-Hernandez, A. Orai3 Channel Is the 2-Apb-Induced Endoplasmic Reticulum Calcium Leak. Cell Calcium 2017, 65, 91–101. [Google Scholar] [CrossRef]
  60. Lisak, D.A.; Schacht, T.; Enders, V.; Habicht, J.; Kiviluoto, S.; Schneider, J.; Methner, A. The Transmembrane Bax Inhibitor Motif (Tmbim) Containing Protein Family: Tissue Expression, Intracellular Localization and Effects on the Er Ca(2)(+)-Filling State. Biochim. Biophys. Acta. 2015, 1853, 2104–2114. [Google Scholar] [CrossRef] [Green Version]
  61. Johnson, A.E.; Van Waes, M.A. The Translocon: A Dynamic Gateway at the Er Membrane. Annu. Rev. Cell. Dev. Biol. 1999, 15, 799–842. [Google Scholar] [CrossRef] [PubMed]
  62. Flourakis, M.; Van Coppenolle, F.; Lehen’Kyi, V.Y.; Beck, B.; Skryma, R.; Prevarskaya, N.; Skryma, R. Passive Calcium Leak Via Translocon Is a First Step for Ipla2-Pathway Regulated Store Operated Channels Activation. FASEB J. 2006, 20, 1215–1217. [Google Scholar] [CrossRef] [PubMed]
  63. Lang, S.; Erdmann, F.; Jung, M.; Wagner, R.; Cavalie, A.; Zimmermann, R. Sec61 Complexes Form Ubiquitous Er Ca2+ Leak Channels. Channels 2011, 5, 228–235. [Google Scholar] [CrossRef] [PubMed] [Green Version]
  64. Tu, H.; Nelson, O.; Bezprozvanny, A.; Wang, Z.; Lee, S.F.; Hao, Y.H.; Bezprozvanny, I. Presenilins Form Er Ca2+ Leak Channels, a Function Disrupted by Familial Alzheimer’s Disease-Linked Mutations. Cell 2006, 126, 981–993. [Google Scholar] [CrossRef] [PubMed] [Green Version]
  65. Tu, H.; Nelson, O.; Bezprozvanny, A.; Wang, Z.; Lee, S.F.; Hao, Y.H.; Bezprozvanny, I. Lack of Evidence for Presenilins as Endoplasmic Reticulum Ca2+ Leak Channels. J. Biol. Chem. 2012, 287, 10933–10944. [Google Scholar] [CrossRef] [Green Version]
  66. Bond, S.R.; Naus, C.C. The Pannexins: Past and Present. Front. Physiol. 2014, 5, 58. [Google Scholar] [CrossRef] [PubMed] [Green Version]
  67. Penuela, S.; Gehi, R.; Laird, D.W. The Biochemistry and Function of Pannexin Channels. Biochim. Biophys. Acta 2013, 1828, 15–22. [Google Scholar] [CrossRef] [Green Version]
  68. Ghosh, A.; Khandelwal, N.; Kumar, A.; Bera, A.K. Leucine-Rich Repeat-Containing 8b Protein Is Associated with the Endoplasmic Reticulum Ca(2+) Leak in Hek293 Cells. J. Cell Sci. 2017, 130, 3818–3828. [Google Scholar] [CrossRef] [Green Version]
  69. Wang, Q.C.; Zheng, Q.; Tan, H.; Zhang, B.; Li, X.; Yang, Y.; Yu, J.; Liu, Y.; Chai, H.; Wang, X.; et al. Tmco1 Is an Er Ca(2+) Load-Activated Ca(2+) Channel. Cell 2016, 165, 1454–1466. [Google Scholar] [CrossRef] [Green Version]
  70. Zhou, X.; Lin, P.; Yamazaki, D.; Park, K.H.; Komazaki, S.; Chen, S.W.; Ma, J. Trimeric Intracellular Cation Channels and Sarcoplasmic/Endoplasmic Reticulum Calcium Homeostasis. Circ. Res. 2014, 114, 706–716. [Google Scholar] [CrossRef] [Green Version]
  71. Shrestha, N.; Bacsa, B.; Ong, H.L.; Scheruebel, S.; Bischof, H.; Malli, R.; Groschner, K. Tric-a Shapes Oscillatory Ca2+ Signals by Interaction with Stim1/Orai1 Complexes. PLoS Biol. 2020, 18, e3000700. [Google Scholar] [CrossRef] [PubMed]
  72. Venturi, E.; Mio, K.; Nishi, M.; Ogura, T.; Moriya, T.; Pitt, S.J.; Okuda, K.; Kakizawa, S.; Sitsapesan, R.; Sato, C.; et al. Mitsugumin 23 Forms a Massive Bowl-Shaped Assembly and Cation-Conducting Channel. Biochemistry 2011, 50, 2623–2632. [Google Scholar] [CrossRef] [PubMed]
  73. Liu, Q. Tmbim-Mediated Ca(2+) Homeostasis and Cell Death. Biochim. Et Biophys. Acta. Mol. Cell Res. 2017, 1864, 850–857. [Google Scholar] [CrossRef]
  74. Brini, M. Plasma Membrane Ca(2+)-Atpase: From a Housekeeping Function to a Versatile Signaling Role. Pflug. Arch. 2009, 457, 657–664. [Google Scholar] [CrossRef] [PubMed]
  75. Maric, D.; Maric, I.; Barker, J.L. Developmental Changes in Cell Calcium Homeostasis during Neurogenesis of the Embryonic Rat Cerebral Cortex. Cereb. Cortex 2000, 10, 561–573. [Google Scholar] [CrossRef] [PubMed] [Green Version]
  76. Stribny, J.; Thines, L.; Deschamps, A.; Goffin, P.; Morsomme, P. The Human Golgi Protein Tmem165 Transports Calcium and Manganese in Yeast and Bacterial Cells. J. Biol. Chem. 2020, 295, 3865–3874. [Google Scholar] [CrossRef]
  77. Demaegd, D.; Foulquier, F.; Colinet, A.S.; Gremillon, L.; Legrand, D.; Mariot, P.; Morsomme, P. Newly Characterized Golgi-Localized Family of Proteins Is Involved in Calcium and Ph Homeostasis in Yeast and Human Cells. Proc. Natl. Acad. Sci. USA 2013, 110, 6859–6864. [Google Scholar] [CrossRef] [Green Version]
  78. De Stefani, D.; Rizzuto, R.; Pozzan, T. Enjoy the Trip: Calcium in Mitochondria Back and Forth. Annu. Rev. Biochem. 2016, 85, 161–192. [Google Scholar] [CrossRef]
  79. De Marchi, U.; Santo-Domingo, J.; Castelbou, C.; Sekler, I.; Wiederkehr, A.; Demaurex, N. Nclx Protein, but Not Letm1, Mediates Mitochondrial Ca2+ Extrusion, Thereby Limiting Ca2+-Induced Nad(P)H Production and Modulating Matrix Redox State. J. Biol. Chem. 2014, 289, 20377–20385. [Google Scholar] [CrossRef] [Green Version]
  80. Jiang, D.; Zhao, L.; Clapham, D.E. Genome-Wide Rnai Screen Identifies Letm1 as a Mitochondrial Ca2+/H+ Antiporter. Science 2009, 326, 144–147. [Google Scholar] [CrossRef] [Green Version]
  81. Tsai, M.F.; Jiang, D.; Zhao, L.; Clapham, D.; Miller, C. Functional Reconstitution of the Mitochondrial Ca2+/H+ Antiporter Letm1. J. Gen. Physiol. 2014, 143, 67–73. [Google Scholar] [CrossRef] [PubMed] [Green Version]
  82. Austin, S.; Nowikovsky, K. Letm1: Essential for Mitochondrial Biology and Cation Homeostasis? Trends Biochem. Sci. 2019, 44, 648–658. [Google Scholar] [CrossRef] [PubMed] [Green Version]
  83. Turco, J.L.; Kriegstein, A.R. Clusters of Coupled Neuroblasts in Embryonic Neocortex. Science 1991, 252, 563–566. [Google Scholar] [CrossRef]
  84. Uhlen, P.; Fritz, N.; Smedler, E.; Malmersjö, S.; Kanatani, S. Calcium Signaling in Neocortical Development. Dev. Neurobiol. 2015, 75, 360–368. [Google Scholar] [CrossRef] [PubMed]
  85. Alexander, S.P.; Mathie, A.; Peters, J.A.; Veale, E.L.; Striessnig, J.; Kelly, E.; Armstron, J.F.; Faccenda, E.; Harding, S.D.; Pawson, A.J. The Concise Guide to Pharmacology 2019/20: Ion Channels. Br. J. Pharmacol. 2019, 176, S142–S228. [Google Scholar] [CrossRef] [Green Version]
  86. Elias, L.A.; Kriegstein, A.R. Gap Junctions: Multifaceted Regulators of Embryonic Cortical Development. Trends Neurosci. 2008, 31, 243–250. [Google Scholar] [CrossRef] [Green Version]
  87. Platel, J.C.; Boisseau, S.; Dupuis, A.; Brocard, J.; Poupard, A.; Savasta, M.; Villaz, M.; Albrieux, M. Na+ Channel-Mediated Ca2+ Entry Leads to Glutamate Secretion in Mouse Neocortical Preplate. Proc. Natl. Acad. Sci. USA 2005, 102, 19174–19179. [Google Scholar] [CrossRef] [Green Version]
  88. Zhang, S.L.; Kozak, J.A.; Jiang, W.; Yeromin, A.V.; Chen, J.; Yu, Y.; Penna, A.; Shen, W.; Chi, V.; Cahalan, M.D. Store-Dependent and -Independent Modes Regulating Ca2+ Release-Activated Ca2+ Channel Activity of Human Orai1 and Orai3. J. Biol. Chem. 2008, 283, 17662–17671. [Google Scholar] [CrossRef] [Green Version]
  89. Peinelt, C.; Lis, A.; Beck, A.; Fleig, A.; Penner, R. 2-Aminoethoxydiphenyl Borate Directly Facilitates and Indirectly Inhibits Stim1-Dependent Gating of Crac Channels. J. Physiol. 2008, 586, 3061–3073. [Google Scholar] [CrossRef]
  90. Gibon, J.; Tu, P.; Bouron, A. Store-Depletion and Hyperforin Activate Distinct Types of Ca(2+)-Conducting Channels in Cortical Neurons. Cell Calcium 2010, 47, 538–543. [Google Scholar] [CrossRef]
  91. Krapivinsky, G.; Mochida, S.; Krapivinsky, L.; Cibulsky, S.M.; Clapham, D.E. The Trpm7 Ion Channel Functions in Cholinergic Synaptic Vesicles and Affects Transmitter Release. Neuron 2006, 52, 485–496. [Google Scholar] [CrossRef] [PubMed] [Green Version]
  92. Wei, W.L.; Sun, H.S.; Olah, M.E.; Sun, X.; Czerwinska, E.; Czerwinski, W.; Mori, Y.; Orser, B.A.; Xiong, Z.-G.; Jackson, M.; et al. Trpm7 Channels in Hippocampal Neurons Detect Levels of Extracellular Divalent Cations. Proc. Natl. Acad. Sci. USA 2007, 104, 16323–16328. [Google Scholar] [CrossRef] [PubMed] [Green Version]
  93. Inoue, K.; Branigan, D.; Xiong, Z.G. Zinc-Induced Neurotoxicity Mediated by Transient Receptor Potential Melastatin 7 Channels. J. Biol. Chem. 2010, 285, 7430–7439. [Google Scholar] [CrossRef] [PubMed] [Green Version]
  94. Fleig, A.; Chubanov, V. Trpm7. Handb Exp. Pharm. 2014, 222, 521–546. [Google Scholar] [CrossRef] [Green Version]
  95. Liu, Y.; Chen, C.; Liu, Y.; Li, W.; Wang, Z.; Sun, Q.; Zhou, H.; Chen, X.; Yu, Y.; Wang, Y.; et al. Trpm7 Is Required for Normal Synapse Density, Learning, and Memory at Different Developmental Stages. Cell Rep. 2018, 23, 3480–3491. [Google Scholar] [CrossRef]
  96. Thastrup, O.; Cullen, P.J.; Drøbak, B.K.; Hanley, M.R.; Dawson, A.P. Thapsigargin, a Tumor Promoter, Discharges Intracellular Ca2+ Stores by Specific Inhibition of the Endoplasmic Reticulum Ca2(+)-Atpase. Proc. Natl. Acad. Sci. USA 1990, 87, 2466–2470. [Google Scholar] [CrossRef] [Green Version]
  97. Di Capite, J.; Ng, S.W.; Parekh, A.B. Decoding of Cytoplasmic Ca(2+) Oscillations through the Spatial Signature Drives Gene Expression. Curr. Biol. 2009, 19, 853–858. [Google Scholar] [CrossRef] [Green Version]
  98. Kwan, C.Y.; Takemura, H.; Obie, J.F.; Thastrup, O.; Putney, J.W., Jr. Effects of Mech, Thapsigargin, and La3+ on Plasmalemmal and Intracellular Ca2+ Transport in Lacrimal Acinar Cells. Am. J. Physiol. 1990, 258, C1006–C1015. [Google Scholar] [CrossRef]
  99. Amer, M.S.; Li, J.; O’Regan, D.J.; Steele, D.S.; Porter, K.E.; Sivaprasadarao, A.; Beech, D.J. Translocon Closure to Ca2+ Leak in Proliferating Vascular Smooth Muscle Cells. Am. J. Physiol. Heart Circ. Physiol. 2009, 296, H910–H916. [Google Scholar] [CrossRef] [Green Version]
  100. Zima, A.V.; Bovo, E.; Bers, D.M.; Blatter, L.A. Ca(2)+ Spark-Dependent and-Independent Sarcoplasmic Reticulum Ca(2)+ Leak in Normal and Failing Rabbit Ventricular Myocytes. J. Physiol. 2010, 588, 4743–4757. [Google Scholar] [CrossRef]
  101. Du, H.; Ye, C.; Wu, D.; Zang, Y.Y.; Zhang, L.; Chen, C.; He, X.Y.; Yang, J.J.; Hu, P.; Xu, G.; et al. The Cation Channel Tmem63b Is an Osmosensor Required for Hearing. Cell Rep. 2020, 31, 107596. [Google Scholar] [CrossRef] [PubMed]
  102. Duan, J.; Li, Z.; Li, J.; Hulse, R.E.; Santa-Cruz, A.; Valinsky, W.C.; Krapivinsky, G.; Zhang, J.; Clapham, D.E. Structure of the Mammalian Trpm7, a Magnesium Channel Required During Embryonic Development. Proc. Natl. Acad. Sci. USA 2018, 115, E8201–E8210. [Google Scholar] [CrossRef] [PubMed] [Green Version]
Figure 1. Genes coding for voltage-gated and ligand-gated Ca2+ channels (VGCC and LGCC, respectively). The figure shows the expression of genes coding for the pore-forming subunits of VGCC (A); ionotropic glutamate receptor subunits (B); and adenosine triphosphate (ATP)/purinergic, 5-hydroxytryptamine (serotonin), and nicotinic acetylcholine receptor subunits (C). Throughout this study, the abundance of transcripts is presented in transcripts per million (TPM), and only genes displaying TPM values ≥ 2 were considered to be significantly expressed. Four ages were studied: embryonic days 11 (E11), 13 (E13), and 17 (E17), and post-natal day 1 (PN1). The mean +/− standard error of mean (SEM) is shown from n = 3 distinct biological samples. All the data presented were extracted from a genome-wide transcriptome sequencing (RNA-Seq) analysis (Hasna et al., 2019).
Cells 09 01800 g001
Figure 2. Genes coding for transient receptor potential (TRP), Orai, Piezo, TMEM120, and acid-sensing ion channel (ASIC) channels. The figure shows the expression of genes coding for TRP channels (A), and Orai, Piezo, TMEM120A, and ASIC1 channels (B). The mean +/− standard error of mean (SEM).
Cells 09 01800 g002
Figure 3. Genes coding for inositol 1,4,5-trisphosphate and ryanodine receptors (IP3R and RyR, respectively), and two-pore channels (TPC) and leak channels. In this figure the expression of genes coding for IP3 and ryanodine receptors, and two-pore channels (A) and the putative leak channels (see text) (BE) are shown. For the sake of clarity, the results were plotted on different graphs due to the large range of transcripts per million (TPM) values (from <10 to >500 TPM).
Cells 09 01800 g003
Figure 4. Genes coding for Ca2+ pumps, exchangers, antiporters, mitochondrial actors, and connexins. Genes coding for plasma membrane Ca2+ ATPase (PMCA), sarco/endoplasmic reticulum Ca2+ ATPases (SERCA), and secretory pathway Ca2+-ATPase (SPCA) are presented in panel (A). Panel (B) shows the expression of genes coding for non-mitochondrial Na+/Ca2+ exchangers (NCX). Panels (C,D) present the Ca2+/H+ antiporter TMEM165 and mitochondrial actors, respectively. Panel (E) gives an overview of the genes coding for connexins.
Cells 09 01800 g004
Figure 5. Presence of functional Ca2+ channels at E13. Live-cell Ca2+ and Zn2+ imaging experiments were conducted to assess the presence of functional Ca2+-transport systems in dissociated E13 cortical cells loaded with Fluo-4 (A,C,D) or FluoZin-3 (B). The baseline Fluo-4 (or FluoZin-3) fluorescence was recorded for 1 min and averaged (F0). Changes in the Fluo-4 (or FluoZin-3) fluorescence (F) over time were expressed as F/F0. Mean +/− SEM. When not visible, the error bars are smaller than the symbols. Figure 5A shows Fluo-4 signals recorded following the application of 50 µM 2-APB to primary E13 cortical neurons maintained in a nominally Ca2+-free saline (filled circles, n = 77 cells/5 dishes) and in a 2 mM Ca2+-containing saline (open circles, n = 66 cells/4 dishes). For the sake of clarity, only one point of three is shown. Figure 5B, the presence of functional TRPM7 channels was assessed using the fluorescent Zn2+ probe FluoZin-3. The recording saline contained 2 mM Ca2+ and 1 mM Mg2+ and was supplemented with Zn acetate (100 µM) when indicated (arrow, time 0) (filled circles, n = 112 cells/6 dishes). In additional experiments, the recording saline was switched to a nominally Ca2+- and Mg2+-free saline 4 min prior to the addition of zinc acetate (time 0) without (gray triangles, n = 167 cells/7 dishes) or with 5 µM GdCl3 (open squares, n = 101 cells/5 dishes). One point of four is shown. As displayed in Figure 5C, in these experiments, a nominally Ca2+-free saline was used to rule out the contribution of external sources of Ca2+. Thapsigargin (Tg, 200 nM), a blocker of SERCA, was applied when indicated (vertical arrow) either alone (open circles, n = 117 cells/6 dishes) or together with 100 µM LaCl3 (filled triangles, n = 81 cells/4 dishes). The protein synthesis inhibitor anisomycin (500 µM for 1 h/37 °C) did not affect the Tg-evoked Ca2+ signal (gray squares, n = 109 cells/5 dishes). One point of three is shown. Figure 5D shows how puromycin (250 µM) was applied to cells kept in a nominally Ca2+-free saline (horizontal gray bar). Tg was also added (arrow) to ensure that cells had replete Ca2+ stores (n = 89 cells/5 dishes); one point of three is shown
Cells 09 01800 g005
Figure 6. Ca2+ transport system during corticogenesis. Graphical summary of the key results of this RNA-Seq analysis. The data are derived from Table 1 and Table 2, uncovering the list of the 10 most expressed genes at a given age. The scheme shows the gene products (and their putative subcellular localization) of the most expressed genes and their differential expression pattern between the beginning (E11–E13) and the end of neurogenesis (E17–PN1). On top are the Ca2+ transport systems deriving from genes coding for cell surface proteins that are highly expressed throughout corticogenesis. At the bottom are the cell surface Ca2+ transport systems coded by genes displaying a high expression profile at the onset of corticogenesis (E11–E13) (left panel) and end of corticogenesis (E17PN1) (right panel). The expression profile of the most prominent genes coding for internal Ca2+ transport systems is also shown. Blue and black arrows: actors contributing to elevate and decrease [Ca2+]i, respectively. Red arrows: actors permitting a bidirectional transport (uptake/export) of Ca2+, or between adjacent cells. Collectively this gives an overview of the most abundant transcripts found in the cortical wall during neurogenesis.
Cells 09 01800 g006
Table 1. List of the top 10 genes coding for plasma membrane Ca2+ transport systems. Ranking is also given./means not present in the top 10 list at a given age. The analysis encompasses a total of 17 genes.
Ca Transport SystemGeneProteinRank Number
E11E13E17PN
ConnexinsGja1CX4311//
ConnexinsGjc1CX4522//
ConnexinsGja4CX3734//
Voltage-gated channelsCacna1gCav3.1610//
Other channelsTrpm7TRPM789//
Store-operated channelsOrai3Orai377//
ExchangerSlc8a2NCX2/863
ConnexinsGjd2CX36//8/
Voltage-gated channelsCacna1hCav3.2//48
Ligand-gated channelsGrin1GluN1//71
Ligand-gated channelsP2rx2P2X2///7
Store-operated channelsOrai2Orai2//910
Acid-sensing channelsAsic1ASIC1//56
Ligand-gated channelsChrnb2nAChR β210312
Ligand-gated channelsGrik5GluK55535
Mechanosensitive channelsTmem120ATACAN4624
PumpAtp2b1PMCA19/109
Blue and green: genes that predominate at the onset and end of corticogenesis. Red: gene with a high expression level after the onset of corticogenesis. Yellow: major genes at all stages.
Table 2. List of the top 10 genes coding for intracellular Ca2+ transport systems.
Ca Transport SystemGeneProteinRank Number
E11E13E17PN1
« Leak » pathwaysTmem109TMEM1099///
« Leak » pathwaysTmco6TMCO6/10//
TransporterTmem165TMEM16579//
« Leak » pathwaysSec61bSEC61B6610/
« Leak » pathwaysPanx1PANX1//66
Mitochondrial actorLetm1LETM1//99
« Leak » pathwaysLrrc8bLRRC8B///10
« Leak » pathwaysTmbim3TMBIM32111
« Leak » pathwaysTmbim5TMBIM54455
« Leak » pathwaysSec61a1SEC61A11234
« Leak » pathwaysSec61a2SEC61A28888
« Leak » pathwaysTmbim6TMBIM63323
ChannelsTrpml1TRPML110777
PumpAtp2a2SERCA25542
Ranking is also given. / means not present in the top 10 list at a given age. The analysis encompasses a total of 14 genes. Blue and green: genes that predominate at the onset and end of corticogenesis. Pink: gene with a high expression level during corticogenesis but not after the completion of neurogenesis. Yellow: major genes at all stages.

