miRTil: An Extensive Repository for Nile Tilapia microRNA Next Generation Sequencing Data

 , ,
, ,  and
and 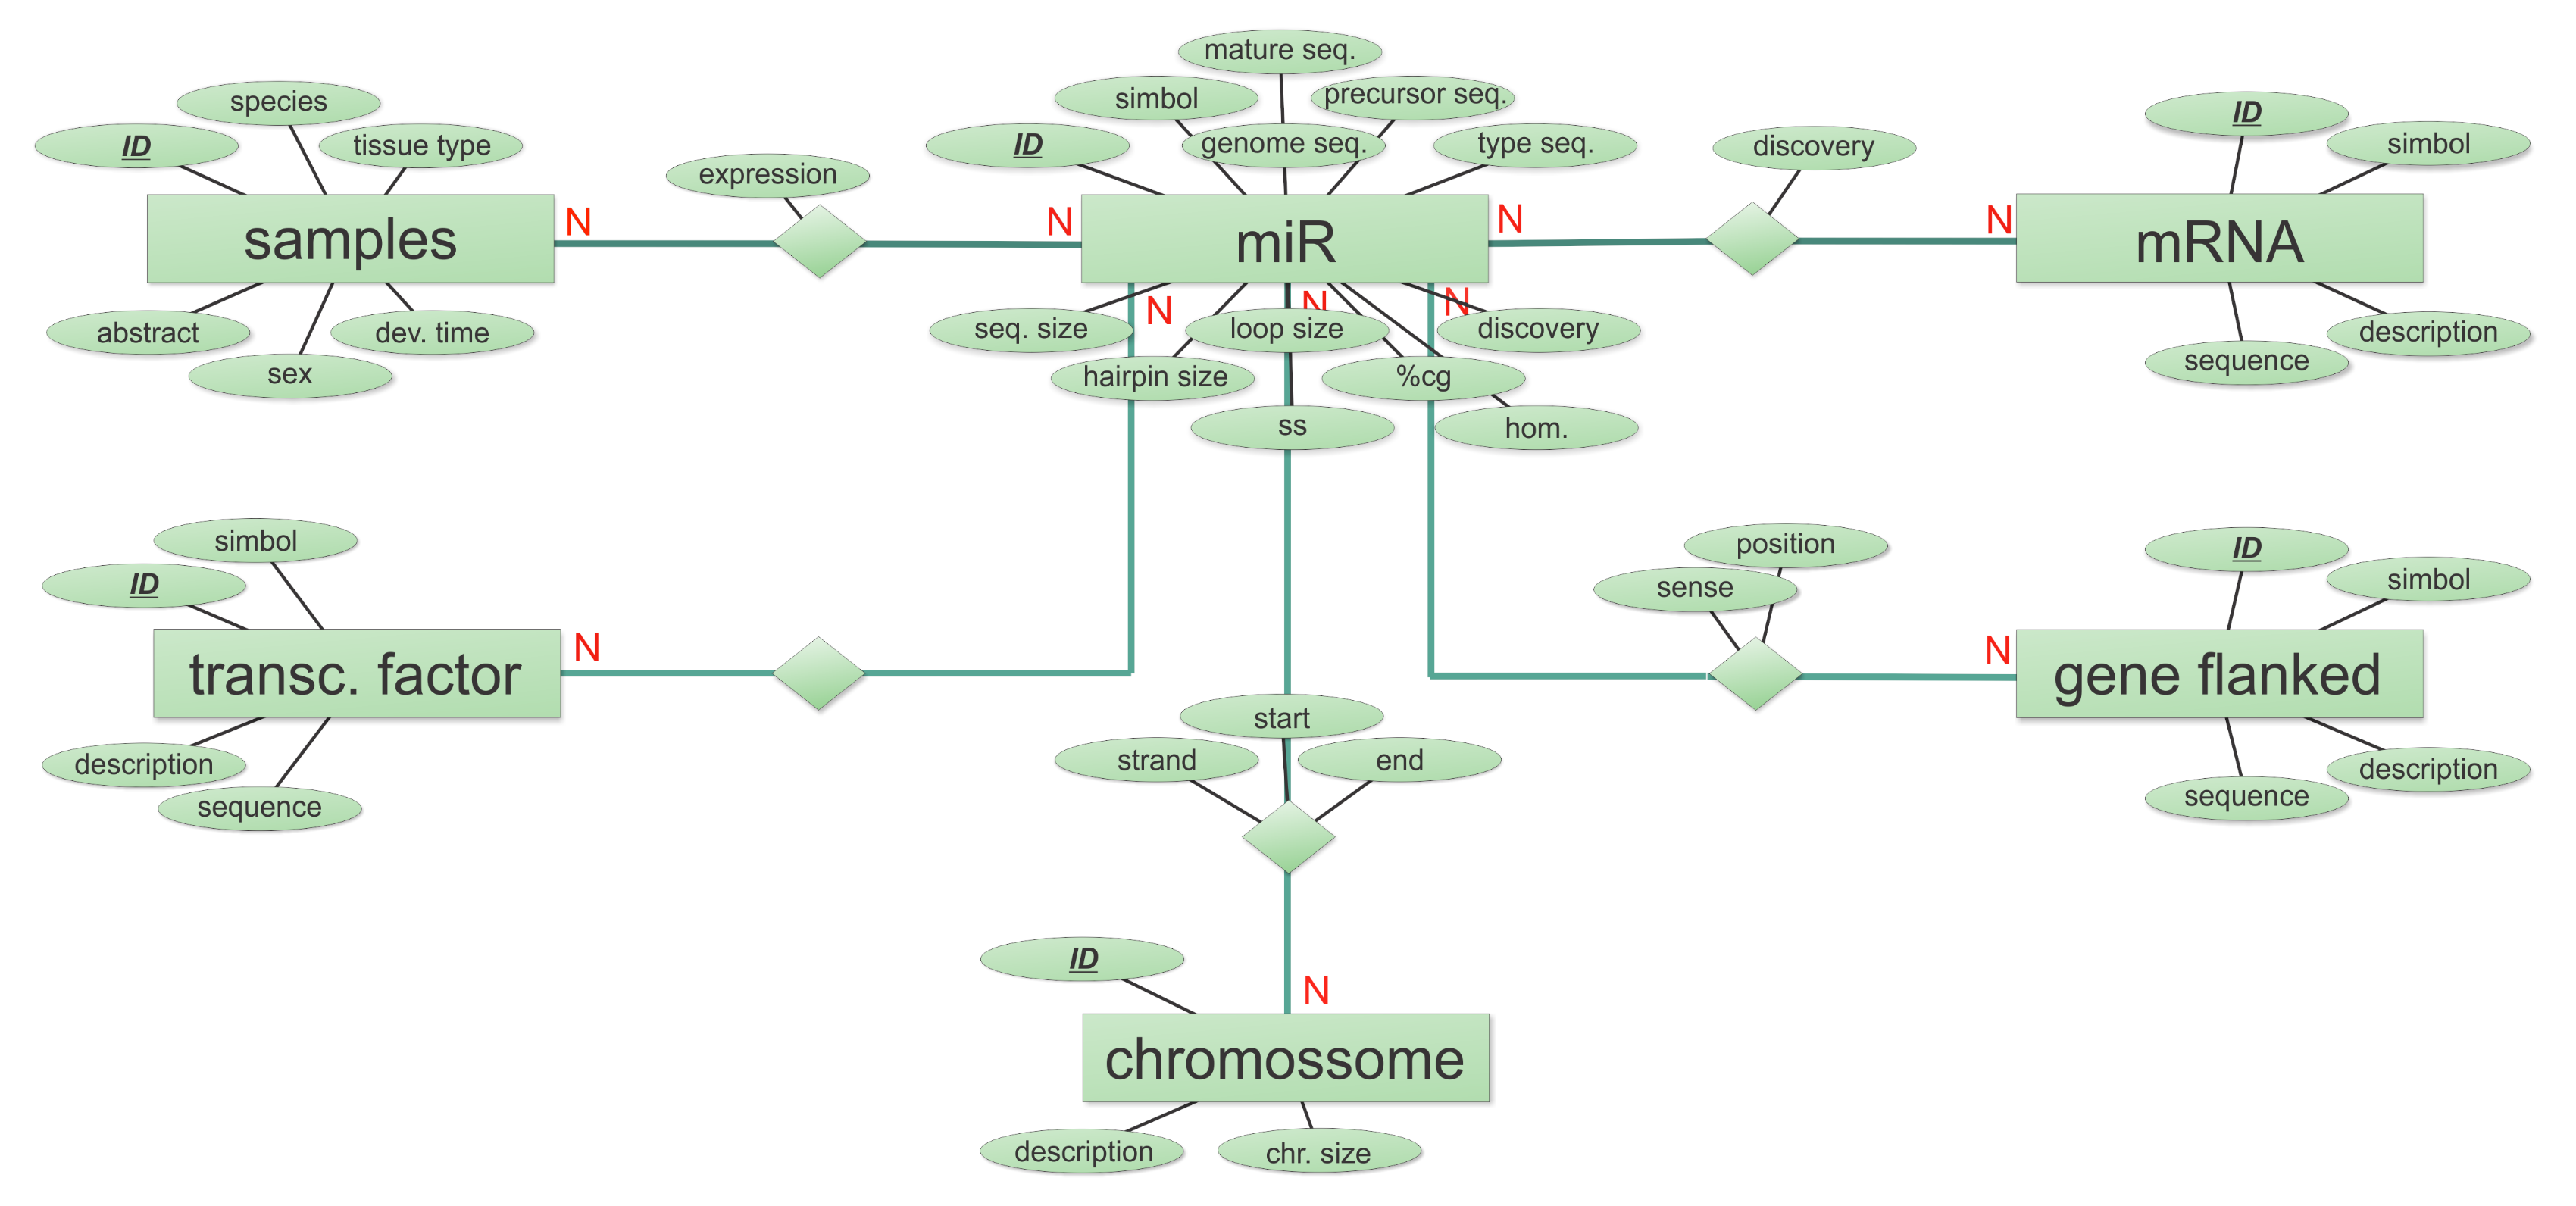
Abstract
1. Introduction
2. Results
2.1. Database Structure
2.2. Database Content
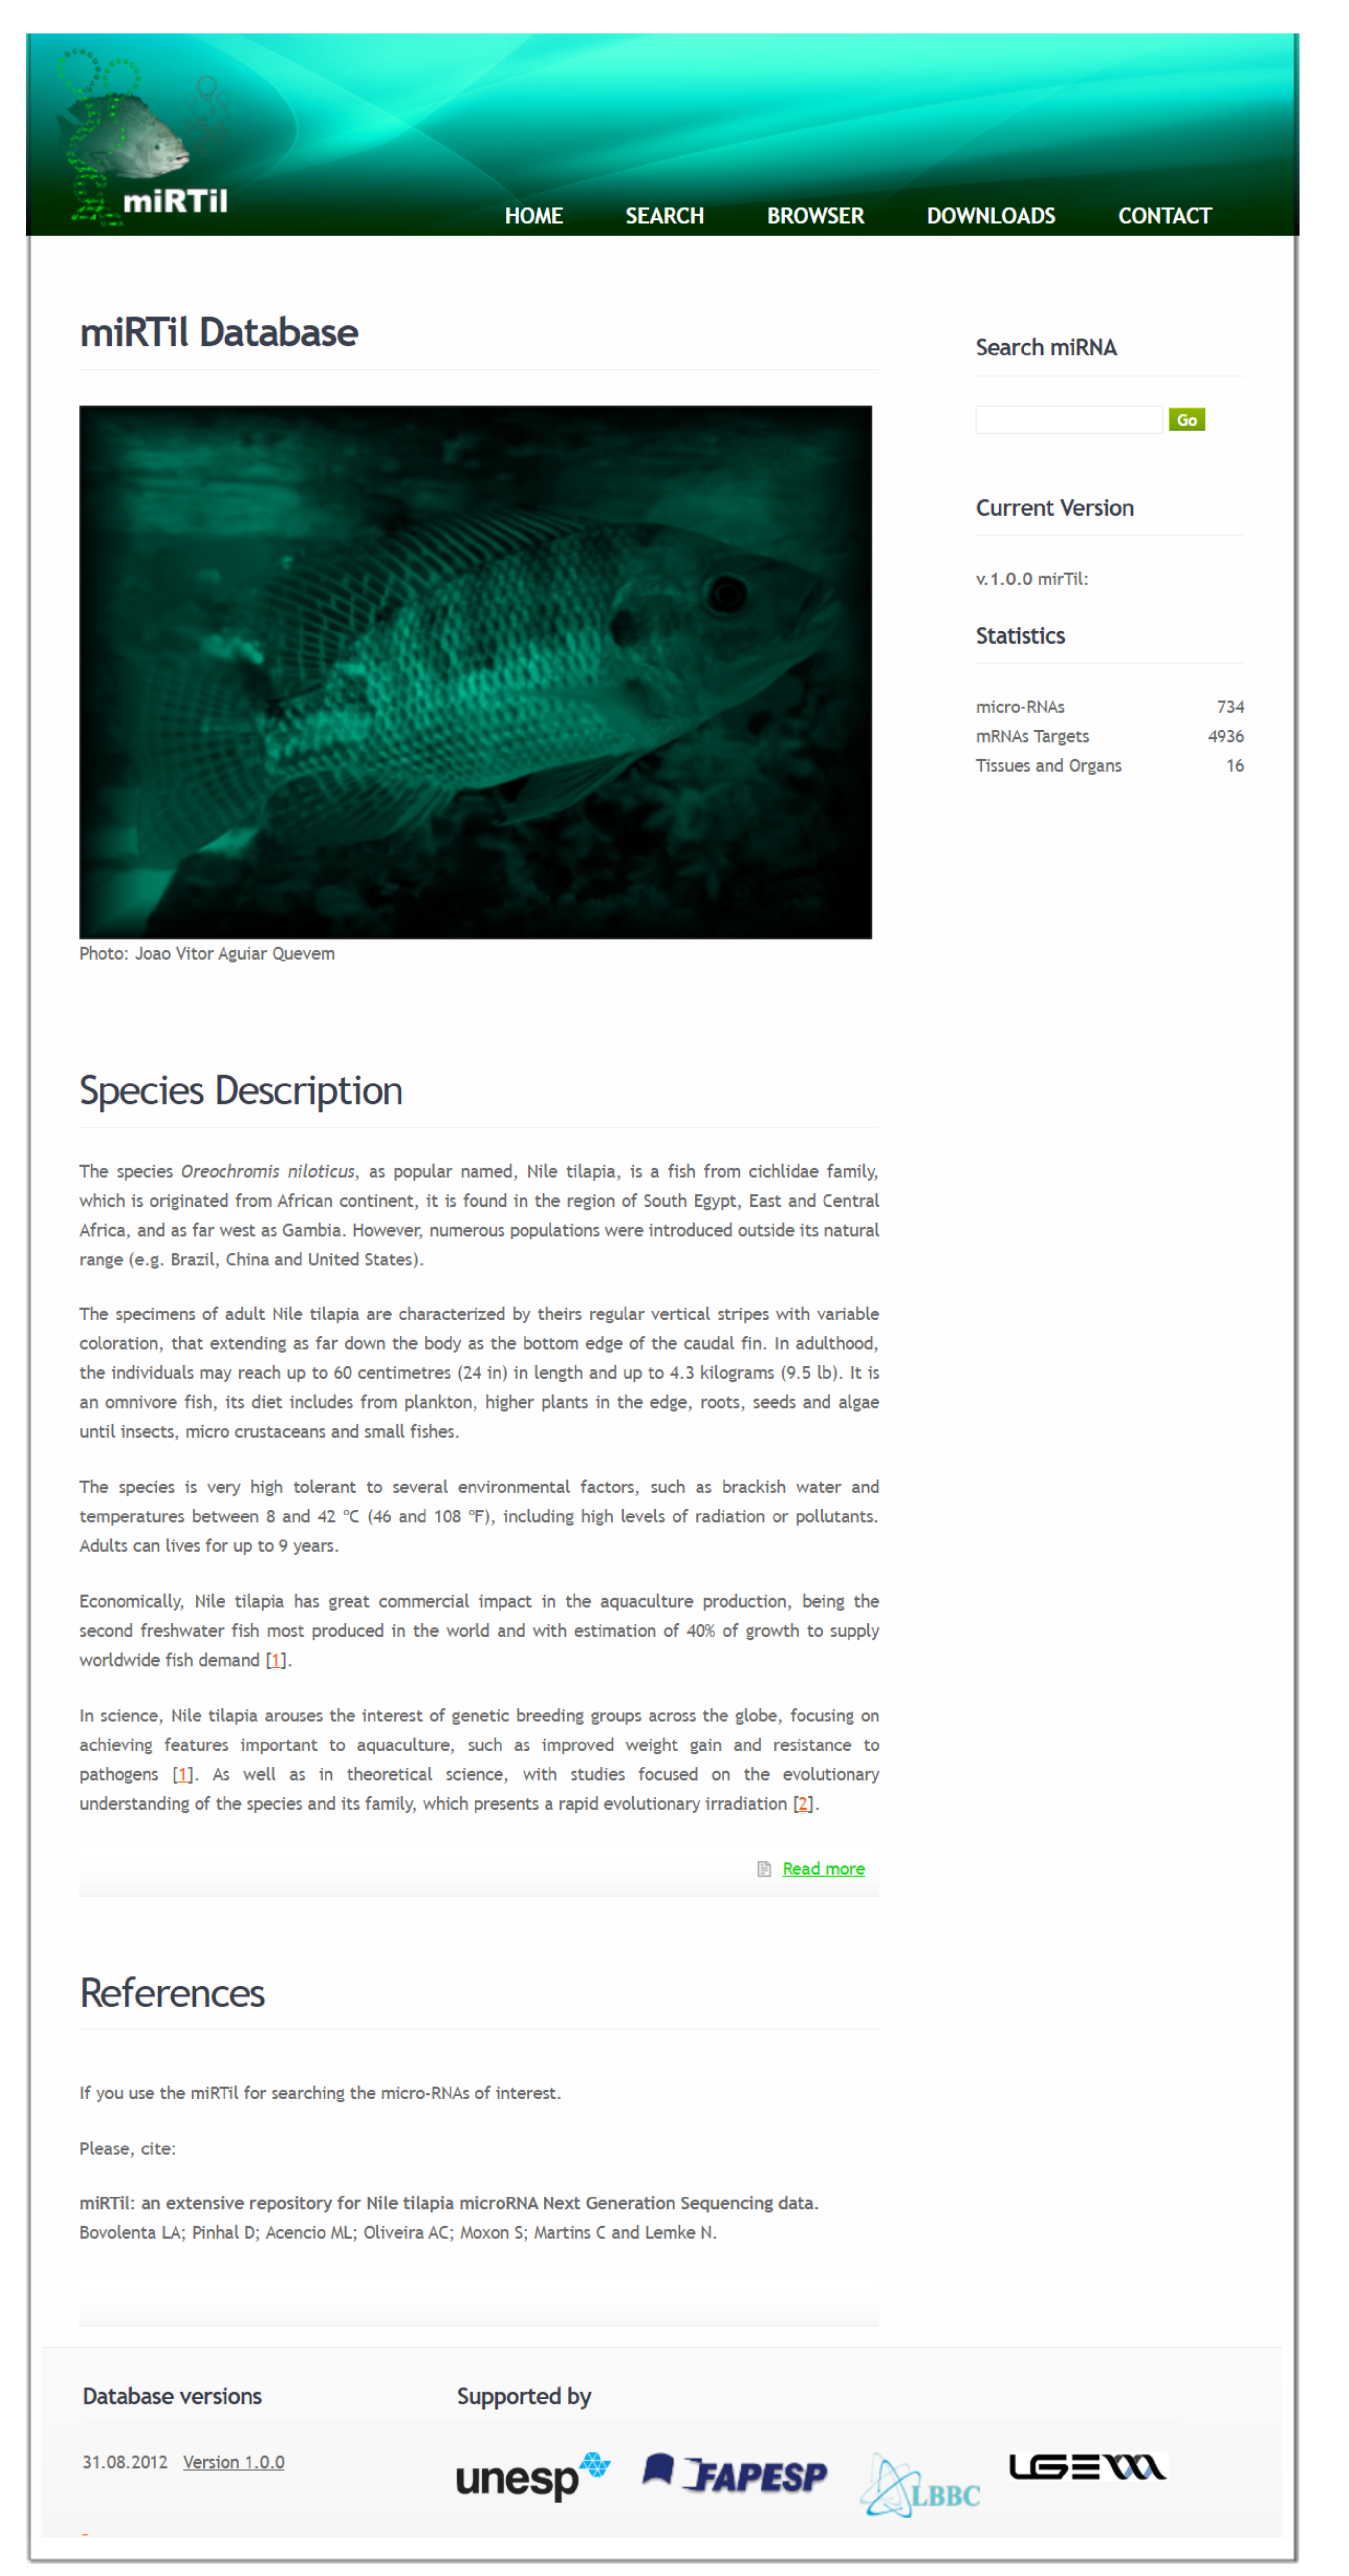
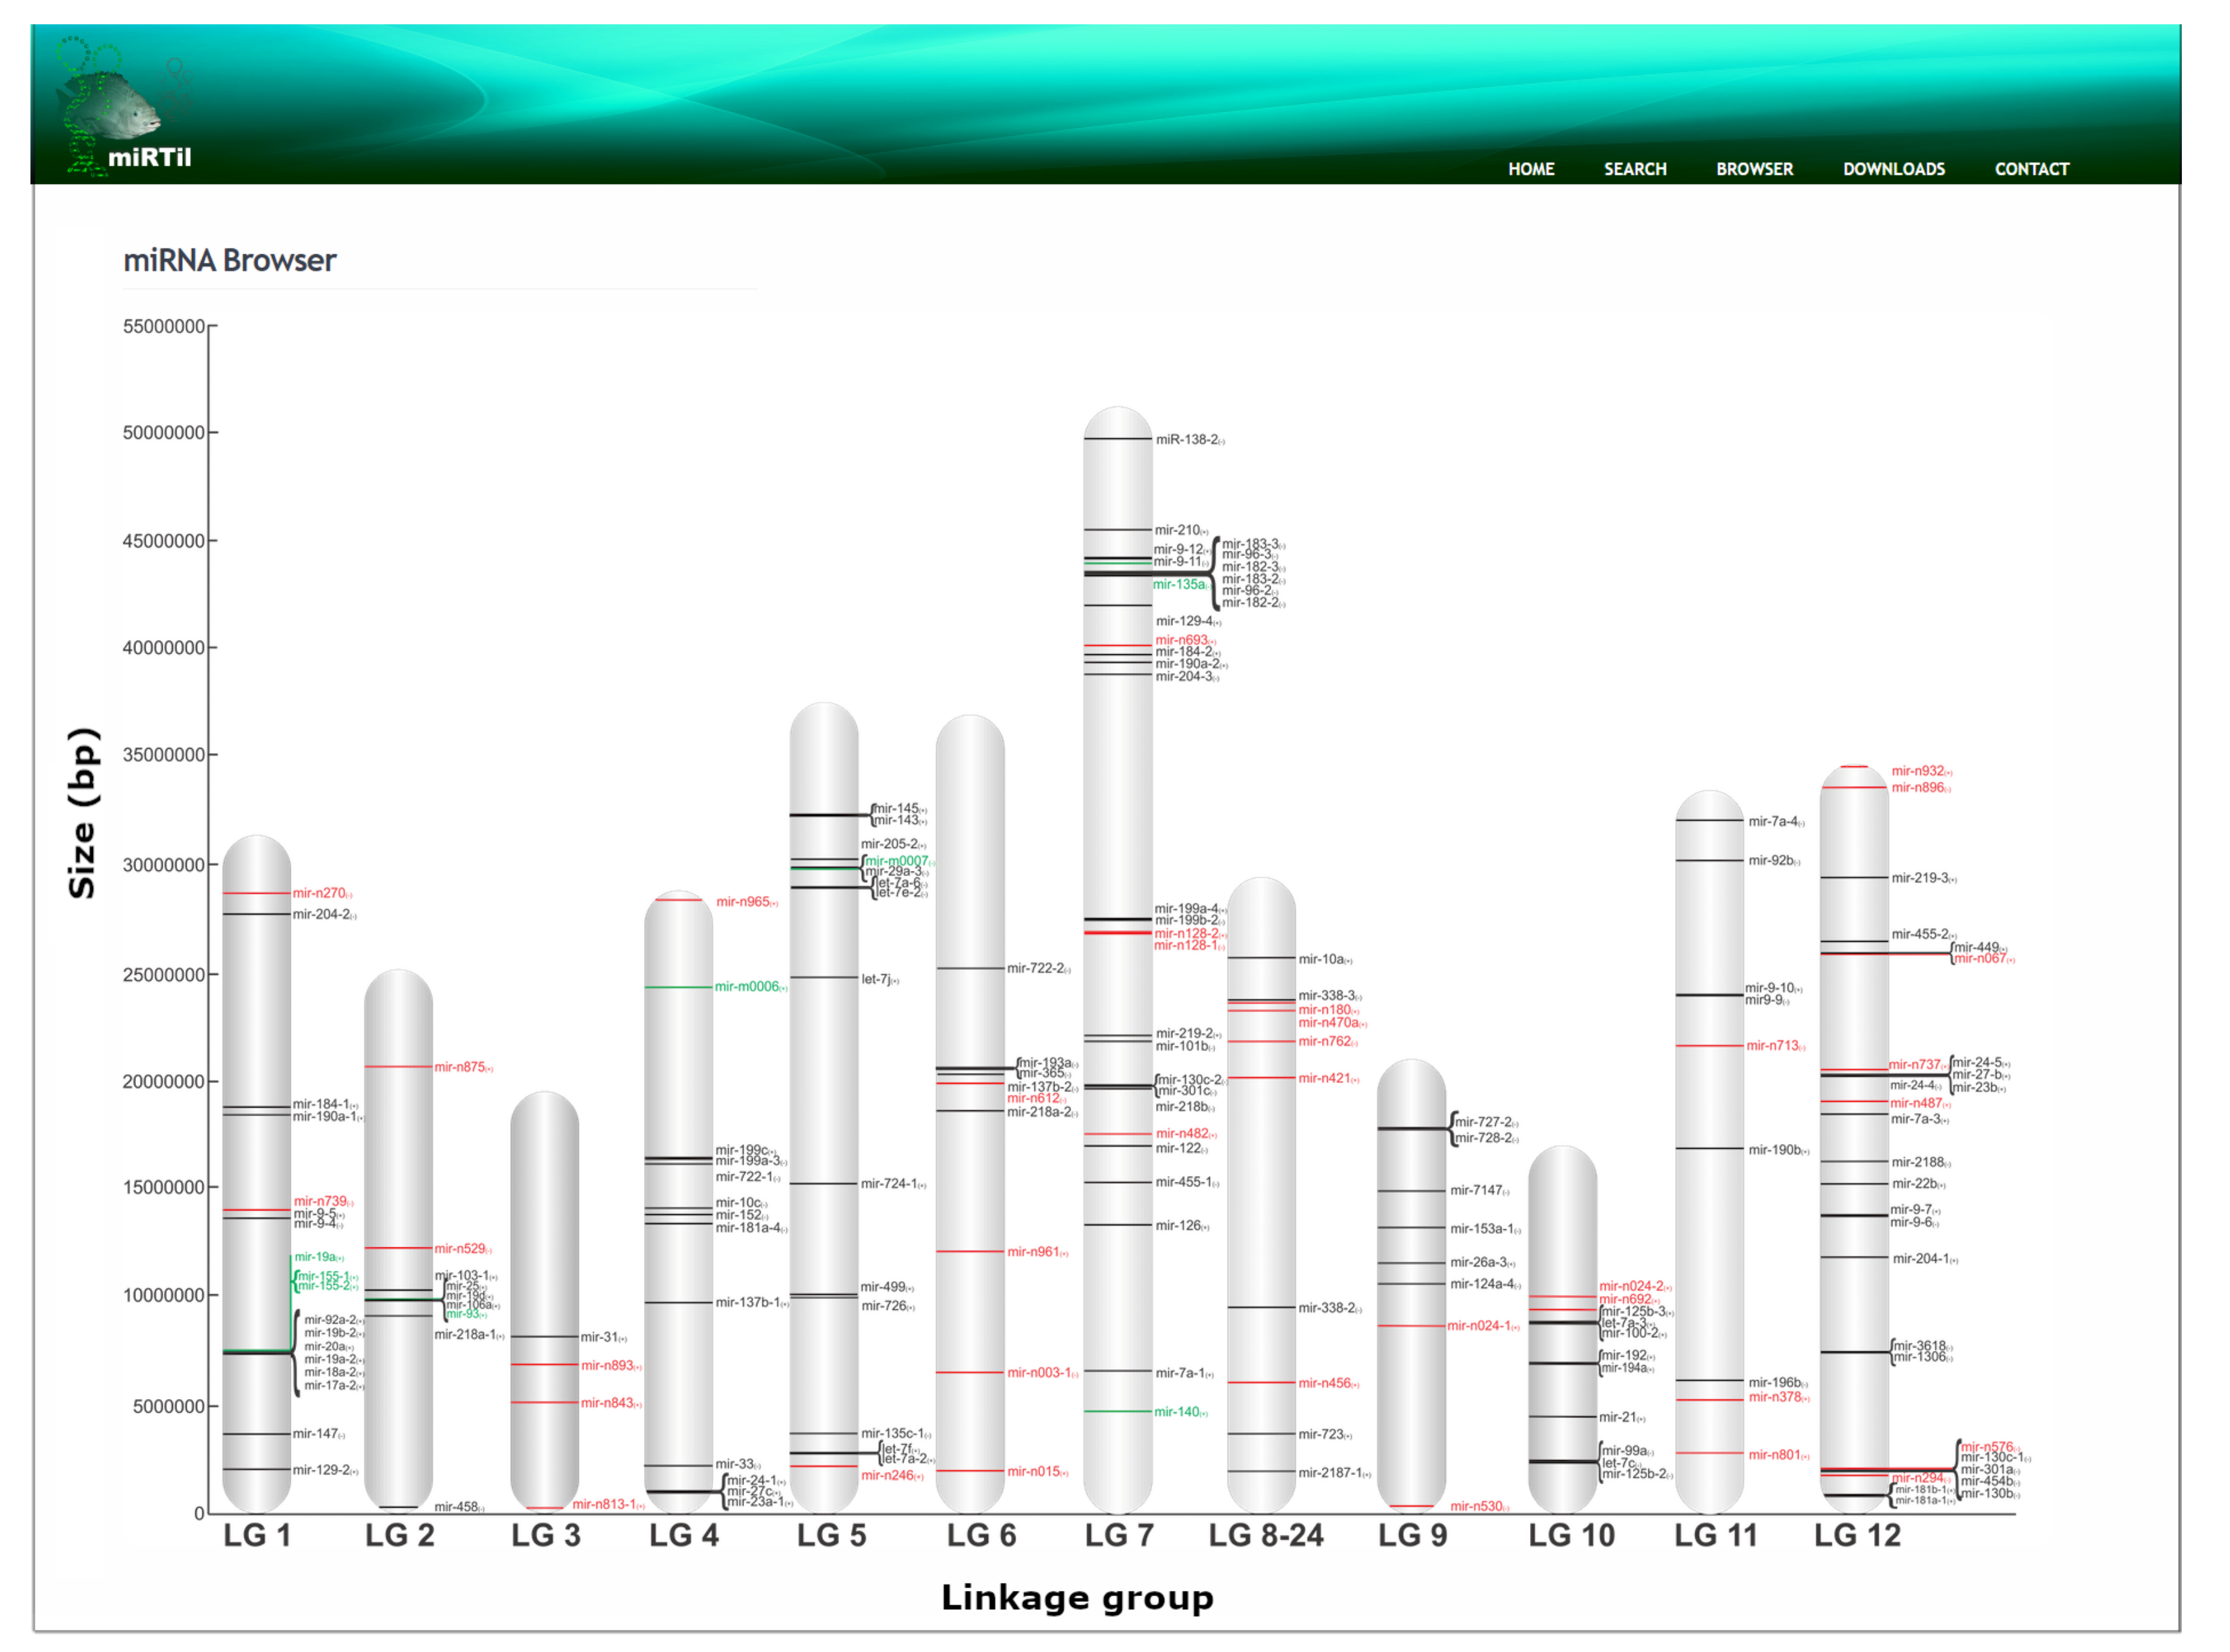
2.3. Data Access and Interface Functionalities
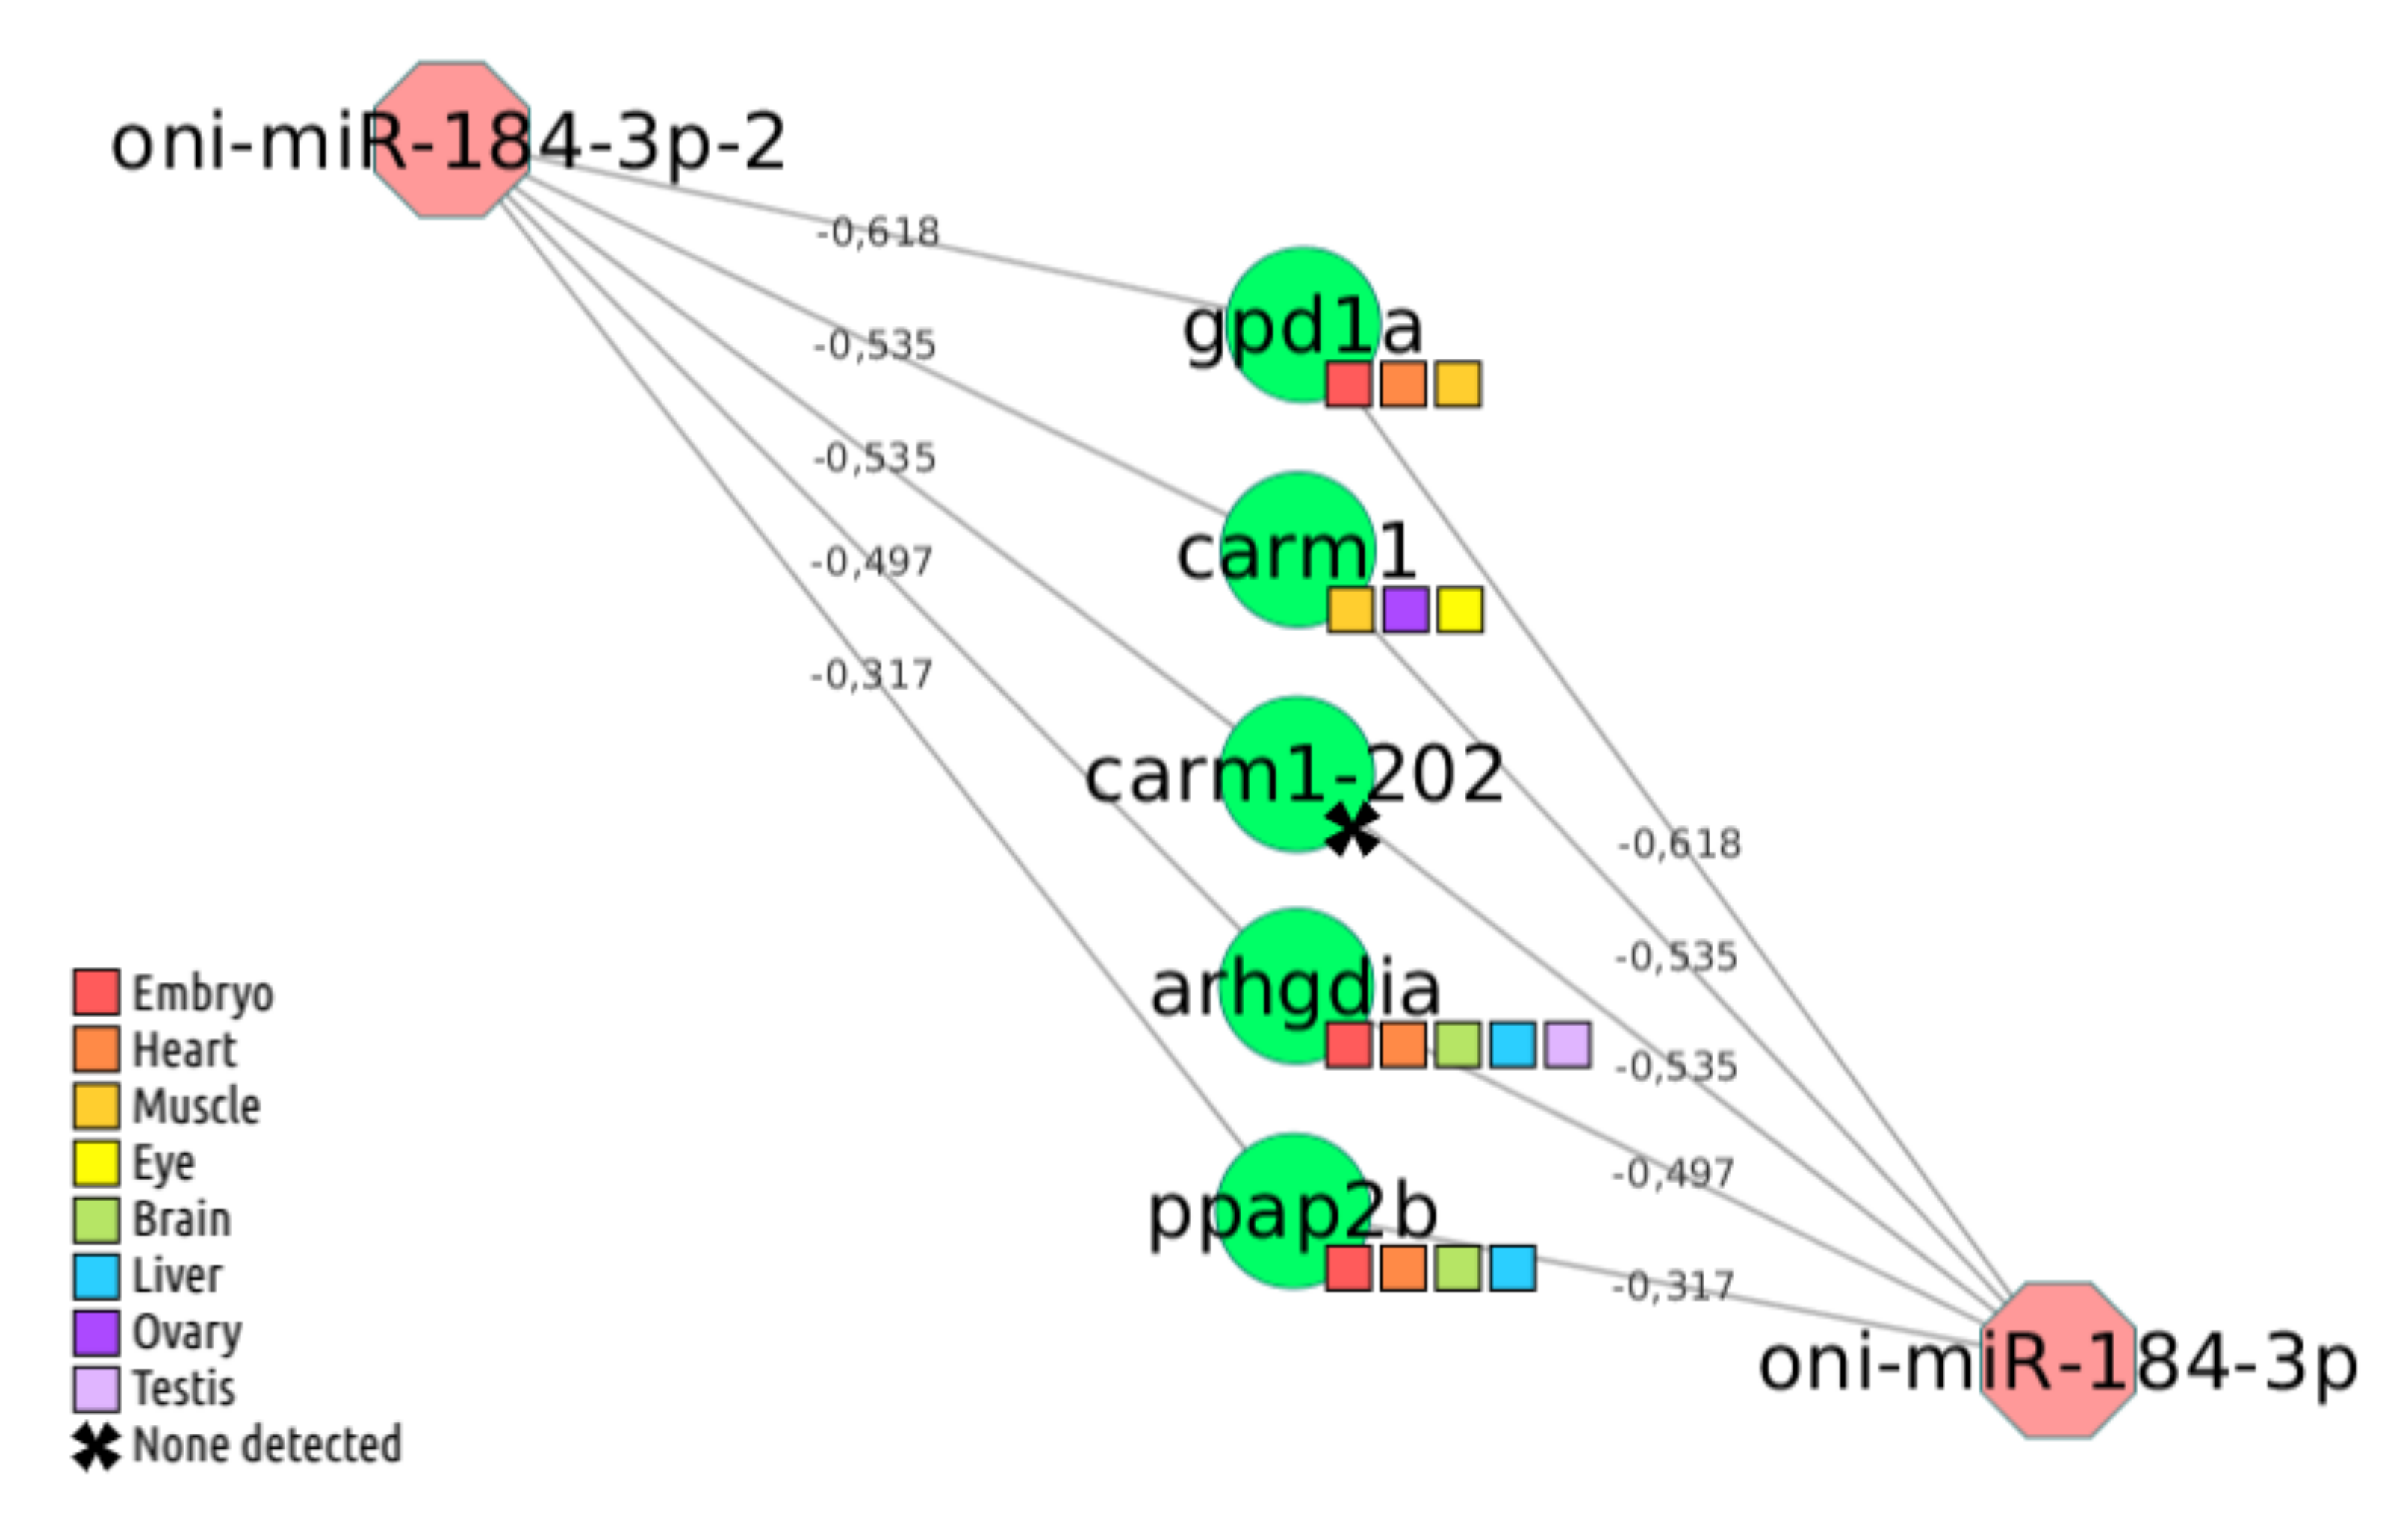
2.4. Case Studies
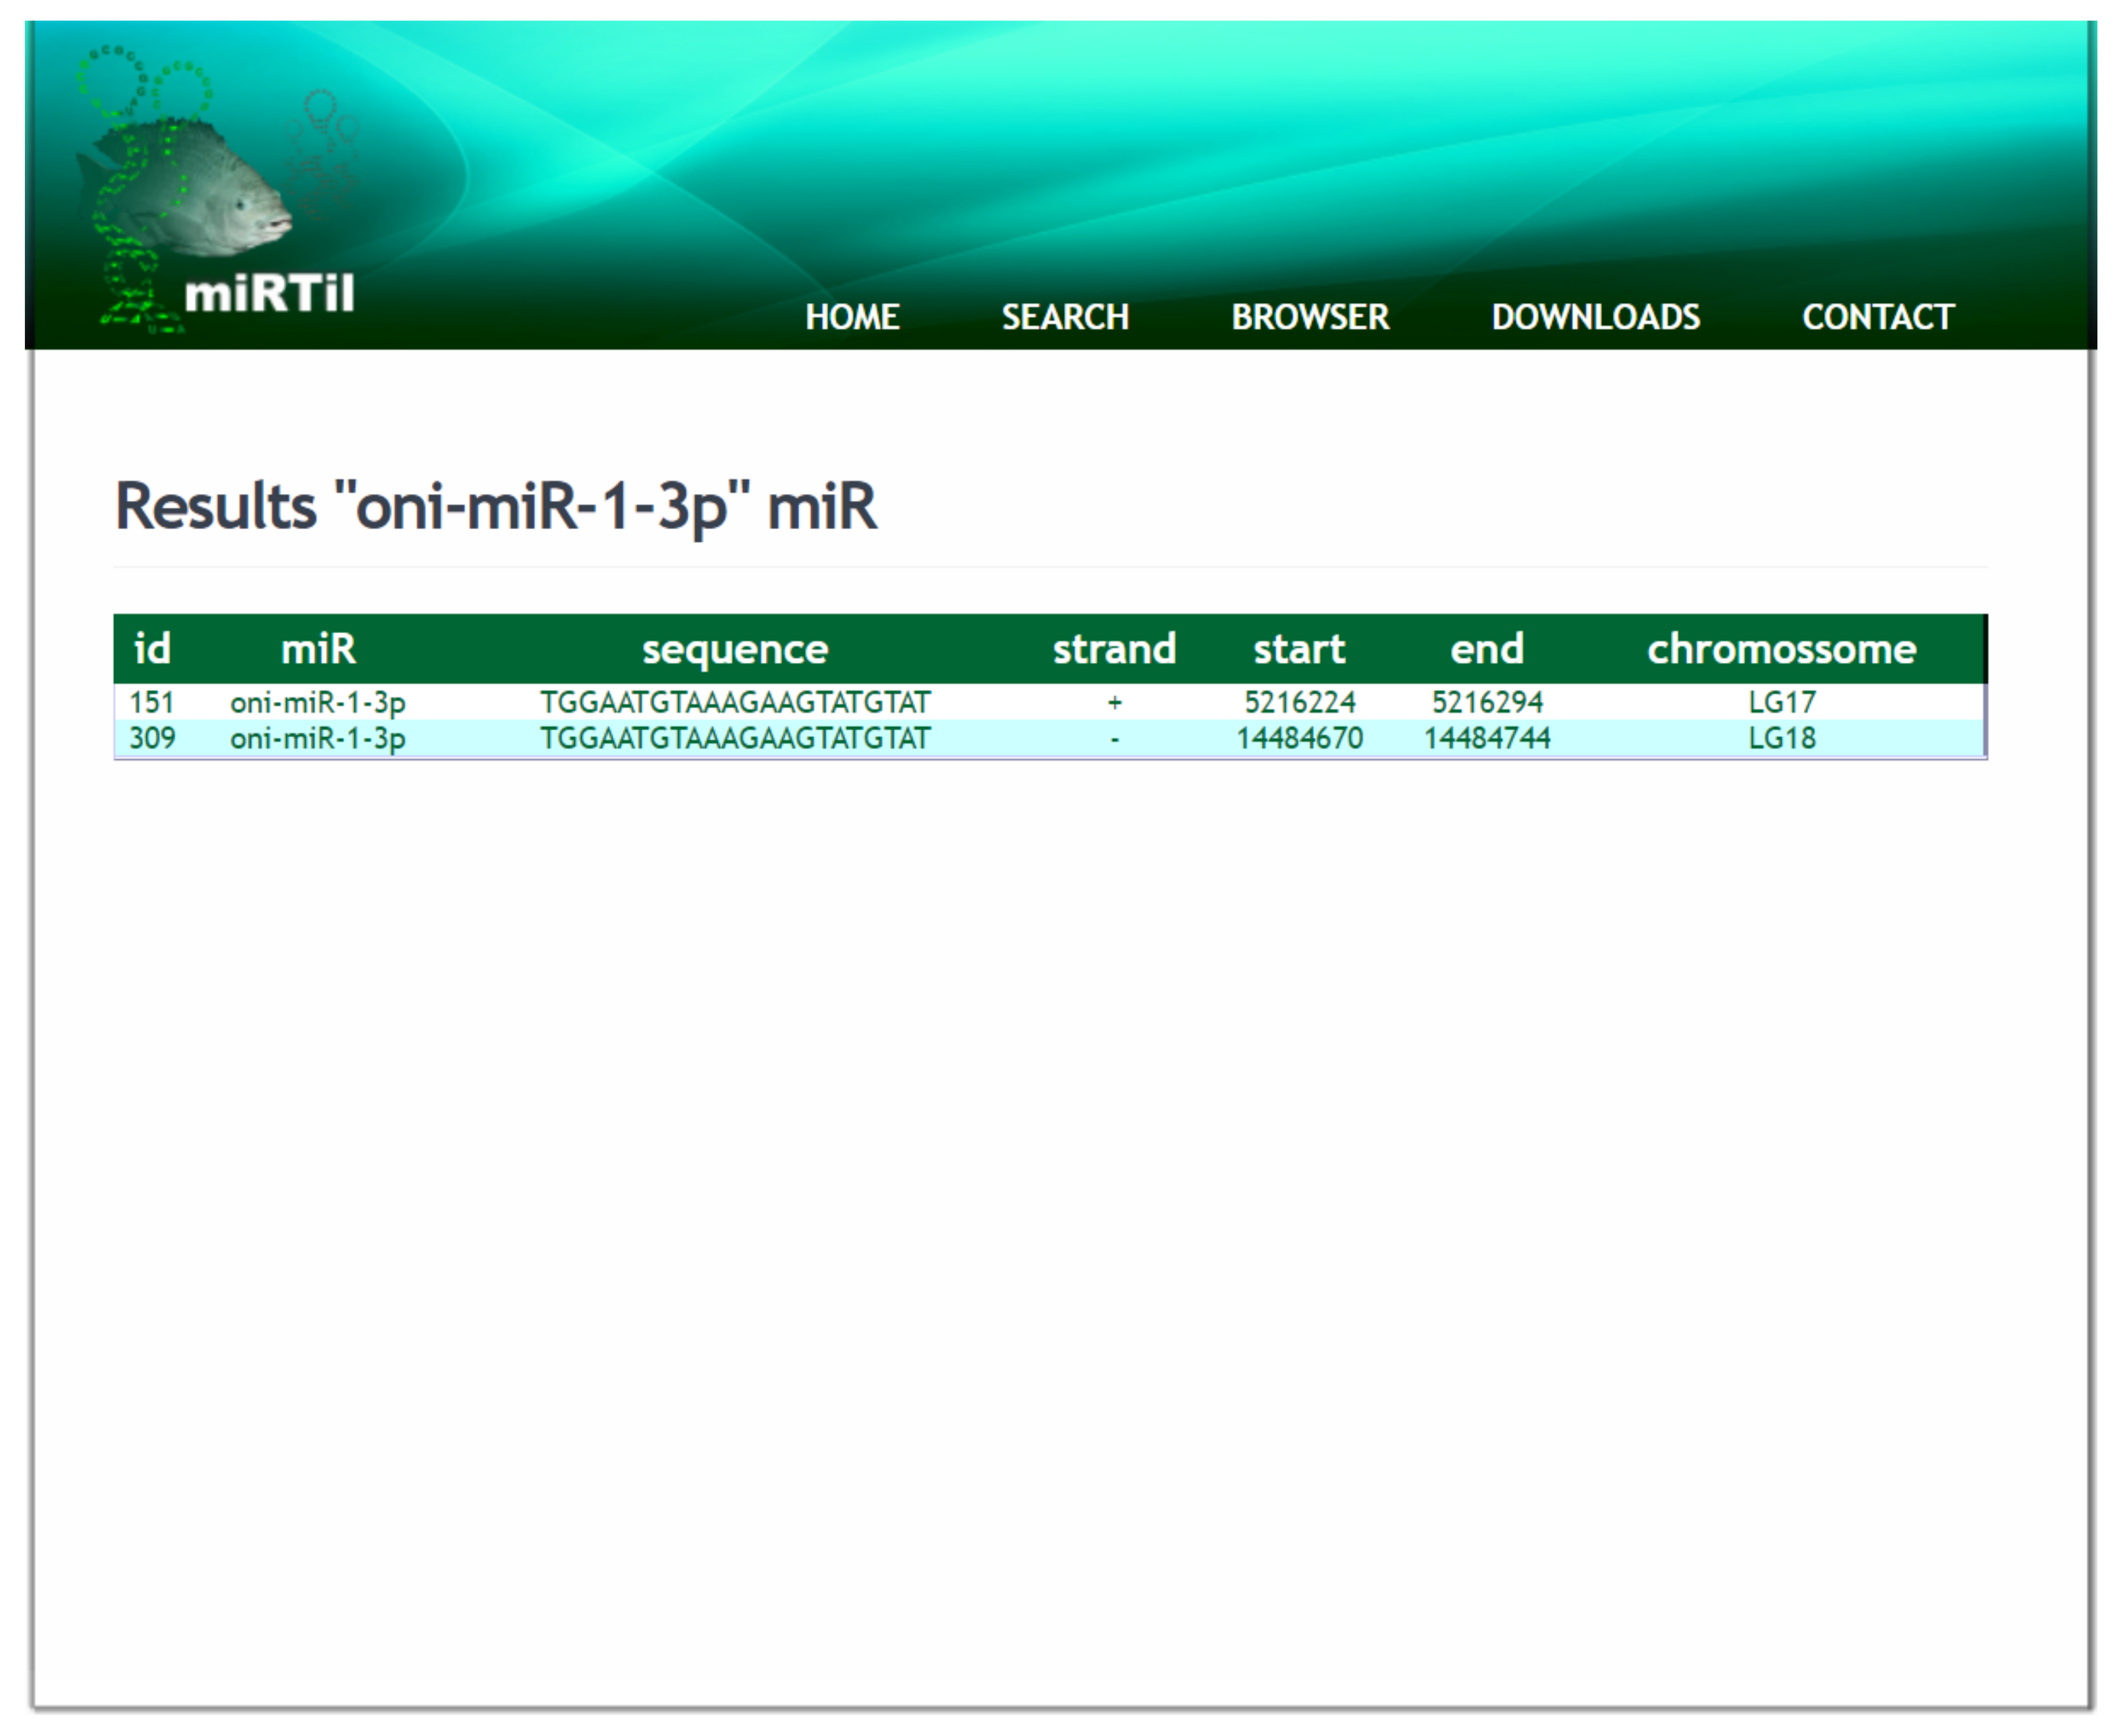
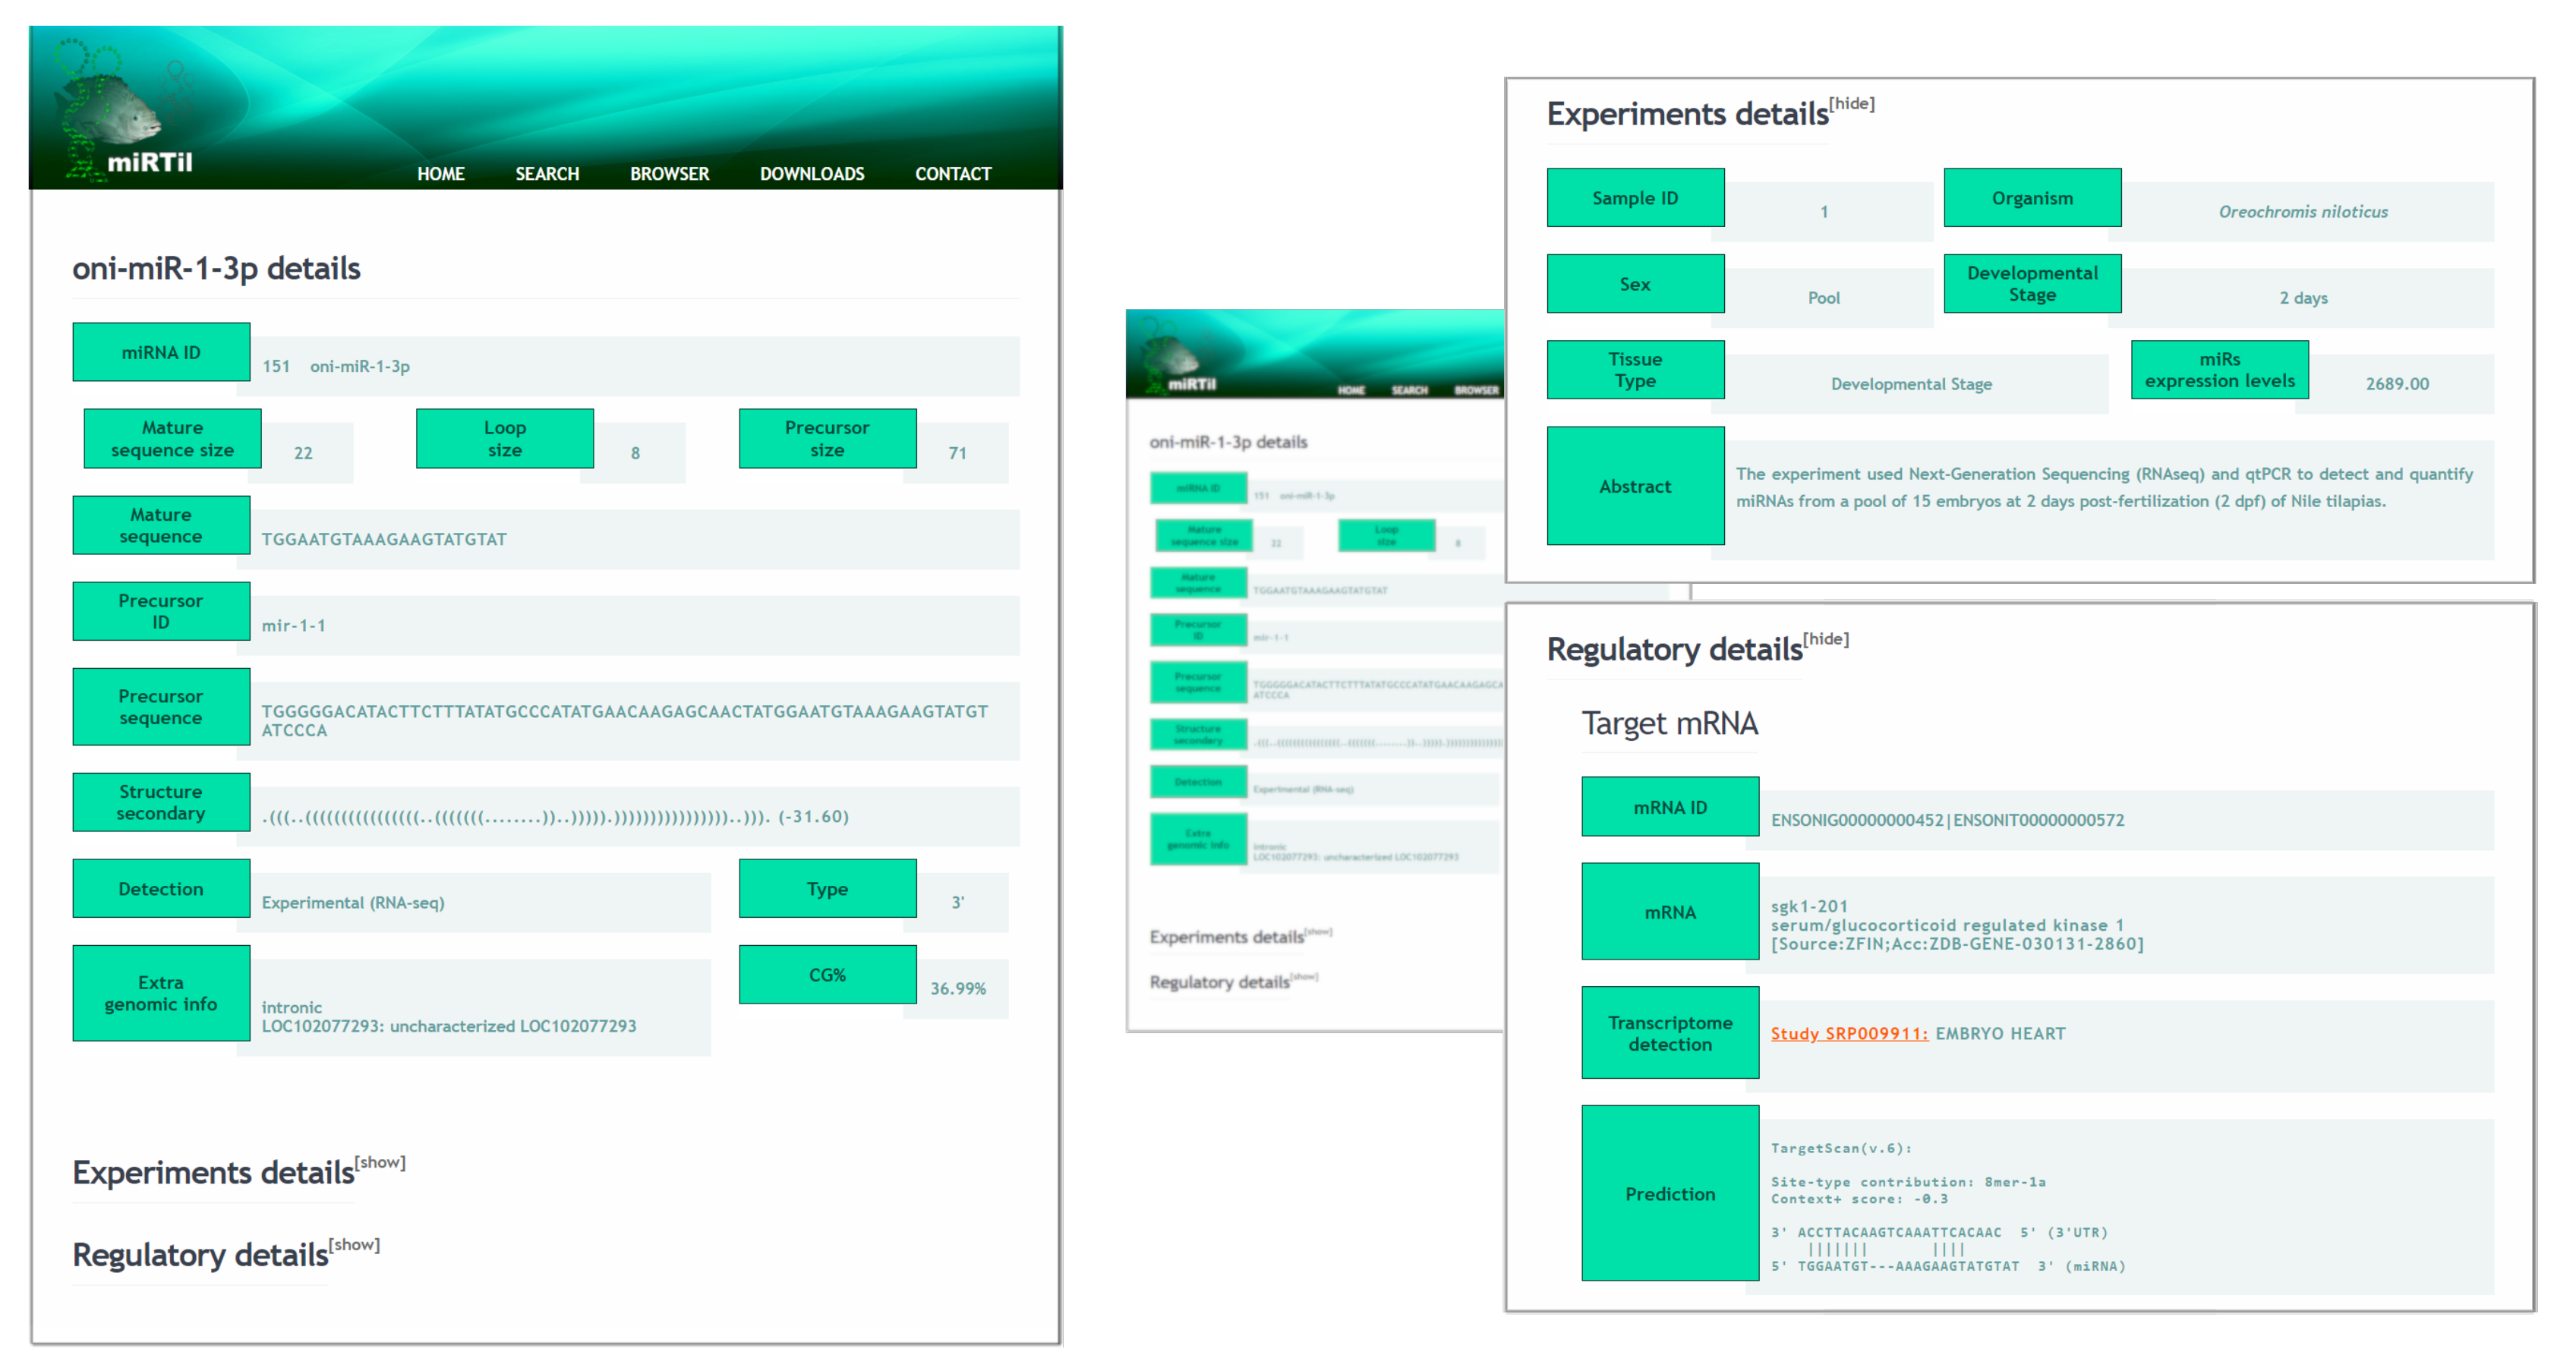
2.4.1. ID or miRNA Name Symbol Search Mechanism
2.4.2. Genomic Location Search Mechanism
2.4.3. Sample Search Mechanism
3. Discussion
4. Materials and Methods
4.1. Database Structure and User Interface
4.2. Database Content
4.3. Target Prediction
4.4. Genomic Structure and Context
5. Conclusions
Supplementary Materials
Author Contributions
Funding
Acknowledgments
Conflicts of Interest
Abbreviations
| miRNA | microRNA |
| mRNA | messenger RNA |
| UTR | Untranslated region |
| MFE | Minimum free energy |
| ERD | Entity-Relationship Diagram |
| ER | Entity-Relationship Model |
| MRE | microRNA-recognition element |
| LG | Linkage group |
| ID | Identification number |
| DNA | Deoxyribonucleic acid |
| RNA | Ribonucleic acid |
| FmMiRNADb | Foxtail millet microRNA database |
| AppleGFDB | Apple gene function and gene family database |
| WMP | Wheat miRNA database |
| pre-miRNA | microRNA precursor |
| GO | Gene Ontology |
| EST | Expressed sequence tag |
| IDE | Integrated Development Environment |
| JDK | Java Development Kit |
| SQL | Structured Query Language |
| RT-qPCR | Quantitative reverse transcription polymerase chain reaction |
| dpf | Day post-fertilization |
| SRA | Short read archive |
| FPKM | Fragments per kilobase of transcript per million mapped reads |
| GEO | Gene Expression Omnibus |
| bps | Base pairs |
References
- FAO. A-6 World Aquaculture Production of Fish, Crustaceans, Molluscs, etc., by Principal Species in 2017. In Fishery and Aquaculture Statistics. Available online: http://www.fao.org/fishery/static/Yearbook/YB2017_USBcard/root/aquaculture/a6.pdf (accessed on 19 May 2020).
- Ponzoni, R.W.; Nguyen, N.H.; Khaw, H.L.; Hamzah, A.; Bakar, K.R.A.; Yee, H.Y. Genetic improvement of Nile tilapia (Oreochromis niloticus) with special reference to the work conducted by the WorldFish Center with the GIFT strain. Rev. Aquac. 2011, 3, 27–41. [Google Scholar] [CrossRef]
- Haque, M.R.; Islam, M.A.; Wahab, M.A.; Hoq, M.E.; Rahman, M.M.; Azim, M.E. Evaluation of production performance and profitability of hybrid red tilapia and genetically improved farmed tilapia (GIFT) strains in the carbon/nitrogen controlled periphyton-based (C/N- CP) on-farm prawn culture system in Bangladesh. Aquac. Rep. 2016, 4, 101–111. [Google Scholar] [CrossRef]
- Cai, W.Q.; Li, S.F.; Ma, J.Y. Diseases resistance of Nile tilapia (Oreochromis niloticus), blue tilapia (Oreochromis aureus) and their hybrid (female Nile tilapia x male blue tilapia) to Aeromonas sobria. Aquaculture 2004, 229, 79–87. [Google Scholar] [CrossRef]
- Marjanovic, J.; Mulder, H.A.; Khaw, H.L.; Bijma, P. Genetic parameters for uniformity of harvest weight and body size traits in the GIFT strain of Nile tilapia. Genet. Sel. Evol. 2016, 48, 41. [Google Scholar] [CrossRef]
- Garcia, A.L.S.; de Oliveira, C.A.L.; Karim, H.M.; Sary, C.; Todesco, H.; Ribeiro, R.P. Genetic parameters for growth performance, fillet traits, and fat percentage of male Nile tilapia (Oreochromis niloticus). J. Appl. Genet. 2017, 58, 527–533. [Google Scholar] [CrossRef]
- Wessels, S.; Krause, I.; Floren, C.; Schütz, E.; Beck, J.; Knorr, C. ddRADseq reveals determinants for temperature-dependent sex reversal in Nile tilapia on LG23. BMC Genom. 2017, 18, 531. [Google Scholar] [CrossRef]
- Kantar, M.; Lucas, S.J.; Budak, H. miRNA expression patterns of Triticum dicoccoides in response to shock drought stress. Planta 2011, 233, 471–484. [Google Scholar] [CrossRef]
- Macovei, A.; Gill, S.S.; Tuteja, N. microRNAs as promising tools for improving stress tolerance in rice. Plant Signal. Behav. 2012, 7, 1296–1301. [Google Scholar] [CrossRef]
- Zhang, B.; Wang, Q. MicroRNA-Based Biotechnology for Plant Improvement. J. Cell. Physiol. 2015, 230, 1–15. [Google Scholar] [CrossRef]
- Bartel, D.P. MicroRNAs: Genomics, Biogenesis, Mechanism, and Function. Cell 2004, 116, 281–297. [Google Scholar] [CrossRef]
- Bartel, D.P. MicroRNAs: Target Recognition and Regulatory Functions. Cell 2009, 136, 215–233. [Google Scholar] [CrossRef] [PubMed]
- Ikeda, K.; Satoh, M.; Pauley, K.M.; Fritzler, M.J.; Reeves, W.H.; Chan, E.K. Detection of the argonaute protein Ago2 and microRNAs in the RNA induced silencing complex (RISC) using a monoclonal antibody. J. Immunol. Methods 2006, 317, 38–44. [Google Scholar] [CrossRef] [PubMed]
- Bizuayehu, T.T.; Babiak, J.; Norberg, B.; Fernandes, J.M.; Johansen, S.D.; Babiak, I. Sex-biased miRNA expression in Atlantic halibut (Hippoglossus hippoglossus) brain and gonads. Sex. Dev. 2012, 6, 257–266. [Google Scholar] [CrossRef] [PubMed]
- Xiao, J.; Zhong, H.; Zhou, Y.; Yu, F.; Gao, Y.; Luo, Y.; Tang, Z.; Guo, Z.; Guo, E.; Gan, X.; et al. Identification and characterization of microRNAs in ovary and testis of Nile tilapia (Oreochromis niloticus) by using solexa sequencing technology. PLoS ONE 2014, 9, e86821. [Google Scholar] [CrossRef]
- Eshel, O.; Shirak, A.; Dor, L.; Band, M.; Zak, T.; Markovich-Gordon, M.; Chalifa-Caspi, V.; Feldmesser, E.; Weller, J.I.; Seroussi, E.; et al. Identification of male-specific amh duplication, sexually differentially expressed genes and microRNAs at early embryonic development of Nile tilapia (Oreochromis niloticus). BMC Genom. 2014, 15, 774. [Google Scholar] [CrossRef]
- Tao, W.; Sun, L.; Shi, H.; Cheng, Y.; Jiang, D.; Fu, B.; Conte, M.A.; Gammerdinger, W.J.; Kocher, T.D.; Wang, D. Integrated analysis of miRNA and mRNA expression profiles in tilapia gonads at an early stage of sex differentiation. BMC Genom. 2016, 17, 328. [Google Scholar] [CrossRef]
- Huang, C.W.; Li, Y.H.; Hu, S.Y.; Chi, J.R.; Lin, G.H.; Lin, C.C.; Gong, H.Y.; Chen, J.Y.; Chen, R.H.; Chang, S.J.; et al. Differential expression patterns of growth-related microRNAs in the skeletal muscle of Nile tilapia (Oreochromis niloticus). J. Anim. Sci. 2012, 90, 4266–4279. [Google Scholar] [CrossRef]
- Wang, B.; Gan, Z.; Cai, S.; Wang, Z.; Yu, D.; Lin, Z.; Lu, Y.; Wu, Z.; Jian, J. Comprehensive identification and profiling of Nile tilapia (Oreochromis niloticus) microRNAs response to Streptococcus agalactiae infection through high-throughput sequencing. Fish Shellfish Immunol. 2016, 54, 93–106. [Google Scholar] [CrossRef]
- Love, D.R.; Lan, C.C.; Dodd, A.; Shelling, A.N.; McNabb, W.C.; Ferguson, L.R. Modeling inflammatory bowel disease: the zebrafish as a way forward. Expert Rev. Mol. Diagn. 2007, 7, 177–193. [Google Scholar] [CrossRef]
- Brawand, D.; Wagner, C.E.; Li, Y.I.; Malinsky, M.; Keller, I.; Fan, S.; Simakov, O.; Ng, A.Y.; Lim, Z.W.; Bezault, E.; et al. The genomic substrate for adaptive radiation in African cichlid fish. Nature 2014, 513, 375–381. [Google Scholar] [CrossRef]
- Yan, B.; Wang, Z.H.; Zhu, C.D.; Guo, J.T.; Zhao, J.L. MicroRNA repertoire for functional genome research in tilapia identified by deep sequencing. Molecular Biol. Rep. 2014, 41, 4953–4963. [Google Scholar] [CrossRef]
- Huang, Y.; Ma, X.Y.; Yang, Y.B.; Ren, H.T.; Sun, X.H.; Wang, L.R. Identification and characterization of microRNAs and their target genes from Nile tilapia (Oreochromis niloticus). Zeitschrift für Naturforschung C 2016, 71, 215–223. [Google Scholar] [CrossRef] [PubMed]
- Pinhal, D.; Bovolenta, L.A.; Moxon, S.; Oliveira, A.C.; Nachtigall, P.G.; Acencio, M.L.; Patton, J.G.; Hilsdorf, A.W.; Lemke, N.; Martins, C. Genome-wide microRNA screening in Nile tilapia reveals pervasive isomiRs’ transcription, sex-biased arm switching and increasing complexity of expression throughout development. Sci. Rep. 2018, 8, 1–18. [Google Scholar]
- Khan, Y.; Yadav, A.; Bonthala, V.S.; Muthamilarasan, M.; Yadav, C.B.; Prasad, M. Comprehensive genome-wide identification and expression profiling of foxtail millet [Setaria italica (L.)] miRNAs in response to abiotic stress and development of miRNA database. Plant Cell Tissue Organ Cult. (PCTOC) 2014, 118, 279–292. [Google Scholar] [CrossRef]
- Gleave, A.P.; Ampomah-Dwamena, C.; Berthold, S.; Dejnoprat, S.; Karunairetnam, S.; Nain, B.; Wang, Y.Y.; Crowhurst, R.N.; MacDiarmid, R.M. Identification and characterisation of primary microRNAs from apple (Malus domestica cv. Royal Gala) expressed sequence tags. Tree Genet. Genom. 2008, 4, 343–358. [Google Scholar] [CrossRef]
- Remita, M.A.; Lord, E.; Agharbaoui, Z.; Leclercq, M.; Badawi, M.A.; Sarhan, F.; Diallo, A.B. A novel comprehensive wheat miRNA database, including related bioinformatics software. Curr. Plant Biol. 2016, 7–8, 31–33. [Google Scholar] [CrossRef]
- Oliveira, A.C.; Bovolenta, L.A.; Nachtigall, P.G.; Herkenhoff, M.E.; Lemke, N.; Pinhal, D. Combining Results from Distinct MicroRNA Target Prediction Tools Enhances the Performance of Analyses. Front. Genet. 2017, 8, 59. [Google Scholar] [CrossRef]
- Garcia, D.M.; Baek, D.; Shin, C.; Bell, G.W.; Grimson, A.; Bartel, D.P. Weak seed-pairing stability and high target-site abundance decrease the proficiency of lsy-6 and other microRNAs. Nat. Struct. Mol. Biol. 2011, 18, 1139. [Google Scholar] [CrossRef]
- Chen, H.; Chen, G.; Chen, Y.; Liao, W.; Liu, C.; Chang, K.; Chang, Y.; Chen, S. MicroRNA deregulation and pathway alterations in nasopharyngeal carcinoma. Br. J. Cancer 2009, 100, 1002–1011. [Google Scholar] [CrossRef]
- Jacobsen, A.; Silber, J.; Harinath, G.; Huse, J.T.; Schultz, N.; Sander, C. Analysis of microRNA-target interactions across diverse cancer types. Nat. Struct. Mol. Biol. 2013, 20, 1325. [Google Scholar] [CrossRef]
- Kozak, L.P.; Kozak, U.C.; Clarke, G.T. Abnormal brown and white fat development in transgenic mice overexpressing glycerol 3-phosphate dehydrogenase. Genes Dev. 1991, 5, 2256–2264. [Google Scholar] [CrossRef]
- Sato, T.; Yoshida, Y.; Morita, A.; Mori, N.; Miura, S. Glycerol-3-phosphate dehydrogenase 1 deficiency induces compensatory amino acid metabolism during fasting in mice. Metabolism 2016, 65, 1646–1656. [Google Scholar] [CrossRef] [PubMed]
- Vidigal, J.A.; Ventura, A. The biological functions of miRNAs: lessons from in vivo studies. Trends Cell Biol. 2015, 25, 137–147. [Google Scholar] [CrossRef] [PubMed]
- Kozomara, A.; Griffiths-Jones, S. miRBase: annotating high confidence microRNAs using deep sequencing data. Nucleic Acids Res. 2013, 42, D68–D73. [Google Scholar] [CrossRef] [PubMed]
- Yates, A.; Akanni, W.; Amode, M.R.; Barrell, D.; Billis, K.; Carvalho-Silva, D.; Cummins, C.; Clapham, P.; Fitzgerald, S.; Gil, L.; et al. Ensembl 2016. Nucleic Acids Res. 2015, 44, D710–D716. [Google Scholar] [CrossRef]
- Lewis, B.P.; Burge, C.B.; Bartel, D.P. Conserved Seed Pairing, Often Flanked by Adenosines, Indicates that Thousands of Human Genes are MicroRNA Targets. Cell 2005, 120, 15–20. [Google Scholar] [CrossRef]
- Hamzeiy, H.; Allmer, J.; Yousef, M. Computational Methods for MicroRNA Target Prediction. In miRNomics: MicroRNA Biology and Computational Analysis; Yousef, M., Allmer, J., Eds.; Humana Press: Totowa, NJ, USA, 2014; pp. 207–221. [Google Scholar] [CrossRef]
- Ulitsky, I.; Shkumatava, A.; Jan, C.H.; Subtelny, A.O.; Koppstein, D.; Bell, G.W.; Sive, H.; Bartel, D.P. Extensive alternative polyadenylation during zebrafish development. Genome Res. 2012, 22, 2054–2066. [Google Scholar] [CrossRef]
- Morin, R.D.; O’Connor, M.D.; Griffith, M.; Kuchenbauer, F.; Delaney, A.; Prabhu, A.L.; Zhao, Y.; McDonald, H.; Zeng, T.; Hirst, M.; et al. Application of massively parallel sequencing to microRNA profiling and discovery in human embryonic stem cells. Genome Res. 2008, 18, 610–621. [Google Scholar] [CrossRef]
- Chen, P.P.S. The Entity-Relationship Model—Toward a Unified View of Data. ACM Trans. Database Syst. 1976, 1, 9–36. [Google Scholar] [CrossRef]
- Li, B.; Dewey, C.N. RSEM: Accurate transcript quantification from RNA-Seq data with or without a reference genome. BMC Bioinform. 2011, 12, 323. [Google Scholar] [CrossRef]
- Prüfer, K.; Stenzel, U.; Dannemann, M.; Green, R.E.; Lachmann, M.; Kelso, J. PatMaN: Rapid alignment of short sequences to large databases. Bioinformatics 2008, 24, 1530–1531. [Google Scholar] [CrossRef] [PubMed]
- Friedländer, M.R.; Mackowiak, S.D.; Li, N.; Chen, W.; Rajewsky, N. miRDeep2 accurately identifies known and hundreds of novel microRNA genes in seven animal clades. Nucleic Acids Res. 2011, 40, 37–52. [Google Scholar] [CrossRef] [PubMed]
- Muffato, M.; Louis, A.; Poisnel, C.E.; Crollius, H.R. Genomicus: A database and a browser to study gene synteny in modern and ancestral genomes. Bioinformatics 2010, 26, 1119–1121. [Google Scholar] [CrossRef] [PubMed]
Sample Availability: Samples are available by GEO Accession: GSE102878. |


© 2020 by the authors. Licensee MDPI, Basel, Switzerland. This article is an open access article distributed under the terms and conditions of the Creative Commons Attribution (CC BY) license (http://creativecommons.org/licenses/by/4.0/).
Share and Cite
Bovolenta, L.A.; Pinhal, D.; Acencio, M.L.; Oliveira, A.C.d.; Moxon, S.; Martins, C.; Lemke, N. miRTil: An Extensive Repository for Nile Tilapia microRNA Next Generation Sequencing Data. Cells 2020, 9, 1752. https://doi.org/10.3390/cells9081752
Bovolenta LA, Pinhal D, Acencio ML, Oliveira ACd, Moxon S, Martins C, Lemke N. miRTil: An Extensive Repository for Nile Tilapia microRNA Next Generation Sequencing Data. Cells. 2020; 9(8):1752. https://doi.org/10.3390/cells9081752
Chicago/Turabian StyleBovolenta, Luiz Augusto, Danillo Pinhal, Marcio Luis Acencio, Arthur Casulli de Oliveira, Simon Moxon, Cesar Martins, and Ney Lemke. 2020. "miRTil: An Extensive Repository for Nile Tilapia microRNA Next Generation Sequencing Data" Cells 9, no. 8: 1752. https://doi.org/10.3390/cells9081752
APA StyleBovolenta, L. A., Pinhal, D., Acencio, M. L., Oliveira, A. C. d., Moxon, S., Martins, C., & Lemke, N. (2020). miRTil: An Extensive Repository for Nile Tilapia microRNA Next Generation Sequencing Data. Cells, 9(8), 1752. https://doi.org/10.3390/cells9081752