Sex Chromosomes and Sex Phenotype Contribute to Biased DNA Methylation in Mouse Liver

 , , and
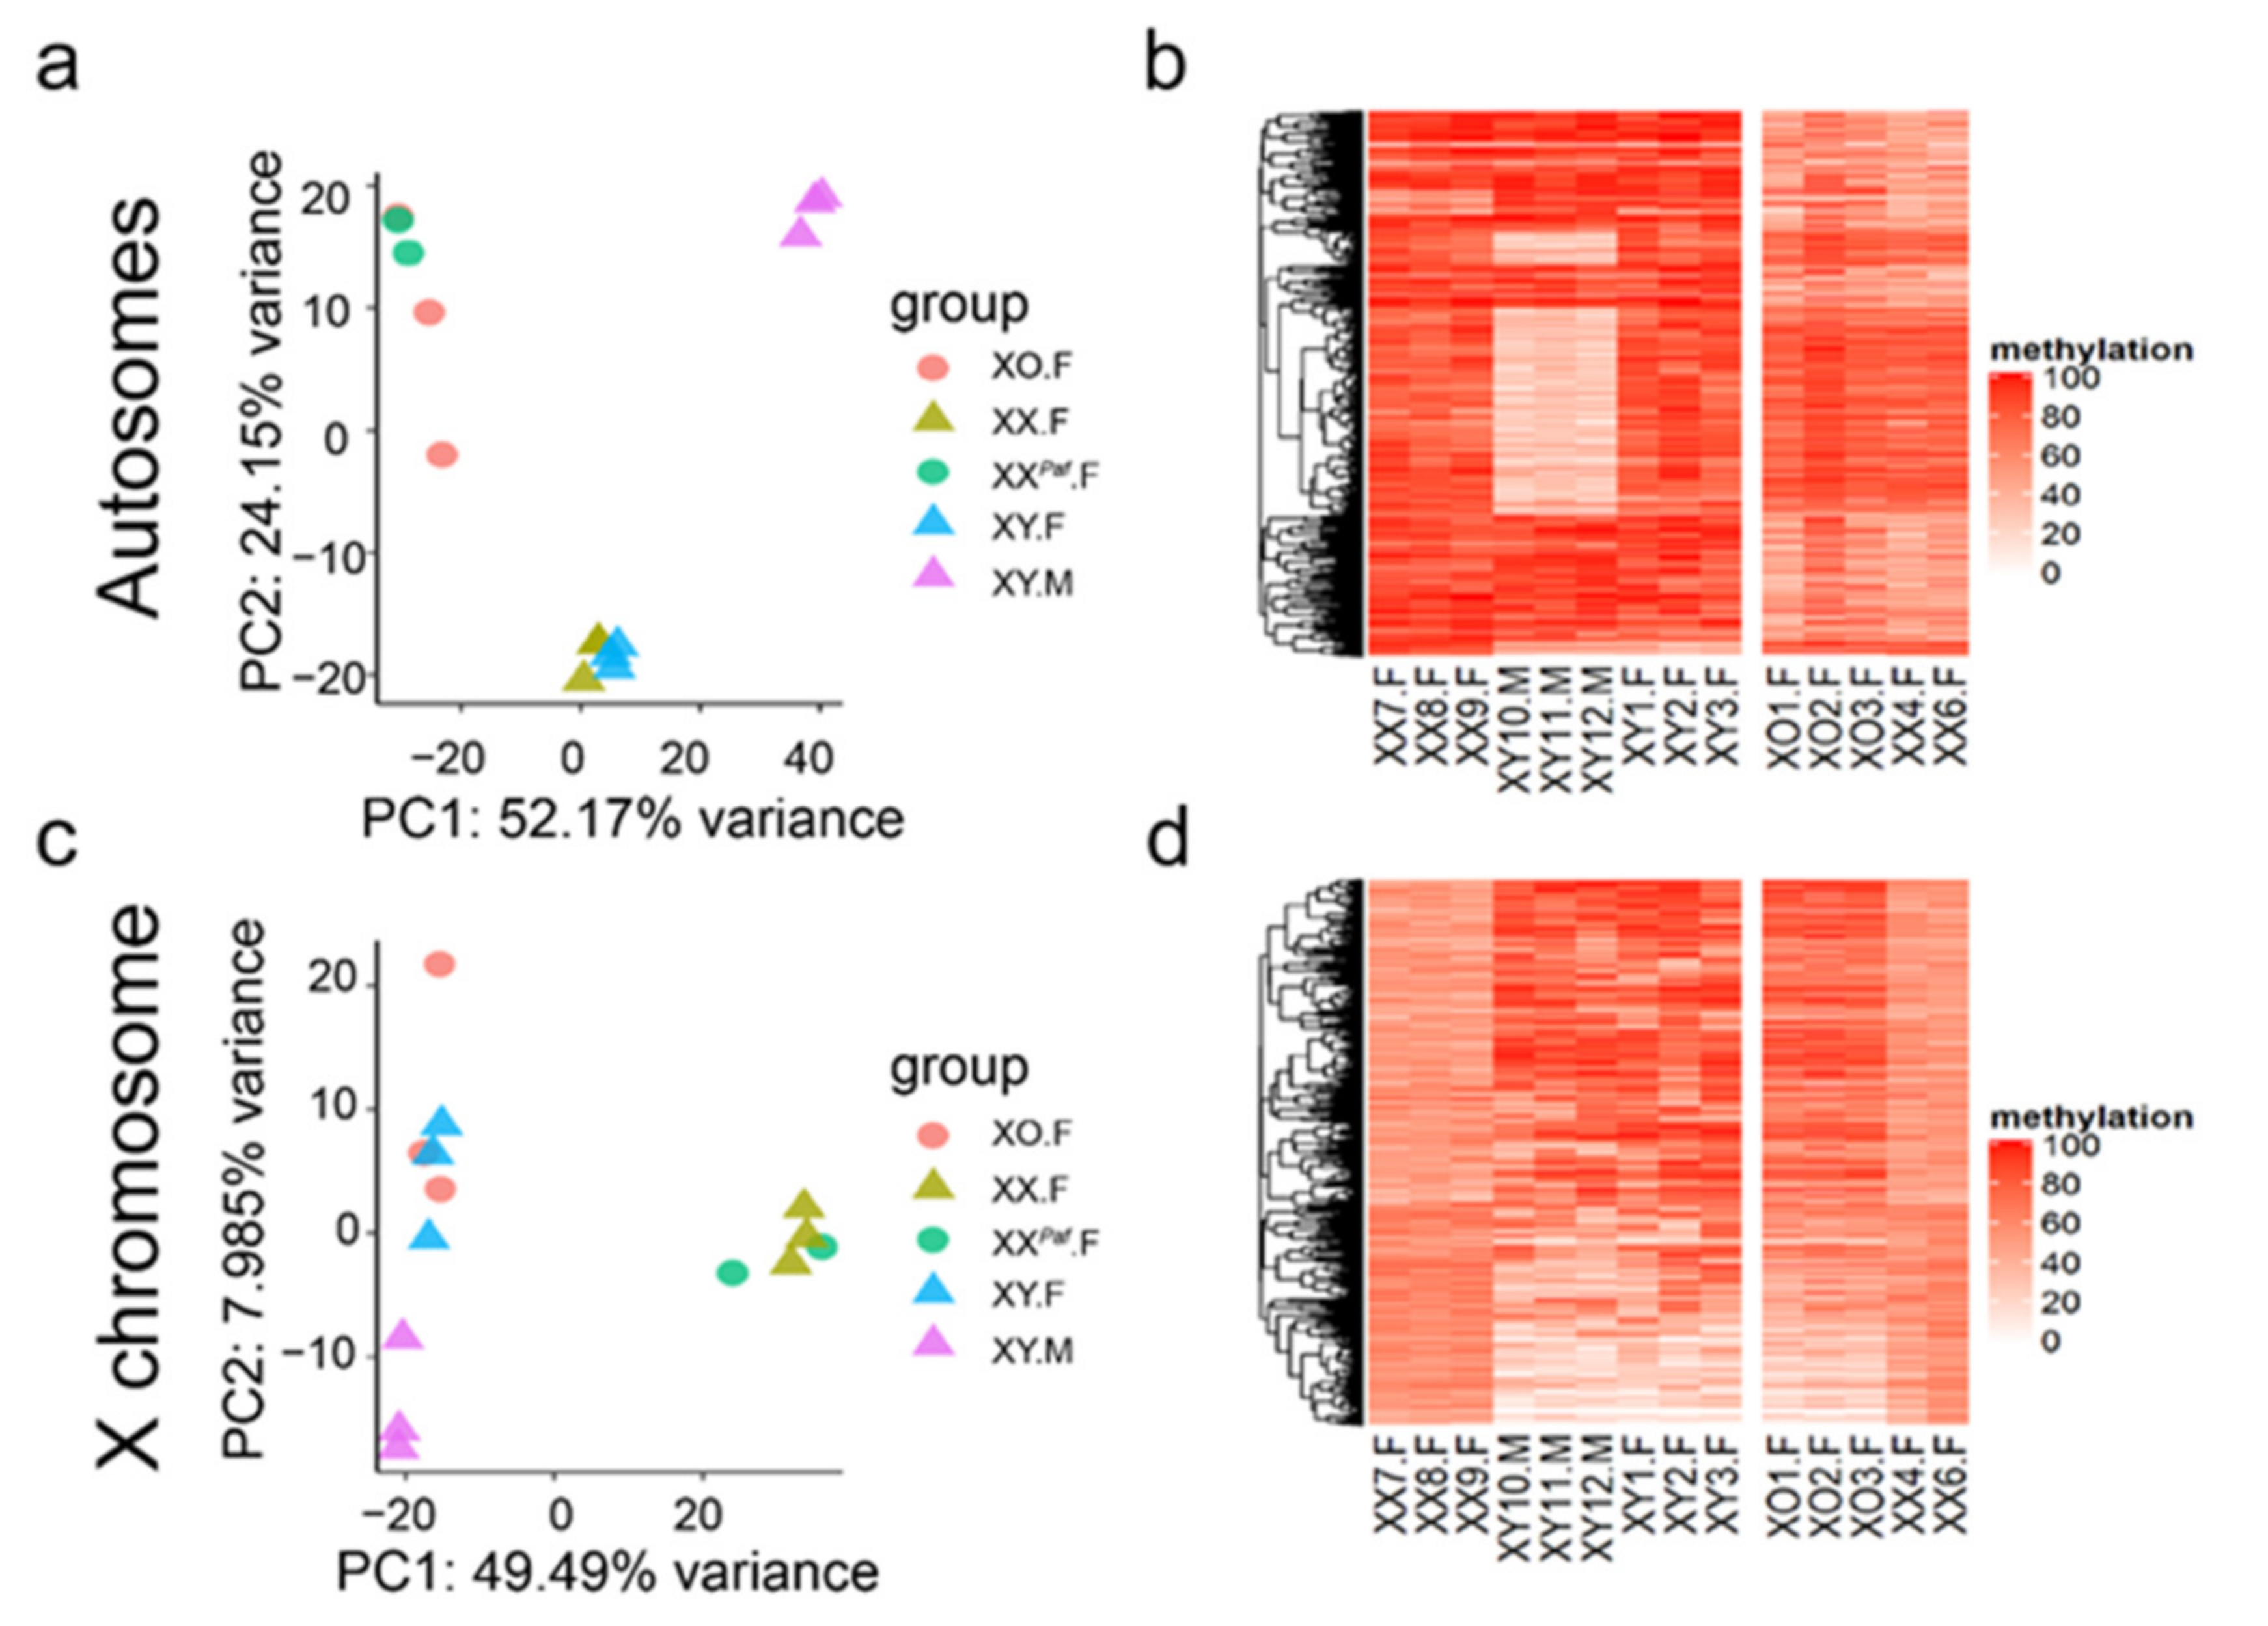
Abstract
1. Introduction
2. Materials and Methods
2.1. Mouse Strains and Crosses
2.2. DNA Extraction and Sequencing
2.3. Methylation Calling and Single Nucleotide Polymorphism (SNP) Filtering
2.4. Detection of Differentially Methylated CpG Sites (DMC) or Sex-Associated Differentially Methylated CpG Sites (sDMC)
2.5. Detection of Sex-Associated Differentially Methylated Regions (sDMRs)
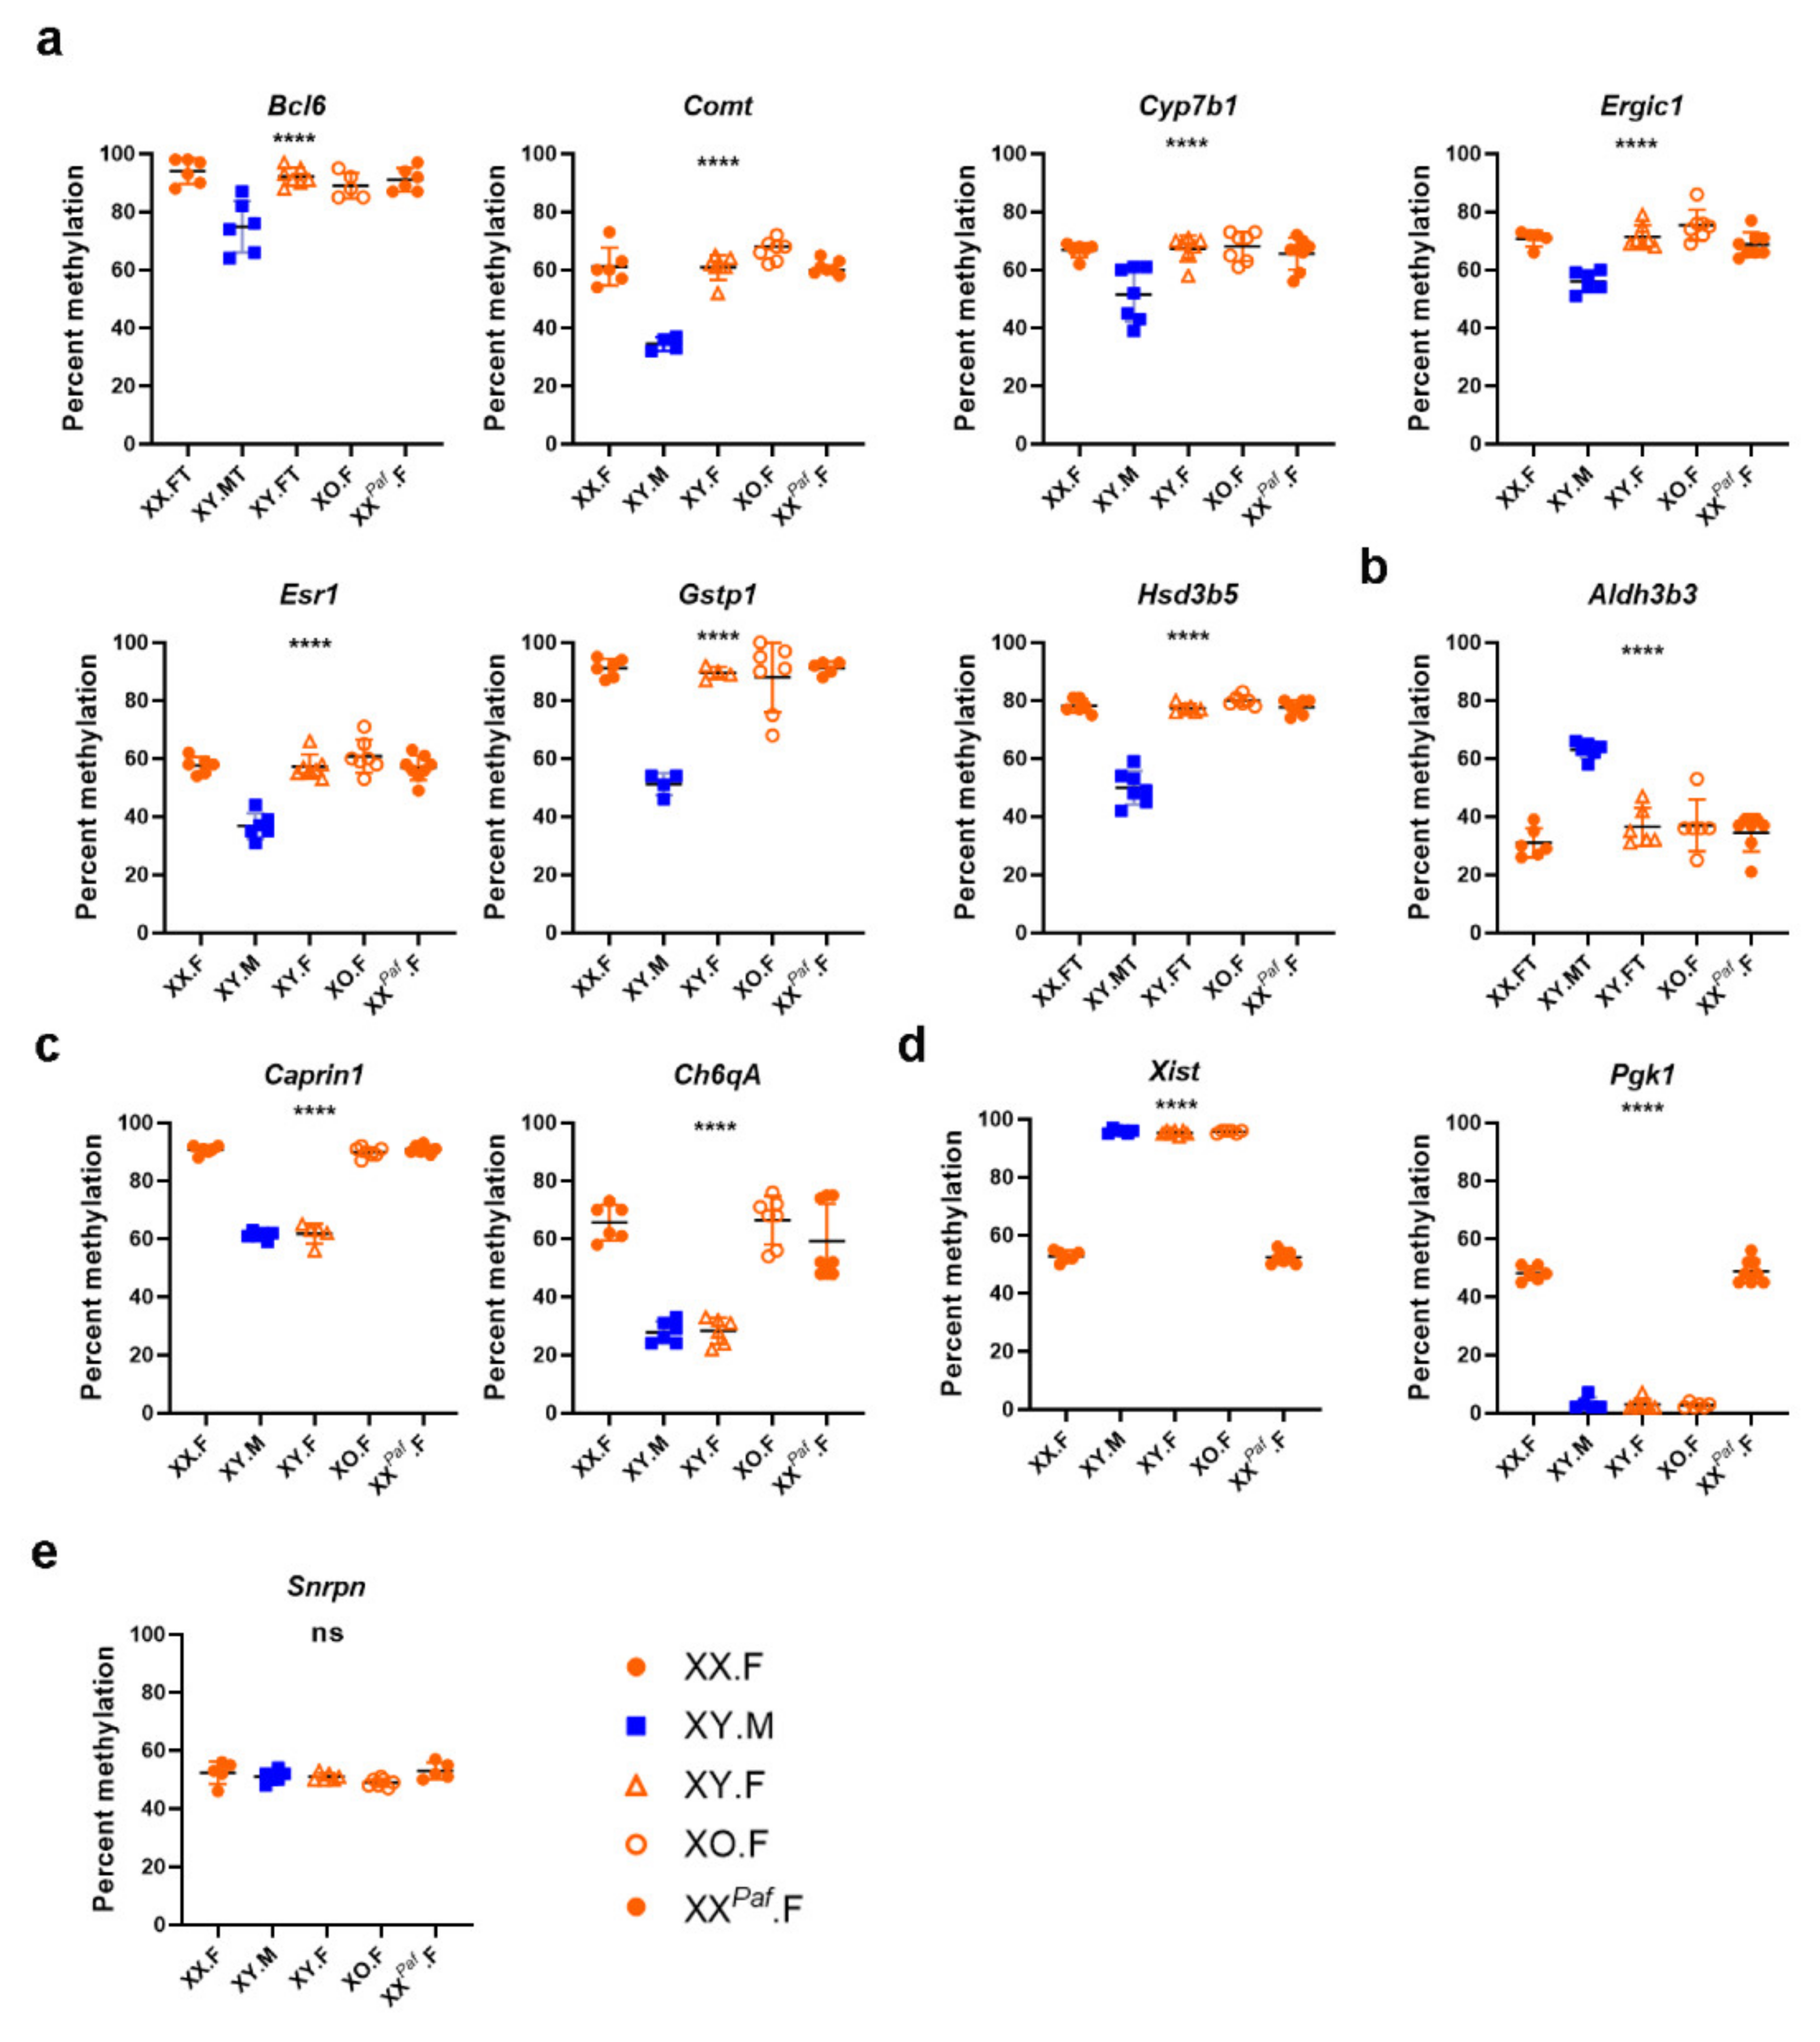
2.6. Pyrosequencing Assays
2.7. Basic Annotation of sDMR/CpG Sites
2.8. Enrichment Analysis of Repetitive Elements
2.9. Motif Enrichment Analysis with Homer
2.10. RNA Extraction and Sequencing
2.11. Differential Expression Analysis
2.12. Analysis of sDMC- or sDMR-Proximal Genes
2.13. Enrichment of sDMR Near Differentially Expressed Genes (DEG)
2.14. Orthologous Gene of Human and Mouse
2.15. Human Datasets
2.16. Comparison of Sex-Biased Methylation in Human and Mouse Liver
3. Results
3.1. Sex Phenotype, Sex-Chromosome Complement, and Genetic Background Influence Global DNA Methylation Profiles in Mouse Liver
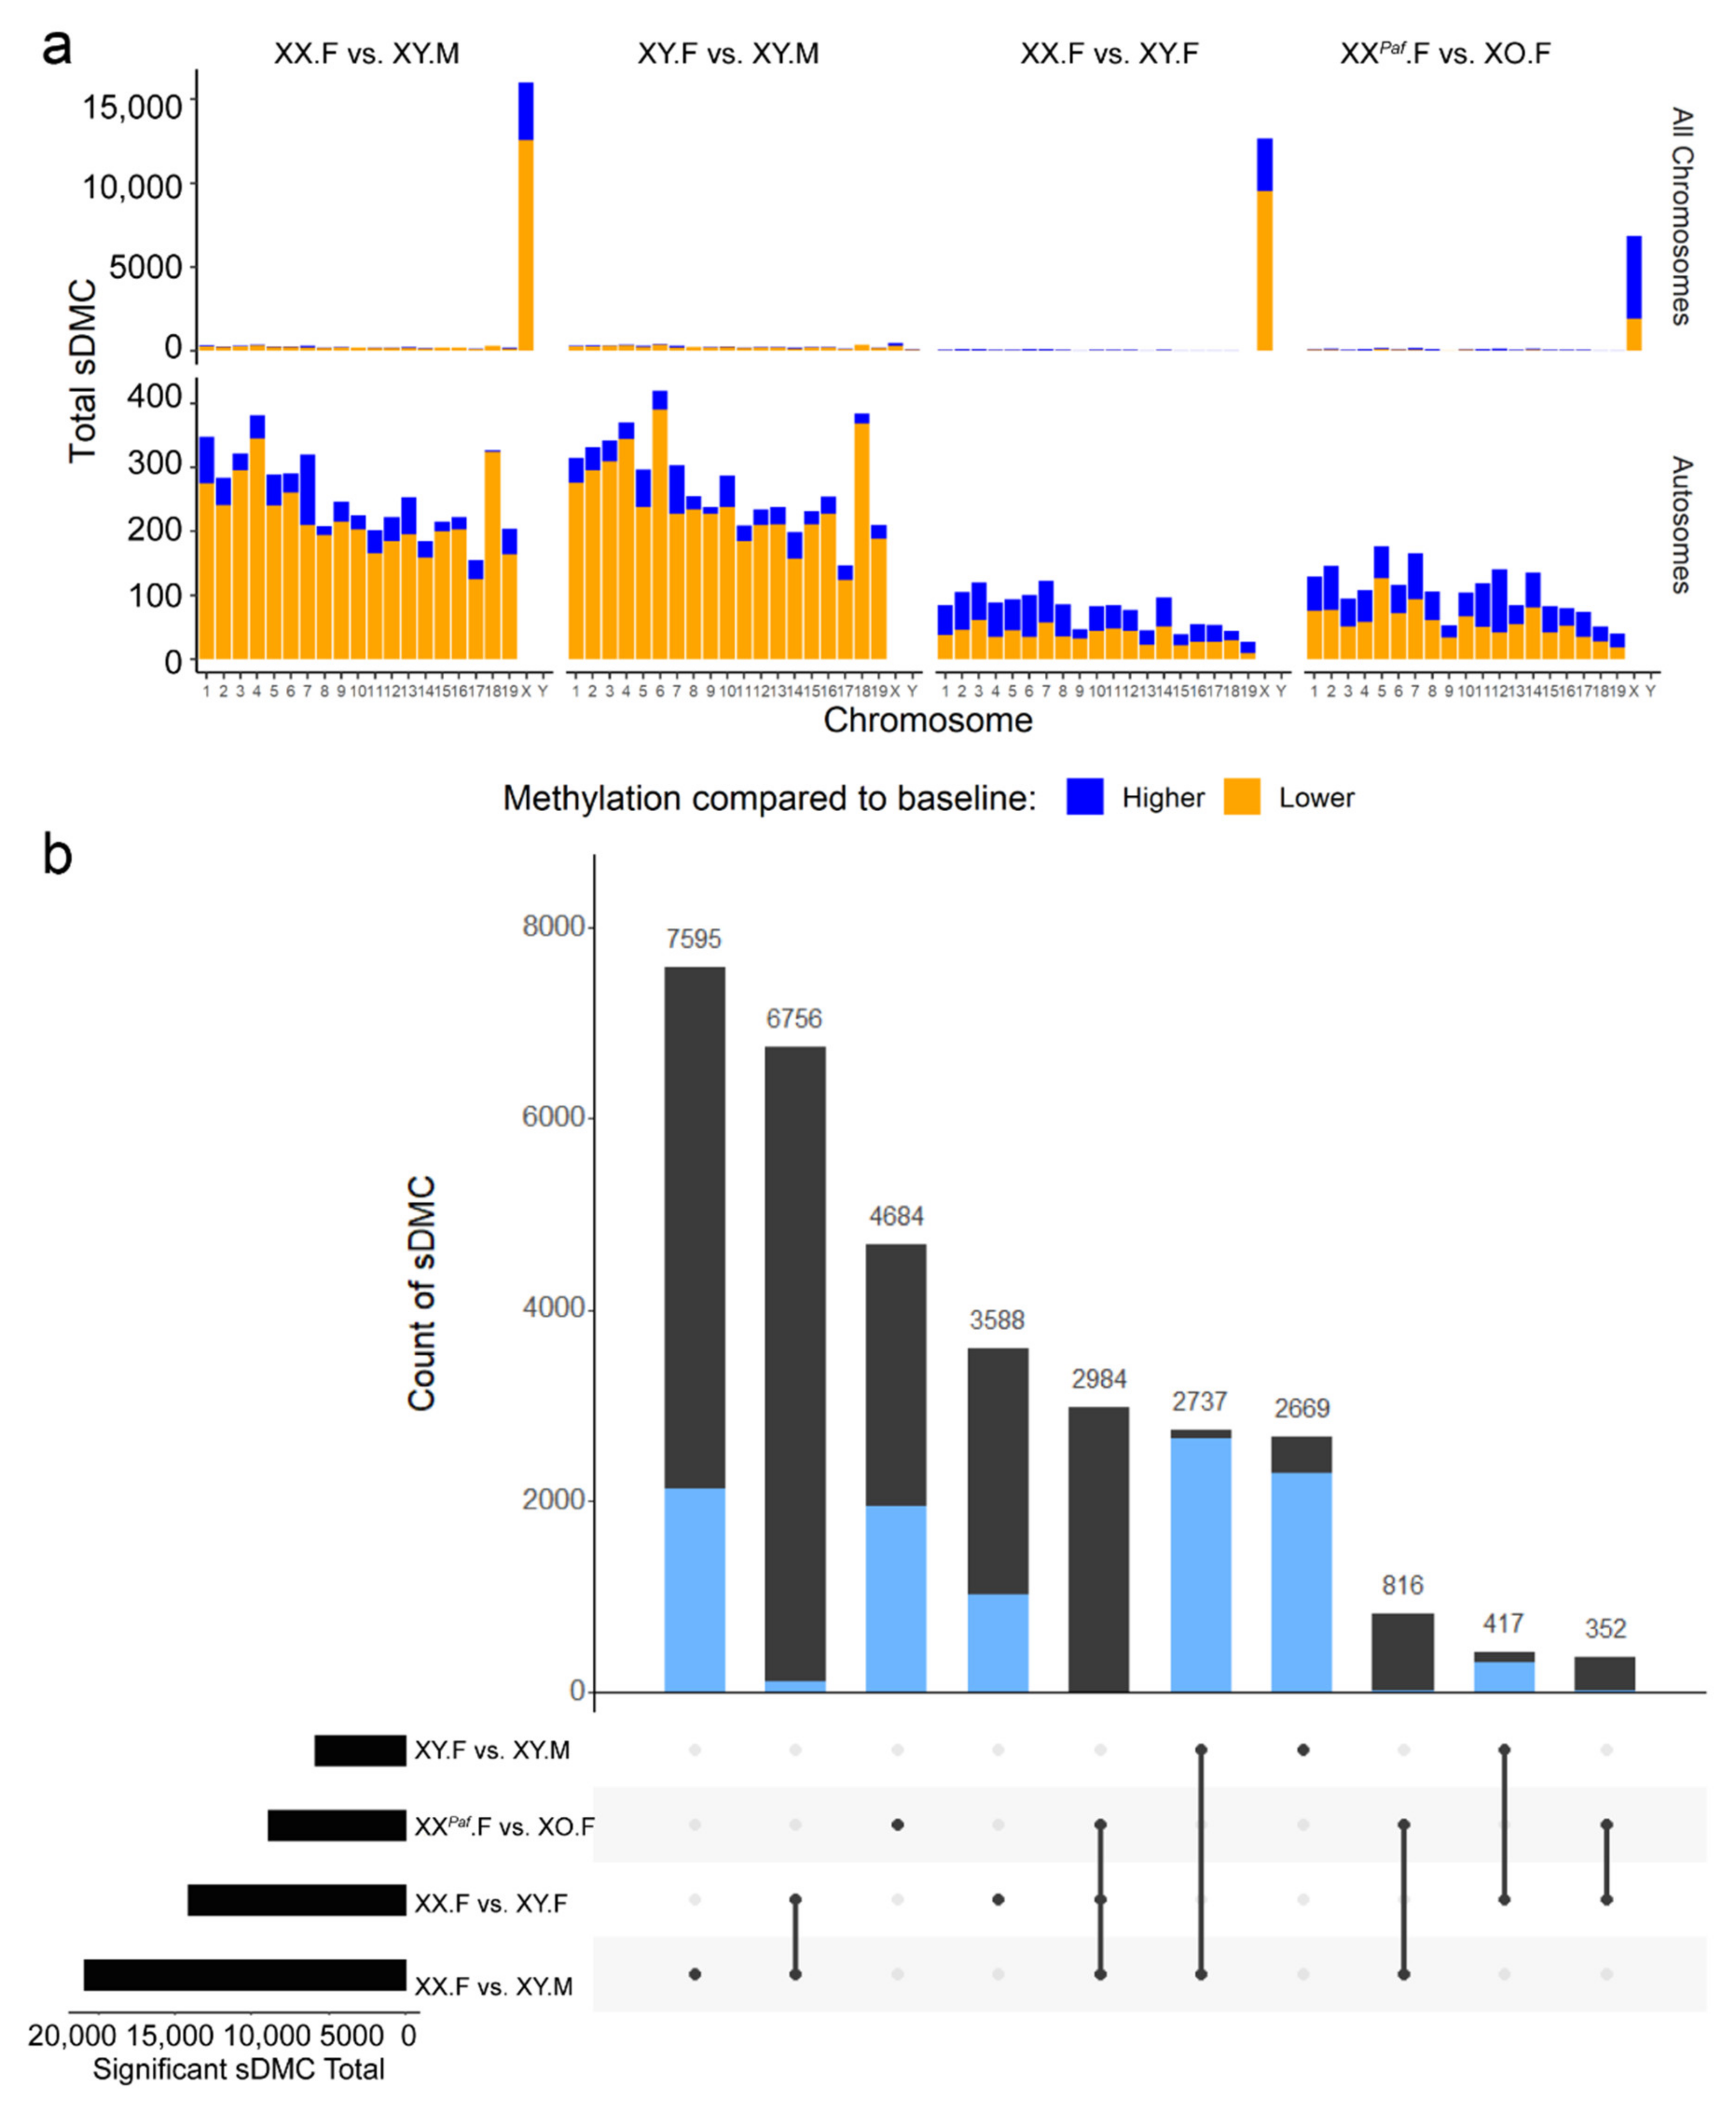
3.2. Identification of Sex-Associated Differentially Methylated CpGs (sDMC)
3.3. Sex Phenotype and Sex-Chromosome Complement are Responsible for Sex-Associated Differentially Methylated Regions (sDMR)
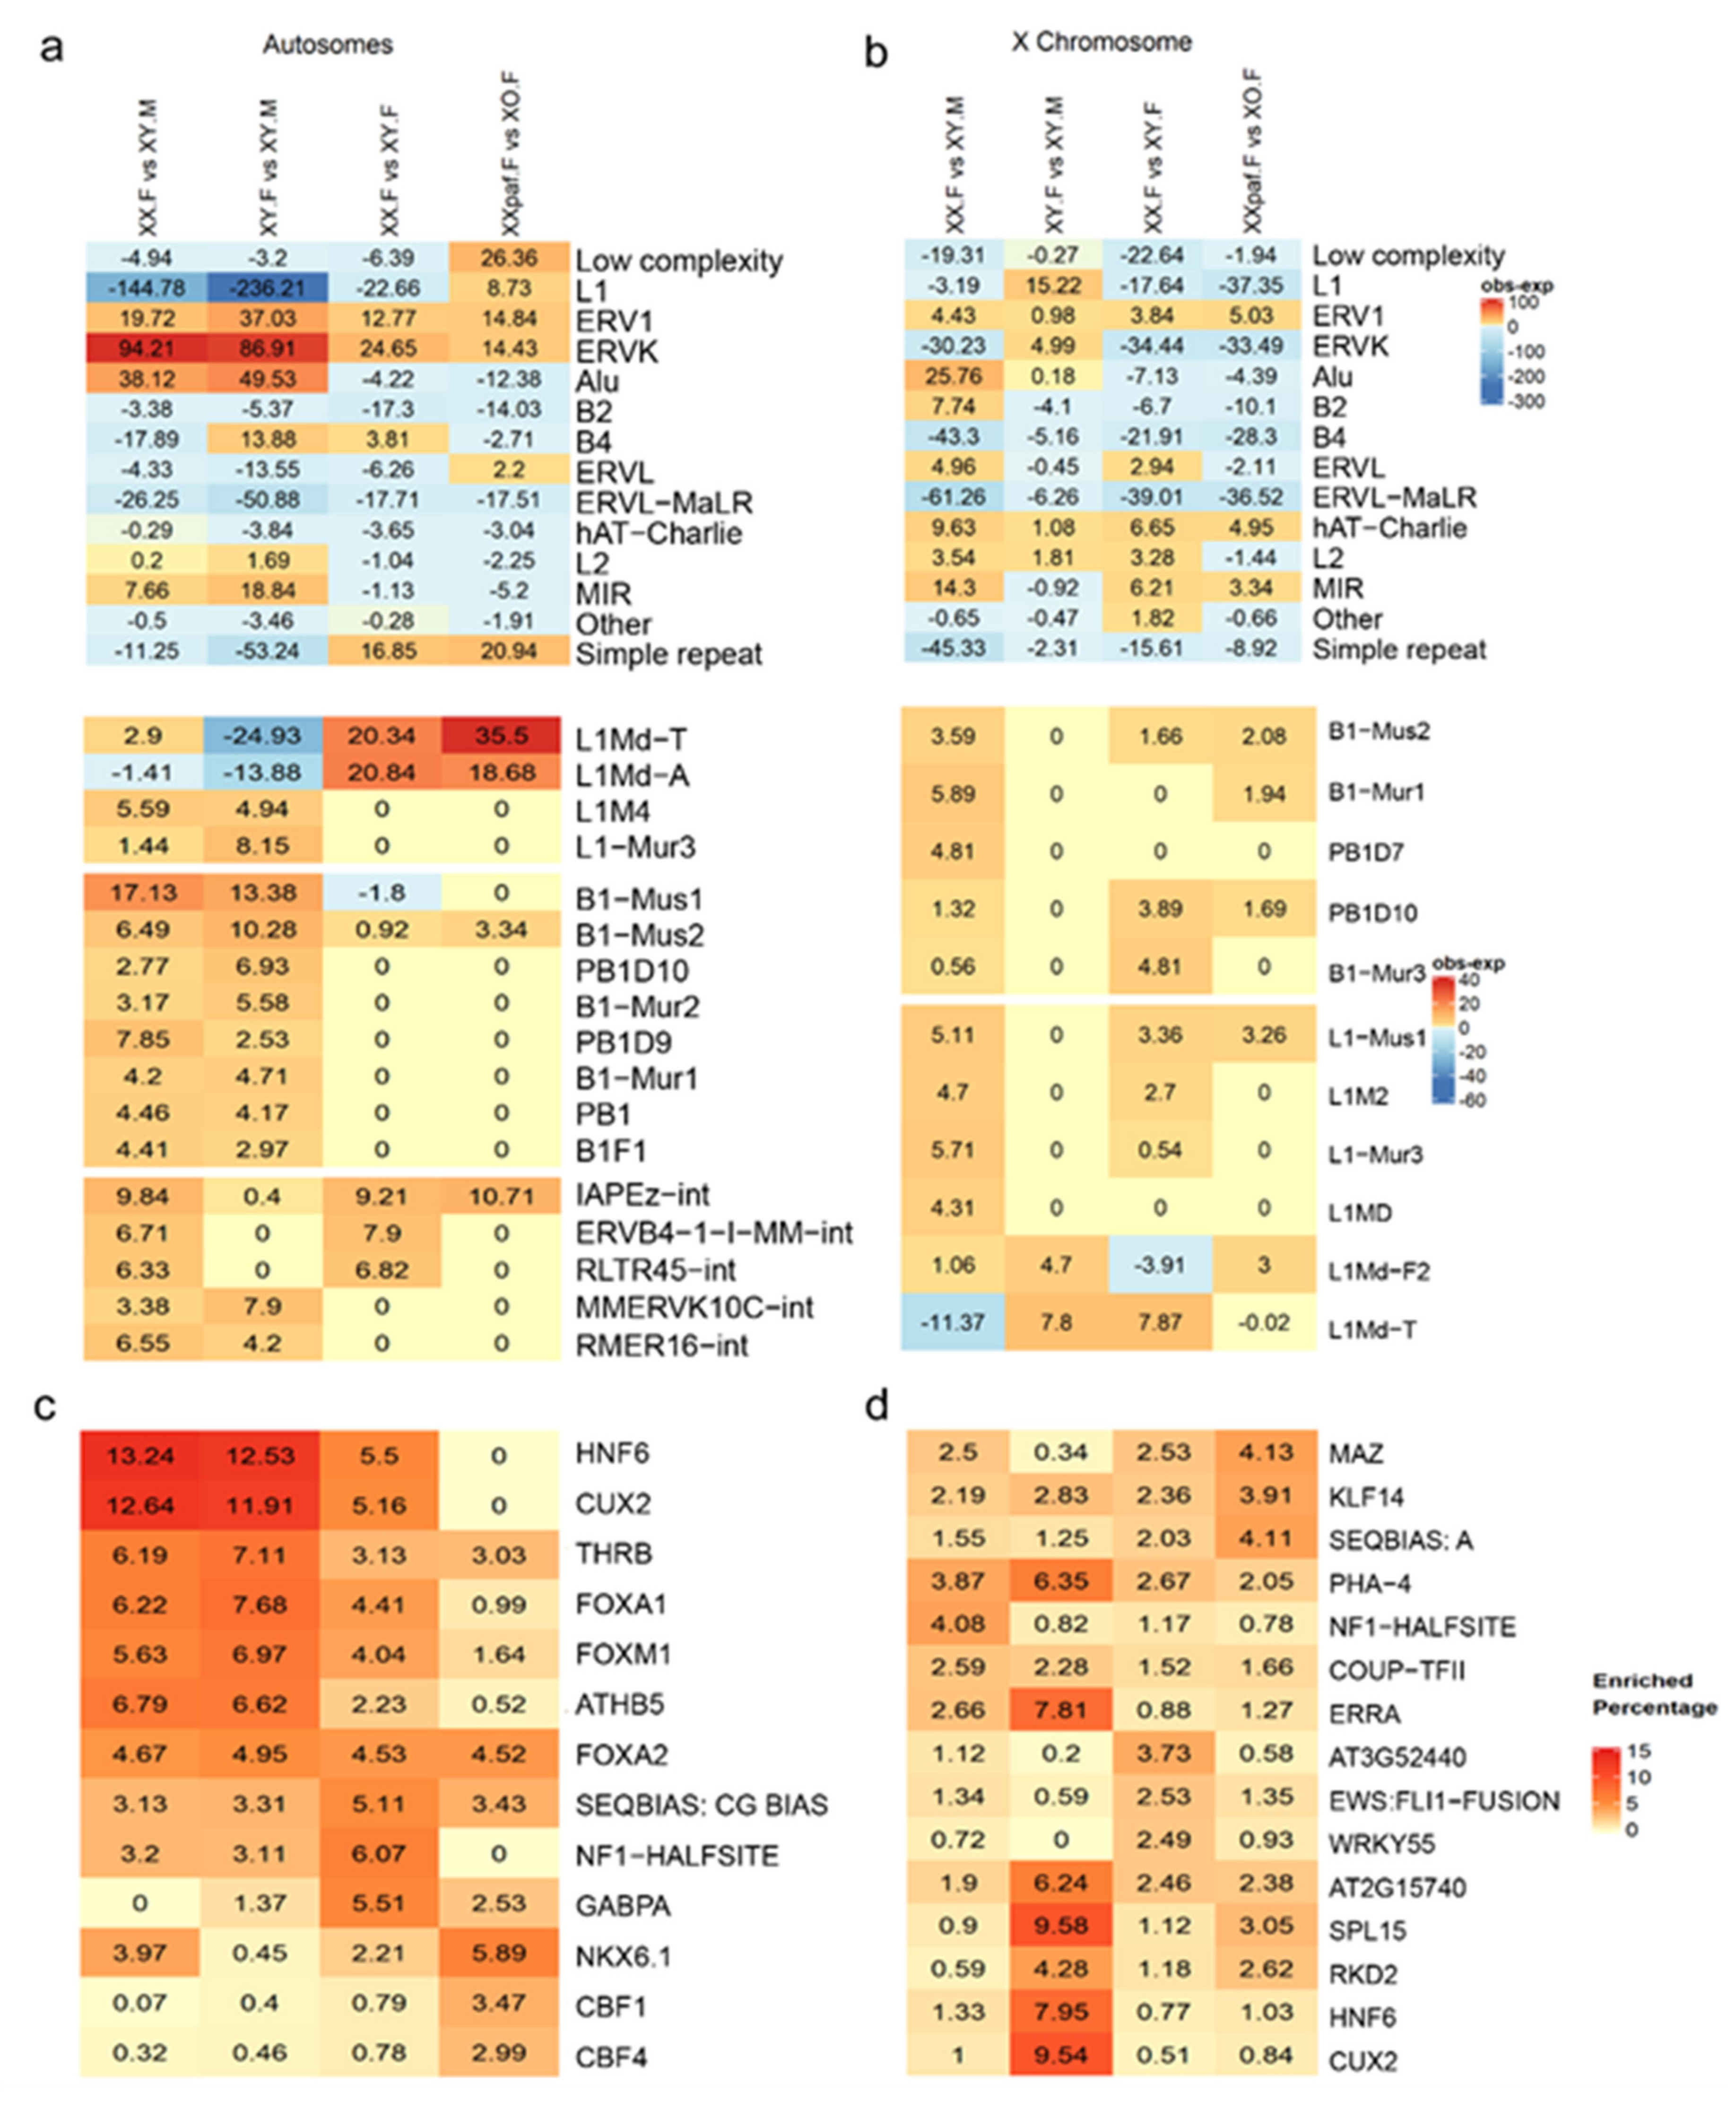
3.4. Enrichment of Repeat Families and Transcription Binding Motifs in sDMRs Differ between Autosomes and the X Chromosome
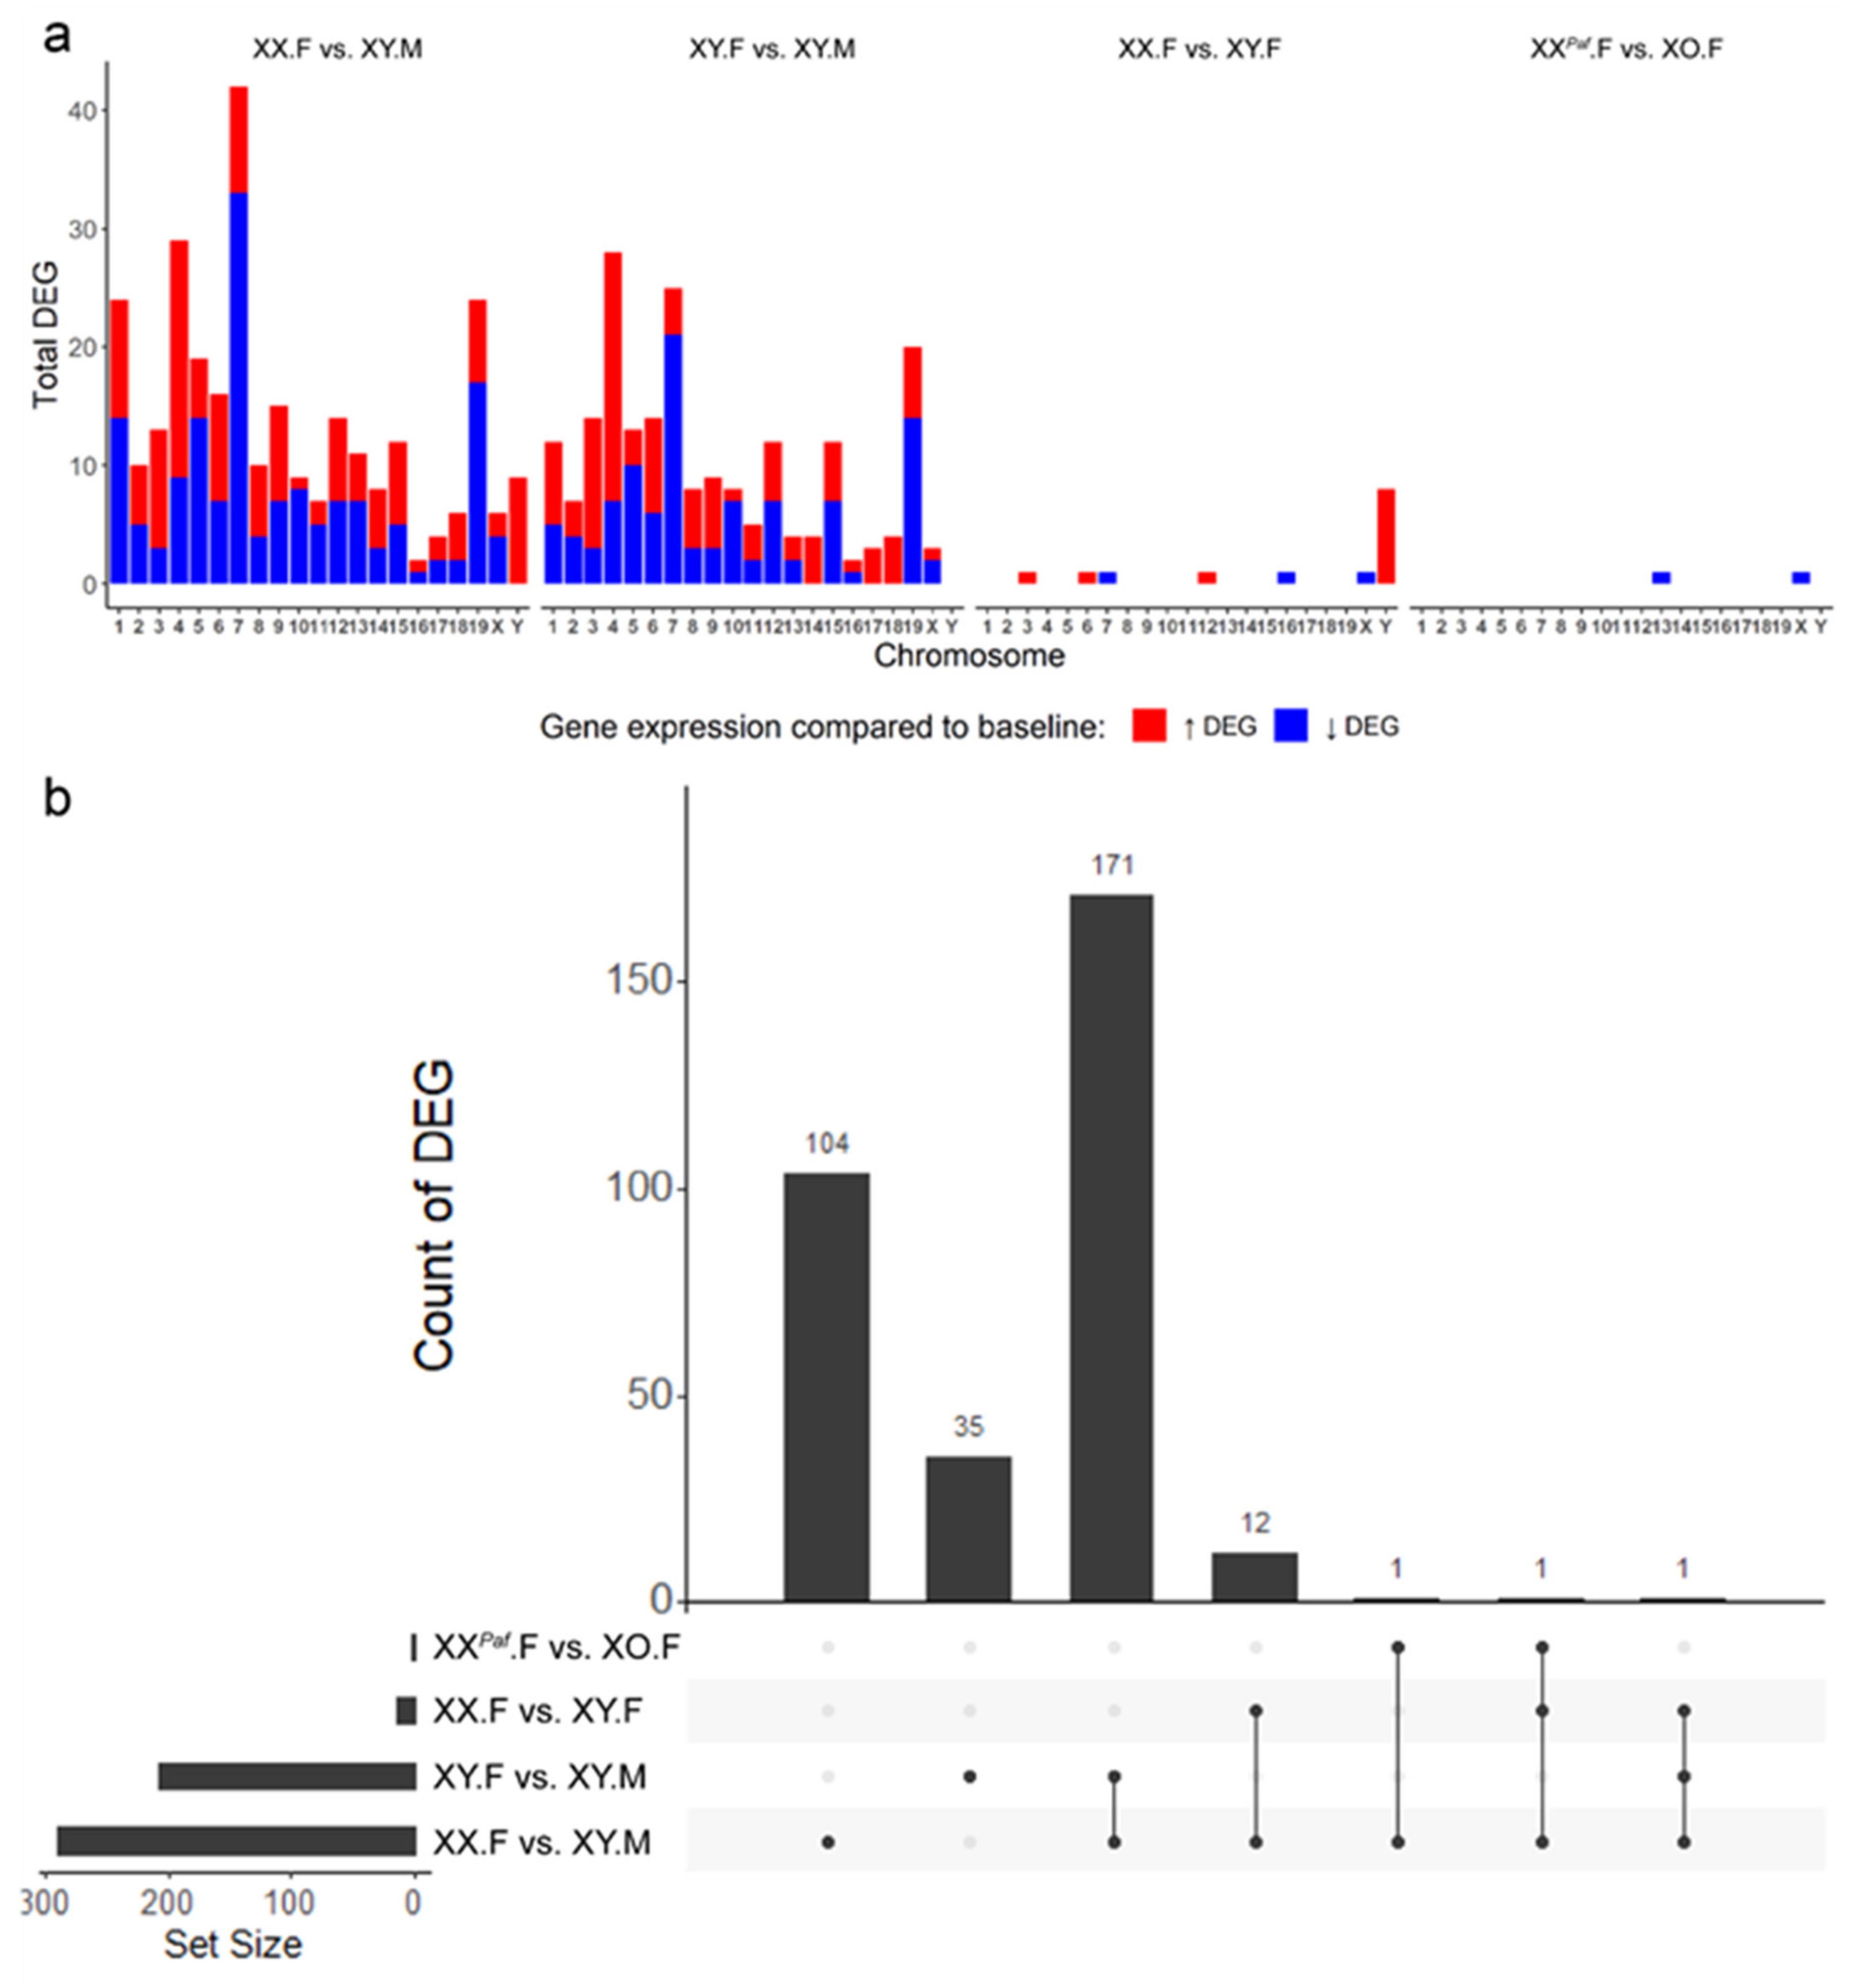
3.5. Association between Sex-Associated Methylation and the Transcriptome
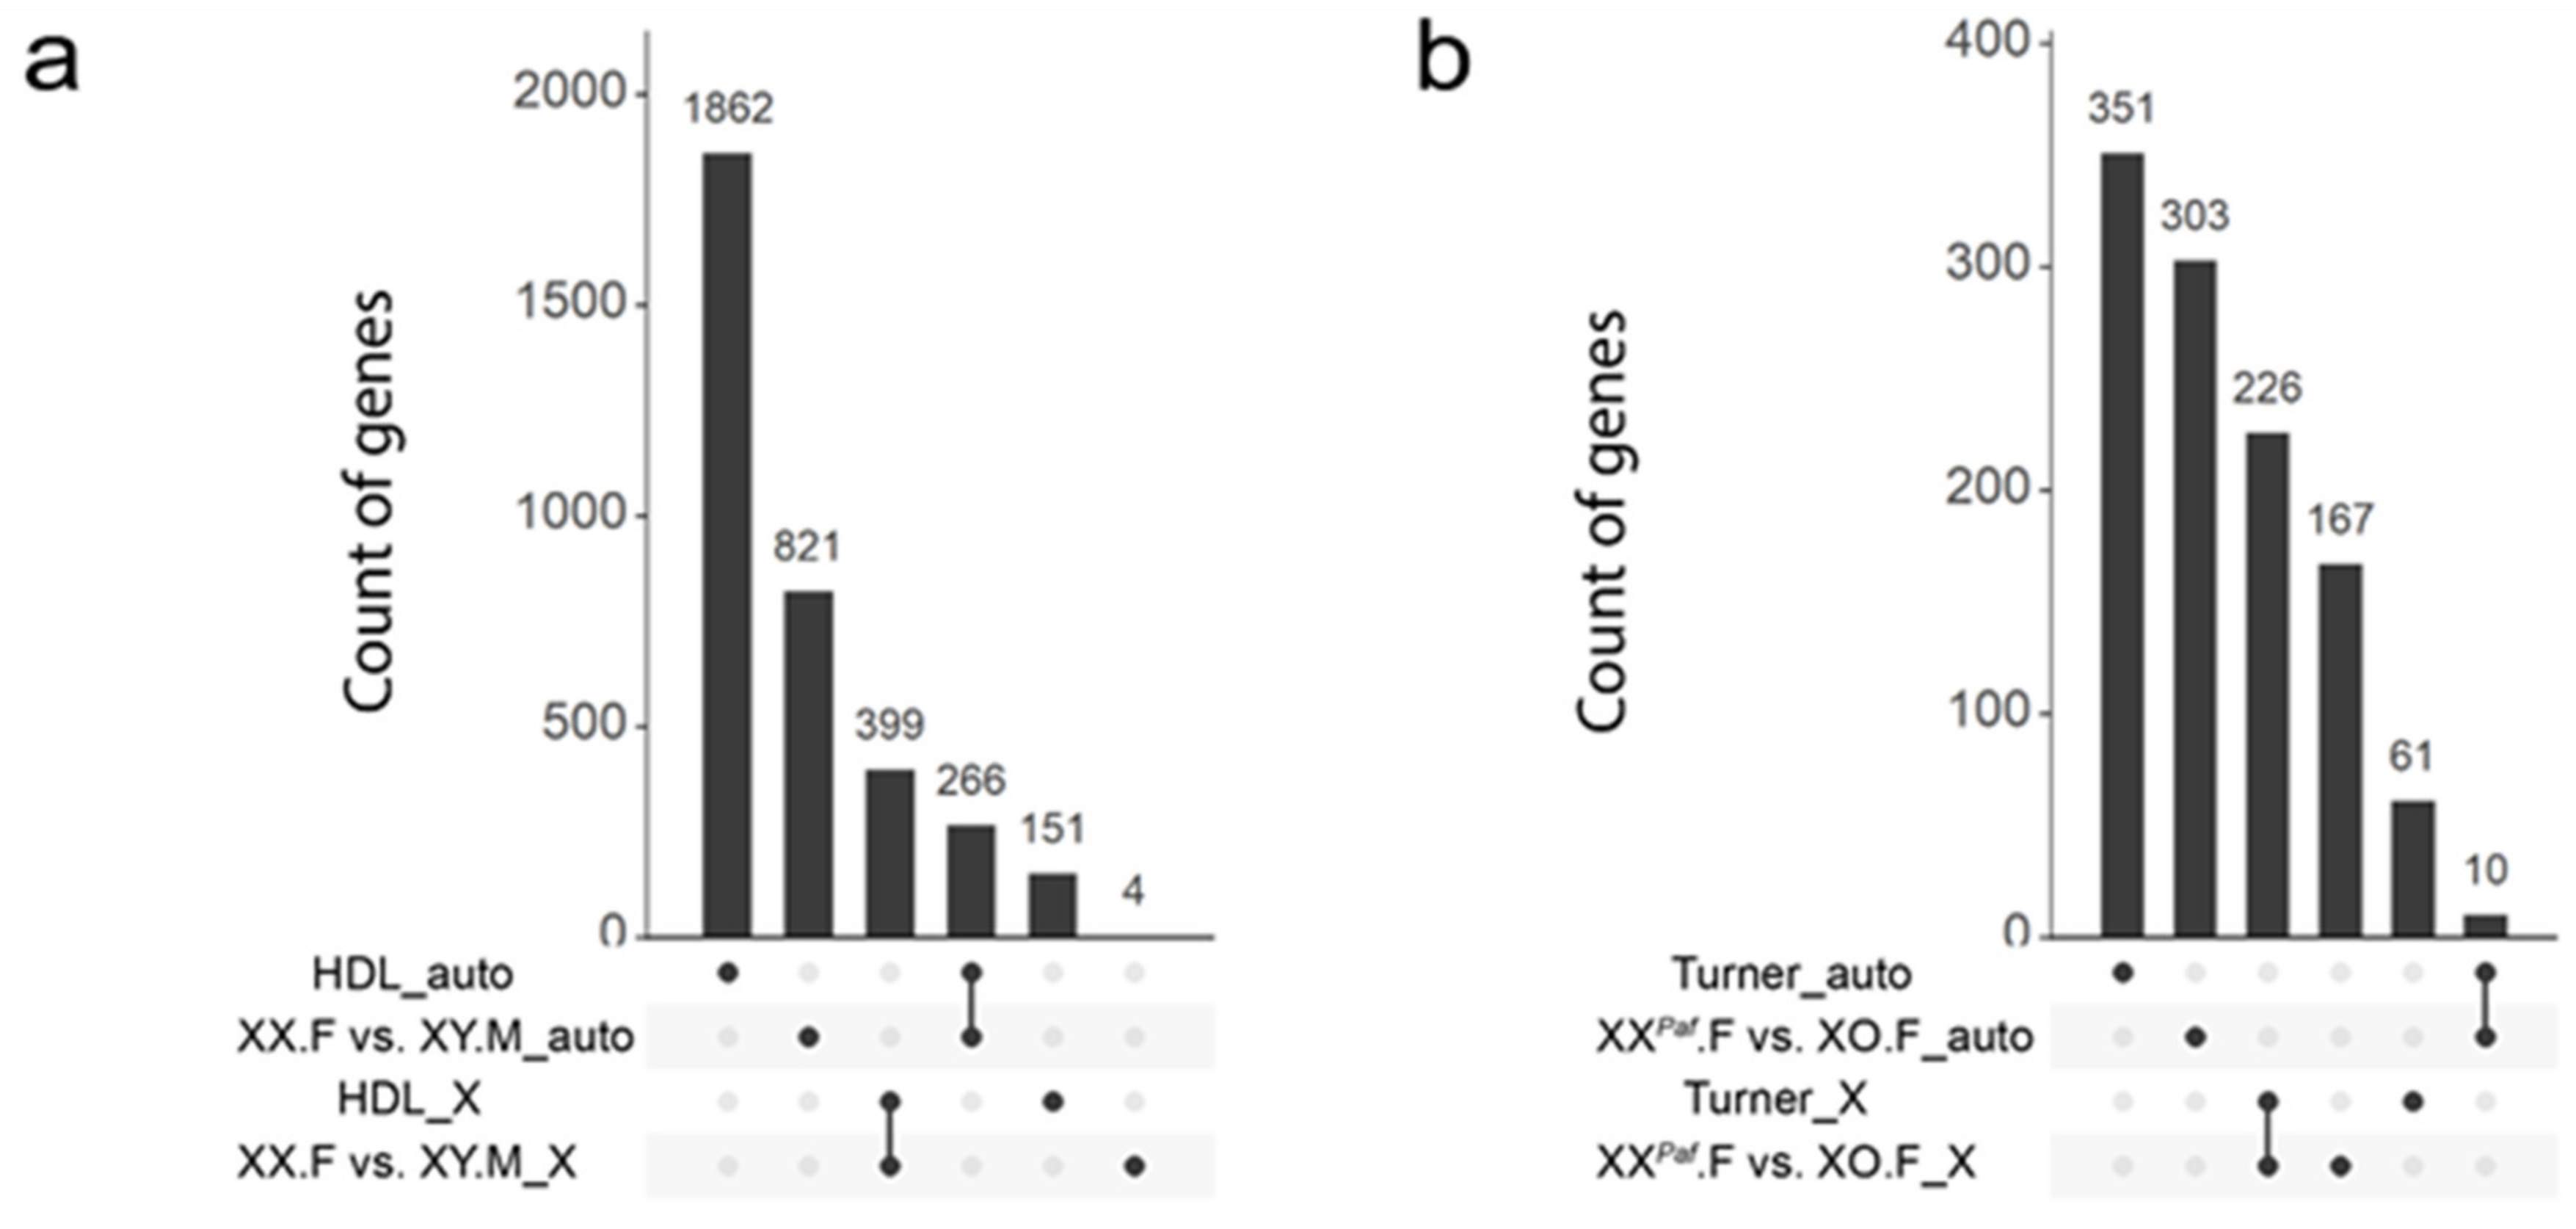
3.6. Partial Conservation of Sex-Associated Methylation in Proximity of Mouse and Human Orthologous Genes
4. Discussion
4.1. Methodology for Identifying sDMC and sDMR and Its Impact on Results
4.2. Sex Phenotype and Sex-Chromosome Complement Shape Sex-Biased DNA Methylation Patterns
4.3. Genetic Variation Influences DNA Methylation
4.4. Sex-Biased DNA Methylation of Repetitive Elements
4.5. Insights into the Molecular Mechanisms Underlying Sex Bias in DNA Methylation
4.6. Sex-Biased Methylation in Different Species
Supplementary Materials
Author Contributions
Funding
Acknowledgments
Conflicts of Interest
References
- Van Nas, A.; Guhathakurta, D.; Wang, S.S.; Yehya, N.; Horvath, S.; Zhang, B.; Ingram-Drake, L.; Chaudhuri, G.; Schadt, E.E.; Drake, T.A.; et al. Elucidating the role of gonadal hormones in sexually dimorphic gene coexpression networks. Endocrinology 2009, 150, 1235–1249. [Google Scholar] [CrossRef] [PubMed]
- Wijchers, P.J.; Yandim, C.; Panousopoulou, E.; Ahmad, M.; Harker, N.; Saveliev, A.; Burgoyne, P.S.; Festenstein, R. Sexual dimorphism in mammalian autosomal gene regulation is determined not only by Sry but by sex chromosome complement as well. Dev. Cell 2010, 19, 477–484. [Google Scholar] [CrossRef] [PubMed]
- Werner, R.J.; Schultz, B.M.; Huhn, J.M.; Jelinek, J.; Madzo, J.; Engel, N. Sex chromosomes drive gene expression and regulatory dimorphisms in mouse embryonic stem cells. Biol. Sex Differ. 2017, 8, 28. [Google Scholar] [CrossRef] [PubMed]
- Jansen, R.; Batista, S.; Brooks, A.I.; Tischfield, J.A.; Willemsen, G.; van Grootheest, G.; Hottenga, J.J.; Milaneschi, Y.; Mbarek, H.; Madar, V.; et al. Sex differences in the human peripheral blood transcriptome. BMC Genom. 2014, 15, 33. [Google Scholar] [CrossRef]
- Irizar, H.; Munoz-Culla, M.; Sepulveda, L.; Saenz-Cuesta, M.; Prada, A.; Castillo-Trivino, T.; Zamora-Lopez, G.; Lopez de Munain, A.; Olascoaga, J.; Otaegui, D. Transcriptomic profile reveals gender-specific molecular mechanisms driving multiple sclerosis progression. PLoS ONE 2014, 9, e90482. [Google Scholar] [CrossRef]
- Reizel, Y.; Spiro, A.; Sabag, O.; Skversky, Y.; Hecht, M.; Keshet, I.; Berman, B.P.; Cedar, H. Gender-specific postnatal demethylation and establishment of epigenetic memory. Genes Dev. 2015, 29, 923–933. [Google Scholar] [CrossRef]
- Deegan, D.F.; Karbalaei, R.; Madzo, J.; Kulathinal, R.J.; Engel, N. The developmental origins of sex-biased expression in cardiac development. Biol. Sex Differ. 2019, 10, 46. [Google Scholar] [CrossRef]
- McCarthy, N.S.; Melton, P.E.; Cadby, G.; Yazar, S.; Franchina, M.; Moses, E.K.; Mackey, D.A.; Hewitt, A.W. Meta-analysis of human methylation data for evidence of sex-specific autosomal patterns. BMC Genom. 2014, 15, 981. [Google Scholar] [CrossRef]
- El-Maarri, O.; Walier, M.; Behne, F.; van Uum, J.; Singer, H.; Diaz-Lacava, A.; Nusgen, N.; Niemann, B.; Watzka, M.; Reinsberg, J.; et al. Methylation at global LINE-1 repeats in human blood are affected by gender but not by age or natural hormone cycles. PLoS ONE 2011, 6, e16252. [Google Scholar] [CrossRef]
- El-Maarri, O.; Becker, T.; Junen, J.; Manzoor, S.S.; Diaz-Lacava, A.; Schwaab, R.; Wienker, T.; Oldenburg, J. Gender specific differences in levels of DNA methylation at selected loci from human total blood: A tendency toward higher methylation levels in males. Hum. Genet. 2007, 122, 505–514. [Google Scholar] [CrossRef]
- Hall, E.; Volkov, P.; Dayeh, T.; Esguerra, J.L.; Salo, S.; Eliasson, L.; Ronn, T.; Bacos, K.; Ling, C. Sex differences in the genome-wide DNA methylation pattern and impact on gene expression, microRNA levels and insulin secretion in human pancreatic islets. Genome Biol. 2014, 15, 522. [Google Scholar] [CrossRef] [PubMed]
- Mamrut, S.; Avidan, N.; Staun-Ram, E.; Ginzburg, E.; Truffault, F.; Berrih-Aknin, S.; Miller, A. Integrative analysis of methylome and transcriptome in human blood identifies extensive sex- and immune cell-specific differentially methylated regions. Epigenetics 2015, 10, 943–957. [Google Scholar] [CrossRef] [PubMed]
- Davegardh, C.; Hall Wedin, E.; Broholm, C.; Henriksen, T.I.; Pedersen, M.; Pedersen, B.K.; Scheele, C.; Ling, C. Sex influences DNA methylation and gene expression in human skeletal muscle myoblasts and myotubes. Stem Cell Res. Ther. 2019, 10, 26. [Google Scholar] [CrossRef]
- Sharma, A.; Jamil, M.A.; Nuesgen, N.; Schreiner, F.; Priebe, L.; Hoffmann, P.; Herns, S.; Nothen, M.M.; Frohlich, H.; Oldenburg, J.; et al. DNA methylation signature in peripheral blood reveals distinct characteristics of human X chromosome numerical aberrations. Clin. Epigenetics 2015, 7, 76. [Google Scholar] [CrossRef]
- Trolle, C.; Nielsen, M.M.; Skakkebaek, A.; Lamy, P.; Vang, S.; Hedegaard, J.; Nordentoft, I.; Orntoft, T.F.; Pedersen, J.S.; Gravholt, C.H. Widespread DNA hypomethylation and differential gene expression in Turner syndrome. Sci. Rep. 2016, 6, 34220. [Google Scholar] [CrossRef]
- Skakkebaek, A.; Nielsen, M.M.; Trolle, C.; Vang, S.; Hornshoj, H.; Hedegaard, J.; Wallentin, M.; Bojesen, A.; Hertz, J.M.; Fedder, J.; et al. DNA hypermethylation and differential gene expression associated with Klinefelter syndrome. Sci. Rep. 2018, 8, 13740. [Google Scholar] [CrossRef]
- Ho, B.; Greenlaw, K.; Al Tuwaijri, A.; Moussette, S.; Martinez, F.; Giorgio, E.; Brusco, A.; Ferrero, G.B.; Linhares, N.D.; Valadares, E.R.; et al. X chromosome dosage and presence of SRY shape sex-specific differences in DNA methylation at an autosomal region in human cells. Biol. Sex Differ. 2018, 9, 10. [Google Scholar] [CrossRef]
- Grimm, S.A.; Shimbo, T.; Takaku, M.; Thomas, J.W.; Auerbach, S.; Bennett, B.D.; Bucher, J.R.; Burkholder, A.B.; Day, F.; Du, Y.; et al. DNA methylation in mice is influenced by genetics as well as sex and life experience. Nat. Commun. 2019, 10, 305. [Google Scholar] [CrossRef]
- Yen, A.; Kellis, M. Systematic chromatin state comparison of epigenomes associated with diverse properties including sex and tissue type. Nat. Commun. 2015, 6, 7973. [Google Scholar] [CrossRef]
- Kay, G.F.; Penny, G.D.; Patel, D.; Ashworth, A.; Brockdorff, N.; Rastan, S. Expression of Xist during mouse development suggests a role in the initiation of X chromosome inactivation. Cell 1993, 72, 171–182. [Google Scholar] [CrossRef]
- Alton, M.; Lau, M.P.; Villemure, M.; Taketo, T. The behavior of the X- and Y-chromosomes in the oocyte during meiotic prophase in the B6.Y(TIR)sex-reversed mouse ovary. Reproduction 2008, 135, 241–252. [Google Scholar] [CrossRef] [PubMed][Green Version]
- Eicher, E.; Washburn, L.; Whitney, J.; Morrow, K. Mus poschiavinus Y chromosome in the C57BL/6J murine genome causes sex reversal. Science 1982, 217, 535. [Google Scholar] [CrossRef] [PubMed]
- Nagamine, C.M.; Taketo, T.; Koo, G.C. Studies on the genetics of tda-1 XY sex reversal in the mouse. Differ. Res. Biol. Divers. 1987, 33, 223–231. [Google Scholar] [CrossRef] [PubMed]
- Amleh, A.; Smith, L.; Chen, H.; Taketo, T. Both nuclear and cytoplasmic components are defective in oocytes of the B6.Y(TIR) sex-reversed female mouse. Dev. Biol. 2000, 219, 277–286. [Google Scholar] [CrossRef]
- Bourgey, M.; Dali, R.; Eveleigh, R.; Chen, K.C.; Letourneau, L.; Fillon, J.; Michaud, M.; Caron, M.; Sandoval, J.; Lefebvre, F.; et al. GenPipes: An open-source framework for distributed and scalable genomic analyses. GigaScience 2019, 8. [Google Scholar] [CrossRef]
- Bolger, A.M.; Lohse, M.; Usadel, B. Trimmomatic: A flexible trimmer for Illumina sequence data. Bioinformatics 2014, 30, 2114–2120. [Google Scholar] [CrossRef]
- Krueger, F.; Andrews, S.R. Bismark: A flexible aligner and methylation caller for Bisulfite-Seq applications. Bioinformatics 2011, 27, 1571–1572. [Google Scholar] [CrossRef]
- Broad Institute. “Picard Toolkit.” Broad Institute, GitHub Repository. 2019. Available online: http://broadinstitute.github.io/picard/ (accessed on 5 June 2020).
- Database Resources of the National Center for Biotechnology Information. Nucleic Acids Res. 2017, 45, D12–D17. [CrossRef]
- Park, Y.; Wu, H. Differential methylation analysis for BS-seq data under general experimental design. Bioinformatics 2016, 32, 1446–1453. [Google Scholar] [CrossRef]
- Akalin, A.; Kormaksson, M.; Li, S.; Garrett-Bakelman, F.E.; Figueroa, M.E.; Melnick, A.; Mason, C.E. methylKit: A comprehensive R package for the analysis of genome-wide DNA methylation profiles. Genome Biol. 2012, 13, R87. [Google Scholar] [CrossRef]
- Gu, Z.; Eils, R.; Schlesner, M. Complex heatmaps reveal patterns and correlations in multidimensional genomic data. Bioinformatics 2016, 32, 2847–2849. [Google Scholar] [CrossRef] [PubMed]
- Lex, A.; Gehlenborg, N. Sets and intersections. Nat. Methods 2014, 11, 779. [Google Scholar] [CrossRef]
- Lex, A.; Gehlenborg, N.; Strobelt, H.; Vuillemot, R.; Pfister, H. UpSet: Visualization of Intersecting Sets. IEEE Trans. Vis. Comput. Graph. 2014, 20, 1983–1992. [Google Scholar] [CrossRef] [PubMed]
- Wang, H.-Q.; Tuominen, L.K.; Tsai, C.-J. SLIM: A sliding linear model for estimating the proportion of true null hypotheses in datasets with dependence structures. Bioinformatics 2011, 27, 225–231. [Google Scholar] [CrossRef] [PubMed]
- Cavalcante, R.G.; Sartor, M.A. annotatr: Genomic regions in context. Bioinformatics 2017, 33, 2381–2383. [Google Scholar] [CrossRef] [PubMed]
- Morgan, M. AnnotationHub: Client to Access AnnotationHub Resources; R Package Version 2.18.0. Available online: https://bioconductor.org/packages/devel/bioc/vignettes/AnnotationHub/inst/doc/AnnotationHub.html (accessed on 5 May 2020).
- Lawrence, M.; Huber, W.; Pagès, H.; Aboyoun, P.; Carlson, M.; Gentleman, R.; Morgan, M.T.; Carey, V.J. Software for computing and annotating genomic ranges. PLoS Comput. Biol. 2013, 9, e1003118. [Google Scholar] [CrossRef] [PubMed]
- Team, B.; Maintainer, B. TxDb.Mmusculus.UCSC.mm10.knownGene: Annotation Package for TxDb Object(s), 3.10.0. AnnotationHub: Client to Access AnnotationHub Resources; R Package Version 2.18.0. Available online: https://bioconductor.org/packages/release/data/annotation/html/TxDb.Mmusculus.UCSC.mm10.knownGene.html (accessed on 5 May 2020).
- Dunham, I.; Kundaje, A.; Aldred, S.F.; Collins, P.J.; Davis, C.A.; Doyle, F.; Epstein, C.B.; Frietze, S.; Harrow, J.; Kaul, R.; et al. An integrated encyclopedia of DNA elements in the human genome. Nature 2012, 489, 57–74. [Google Scholar] [CrossRef]
- Sloan, C.A.; Chan, E.T.; Davidson, J.M.; Malladi, V.S.; Strattan, J.S.; Hitz, B.C.; Gabdank, I.; Narayanan, A.K.; Ho, M.; Lee, B.T.; et al. ENCODE data at the ENCODE portal. Nucleic Acids Res. 2016, 44, D726–D732. [Google Scholar] [CrossRef]
- Yue, F.; Cheng, Y.; Breschi, A.; Vierstra, J.; Wu, W.; Ryba, T.; Sandstrom, R.; Ma, Z.; Davis, C.; Pope, B.D.; et al. A comparative encyclopedia of DNA elements in the mouse genome. Nature 2014, 515, 355–364. [Google Scholar] [CrossRef]
- Ernst, J.; Kellis, M. Chromatin-state discovery and genome annotation with ChromHMM. Nat. Protoc. 2017, 12, 2478–2492. [Google Scholar] [CrossRef]
- Jurka, J. Repbase update: A database and an electronic journal of repetitive elements. Trends Genet. Tig 2000, 16, 418–420. [Google Scholar] [CrossRef]
- Smit, A.F. Interspersed repeats and other mementos of transposable elements in mammalian genomes. Curr. Opin. Genet. Dev. 1999, 9, 657–663. [Google Scholar] [CrossRef]
- Smit, A.F. The origin of interspersed repeats in the human genome. Curr. Opin. Genet. Dev. 1996, 6, 743–748. [Google Scholar] [CrossRef]
- Jacques, P.E.; Jeyakani, J.; Bourque, G. The majority of primate-specific regulatory sequences are derived from transposable elements. PLoS Genet. 2013, 9, e1003504. [Google Scholar] [CrossRef] [PubMed]
- Heinz, S.; Benner, C.; Spann, N.; Bertolino, E.; Lin, Y.C.; Laslo, P.; Cheng, J.X.; Murre, C.; Singh, H.; Glass, C.K. Simple combinations of lineage-determining transcription factors prime cis-regulatory elements required for macrophage and B cell identities. Mol. Cell 2010, 38, 576–589. [Google Scholar] [CrossRef] [PubMed]
- Dobin, A.; Davis, C.A.; Schlesinger, F.; Drenkow, J.; Zaleski, C.; Jha, S.; Batut, P.; Chaisson, M.; Gingeras, T.R. STAR: Ultrafast universal RNA-seq aligner. Bioinformatics 2013, 29, 15–21. [Google Scholar] [CrossRef]
- Anders, S.; Pyl, P.T.; Huber, W. HTSeq—A Python framework to work with high-throughput sequencing data. Bioinformatics 2015, 31, 166–169. [Google Scholar] [CrossRef]
- Anders, S.; Huber, W. Differential expression analysis for sequence count data. Genome Biol. 2010, 11, R106. [Google Scholar] [CrossRef]
- Robinson, M.D.; McCarthy, D.J.; Smyth, G.K. edgeR: A Bioconductor package for differential expression analysis of digital gene expression data. Bioinformatics 2010, 26, 139–140. [Google Scholar] [CrossRef]
- Bray, N.L.; Pimentel, H.; Melsted, P.; Pachter, L. Near-optimal probabilistic RNA-seq quantification. Nat Biotechnol. 2016, 34, 525–527. [Google Scholar] [CrossRef]
- Pimentel, H.; Bray, N.L.; Puente, S.; Melsted, P.; Pachter, L. Differential analysis of RNA-seq incorporating quantification uncertainty. Nat. Methods 2017, 14, 687–690. [Google Scholar] [CrossRef] [PubMed]
- Quinlan, A.R.; Hall, I.M. BEDTools: A flexible suite of utilities for comparing genomic features. Bioinformatics 2010, 26, 841–842. [Google Scholar] [CrossRef]
- Kachitvichyanukul, V.; Schmeiser, B. Computer generation of hypergeometric random variates. J. Stat. Comput. Simul. 1985, 22, 127–145. [Google Scholar] [CrossRef]
- Johnson, N.L.; Kemp, A.W.; Kotz, S. Hypergeometric Distributions. In Univariate Discrete Distributions; John Wiley & Sons, Inc.: Hoboken, NJ, USA, 2005; pp. 251–301. [Google Scholar]
- Garcia-Calzon, S.; Perfilyev, A.; de Mello, V.D.; Pihlajamaki, J.; Ling, C. Sex Differences in the Methylome and Transcriptome of the Human Liver and Circulating HDL-Cholesterol Levels. J. Clin. Endocrinol. Metab. 2018, 103, 4395–4408. [Google Scholar] [CrossRef] [PubMed]
- Park, S.; Zeidan, K.; Shin, J.S.; Taketo, T. SRY upregulation of SOX9 is inefficient and delayed, allowing ovarian differentiation, in the B6.Y(TIR) gonad. Differentiation 2011, 82, 18–27. [Google Scholar] [CrossRef]
- Coward, P.; Nagai, K.; Chen, D.; Thomas, H.D.; Nagamine, C.M.; Lau, Y.F. Polymorphism of a CAG trinucleotide repeat within Sry correlates with B6.YDom sex reversal. Nat. Genet. 1994, 6, 245–250. [Google Scholar] [CrossRef]
- Taketo-Hosotani, T.; Nishioka, Y.; Nagamine, C.M.; Villalpando, I.; Merchant-Larios, H. Development and fertility of ovaries in the B6.YDOM sex-reversed female mouse. Development 1989, 107, 95–105. [Google Scholar]
- Lane, P.W.; Davisson, M.T. Patchy fur (Paf), a semidominant X-linked gene associated with a high level of X-Y nondisjunction in male mice. J. Hered. 1990, 81, 43–50. [Google Scholar] [CrossRef]
- Burgoyne, P.S.; Evans, E.P. A high frequency of XO offspring from X(Paf)Y* male mice: Evidence that the Paf mutation involves an inversion spanning the X PAR boundary. Cytogenet. Cell Genet. 2000, 91, 57–61. [Google Scholar] [CrossRef]
- Korobova, O.; Lane, P.W.; Perry, J.; Palmer, S.; Ashworth, A.; Davisson, M.T.; Arnheim, N. Patchy fur, a mouse coat mutation associated with X-Y nondisjunction, maps to the pseudoautosomal boundary region. Genomics 1998, 54, 556–559. [Google Scholar] [CrossRef]
- Aryee, M.J.; Jaffe, A.E.; Corrada-Bravo, H.; Ladd-Acosta, C.; Feinberg, A.P.; Hansen, K.D.; Irizarry, R.A. Minfi: A flexible and comprehensive Bioconductor package for the analysis of Infinium DNA methylation microarrays. Bioinformatics 2014, 30, 1363–1369. [Google Scholar] [CrossRef]
- Korthauer, K.; Chakraborty, S.; Benjamini, Y.; Irizarry, R.A. Detection and accurate false discovery rate control of differentially methylated regions from whole genome bisulfite sequencing. Biostatistics 2019, 20, 367–383. [Google Scholar] [CrossRef]
- Slotkin, R.K.; Martienssen, R. Transposable elements and the epigenetic regulation of the genome. Nat. Rev. Genet. 2007, 8, 272–285. [Google Scholar] [CrossRef] [PubMed]
- Zheng, Y.; Joyce, B.T.; Liu, L.; Zhang, Z.; Kibbe, W.A.; Zhang, W.; Hou, L. Prediction of genome-wide DNA methylation in repetitive elements. Nucleic Acids Res. 2017, 45, 8697–8711. [Google Scholar] [CrossRef] [PubMed]
- Smith, Z.D.; Meissner, A. DNA methylation: Roles in mammalian development. Nat. Rev. Genet. 2013, 14, 204–220. [Google Scholar] [CrossRef]
- Bult, C.J.; Blake, J.A.; Smith, C.L.; Kadin, J.A.; Richardson, J.E. Mouse Genome Database (MGD) 2019. Nucleic Acids Res. 2019, 47, D801–D806. [Google Scholar] [CrossRef]
- McCormick, H.; Young, P.E.; Hur, S.S.J.; Booher, K.; Chung, H.; Cropley, J.E.; Giannoulatou, E.; Suter, C.M. Isogenic mice exhibit sexually-dimorphic DNA methylation patterns across multiple tissues. BMC Genom. 2017, 18, 966. [Google Scholar] [CrossRef] [PubMed]
- Arnold, A.P. Sexual differentiation of brain and other tissues: Five questions for the next 50 years. Horm. Behav. 2020, 120, 104691. [Google Scholar] [CrossRef]
- Engel, N. Sex differences in early embryogenesis: Inter-chromosomal regulation sets the stage for sex-biased networks. BioEssays 2018, 40, 1800073. [Google Scholar] [CrossRef]
- Arnold, A.P. Rethinking sex determination of non-gonadal tissues. Curr. Top. Dev. Biol. 2019, 134, 289–315. [Google Scholar] [CrossRef]
- AlSiraj, Y.; Chen, X.; Thatcher, S.E.; Temel, R.E.; Cai, L.; Blalock, E.; Katz, W.; Ali, H.M.; Petriello, M.; Deng, P.; et al. XX sex chromosome complement promotes atherosclerosis in mice. Nat. Commun. 2019, 10, 2631. [Google Scholar] [CrossRef] [PubMed]
- Duncan, C.G.; Grimm, S.A.; Morgan, D.L.; Bushel, P.R.; Bennett, B.D.; Roberts, J.D.; Tyson, F.L.; Merrick, B.A.; Wade, P.A. Dosage compensation and DNA methylation landscape of the X chromosome in mouse liver. Sci. Rep. 2018, 8, 10138. [Google Scholar] [CrossRef] [PubMed]
- Yang, C.; Chapman, A.G.; Kelsey, A.D.; Minks, J.; Cotton, A.M.; Brown, C.J. X-chromosome inactivation: Molecular mechanisms from the human perspective. Hum. Genet. 2011, 130, 175–185. [Google Scholar] [CrossRef] [PubMed]
- Posynick, B.J.; Brown, C.J. Escape From X-Chromosome Inactivation: An Evolutionary Perspective. Front. Cell Dev. Biol. 2019, 7, 241. [Google Scholar] [CrossRef] [PubMed]
- Bell, J.T.; Pai, A.A.; Pickrell, J.K.; Gaffney, D.J.; Pique-Regi, R.; Degner, J.F.; Gilad, Y.; Pritchard, J.K. DNA methylation patterns associate with genetic and gene expression variation in HapMap cell lines. Genome Biol. 2011, 12, R10. [Google Scholar] [CrossRef]
- van Eijk, K.R.; de Jong, S.; Boks, M.P.; Langeveld, T.; Colas, F.; Veldink, J.H.; de Kovel, C.G.; Janson, E.; Strengman, E.; Langfelder, P.; et al. Genetic analysis of DNA methylation and gene expression levels in whole blood of healthy human subjects. BMC Genom. 2012, 13, 636. [Google Scholar] [CrossRef]
- Drong, A.W.; Nicholson, G.; Hedman, A.K.; Meduri, E.; Grundberg, E.; Small, K.S.; Shin, S.Y.; Bell, J.T.; Karpe, F.; Soranzo, N.; et al. The presence of methylation quantitative trait loci indicates a direct genetic influence on the level of DNA methylation in adipose tissue. PLoS ONE 2013, 8, e55923. [Google Scholar] [CrossRef]
- Wagner, J.R.; Busche, S.; Ge, B.; Kwan, T.; Pastinen, T.; Blanchette, M. The relationship between DNA methylation, genetic and expression inter-individual variation in untransformed human fibroblasts. Genome Biol. 2014, 15, R37. [Google Scholar] [CrossRef]
- Orozco, L.D.; Rubbi, L.; Martin, L.J.; Fang, F.; Hormozdiari, F.; Che, N.; Smith, A.D.; Lusis, A.J.; Pellegrini, M. Intergenerational genomic DNA methylation patterns in mouse hybrid strains. Genome Biol. 2014, 15, R68. [Google Scholar] [CrossRef]
- Natt, D.; Agnvall, B.; Jensen, P. Large sex differences in chicken behavior and brain gene expression coincide with few differences in promoter DNA-methylation. PLoS ONE 2014, 9, e96376. [Google Scholar] [CrossRef]
- Gagnier, L.; Belancio, V.P.; Mager, D.L. Mouse germ line mutations due to retrotransposon insertions. Mob. DNA 2019, 10, 15. [Google Scholar] [CrossRef] [PubMed]
- Edwards, J.R.; Yarychkivska, O.; Boulard, M.; Bestor, T.H. DNA methylation and DNA methyltransferases. Epigenetics Chromatin 2017, 10, 23. [Google Scholar] [CrossRef] [PubMed]
- Rausch, C.; Hastert, F.D.; Cardoso, M.C. DNA Modification Readers and Writers and Their Interplay. J. Mol. Biol. 2019. [Google Scholar] [CrossRef] [PubMed]
- Xiao, Y.; Word, B.; Starlard-Davenport, A.; Haefele, A.; Lyn-Cook, B.D.; Hammons, G. Age and gender affect DNMT3a and DNMT3b expression in human liver. Cell Biol. Toxicol. 2008, 24, 265–272. [Google Scholar] [CrossRef] [PubMed]
- Ito, S.; Hirabayashi, K.; Moriishi, K.; Matsui, Y.; Moriya, K.; Koike, K.; Matsuura, Y.; Shiota, K.; Yagi, S. Novel sex-dependent differentially methylated regions are demethylated in adult male mouse livers. Biochem. Biophys. Res. Commun. 2015, 462, 332–338. [Google Scholar] [CrossRef]
- Bertho, S.; Pasquier, J.; Pan, Q.; Le Trionnaire, G.; Bobe, J.; Postlethwait, J.H.; Pailhoux, E.; Schartl, M.; Herpin, A.; Guiguen, Y. Foxl2 and Its Relatives Are Evolutionary Conserved Players in Gonadal Sex Differentiation. Sex. Dev. 2016, 10, 111–129. [Google Scholar] [CrossRef]
- Li, Z.; Tuteja, G.; Schug, J.; Kaestner, K.H. Foxa1 and Foxa2 are essential for sexual dimorphism in liver cancer. Cell 2012, 148, 72–83. [Google Scholar] [CrossRef]
- Zhang, Y.; Zhang, D.; Li, Q.; Liang, J.; Sun, L.; Yi, X.; Chen, Z.; Yan, R.; Xie, G.; Li, W.; et al. Nucleation of DNA repair factors by FOXA1 links DNA demethylation to transcriptional pioneering. Nat. Genet. 2016, 48, 1003–1013. [Google Scholar] [CrossRef]
- Zheng, D.; Wang, X.; Antonson, P.; Gustafsson, J.A.; Li, Z. Genomics of sex hormone receptor signaling in hepatic sexual dimorphism. Mol. Cell. Endocrinol. 2018, 471, 33–41. [Google Scholar] [CrossRef]
- Jozwik, K.M.; Chernukhin, I.; Serandour, A.A.; Nagarajan, S.; Carroll, J.S. FOXA1 Directs H3K4 Monomethylation at Enhancers via Recruitment of the Methyltransferase MLL3. Cell Rep. 2016, 17, 2715–2723. [Google Scholar] [CrossRef]
- Iwafuchi-Doi, M. The mechanistic basis for chromatin regulation by pioneer transcription factors. Wiley Interdiscip. Rev. Syst. Biol. Med. 2019, 11, e1427. [Google Scholar] [CrossRef] [PubMed]
- Mayran, A.; Drouin, J. Pioneer transcription factors shape the epigenetic landscape. J. Biol. Chem. 2018, 293, 13795–13804. [Google Scholar] [CrossRef] [PubMed]
- Wan, Z.Y.; Xia, J.H.; Lin, G.; Wang, L.; Lin, V.C.; Yue, G.H. Genome-wide methylation analysis identified sexually dimorphic methylated regions in hybrid tilapia. Sci. Rep. 2016, 6, 35903. [Google Scholar] [CrossRef] [PubMed]
- Ge, C.; Ye, J.; Zhang, H.; Zhang, Y.; Sun, W.; Sang, Y.; Capel, B.; Qian, G. Dmrt1 induces the male pathway in a turtle species with temperature-dependent sex determination. Development 2017, 144, 2222–2233. [Google Scholar] [CrossRef] [PubMed]
- Ge, C.; Ye, J.; Weber, C.; Sun, W.; Zhang, H.; Zhou, Y.; Cai, C.; Qian, G.; Capel, B. The histone demethylase KDM6B regulates temperature-dependent sex determination in a turtle species. Science 2018, 360, 645–648. [Google Scholar] [CrossRef]
- Anastasiadi, D.; Vandeputte, M.; Sanchez-Baizan, N.; Allal, F.; Piferrer, F. Dynamic epimarks in sex-related genes predict gonad phenotype in the European sea bass, a fish with mixed genetic and environmental sex determination. Epigenetics 2018, 13, 988–1011. [Google Scholar] [CrossRef]
- Metzger, D.C.H.; Schulte, P.M. The DNA Methylation Landscape of Stickleback Reveals Patterns of Sex Chromosome Evolution and Effects of Environmental Salinity. Genome Biol. Evol. 2018, 10, 775–785. [Google Scholar] [CrossRef]
- Graves, J.A. Evolution of vertebrate sex chromosomes and dosage compensation. Nat. Rev. Genet. 2016, 17, 33–46. [Google Scholar] [CrossRef]


© 2020 by the authors. Licensee MDPI, Basel, Switzerland. This article is an open access article distributed under the terms and conditions of the Creative Commons Attribution (CC BY) license (http://creativecommons.org/licenses/by/4.0/).
Share and Cite
Zhuang, Q.K.-W.; Galvez, J.H.; Xiao, Q.; AlOgayil, N.; Hyacinthe, J.; Taketo, T.; Bourque, G.; Naumova, A.K. Sex Chromosomes and Sex Phenotype Contribute to Biased DNA Methylation in Mouse Liver. Cells 2020, 9, 1436. https://doi.org/10.3390/cells9061436
Zhuang QK-W, Galvez JH, Xiao Q, AlOgayil N, Hyacinthe J, Taketo T, Bourque G, Naumova AK. Sex Chromosomes and Sex Phenotype Contribute to Biased DNA Methylation in Mouse Liver. Cells. 2020; 9(6):1436. https://doi.org/10.3390/cells9061436
Chicago/Turabian StyleZhuang, Qinwei Kim-Wee, Jose Hector Galvez, Qian Xiao, Najla AlOgayil, Jeffrey Hyacinthe, Teruko Taketo, Guillaume Bourque, and Anna K. Naumova. 2020. "Sex Chromosomes and Sex Phenotype Contribute to Biased DNA Methylation in Mouse Liver" Cells 9, no. 6: 1436. https://doi.org/10.3390/cells9061436
APA StyleZhuang, Q. K.-W., Galvez, J. H., Xiao, Q., AlOgayil, N., Hyacinthe, J., Taketo, T., Bourque, G., & Naumova, A. K. (2020). Sex Chromosomes and Sex Phenotype Contribute to Biased DNA Methylation in Mouse Liver. Cells, 9(6), 1436. https://doi.org/10.3390/cells9061436