Live-Cell Cardiac-Specific High-Throughput Screening Platform for Drug-Like Molecules That Enhance Ca2+ Transport

 , and
, and 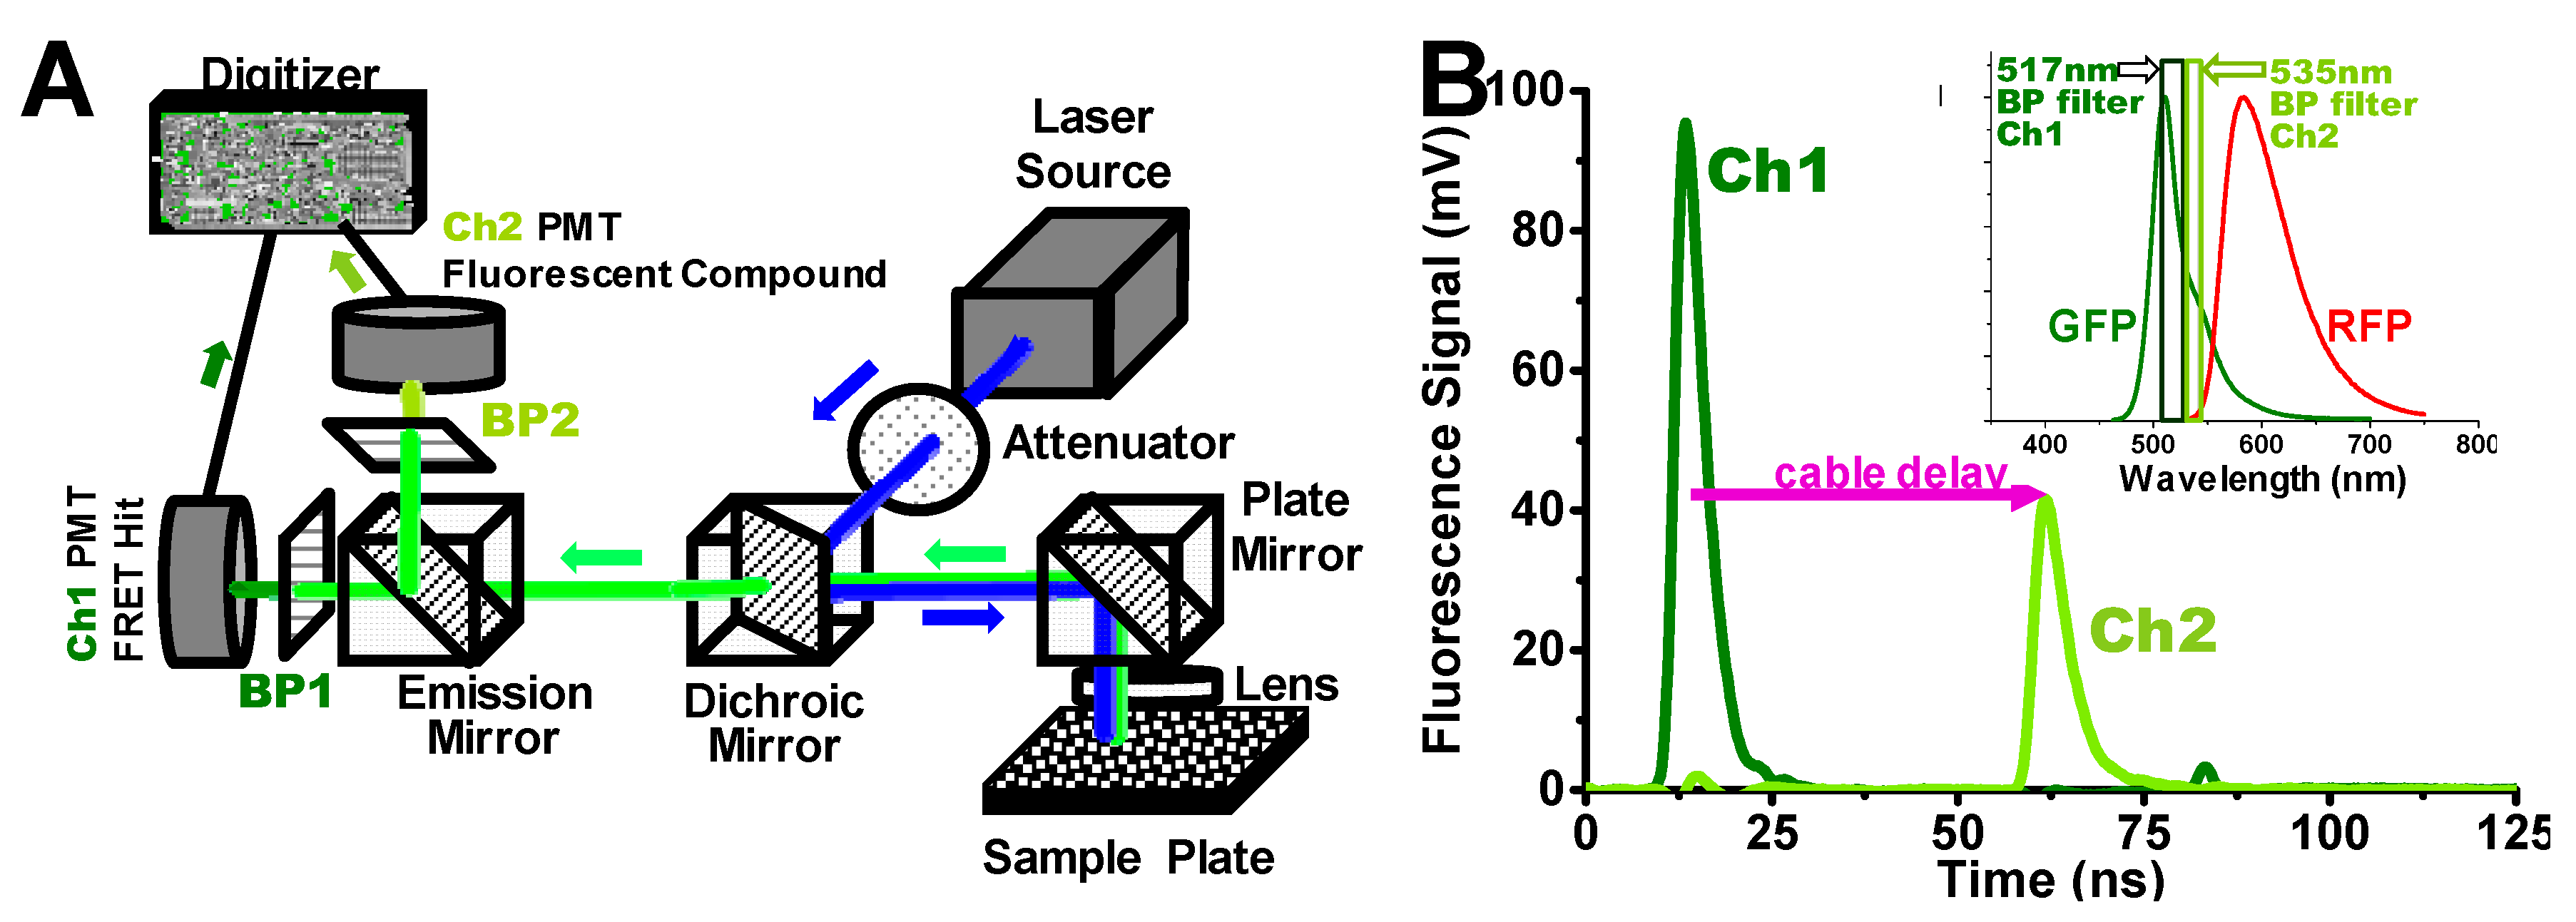
Abstract
1. Introduction
2. Materials and Methods
2.1. Molecular Biology
2.2. Cell Culture
2.3. Homogenate Preparation
2.4. Immunoblot Assay
2.5. NADH-Enzyme Coupled ATPase Activity Assay
2.6. Calcium-Uptake Assays
2.7. HTS Cell Prep
2.8. HTS Data Acquisition and Analysis after Data Acquisition
τ = X1 τ1 + x2 τ2
3. Results
3.1. Two-Channel Detection
3.2. SERCA2a-PLB FRET Biosensor
3.3. SERCA2a-PLB Fusion FRET Biosensor Expression and Activity
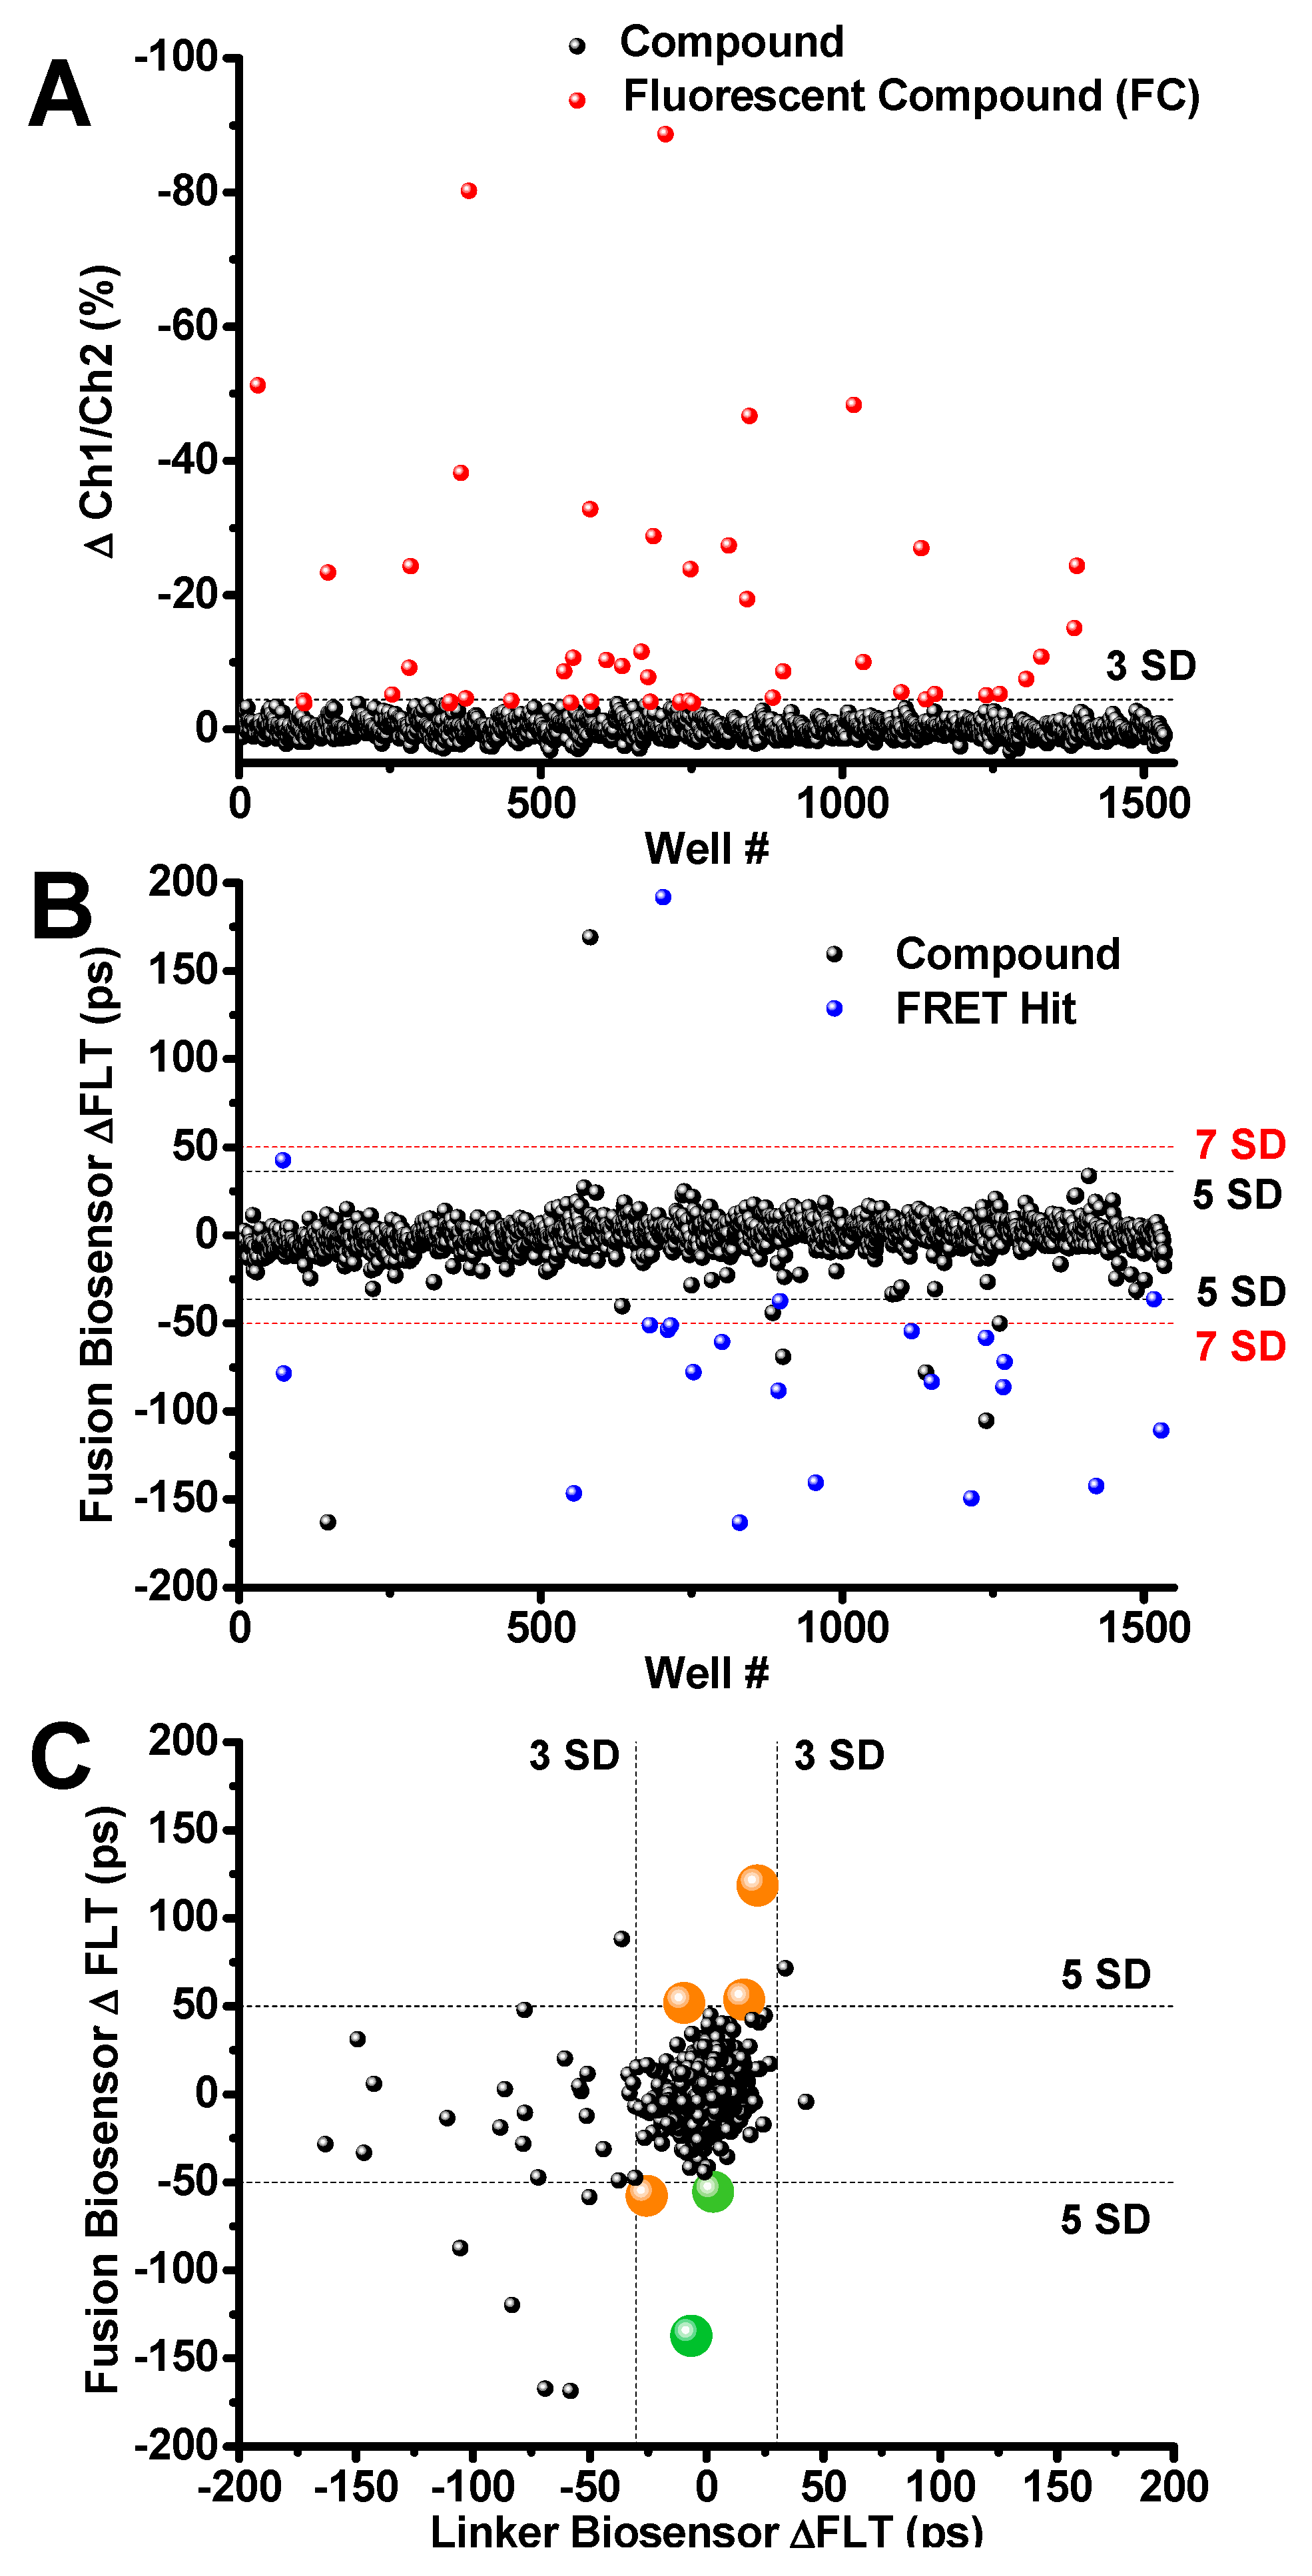
3.4. HTS Results
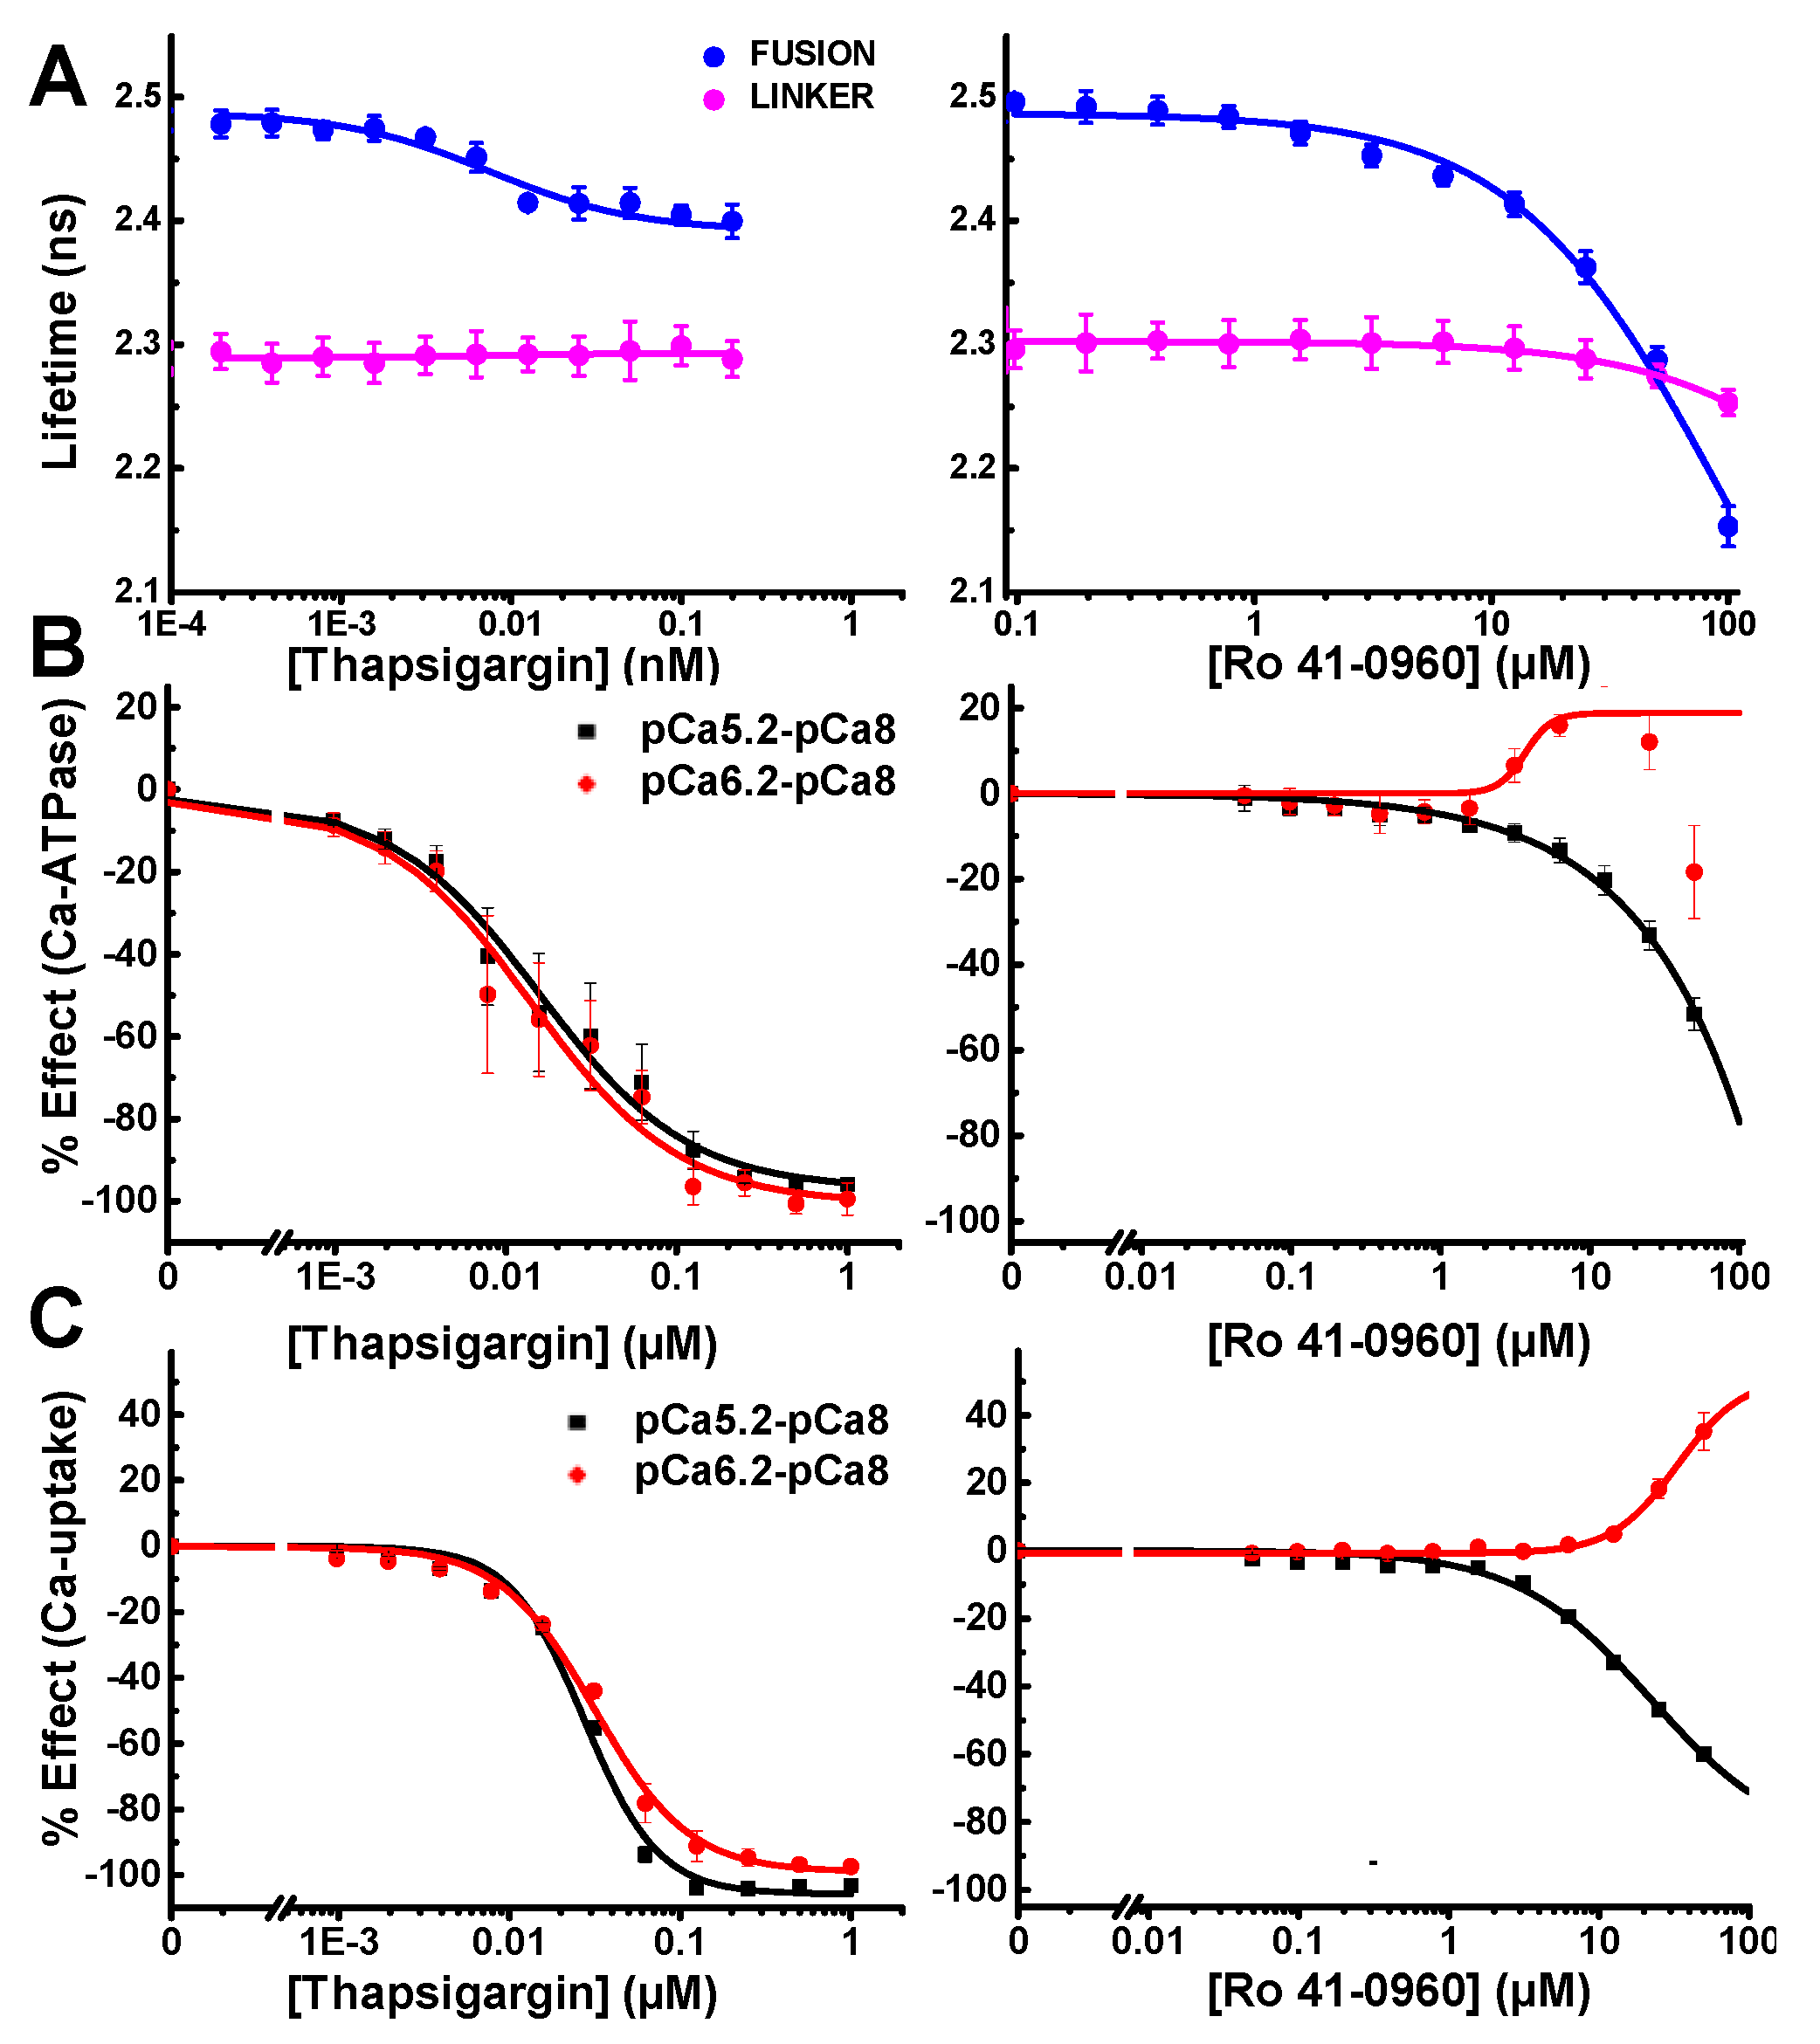
3.5. FRET and Functional Concentration-Response Curves (CRC)
4. Discussion
5. Conclusions
Supplementary Materials
Author Contributions
Funding
Acknowledgments
Conflicts of Interest
References
- MacLennan, D.H.; Kranias, E.G. Phospholamban: A crucial regulator of cardiac contractility. Nat. Rev. Mol. Cell Boil. 2003, 4, 566–577. [Google Scholar] [CrossRef] [PubMed]
- Primeau, J.O.; Armanious, G.P.; Fisher, M.E.; Young, H.S. The SarcoEndoplasmic Reticulum Calcium ATPase. Sub-cell. Biochem. 2018, 87, 229–258. [Google Scholar] [CrossRef]
- Gwathmey, J.K.J.K.; Yerevanian, A.; Hajjar, R.J. Targeting Sarcoplasmic Reticulum Calcium ATPase by Gene Therapy. Hum. Gene Ther. 2013, 24, 937–947. [Google Scholar] [CrossRef] [PubMed]
- Naim, C.; Yerevanian, A.; Hajjar, R.J. Gene Therapy for Heart Failure: Where Do We Stand? Curr. Cardiol. Rep. 2013, 15, 333. [Google Scholar] [CrossRef]
- Hulot, J.-S.; Ishikawa, K.; Hajjar, R.J. Gene therapy for the treatment of heart failure: Promise postponed. Eur. Heart J. 2016, 37, 1651–1658. [Google Scholar] [CrossRef]
- Penny, W.F.; Hammond, H.K. Randomized Clinical Trials of Gene Transfer for Heart Failure with Reduced Ejection Fraction. Hum. Gene Ther. 2017, 28, 378–384. [Google Scholar] [CrossRef]
- Gruber, S.J.; Cornea, R.L.; Li, J.; Peterson, K.C.; Schaaf, T.M.; Gillispie, G.D.; Dahl, R.; Zsebo, K.M.; Robia, S.L.; Thomas, D.D.T. Discovery of enzyme modulators via high-throughput time-resolved FRET in living cells. J. Biomol. Screen. 2014, 19, 215–222. [Google Scholar] [CrossRef]
- Schaaf, T.M.; Li, A.; Grant, B.D.; Peterson, K.; Yuen, S.; Bawaskar, P.; Kleinboehl, E.; Li, J.; Thomas, D.D.T.; Gillispie, G.D. Red-Shifted FRET Biosensors for High-Throughput Fluorescence Lifetime Screening. Biosensors 2018, 8, 99. [Google Scholar] [CrossRef]
- Schaaf, T.M.; Peterson, K.; Grant, B.D.; Yuen, S.L.; Bawaskar, P.; Li, J.; Muretta, J.M.; Gillispie, G.D.; Thomas, D.D.T. High-Throughput Spectral and Lifetime-Based FRET Screening in Living Cells to Identify Small-Molecule Effectors of SERCA. Biophys. J. 2017, 112, 331a. [Google Scholar] [CrossRef][Green Version]
- Petersen, K.J.; Peterson, K.C.; Muretta, J.M.; Higgins, S.E.; Gillispie, G.D.; Thomas, D.D.T. Fluorescence lifetime plate reader: Resolution and precision meet high-throughput. Rev. Sci. Instrum. 2014, 85, 113101. [Google Scholar] [CrossRef]
- Hellenkamp, B.; Schmid, S.; Doroshenko, O.; Opanasyuk, O.; Kühnemuth, R.; Adariani, S.R.; Ambrose, B.; Aznauryan, M.; Barth, A.; Birkedal, V.; et al. Publisher Correction: Precision and accuracy of single-molecule FRET measurements—A multi-laboratory benchmark study. Nat. Methods 2018, 15, 984. [Google Scholar] [CrossRef] [PubMed]
- Lee, N.K.; Kapanidis, A.N.; Wang, Y.; Michalet, X.; Mukhopadhyay, J.; Ebright, R.H.; Weiss, S. Accurate FRET Measurements within Single Diffusing Biomolecules Using Alternating-Laser Excitation. Biophys. J. 2005, 88, 2939–2953. [Google Scholar] [CrossRef] [PubMed]
- Stroik, D.R.; Yuen, S.L.; Janicek, K.A.; Schaaf, T.M.; Li, J.; Ceholski, D.K.; Hajjar, R.J.; Cornea, R.L.; Thomas, D.D.T. Targeting protein-protein interactions for therapeutic discovery via FRET-based high-throughput screening in living cells. Sci. Rep. 2018, 8, 12560. [Google Scholar] [CrossRef] [PubMed]
- Rohde, J.A.; Thomas, D.D.T.; Muretta, J.M. Heart failure drug changes the mechanoenzymology of the cardiac myosin powerstroke. Proc. Natl. Acad. Sci. USA 2017, 114, E1796–E1804. [Google Scholar] [CrossRef] [PubMed]
- Rohde, J.A.; Roopnarine, O.; Thomas, D.D.; Muretta, J.M. Mavacamten stabilizes an autoinhibited state of two-headed cardiac myosin. Proc. Natl. Acad. Sci. USA 2018, 115, E7486–E7494. [Google Scholar] [CrossRef]
- Rebbeck, R.T.; Essawy, M.M.; Nitu, F.R.; Grant, B.D.; Gillispie, G.D.; Thomas, D.D.T.; Bers, D.M.; Cornea, R.L. High-Throughput Screens to Discover Small-Molecule Modulators of Ryanodine Receptor Calcium Release Channels. SLAS Discov. Adv. Life Sci. R&D 2016, 22, 176–186. [Google Scholar] [CrossRef]
- Rebbeck, R.T.; Singh, D.P.; Janicek, K.A.; Bers, D.M.; Thomas, D.D.T.; Launikonis, B.; Cornea, R.L. RyR1-targeted drug discovery pipeline integrating FRET-based high-throughput screening and human myofiber dynamic Ca2+ assays. Sci. Rep. 2020, 10, 1–13. [Google Scholar] [CrossRef]
- Lo, C.H.; Lim, C.K.-W.; Ding, Z.; Wickramasinghe, S.P.; Braun, A.R.; Ashe, K.H.; Rhoades, E.; Thomas, D.D.; Sachs, J.N. Targeting the ensemble of heterogeneous tau oligomers in cells: A novel small molecule screening platform for tauopathies. Alzheimer’s Dement. 2019, 15, 1489–1502. [Google Scholar] [CrossRef]
- Lo, C.H.; Schaaf, T.M.; Grant, B.D.; Lim, C.K.-W.; Bawaskar, P.; Aldrich, C.C.; Thomas, D.D.; Sachs, J.N. Noncompetitive inhibitors of TNFR1 probe conformational activation states. Sci. Signal. 2019, 12, eaav5637. [Google Scholar] [CrossRef]
- Lo, C.H.; Vunnam, N.; Lewis, A.K.; Chiu, T.-L.; Brummel, B.E.; Schaaf, T.M.; Grant, B.D.; Bawaskar, P.; Thomas, D.D.T.; Sachs, J.N. An Innovative High-Throughput Screening Approach for Discovery of Small Molecules That Inhibit TNF Receptors. SLAS Discov. Adv. Life Sci. R&D 2017, 22, 950–961. [Google Scholar] [CrossRef]
- Ruff, E.F.; Muretta, J.M.; Thompson, A.R.; Lake, E.W.; Cyphers, S.; Albanese, S.; Hanson, S.; Behr, J.M.; Thomas, D.D.T.; Chodera, J.D.; et al. A dynamic mechanism for allosteric activation of Aurora kinase A by activation loop phosphorylation. eLife 2018, 7, e32766. [Google Scholar] [CrossRef]
- Lake, E.W.; Muretta, J.M.; Thompson, A.R.; Rasmussen, D.; Majumdar, A.; Faber, E.B.; Ruff, E.F.; Thomas, D.D.; Levinson, N.M. Quantitative conformational profiling of kinase inhibitors reveals origins of selectivity for Aurora kinase activation states. Proc. Natl. Acad. Sci. USA 2018, 115, E11894–E11903. [Google Scholar] [CrossRef] [PubMed]
- Schaaf, T.M.; Peterson, K.C.; Grant, B.D.; Thomas, D.D.T.; Gillispie, G.D. Spectral Unmixing Plate Reader: High-Throughput, High-Precision FRET Assays in Living Cells. SLAS Discov. Adv. Life Sci. R&D 2016, 22, 250–261. [Google Scholar] [CrossRef]
- Chen, Z. A phospholamban-tethered cardiac Ca2+ pump reveals stoichiometry and dynamic interactions between the two proteins. Biochem. J. 2011, 439, 313–319. [Google Scholar] [CrossRef] [PubMed]
- Antipenko, A.Y.; Spielman, A.I.; Sassaroli, M.; Kirchberger, M.A. Comparison of the Kinetic Effects of Phospholamban Phosphorylation and Anti-phospholamban Monoclonal Antibody on the Calcium Pump in Purified Cardiac Sarcoplasmic Reticulum Membranes†. Biochemistry 1997, 36, 12903–12910. [Google Scholar] [CrossRef]
- Mueller, B.; Karim, C.; Negrashov, I.V.; Kutchai, H.; Thomas, D.D.T. Direct Detection of Phospholamban and Sarcoplasmic Reticulum Ca-ATPase Interaction in Membranes Using Fluorescence Resonance Energy Transfer†. Biochemistry 2004, 43, 8754–8765. [Google Scholar] [CrossRef]
- Baell, J.B.; A Walters, M. Chemistry: Chemical con artists foil drug discovery. Nature 2014, 513, 481–483. [Google Scholar] [CrossRef]
- Bidwell, P.; Blackwell, D.J.; Hou, Z.; Zima, A.V.; Robia, S.L. Phospholamban Binds with Differential Affinity to Calcium Pump Conformers*. J. Boil. Chem. 2011, 286, 35044–35050. [Google Scholar] [CrossRef]
- Akin, B.L.; Hurley, T.D.; Chen, Z.; Jones, L.R. The Structural Basis for Phospholamban Inhibition of the Calcium Pump in Sarcoplasmic Reticulum*. J. Boil. Chem. 2013, 288, 30181–30191. [Google Scholar] [CrossRef]
- Subach, O.M.; Malashkevich, V.N.; Zencheck, W.D.; Morozova, K.S.; Piatkevich, K.D.; Almo, S.C.; Verkhusha, V.V. Structural Characterization of Acylimine-Containing Blue and Red Chromophores in mTagBFP and TagRFP Fluorescent Proteins. Chem. Boil. 2010, 17, 333–341. [Google Scholar] [CrossRef]
- Yang, F.; Moss, L.G.; Phillips, G.N. The molecular structure of green fluorescent protein. Nat. Biotechnol. 1996, 14, 1246–1251. [Google Scholar] [CrossRef] [PubMed]
- Simmerman, H.K.B.; Jones, L.R. Phospholamban: Protein structure, mechanism of action, and role in cardiac function. Physiol. Rev. 1998, 78, 921–947. [Google Scholar] [CrossRef] [PubMed]
- Cornea, R.L.; Autry, J.M.; Chen, Z.; Jones, L.R. Reexamination of the Role of the Leucine/Isoleucine Zipper Residues of Phospholamban in Inhibition of the Ca2+Pump of Cardiac Sarcoplasmic Reticulum. J. Boil. Chem. 2000, 275, 41487–41494. [Google Scholar] [CrossRef] [PubMed]
- Rogers, T.B.; Inesi, G.; Wade, R.; Lederer, W.J. Use of thapsigargin to study Ca2+ homeostasis in cardiac cells. Biosci. Rep. 1995, 15, 341–349. [Google Scholar] [CrossRef] [PubMed]
- Storch, A.; Blessing, H.; Bareiss, M.; Jankowski, S.; Ling, Z.D.; Carvey, P.; Schwarz, J. Catechol-O-methyltransferase Inhibition Attenuates Levodopa Toxicity in Mesencephalic Dopamine Neurons. Mol. Pharmacol. 2000, 57, 589–594. [Google Scholar] [CrossRef]
- Yang, H.; Ahn, C.; Jeung, E.-B. Differential expression of calcium transport genes caused by COMT inhibition in the duodenum, kidney and placenta of pregnant mice. Mol. Cell. Endocrinol. 2015, 401, 45–55. [Google Scholar] [CrossRef]
- Birmingham, A.; Selfors, L.M.; Forster, T.; Wrobel, D.; Kennedy, C.J.; Shanks, E.; Santoyo-Lopez, J.; Dunican, D.J.; Long, A.; Kelleher, D.; et al. Statistical methods for analysis of high-throughput RNA interference screens. Nat. Methods 2009, 6, 569–575. [Google Scholar] [CrossRef]
- Meyer, S.; Lorenz, C.; Başer, B.; Wördehoff, M.; Jäger, V.; Heuvel, J.V.D. Multi-Host Expression System for Recombinant Production of Challenging Proteins. PLoS ONE 2013, 8, e68674. [Google Scholar] [CrossRef]
- Hou, Z.; Hu, Z.; Blackwell, D.J.; Miller, T.D.; Thomas, D.D.T.; Robia, S.L. 2-Color Calcium Pump Reveals Closure of the Cytoplasmic Headpiece with Calcium Binding. PLoS ONE 2012, 7, e40369. [Google Scholar] [CrossRef]


© 2020 by the authors. Licensee MDPI, Basel, Switzerland. This article is an open access article distributed under the terms and conditions of the Creative Commons Attribution (CC BY) license (http://creativecommons.org/licenses/by/4.0/).
Share and Cite
Schaaf, T.M.; Kleinboehl, E.; Yuen, S.L.; Roelike, L.N.; Svensson, B.; Thompson, A.R.; Cornea, R.L.; Thomas, D.D. Live-Cell Cardiac-Specific High-Throughput Screening Platform for Drug-Like Molecules That Enhance Ca2+ Transport. Cells 2020, 9, 1170. https://doi.org/10.3390/cells9051170
Schaaf TM, Kleinboehl E, Yuen SL, Roelike LN, Svensson B, Thompson AR, Cornea RL, Thomas DD. Live-Cell Cardiac-Specific High-Throughput Screening Platform for Drug-Like Molecules That Enhance Ca2+ Transport. Cells. 2020; 9(5):1170. https://doi.org/10.3390/cells9051170
Chicago/Turabian StyleSchaaf, Tory M., Evan Kleinboehl, Samantha L. Yuen, Lauren N. Roelike, Bengt Svensson, Andrew R. Thompson, Razvan L. Cornea, and David D. Thomas. 2020. "Live-Cell Cardiac-Specific High-Throughput Screening Platform for Drug-Like Molecules That Enhance Ca2+ Transport" Cells 9, no. 5: 1170. https://doi.org/10.3390/cells9051170
APA StyleSchaaf, T. M., Kleinboehl, E., Yuen, S. L., Roelike, L. N., Svensson, B., Thompson, A. R., Cornea, R. L., & Thomas, D. D. (2020). Live-Cell Cardiac-Specific High-Throughput Screening Platform for Drug-Like Molecules That Enhance Ca2+ Transport. Cells, 9(5), 1170. https://doi.org/10.3390/cells9051170