The DNA Sensor AIM2 Protects against Streptozotocin-Induced Type 1 Diabetes by Regulating Intestinal Homeostasis via the IL-18 Pathway

 , , , , and
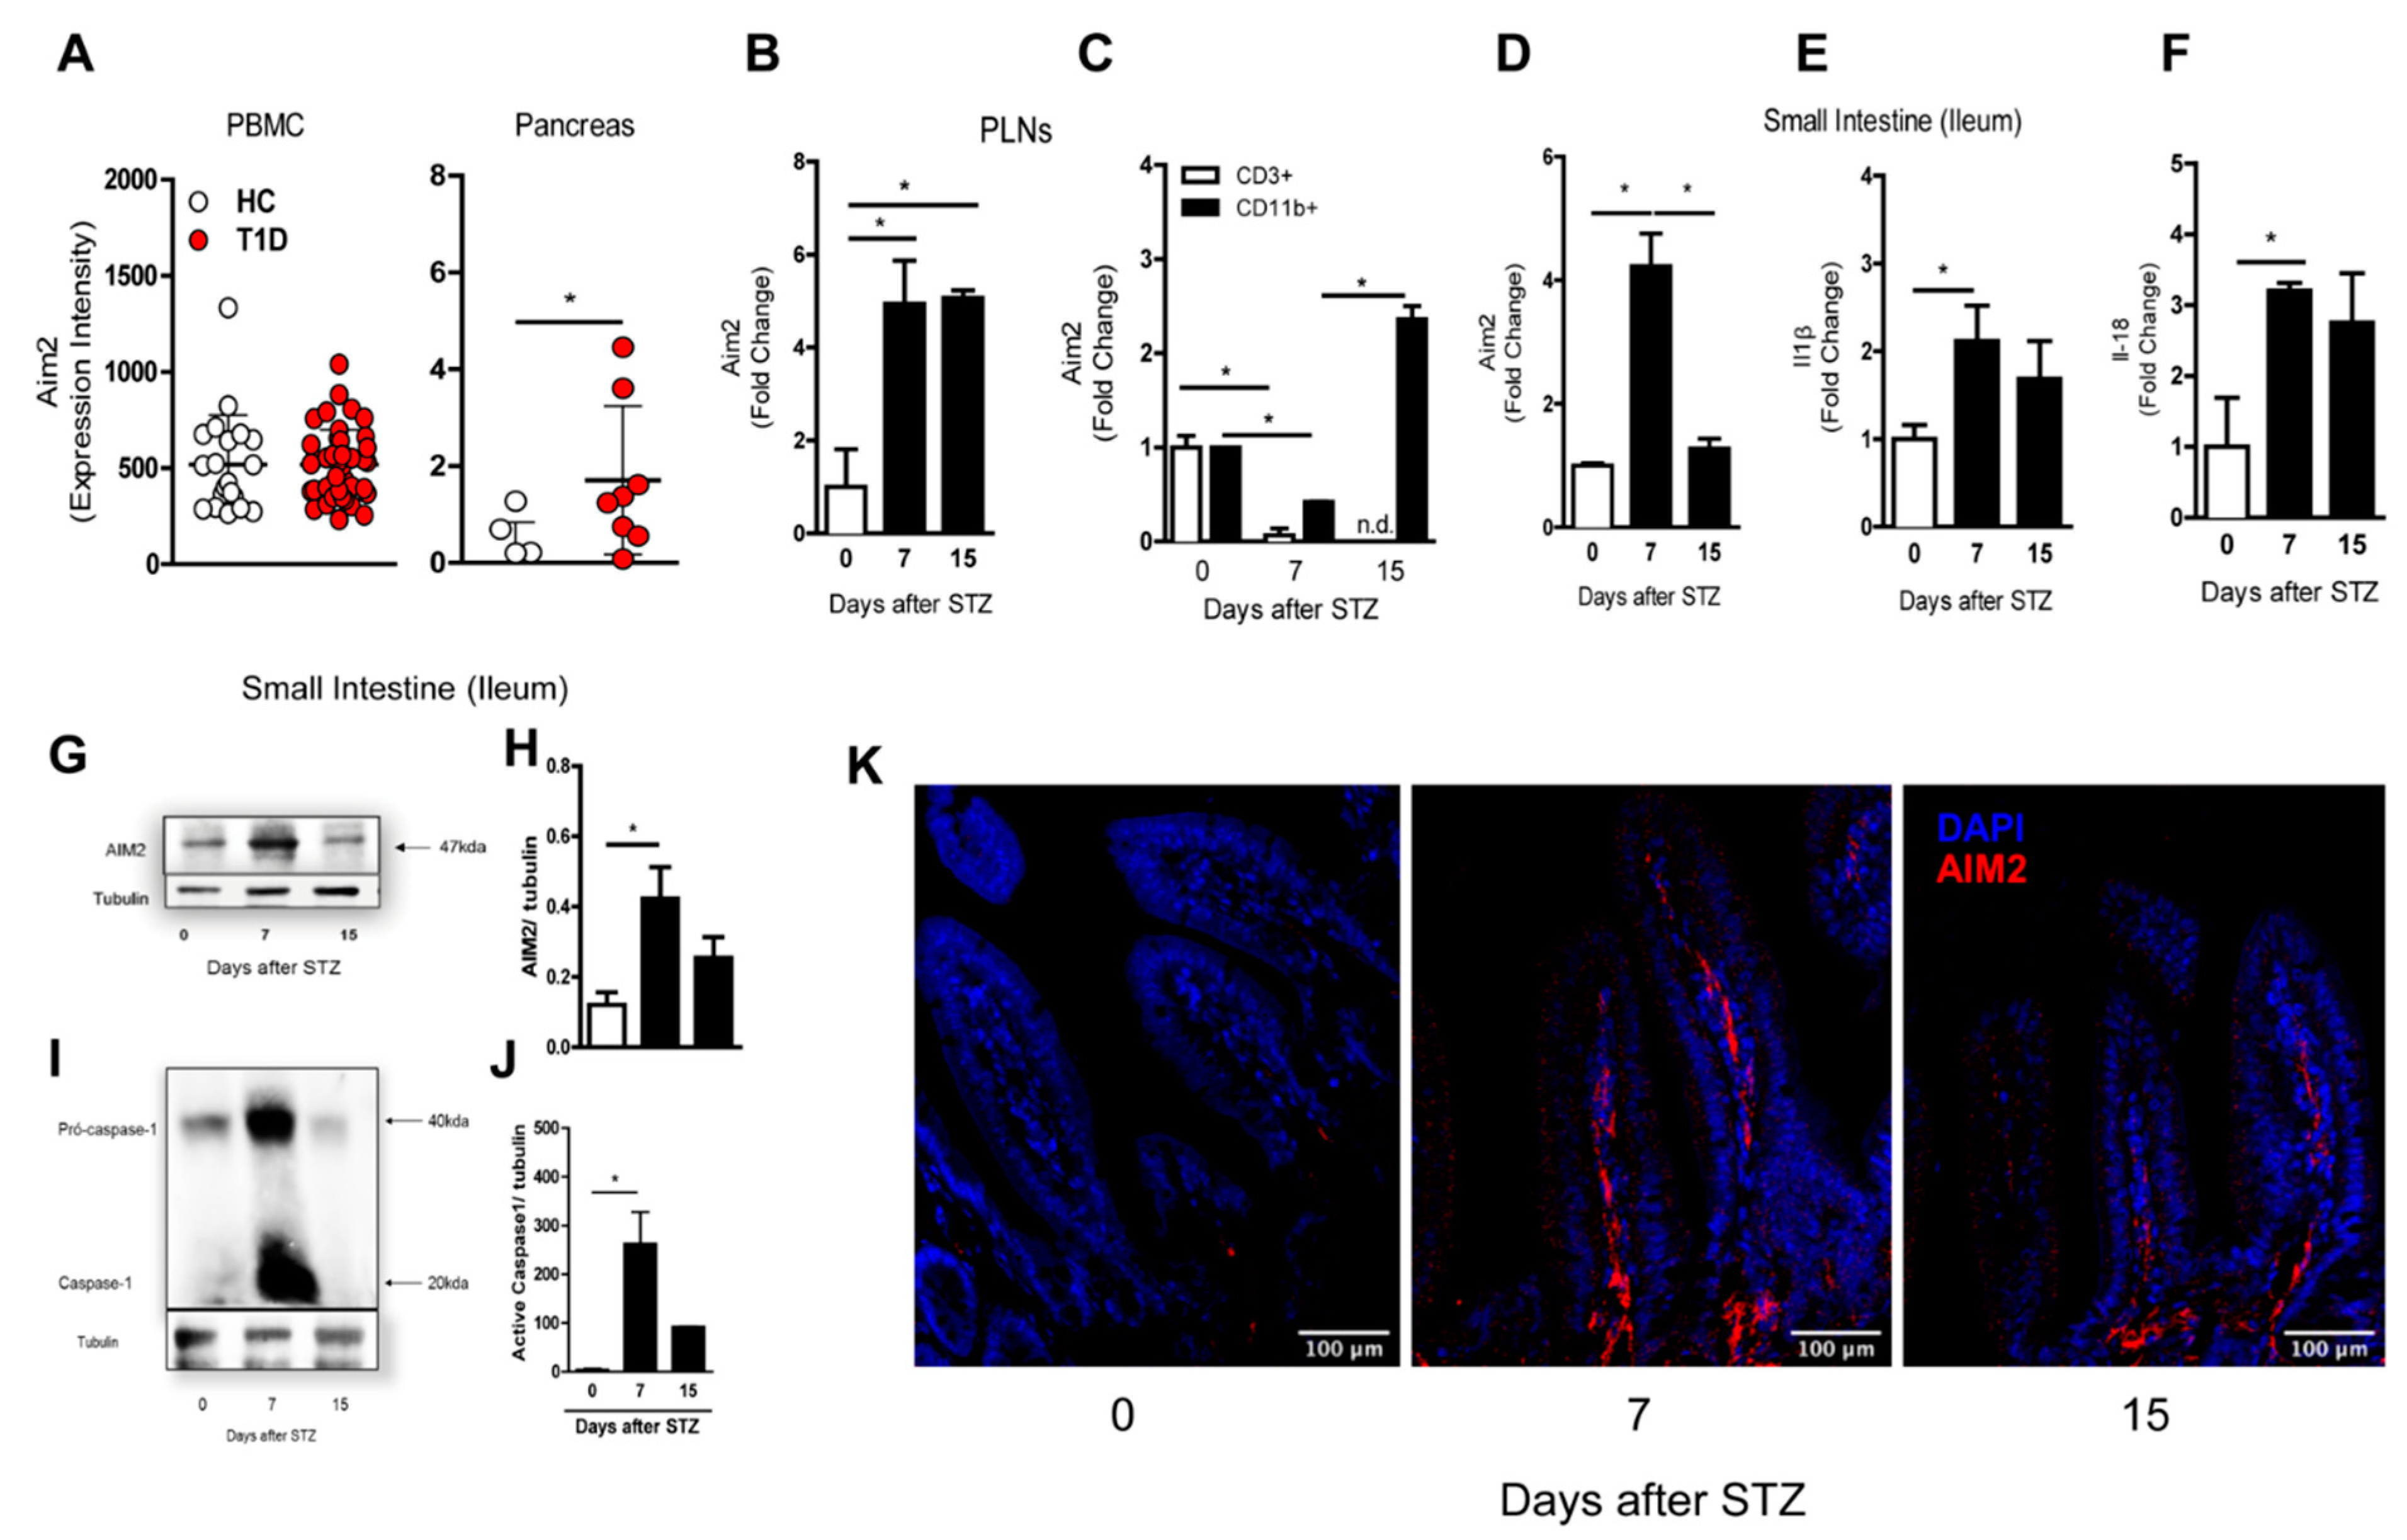
Abstract
1. Introduction
2. Methods
2.1. Animals
2.2. Induction of Diabetes by Multiple Low Doses of STZ (MLD-STZ)
2.3. Flow Cytometry Analysis of Intracellular and Extracellular Markers
2.4. Detection of Cytokine Levels in Pancreatic and Ileum Tissues
2.5. Quantification of Serum Insulin Levels
2.6. Histological and Immunohistochemistry Analysis
2.7. Western Blotting
2.8. Bone Marrow-Derived Macrophage (BMDM) Cultures and Stimulation
2.9. RNA Extraction and Quantitative RT-PCR
2.10. DNA Extraction and 16S rRNA Gene PCR Analysis
2.11. Intestinal Permeability by FITC-Dextran
2.12. Antibiotic Treatment
2.13. Immunofluorescence
2.14. Statistical Analysis
3. Results
3.1. AIM2 Receptor Expression during the Course of T1D in the Murine Model and Humans
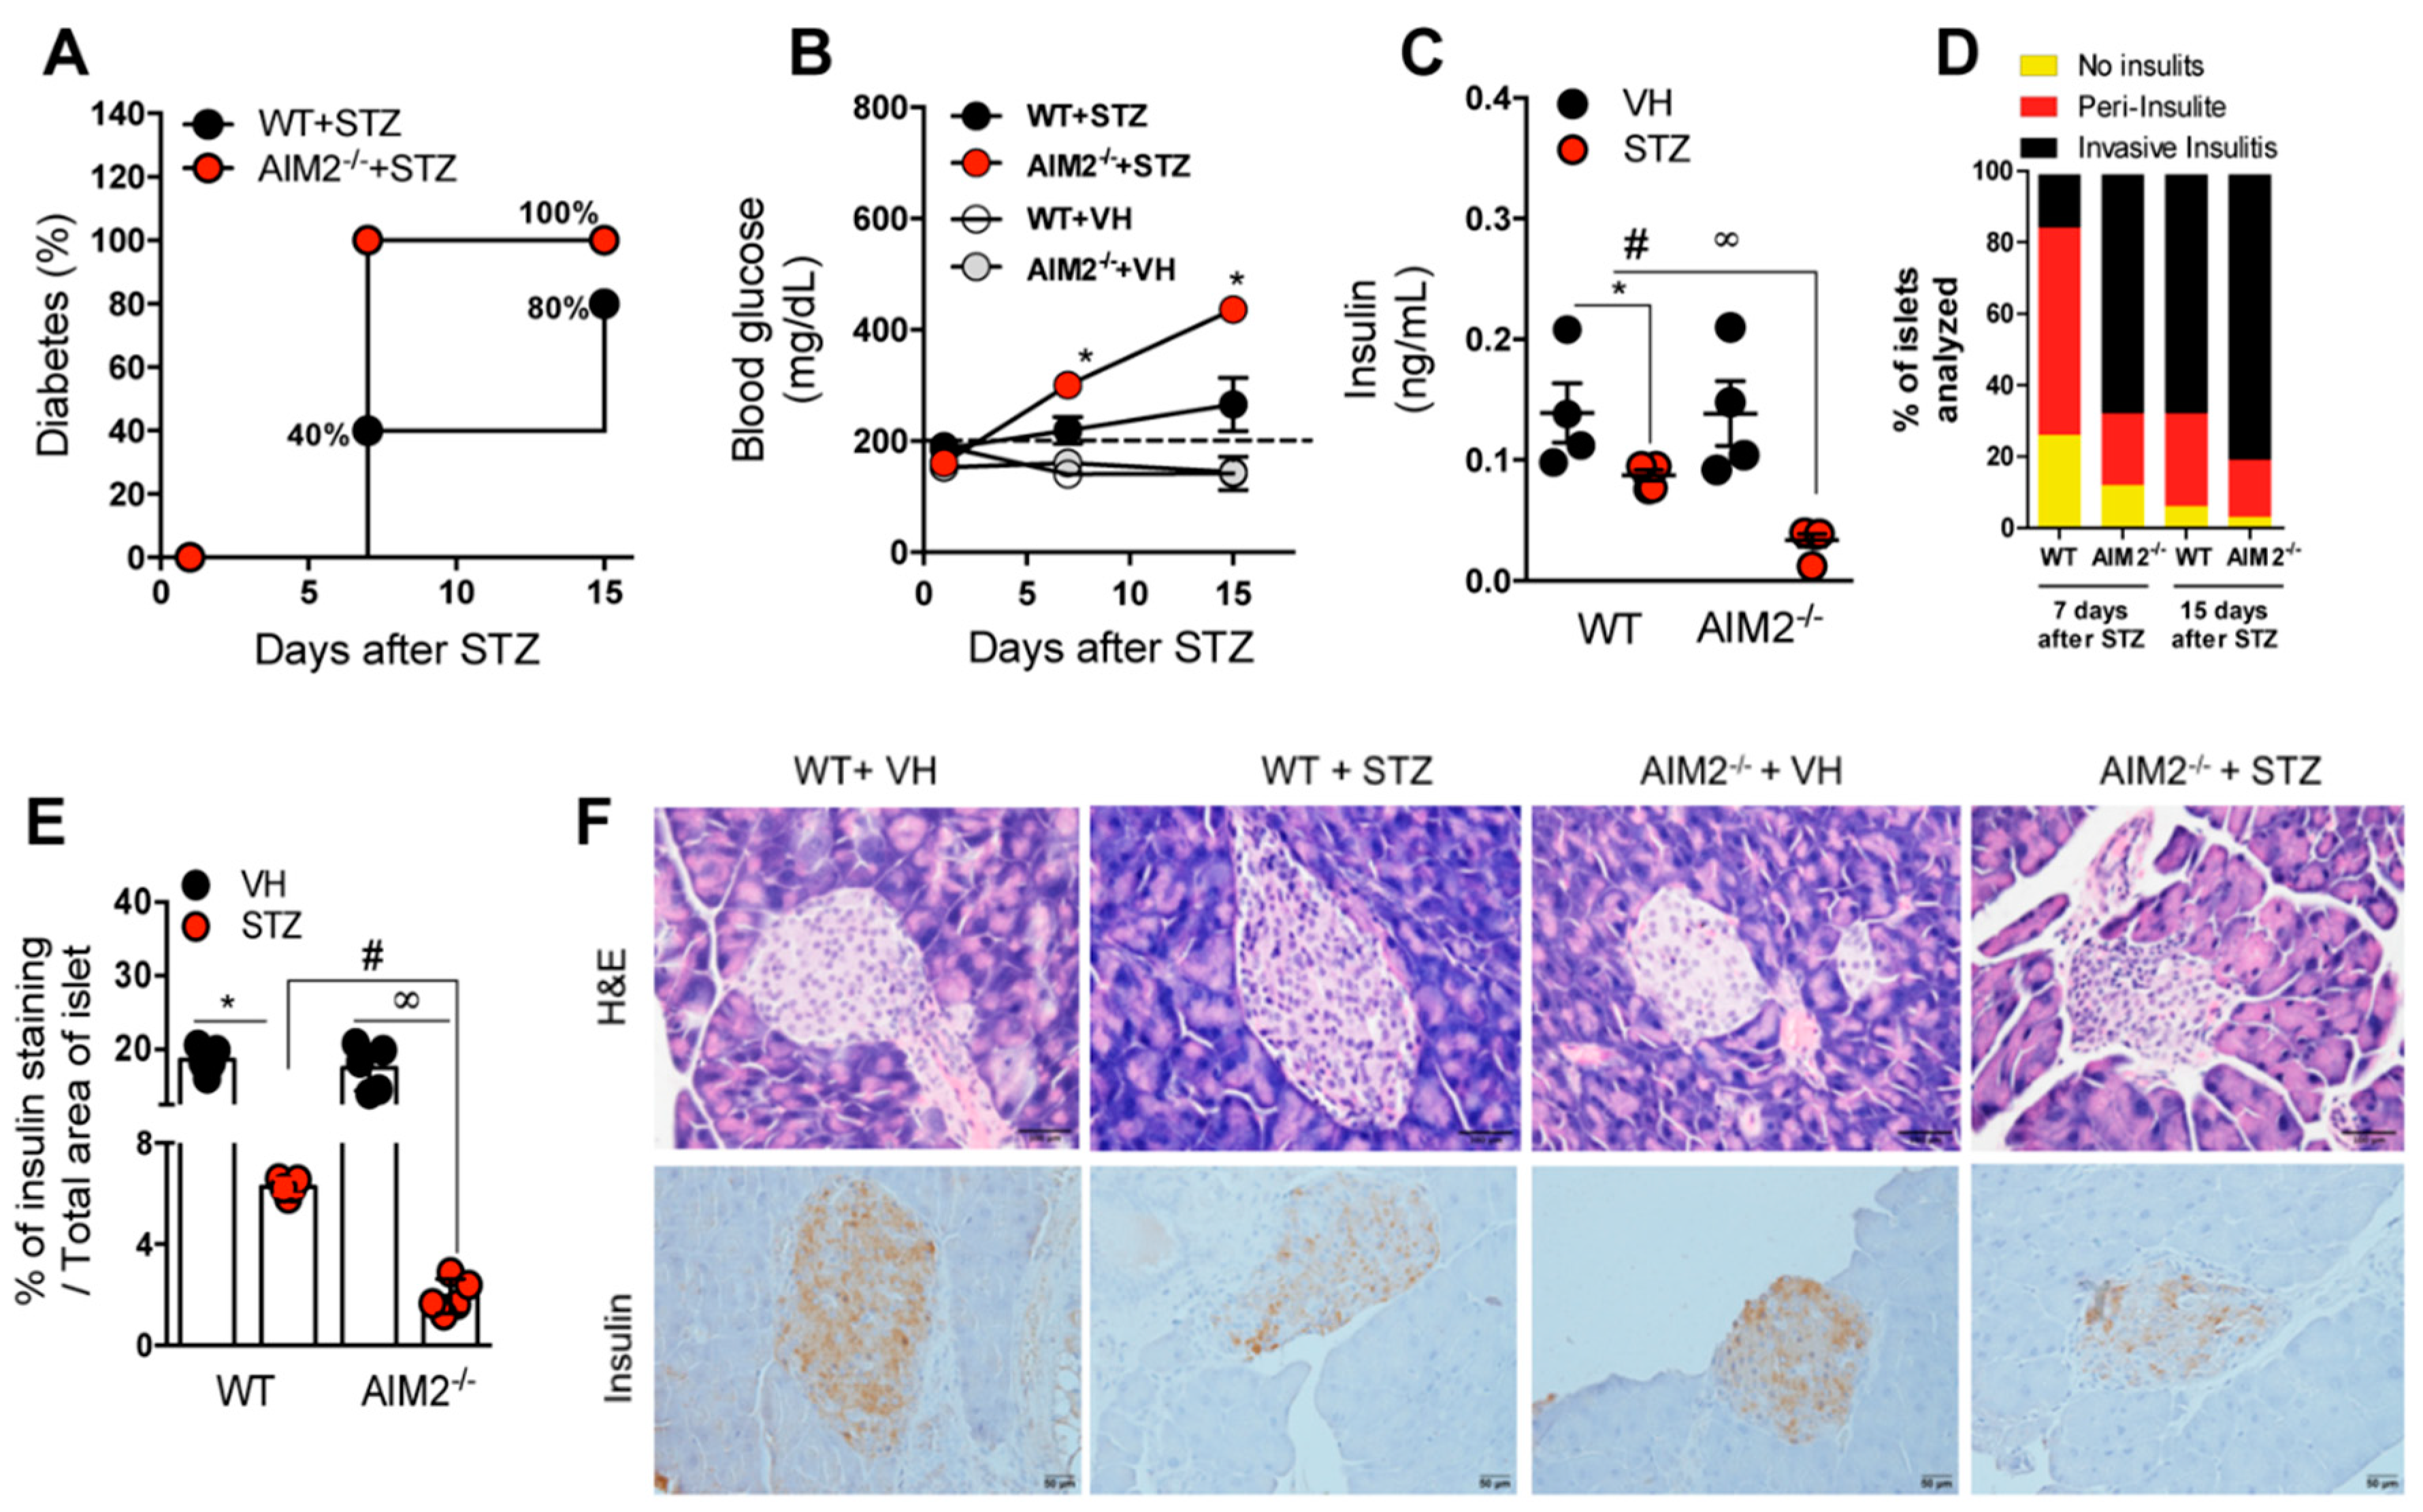
3.2. Deficiency of AIM2 Increases STZ-Induced T1D
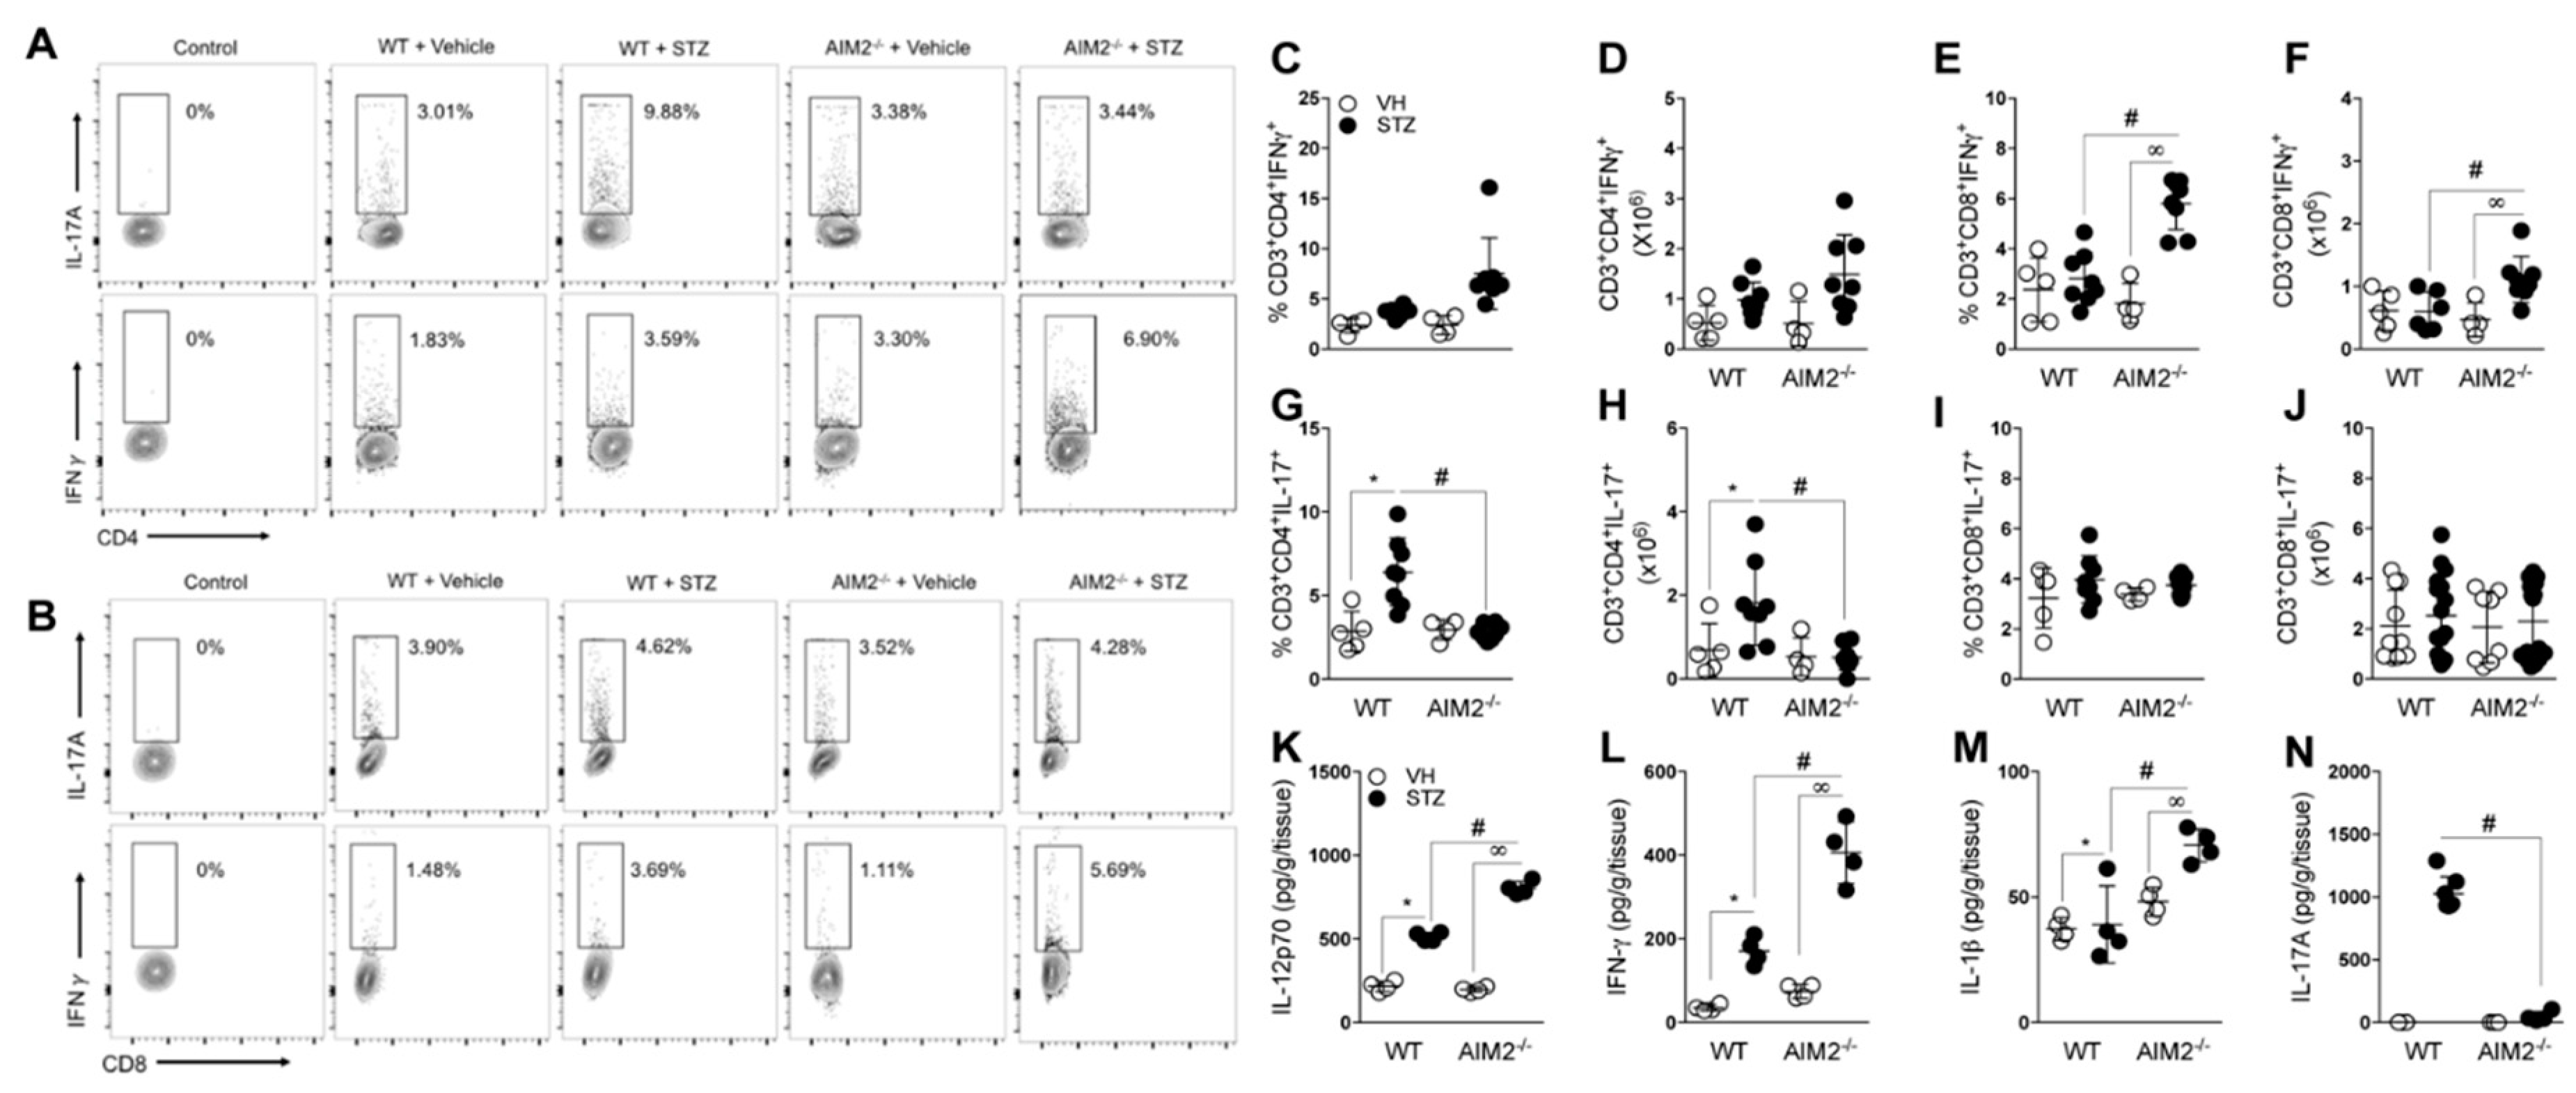
3.3. AIM2 Receptor Activation Dampens the Pathogenic Th1/Tc1 Cell Response in STZ-Induced T1D
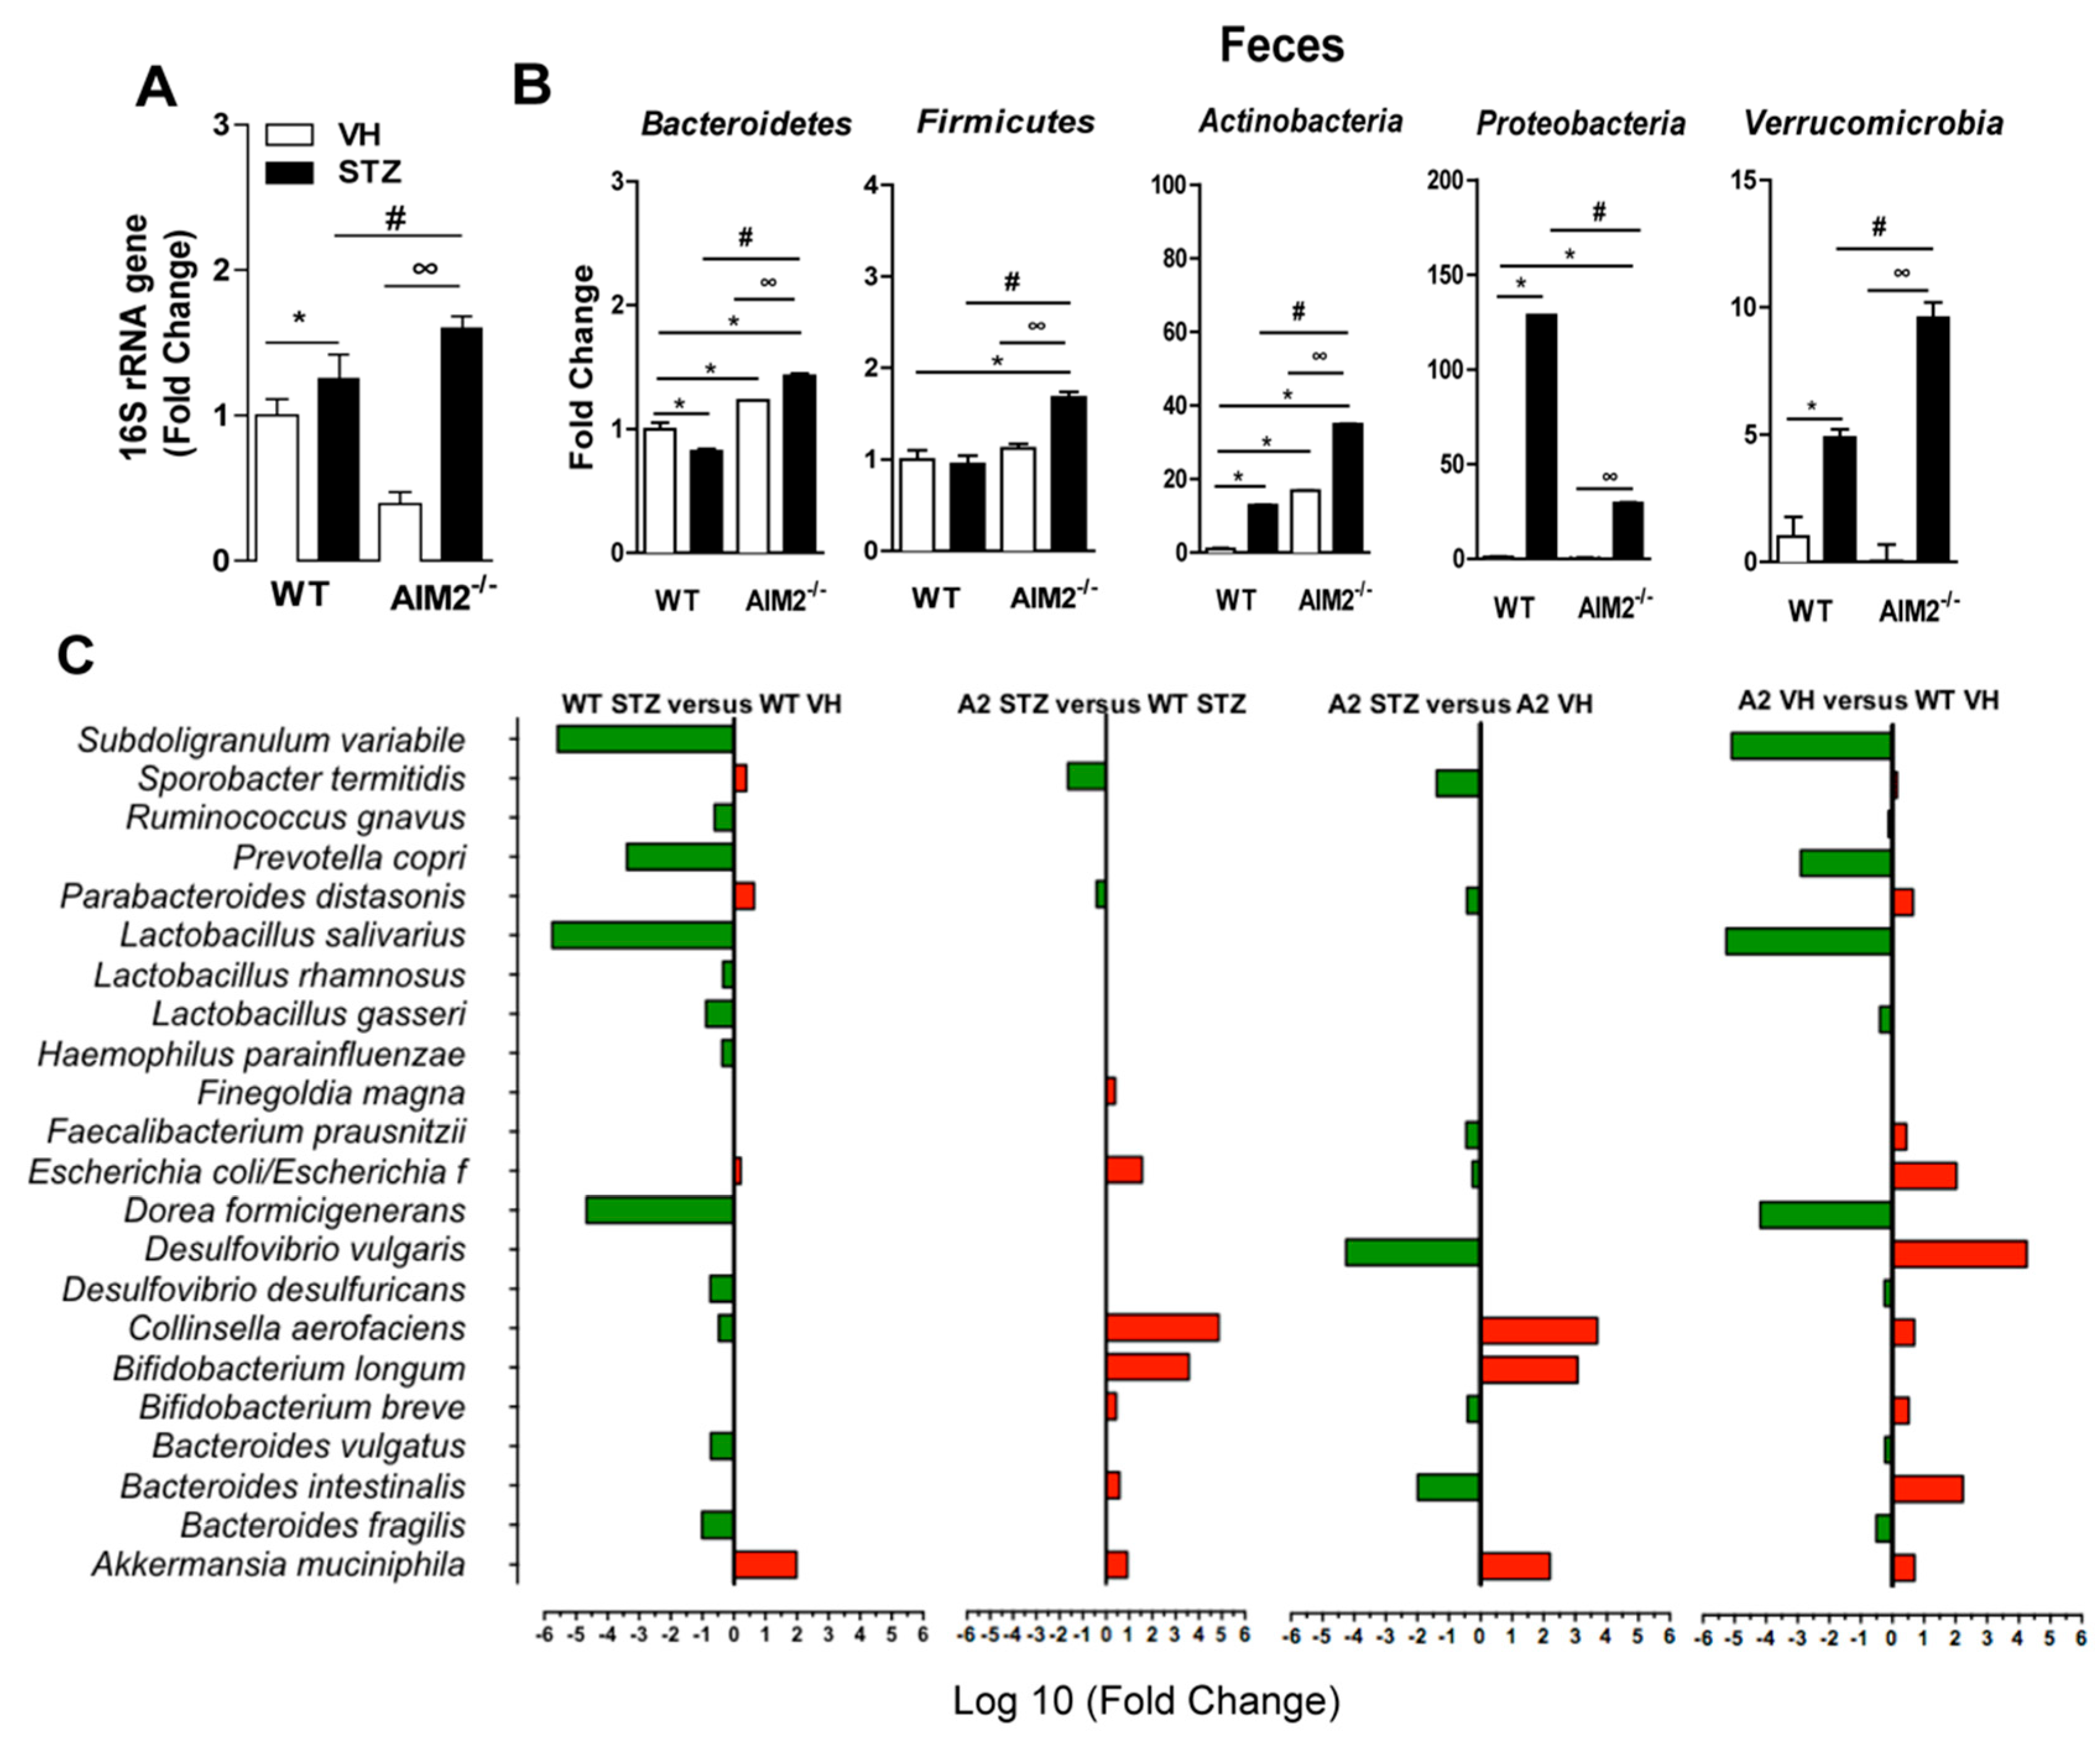
3.4. AIM2 Receptor Controls Gut Microbiota Translocation to PLNs in STZ-Induced T1D
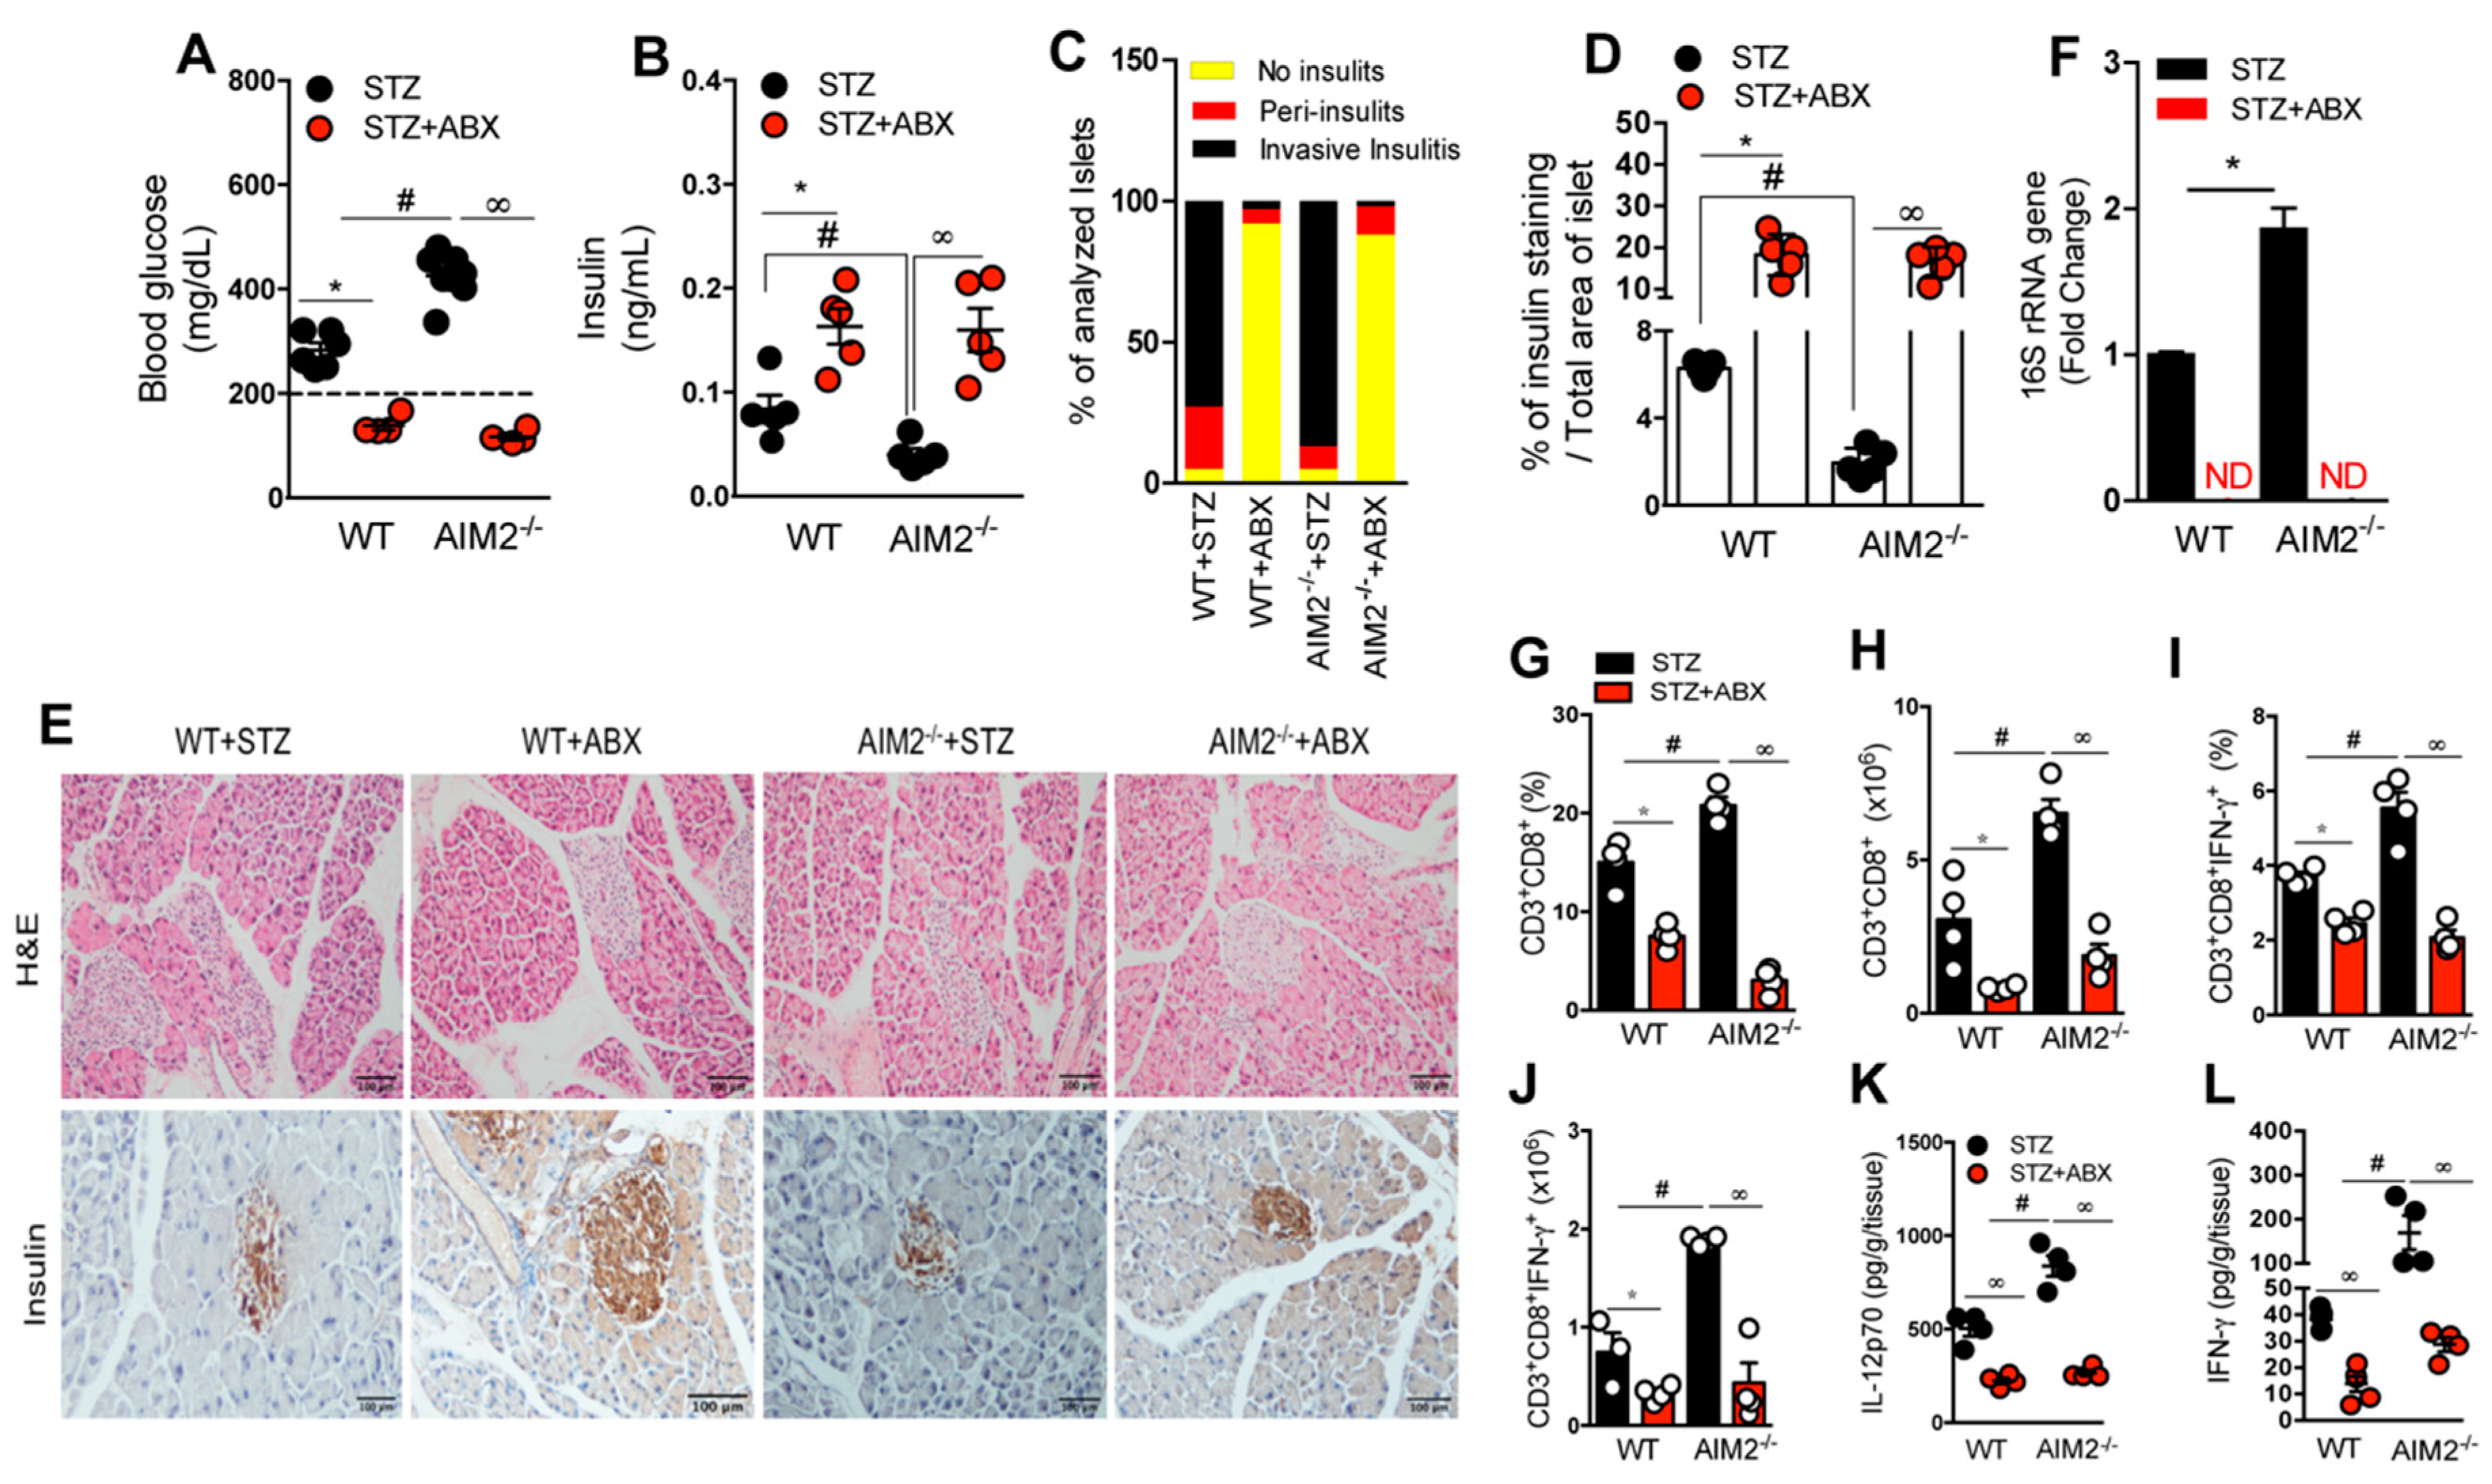
3.5. Antibiotic Treatment Abrogates Bacterial Translocation and the Generation of a Proinflammatory Response in STZ-Induced T1D
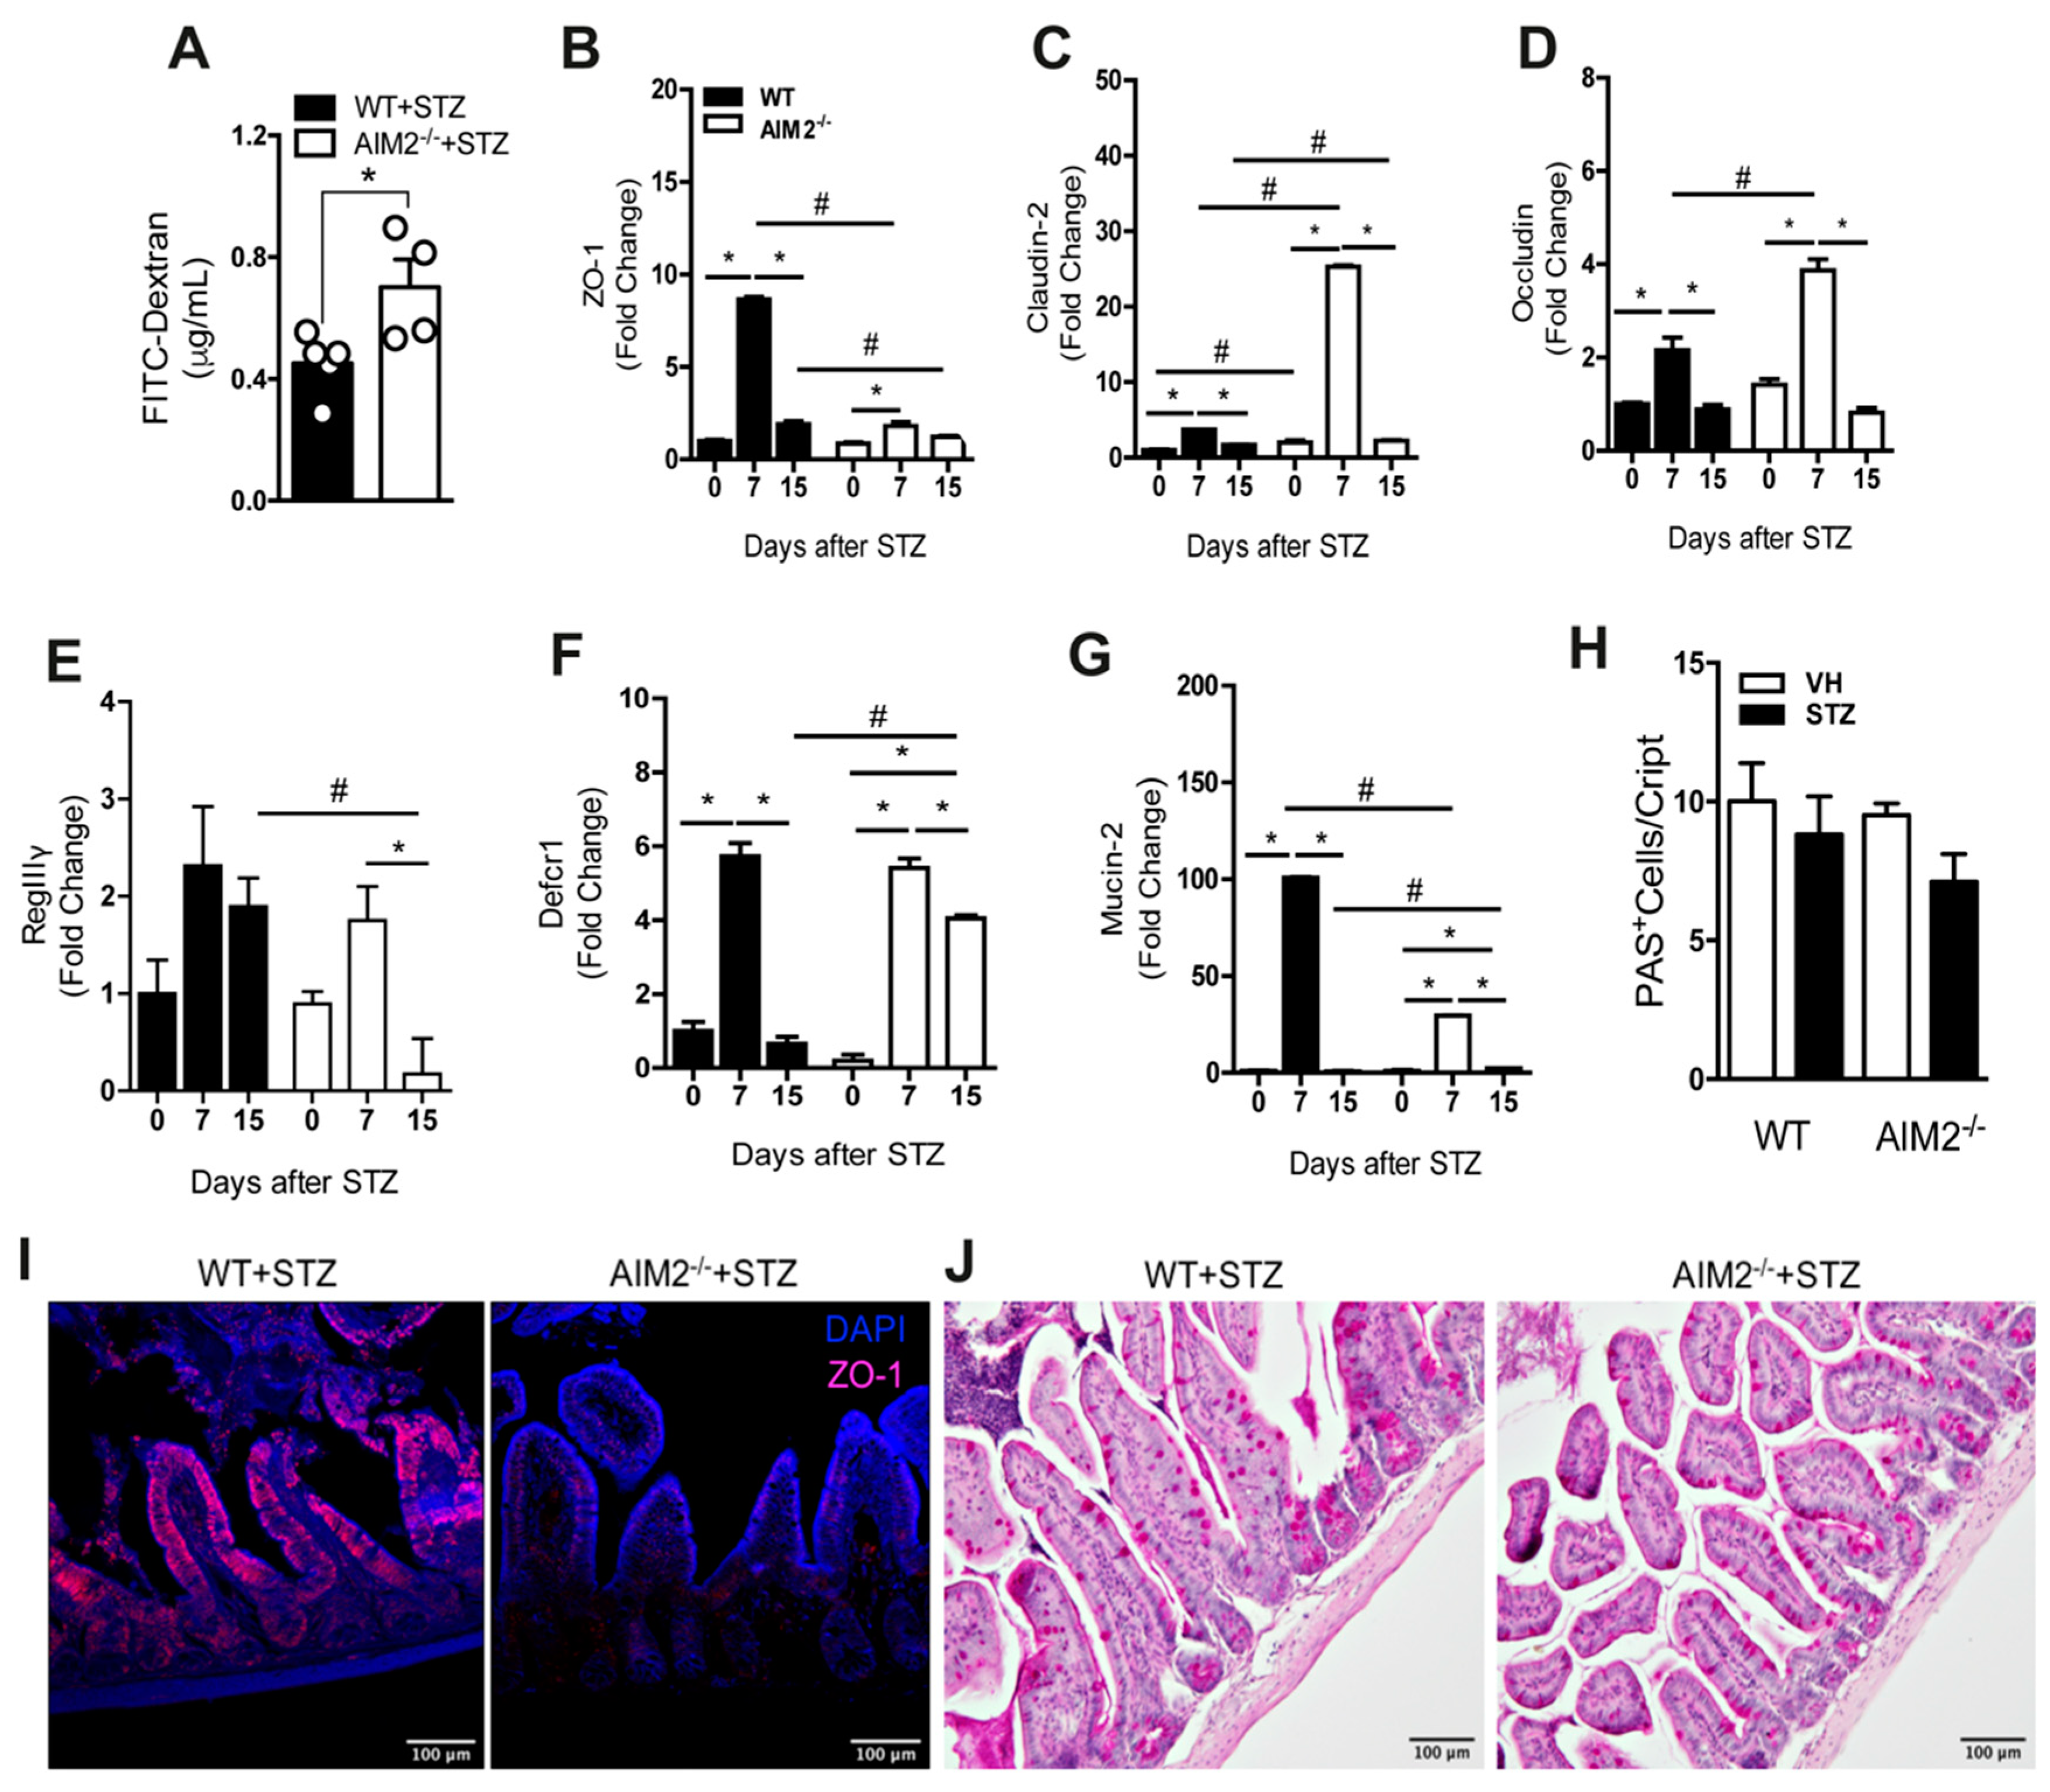
3.6. AIM2 Receptor Controls Intestinal Permeability through the Regulation of Tight-Juntion Proteins in STZ-Induced T1D
3.7. Deficiency of AIM2 Impairs IL-18 and IL-1 β Production in the Gut Mucosa during STZ-Induced T1D
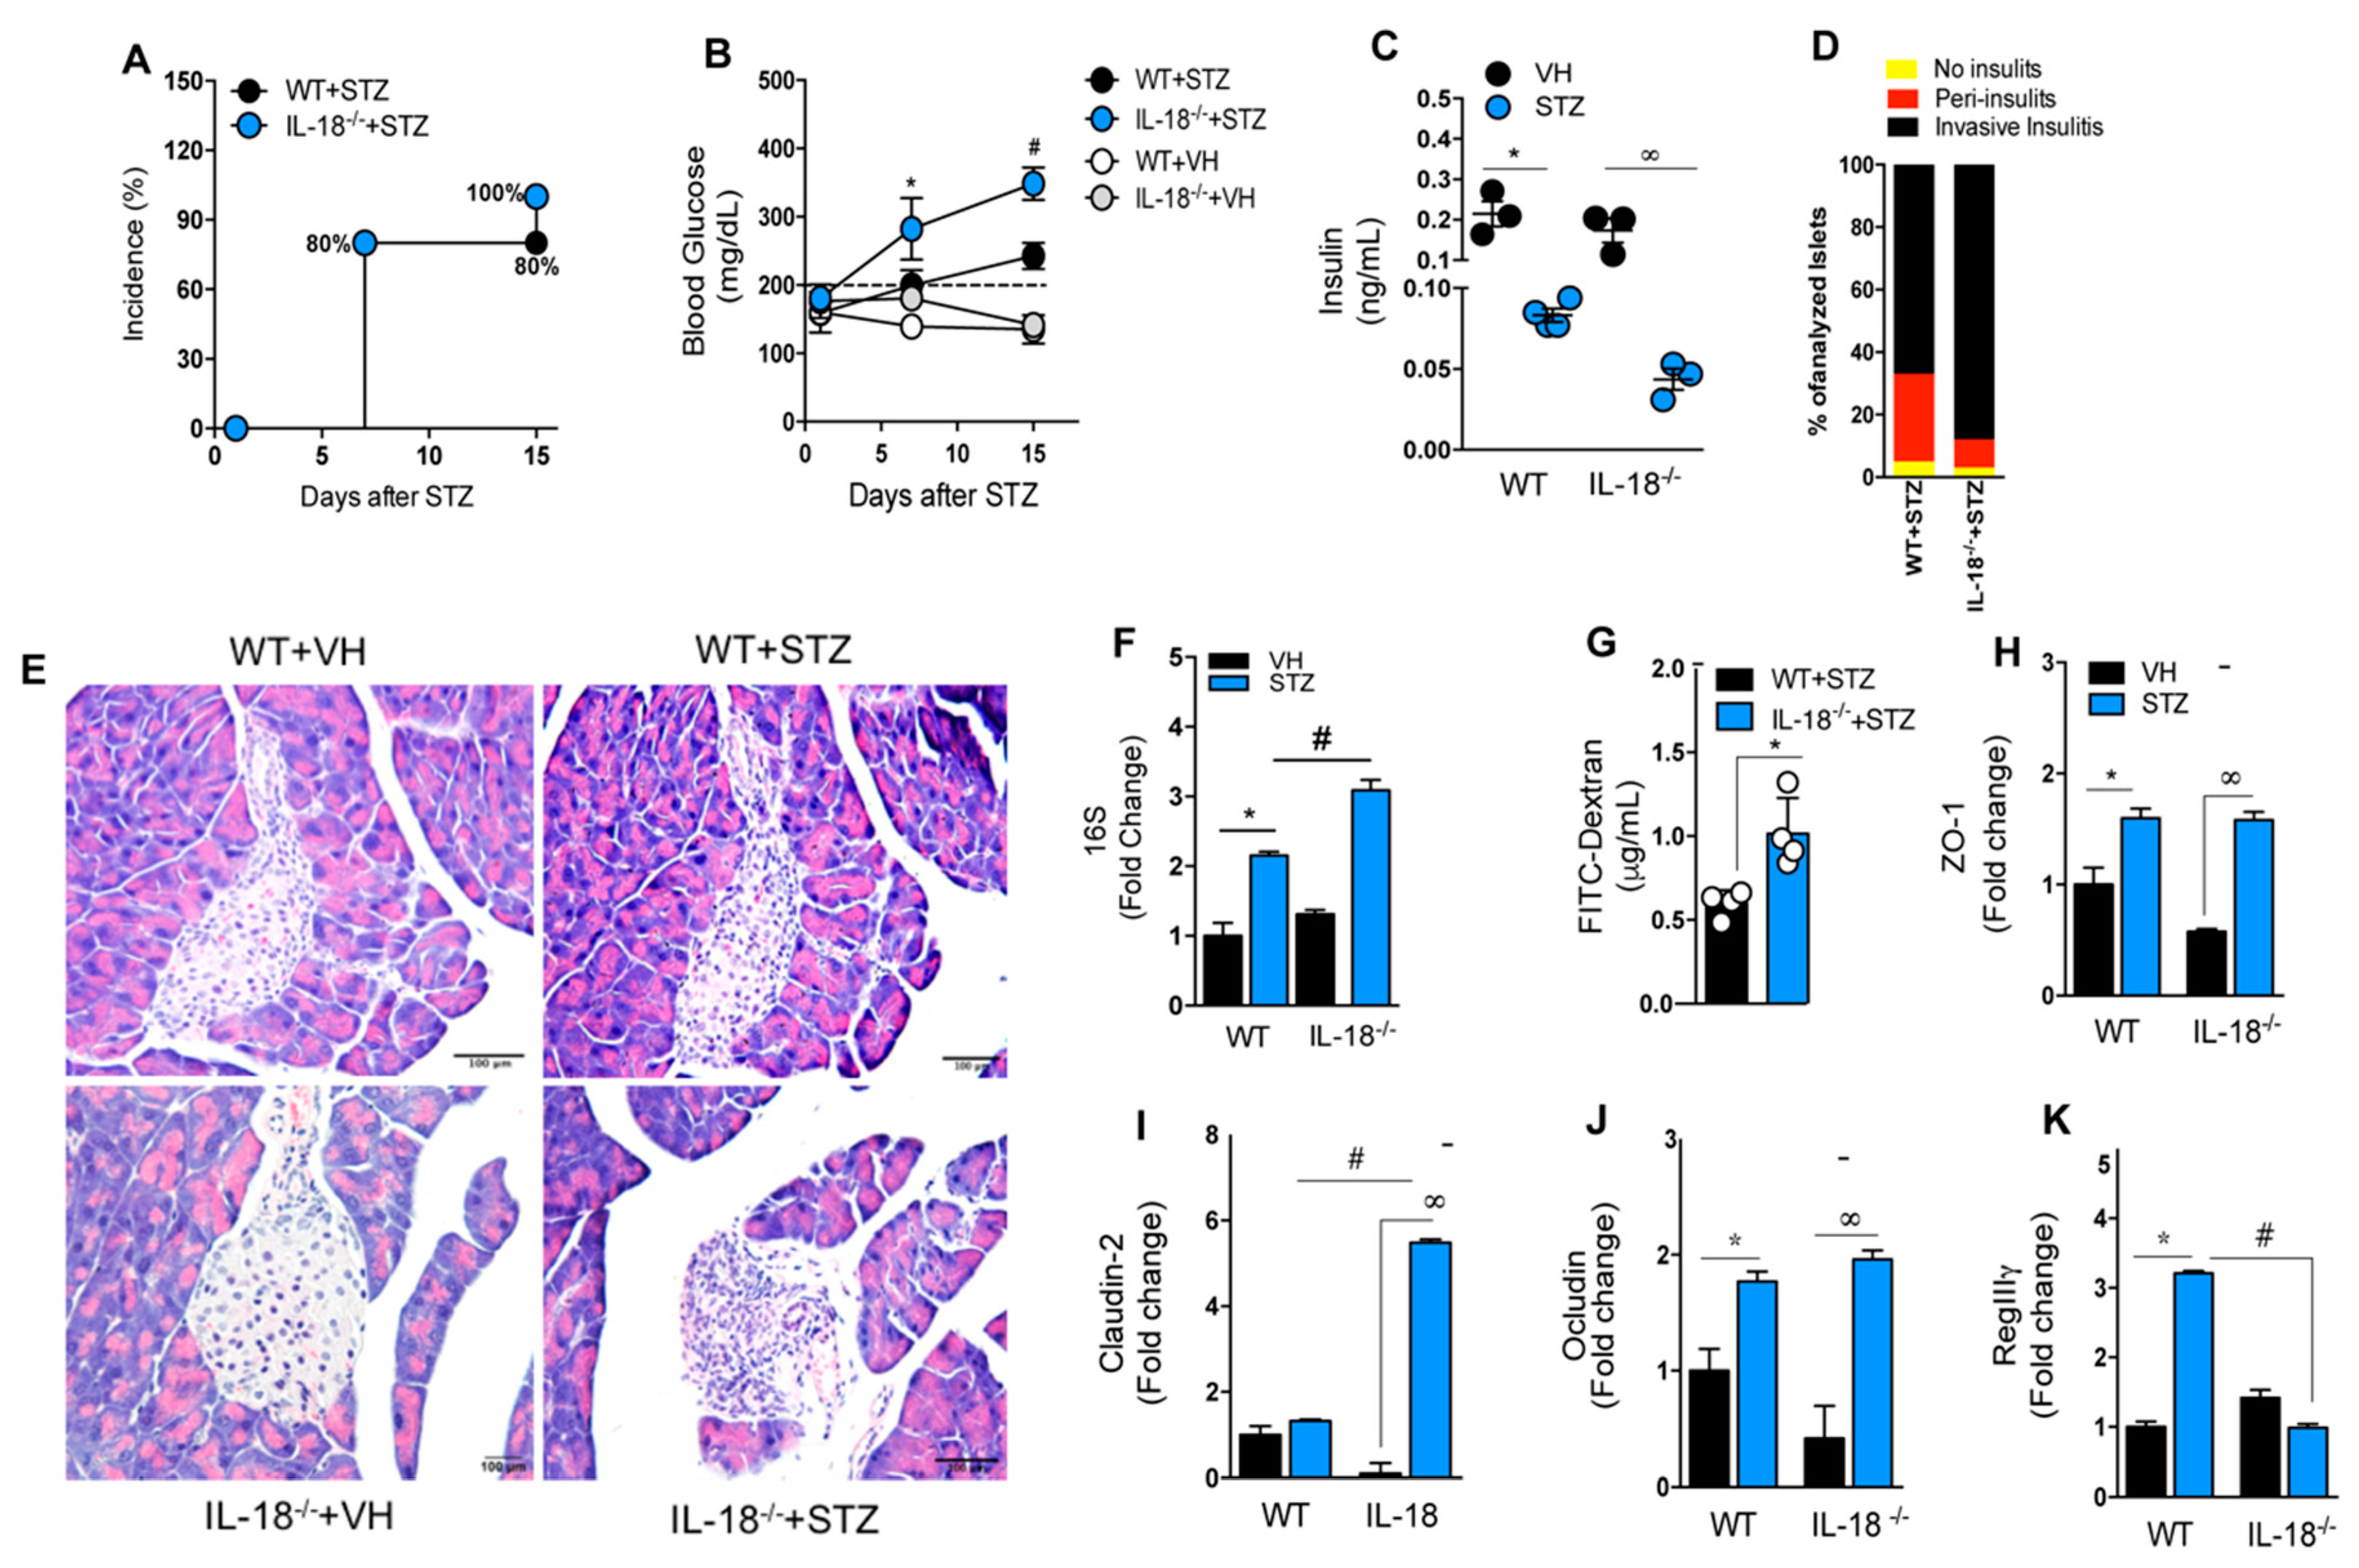
3.8. IL-18 Is Required for the Maintenance of Intestinal Homeostasis during T1D
4. Discussion
Author Contributions
Funding
Acknowledgments
Conflicts of Interest
List of Abbreviations
| Abx | Antibiotics |
| APC | Antigen-presenting cells |
| AIM2 | Absent in melanoma 2 |
| BMDM | Bone Marrow-Derived Macrophages |
| CAD | Diabetic ketoacidosis |
| CARD | Domain of the recruitment and activation of caspase |
| CD | Cluster of differentiation |
| NK Cells | Natural Killer Cells |
| DC | Dendritic cell |
| T1DM | Type 1 Diabetes Mellitus |
| DNA | Deoxyribonucleic acid |
| SD | Standard deviation E |
| FIIND | Domain function to find G |
| GAD | Glutamic acid decarboxylase |
| HLA | Human leukocyte antigen |
| IFN-γ | Interferon gamma |
| IL | Interleukin |
| PLNs | Pancreatic lymph nodes |
| LPS | Lipopolysaccharide |
| LRR | Leucine-rich repeats |
| MHC-II | Major Histocompatibility Complex-II |
| NF-κB | Nuclear Factor κB |
| NLR | NOD-like Receptor |
| NLRP1 | NLR family pyrin domain containing 1 |
| NOD | Non-obese diabetic mouse |
| NOR | Non-obese resistant mouse |
| PAMPs | Molecular patterns associated with the pathogen |
| PBMC | Peripheral blood mononuclear cells |
| PCR | Polymerase Chain Reaction |
| PRR | Pattern Recognition Receivers |
| PYD | Domain pyrin |
| RNA | Ribonucleic acid |
| sgRNA | Short-guide RNA |
| SNP | Single-nucleotide polymorphism |
| STZ | Streptozotocin |
| Th | T cell helper |
| TLR | Toll-like Receptor |
| TNF-α | Tumor necrosis factor alpha |
| WT | Wild type |
References
- Mathis, D.; Vence, L.; Benoist, C. Beta-Cell death during progression to diabetes. Nature 2001, 414, 792–798. [Google Scholar] [CrossRef] [PubMed]
- Antonela, B.; Ivana, G.; Ivan, K.; Nikolina, V.; Vesna, B.P.; Marina, P.; Veselin, S.; Tatijana, Z. Environmental Risk Factors for Type 1 Diabetes Mellitus Development. Exp. Clin. Endocrinol. Diabetes 2017, 125, 563–570. [Google Scholar] [CrossRef]
- Rewers, M.; Ludvigsson, J. Environmental risk factors for type 1 diabetes. Lancet 2016, 387, 2340–2348. [Google Scholar] [CrossRef]
- Stene, L.C.; Magnus, P.; Lie, R.T.; Sovik, O.; Joner, G. Birth weight and childhood onset type 1 diabetes: Population based cohort study. BMJ 2001, 322, 889–892. [Google Scholar] [CrossRef]
- Rees, D.A.; Alcolado, J.C. Animal models of diabetes mellitus. Diabet. Med. 2005, 22, 359–370. [Google Scholar] [CrossRef]
- Paik, S.G.; Fleischer, N.; Shin, S.I. Insulin-dependent diabetes mellitus induced by subdiabetogenic doses of streptozotocin: Obligatory role of cell-mediated autoimmune processes. Proc. Natl. Acad. Sci. USA 1980, 77, 6129–6133. [Google Scholar] [CrossRef]
- Arata, M.; Bruno, L.; Pastorale, C.; Pagliero, F.; Basabe, J.C. Effect of modified diabetic splenocytes on mice injected with splenocytes from multiple low-dose streptozotocin diabetic donors. Exp. Biol. Med. 2001, 226, 898–905. [Google Scholar] [CrossRef]
- Elias, D.; Prigozin, H.; Polak, N.; Rapoport, M.; Lohse, A.W.; Cohen, I.R. Autoimmune diabetes induced by the beta-cell toxin STZ. Immunity to the 60-kDa heat shock protein and to insulin. Diabetes 1994, 43, 992–998. [Google Scholar] [CrossRef]
- Vaarala, O. Gut microbiota and type 1 diabetes. Rev. Diabet. Stud. 2012, 9, 251–259. [Google Scholar] [CrossRef]
- Atkinson, M.A.; Chervonsky, A. Does the gut microbiota have a role in type 1 diabetes? Early evidence from humans and animal models of the disease. Diabetologia 2012, 55, 2868–2877. [Google Scholar] [CrossRef]
- de Goffau, M.C.; Fuentes, S.; van den Bogert, B.; Honkanen, H.; de Vos, W.M.; Welling, G.W.; Hyoty, H.; Harmsen, H.J. Aberrant gut microbiota composition at the onset of type 1 diabetes in young children. Diabetologia 2014, 57, 1569–1577. [Google Scholar] [CrossRef] [PubMed]
- Bach, J.F. The effect of infections on susceptibility to autoimmune and allergic diseases. N. Engl. J. Med. 2002, 347, 911–920. [Google Scholar] [CrossRef] [PubMed]
- Brugman, S.; Klatter, F.A.; Visser, J.T.; Wildeboer-Veloo, A.C.; Harmsen, H.J.; Rozing, J.; Bos, N.A. Antibiotic treatment partially protects against type 1 diabetes in the Bio-Breeding diabetes-prone rat. Is the gut flora involved in the development of type 1 diabetes? Diabetologia 2006, 49, 2105–2108. [Google Scholar] [CrossRef]
- Murri, M.; Leiva, I.; Gomez-Zumaquero, J.M.; Tinahones, F.J.; Cardona, F.; Soriguer, F.; Queipo-Ortuno, M.I. Gut microbiota in children with type 1 diabetes differs from that in healthy children: A case-control study. BMC Med. 2013, 11, 46. [Google Scholar] [CrossRef]
- Vaarala, O. Leaking gut in type 1 diabetes. Curr. Opin. Gastroenterol. 2008, 24, 701–706. [Google Scholar] [CrossRef]
- Roep, B.O. The role of T-cells in the pathogenesis of Type 1 diabetes: From cause to cure. Diabetologia 2003, 46, 305–321. [Google Scholar] [CrossRef]
- Tsuji, Y.; Watanabe, T.; Kudo, M.; Arai, H.; Strober, W.; Chiba, T. Sensing of commensal organisms by the intracellular sensor NOD1 mediates experimental pancreatitis. Immunity 2012, 37, 326–338. [Google Scholar] [CrossRef]
- Burrows, M.P.; Volchkov, P.; Kobayashi, K.S.; Chervonsky, A.V. Microbiota regulates type 1 diabetes through Toll-like receptors. Proc. Natl. Acad. Sci. USA 2015, 112, 9973–9977. [Google Scholar] [CrossRef]
- Gulden, E.; Chao, C.; Tai, N.; Pearson, J.A.; Peng, J.; Majewska-Szczepanik, M.; Zhou, Z.; Wong, F.S.; Wen, L. TRIF deficiency protects non-obese diabetic mice from type 1 diabetes by modulating the gut microbiota and dendritic cells. J. Autoimmun. 2018, 93, 57–65. [Google Scholar] [CrossRef]
- Zhang, Y.; Lee, A.S.; Shameli, A.; Geng, X.; Finegood, D.; Santamaria, P.; Dutz, J.P. TLR9 blockade inhibits activation of diabetogenic CD8+ T cells and delays autoimmune diabetes. J. Immunol. 2010, 184, 5645–5653. [Google Scholar] [CrossRef]
- Costa, F.R.; Francozo, M.C.; de Oliveira, G.G.; Ignacio, A.; Castoldi, A.; Zamboni, D.S.; Ramos, S.G.; Camara, N.O.; de Zoete, M.R.; Palm, N.W.; et al. Gut microbiota translocation to the pancreatic lymph nodes triggers NOD2 activation and contributes to T1D onset. J. Exp. Med. 2016, 213, 1223–1239. [Google Scholar] [CrossRef] [PubMed]
- Carlos, D.; Costa, F.R.; Pereira, C.A.; Rocha, F.A.; Yaochite, J.N.; Oliveira, G.G.; Carneiro, F.S.; Tostes, R.C.; Ramos, S.G.; Zamboni, D.S.; et al. Mitochondrial DNA Activates the NLRP3 Inflammasome and Predisposes to Type 1 Diabetes in Murine Model. Front. Immunol. 2017, 8, 164. [Google Scholar] [CrossRef] [PubMed]
- Pontillo, A.; Brandao, L.; Guimaraes, R.; Segat, L.; Araujo, J.; Crovella, S. Two SNPs in NLRP3 gene are involved in the predisposition to type-1 diabetes and celiac disease in a pediatric population from northeast Brazil. Autoimmunity 2010, 43, 583–589. [Google Scholar] [CrossRef] [PubMed]
- Hornung, V.; Ablasser, A.; Charrel-Dennis, M.; Bauernfeind, F.; Horvath, G.; Caffrey, D.R.; Latz, E.; Fitzgerald, K.A. AIM2 recognizes cytosolic dsDNA and forms a caspase-1-activating inflammasome with ASC. Nature 2009, 458, 514–518. [Google Scholar] [CrossRef]
- Rathinam, V.A.; Jiang, Z.; Waggoner, S.N.; Sharma, S.; Cole, L.E.; Waggoner, L.; Vanaja, S.K.; Monks, B.G.; Ganesan, S.; Latz, E.; et al. The AIM2 inflammasome is essential for host defense against cytosolic bacteria and DNA viruses. Nat. Immunol. 2010, 11, 395–402. [Google Scholar] [CrossRef]
- Man, S.M.; Karki, R.; Kanneganti, T.D. AIM2 inflammasome in infection, cancer, and autoimmunity: Role in DNA sensing, inflammation, and innate immunity. Eur. J. Immunol. 2016, 46, 269–280. [Google Scholar] [CrossRef]
- Zhang, W.; Cai, Y.; Xu, W.; Yin, Z.; Gao, X.; Xiong, S. AIM2 facilitates the apoptotic DNA-induced systemic lupus erythematosus via arbitrating macrophage functional maturation. J. Clin. Immunol. 2013, 33, 925–937. [Google Scholar] [CrossRef]
- Dombrowski, Y.; Peric, M.; Koglin, S.; Kammerbauer, C.; Goss, C.; Anz, D.; Simanski, M.; Glaser, R.; Harder, J.; Hornung, V.; et al. Cytosolic DNA triggers inflammasome activation in keratinocytes in psoriatic lesions. Sci. Transl. Med. 2011, 3, 82ra38. [Google Scholar] [CrossRef]
- Hu, S.; Peng, L.; Kwak, Y.T.; Tekippe, E.M.; Pasare, C.; Malter, J.S.; Hooper, L.V.; Zaki, M.H. The DNA Sensor AIM2 Maintains Intestinal Homeostasis via Regulation of Epithelial Antimicrobial Host Defense. Cell Rep. 2015, 13, 1922–1936. [Google Scholar] [CrossRef]
- Ratsimandresy, R.A.; Indramohan, M.; Dorfleutner, A.; Stehlik, C. The AIM2 inflammasome is a central regulator of intestinal homeostasis through the IL-18/IL-22/STAT3 pathway. Cell. Mol. Immunol. 2017, 14, 127–142. [Google Scholar] [CrossRef]
- Yaochite, J.N.; Caliari-Oliveira, C.; Davanso, M.R.; Carlos, D.; Malmegrim, K.C.; Cardoso, C.R.; Ramalho, L.N.; Palma, P.V.; da Silva, J.S.; Cunha, F.Q.; et al. Dynamic changes of the Th17/Tc17 and regulatory T cell populations interfere in the experimental autoimmune diabetes pathogenesis. Immunobiology 2013, 218, 338–352. [Google Scholar] [CrossRef] [PubMed]
- Marim, F.M.; Silveira, T.N.; Lima, D.S., Jr.; Zamboni, D.S. A method for generation of bone marrow-derived macrophages from cryopreserved mouse bone marrow cells. PLoS ONE 2010, 5, e15263. [Google Scholar] [CrossRef] [PubMed]
- Kaizer, E.C.; Glaser, C.L.; Chaussabel, D.; Banchereau, J.; Pascual, V.; White, P.C. Gene expression in peripheral blood mononuclear cells from children with diabetes. J. Clin. Endocrinol. Metab. 2007, 92, 3705–3711. [Google Scholar] [CrossRef] [PubMed]
- Hu, Y.; Wong, F.S.; Wen, L. Antibiotics, gut microbiota, environment in early life and type 1 diabetes. Pharmacol. Res. 2017, 119, 219–226. [Google Scholar] [CrossRef]
- Mullaney, J.A.; Stephens, J.E.; Costello, M.E.; Fong, C.; Geeling, B.E.; Gavin, P.G.; Wright, C.M.; Spector, T.D.; Brown, M.A.; Hamilton-Williams, E.E. Type 1 diabetes susceptibility alleles are associated with distinct alterations in the gut microbiota. Microbiome 2018, 6, 35. [Google Scholar] [CrossRef]
- Hollander, D. Intestinal permeability, leaky gut, and intestinal disorders. Curr. Gastroenterol. Rep. 1999, 1, 410–416. [Google Scholar] [CrossRef]
- Gibson, P.R. Increased gut permeability in Crohn’s disease: Is TNF the link? Gut 2004, 53, 1724–1725. [Google Scholar] [CrossRef]
- Mannon, P. Gut permeability and colitis. Gastroenterology 2009, 137, 732–734. [Google Scholar] [CrossRef]
- Frazier, T.H.; DiBaise, J.K.; McClain, C.J. Gut microbiota, intestinal permeability, obesity-induced inflammation, and liver injury. J. Parenter. Enteral Nutr. 2011, 35, 14S–20S. [Google Scholar] [CrossRef]
- Ballard, S.T.; Hunter, J.H.; Taylor, A.E. Regulation of tight-junction permeability during nutrient absorption across the intestinal epithelium. Ann. Rev. Nutr. 1995, 15, 35–55. [Google Scholar] [CrossRef]
- Noth, R.; Lange-Grumfeld, J.; Stuber, E.; Kruse, M.L.; Ellrichmann, M.; Hasler, R.; Hampe, J.; Bewig, B.; Rosenstiel, P.; Schreiber, S.; et al. Increased intestinal permeability and tight junction disruption by altered expression and localization of occludin in a murine graft versus host disease model. BMC Gastroenterol. 2011, 11, 109. [Google Scholar] [CrossRef]
- Lam, Y.Y.; Ha, C.W.; Campbell, C.R.; Mitchell, A.J.; Dinudom, A.; Oscarsson, J.; Cook, D.I.; Hunt, N.H.; Caterson, I.D.; Holmes, A.J.; et al. Increased gut permeability and microbiota change associate with mesenteric fat inflammation and metabolic dysfunction in diet-induced obese mice. PLoS ONE 2012, 7, e34233. [Google Scholar] [CrossRef] [PubMed]
- Nevado, R.; Forcen, R.; Layunta, E.; Murillo, M.D.; Grasa, L. Neomycin and bacitracin reduce the intestinal permeability in mice and increase the expression of some tight-junction proteins. Rev. Esp. Enferm. Dig. 2015, 107, 672–676. [Google Scholar] [CrossRef] [PubMed][Green Version]
- Miranda, M.C.G.; Oliveira, R.P.; Torres, L.; Aguiar, S.L.F.; Pinheiro-Rosa, N.; Lemos, L.; Guimaraes, M.A.; Reis, D.; Silveira, T.; Ferreira, E.; et al. Frontline Science: Abnormalities in the gut mucosa of non-obese diabetic mice precede the onset of type 1 diabetes. J. Leukoc. Biol. 2019, 106, 513–529. [Google Scholar] [CrossRef] [PubMed]
- Manfredo Vieira, S.; Hiltensperger, M.; Kumar, V.; Zegarra-Ruiz, D.; Dehner, C.; Khan, N.; Costa, F.R.C.; Tiniakou, E.; Greiling, T.; Ruff, W.; et al. Translocation of a gut pathobiont drives autoimmunity in mice and humans. Science 2018, 359, 1156–1161. [Google Scholar] [CrossRef] [PubMed]
- Ma, H.D.; Zhao, Z.B.; Ma, W.T.; Liu, Q.Z.; Gao, C.Y.; Li, L.; Wang, J.; Tsuneyama, K.; Liu, B.; Zhang, W.; et al. Gut microbiota translocation promotes autoimmune cholangitis. J. Autoimmun. 2018, 95, 47–57. [Google Scholar] [CrossRef]
- Matson, V.; Fessler, J.; Bao, R.; Chongsuwat, T.; Zha, Y.; Alegre, M.L.; Luke, J.J.; Gajewski, T.F. The commensal microbiome is associated with anti-PD-1 efficacy in metastatic melanoma patients. Science 2018, 359, 104–108. [Google Scholar] [CrossRef]
- Chen, J.; Wright, K.; Davis, J.M.; Jeraldo, P.; Marietta, E.V.; Murray, J.; Nelson, H.; Matteson, E.L.; Taneja, V. An expansion of rare lineage intestinal microbes characterizes rheumatoid arthritis. Genome Med. 2016, 8, 43. [Google Scholar] [CrossRef]
- Arrieta, M.C.; Bistritz, L.; Meddings, J.B. Alterations in intestinal permeability. Gut 2006, 55, 1512–1520. [Google Scholar] [CrossRef]
- Jarvinen, K.M.; Konstantinou, G.N.; Pilapil, M.; Arrieta, M.C.; Noone, S.; Sampson, H.A.; Meddings, J.; Nowak-Wegrzyn, A. Intestinal permeability in children with food allergy on specific elimination diets. Pediatr. Allergy Immunol. 2013, 24, 589–595. [Google Scholar] [CrossRef]
- Bosi, E.; Molteni, L.; Radaelli, M.G.; Folini, L.; Fermo, I.; Bazzigaluppi, E.; Piemonti, L.; Pastore, M.R.; Paroni, R. Increased intestinal permeability precedes clinical onset of type 1 diabetes. Diabetologia 2006, 49, 2824–2827. [Google Scholar] [CrossRef] [PubMed]
- Sapone, A.; de Magistris, L.; Pietzak, M.; Clemente, M.G.; Tripathi, A.; Cucca, F.; Lampis, R.; Kryszak, D.; Carteni, M.; Generoso, M.; et al. Zonulin upregulation is associated with increased gut permeability in subjects with type 1 diabetes and their relatives. Diabetes 2006, 55, 1443–1449. [Google Scholar] [CrossRef] [PubMed]
- Kant, R.; de Vos, W.M.; Palva, A.; Satokari, R. Immunostimulatory CpG motifs in the genomes of gut bacteria and their role in human health and disease. J. Med. Microbiol. 2014, 63, 293–308. [Google Scholar] [CrossRef] [PubMed]
- Hemmi, H.; Kaisho, T.; Takeda, K.; Akira, S. The roles of Toll-like receptor 9, MyD88, and DNA-dependent protein kinase catalytic subunit in the effects of two distinct CpG DNAs on dendritic cell subsets. J. Immunol. 2003, 170, 3059–3064. [Google Scholar] [CrossRef] [PubMed]
- Kotredes, K.P.; Gamero, A.M. Interferons as inducers of apoptosis in malignant cells. J. Interf. Cytokine Res. 2013, 33, 162–170. [Google Scholar] [CrossRef] [PubMed]


© 2020 by the authors. Licensee MDPI, Basel, Switzerland. This article is an open access article distributed under the terms and conditions of the Creative Commons Attribution (CC BY) license (http://creativecommons.org/licenses/by/4.0/).
Share and Cite
Leite, J.A.; Pessenda, G.; Guerra-Gomes, I.C.; de Santana, A.K.M.; André Pereira, C.; Ribeiro Campos Costa, F.; Ramos, S.G.; Simões Zamboni, D.; Caetano Faria, A.M.; Candido de Almeida, D.; et al. The DNA Sensor AIM2 Protects against Streptozotocin-Induced Type 1 Diabetes by Regulating Intestinal Homeostasis via the IL-18 Pathway. Cells 2020, 9, 959. https://doi.org/10.3390/cells9040959
Leite JA, Pessenda G, Guerra-Gomes IC, de Santana AKM, André Pereira C, Ribeiro Campos Costa F, Ramos SG, Simões Zamboni D, Caetano Faria AM, Candido de Almeida D, et al. The DNA Sensor AIM2 Protects against Streptozotocin-Induced Type 1 Diabetes by Regulating Intestinal Homeostasis via the IL-18 Pathway. Cells. 2020; 9(4):959. https://doi.org/10.3390/cells9040959
Chicago/Turabian StyleLeite, Jefferson Antônio, Gabriela Pessenda, Isabel C. Guerra-Gomes, Alynne Karen Mendonça de Santana, Camila André Pereira, Frederico Ribeiro Campos Costa, Simone G. Ramos, Dario Simões Zamboni, Ana Maria Caetano Faria, Danilo Candido de Almeida, and et al. 2020. "The DNA Sensor AIM2 Protects against Streptozotocin-Induced Type 1 Diabetes by Regulating Intestinal Homeostasis via the IL-18 Pathway" Cells 9, no. 4: 959. https://doi.org/10.3390/cells9040959
APA StyleLeite, J. A., Pessenda, G., Guerra-Gomes, I. C., de Santana, A. K. M., André Pereira, C., Ribeiro Campos Costa, F., Ramos, S. G., Simões Zamboni, D., Caetano Faria, A. M., Candido de Almeida, D., Olsen Saraiva Câmara, N., Tostes, R. C., Santana Silva, J., & Carlos, D. (2020). The DNA Sensor AIM2 Protects against Streptozotocin-Induced Type 1 Diabetes by Regulating Intestinal Homeostasis via the IL-18 Pathway. Cells, 9(4), 959. https://doi.org/10.3390/cells9040959