Abstract
Background: The carbohydrate antigen Sda and its biosynthetic enzyme B4GALNT2 are highly expressed in normal colonic mucosa but are down-regulated to a variable degree in colon cancer tissues. Here, we investigated the clinical and biological importance of B4GALNT2 in colon cancer. Methods: Correlations of B4GALNT2 mRNA with clinical data were obtained from The Cancer Genome Atlas (TCGA) database; the phenotypic and transcriptomic changes induced by B4GALNT2 were studied in LS174T cells transfected with B4GALNT2 cDNA. Results: TCGA data indicate that patients with high B4GALNT2 expression in cancer tissues display longer survival than non-expressers. In LS174T cells, expression of B4GALNT2 did not affect the ability to heal a scratch wound or to form colonies in standard growth conditions but markedly reduced the growth in soft agar, the tridimensional (3D) growth as spheroids, and the number of cancer stem cells, indicating a specific effect of B4GALNT2 on the growth in poor adherence and stemness. On the transcriptome, B4GALNT2 induced the down-regulation of the stemness-associated gene SOX2 and modulated gene expression towards an attenuation of the cancer phenotype. Conclusions: The level of B4GALNT2 can be proposed as a marker to identify higher- and lower-risk colorectal cancer patients.
1. Introduction
Colorectal cancer (CRC) remains a worldwide leading cause of cancer deaths, notwithstanding the improved efficacy of the available therapies. Key factors for the success of the therapy include an early diagnosis and approaches tailored to the risk profile of each patient, sparing invasive and expensive therapies to lower-risk patients. Glycosylation is a very frequent post-translational modification of proteins, which undergoes profound changes during neoplastic transformation [1,2]. The Sda carbohydrate antigen is composed of an α2,3-sialylated galactose residue to which an N-acetylgalactosamine residue is β1,4 linked (Siaα2,3(GalNAcβ1,4) Gal-R), where R is the underlying carbohydrate structure (Figure 1A). The last step of the Sda antigen biosynthesis is mediated by the enzyme β1,4N-acetylgalactosaminyltransferase 2 (B4GALNT2) [3], the product of the B4GALNT2 gene [4,5,6]. Transcription of the B4GALNT2 gene generates at least two different transcripts that only differ in the first exon. These two transcripts contain a translational start site, from which two different transmembrane polypeptides originate: one, referred to as “long form”, contains an unusually long cytoplasmic tail [5,6]; the second, known as “short form”, is provided with a cytoplasmic tail of conventional length [7]. Previous studies have shown a higher enzymatic activity of the short form compared with the long form [8]. The normal human colonic mucosa usually expresses very high levels of the B4GALNT2 mRNA and enzyme activity as well as high levels of the Sda antigen. On the contrary, in CRC tissues, both the B4GALNT2 [9,10] and the Sda antigen [8] are markedly down-regulated, although at a very variable level among patients. In fact, in the cancer tissues of the majority of the patients, B4GALNT2 is virtually undetectable, while in a minority, a quite high activity is detectable. Both normal and cancerous colonic tissues express mainly, if not exclusively, the short form of B4GALNT2. The α2,3 sialylated type 2 sugar chains on which B4GALNT2 elaborates the Sda antigen can also be utilized by fucosyltransferases (mainly fucosyltransferase 6 (FUT6)) for the biosynthesis of the cancer-associated antigen sialyl Lewis X (sLex) [11,12,13]. Our group [8] and others [14] showed that the forced expression of B4GALNT2 in CRC cell lines partially replaces the sLex with the Sda antigen. In gastrointestinal cell lines, this modification has been shown to reduce the metastatic potential [14,15]. However, the clinical implications of B4GALNT2 expression in CRC have never been investigated. To obtain significant clinical correlations between gene expression and clinical parameters, it is necessary to access large cohorts of fully characterized patients, such as The Cancer Genome Atlas (TCGA), which contains gene expression and clinical data from hundreds of patients. Owing to the well-recognized importance of glycosylation in cancer, we used TCGA data to compare the prognostic predictive potential of several glycosyltransferases involved in the biosynthesis of cancer-associated glycans. In a preliminary survey of TCGA, we noticed that among various glycosyltransferases involved in colon cancer, B4GALNT2 displayed a very good predictive potential in that patients retaining higher levels of B4GALNT2 mRNA displayed a much longer overall survival. In particular, all long-time survivals displayed high levels of B4GALNT2 mRNA. To obtain insight into the mechanisms linking B4GALNT2/Sda expression to the CRC phenotype, we analyzed the phenotype and the transcriptome of LS174T cells transfected with the short form of B4GALNT2. We found that B4GALNT2 expression reduces the clonogenic ability in non-adherent conditions and the stemness of the cells through the modulation of the gene expression.
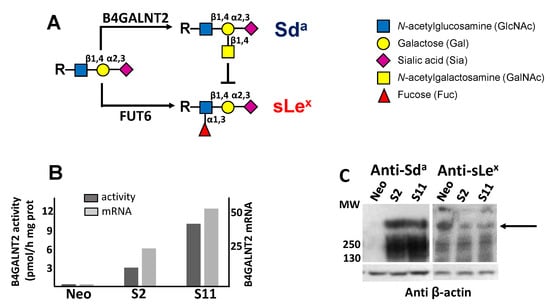
Figure 1.
Biochemical characterization of B4GALNT2-transfected cell lines. (A) the Sda and the sLex antigens derive from alternative and mutually exclusive terminations of a common α2,3-sialylated type 2 structure. (B) both the enzymatic activity (dark gray) and the mRNA (light gray) of B4GALNT2 were negligible in Neo cells, but strongly expressed in clones S2 and S11 as detected by RT-PCR and normalized with β-actin. (C) Western blot analysis of Neo cells and of B4GALNT2-transfected clones with anti-Sda (left) and anti-sLex (right) antibodies, revealing a partial replacement of the sLex antigen with the Sda (arrow).
2. Materials and Methods.
2.1. Analysis of TCGA Database
Gene expression data and clinical information for 623 colorectal adenocarcinoma samples and 51 normal colonic tissues were downloaded from the TCGA database using the Firebrowse website [16]. RNA-Seq by Expectation Maximization (RSEM)-normalized data for the colon adenocarcinoma (COADREAD) cohort were matched with clinical data from the Clinical Pick Tier1 archive. B4GALNT2 mRNA expression was compared with stage, microsatellite stability (MS) status, response to treatment, histological type, and survival. Since the samples did not present a normal distribution of B4GALNT2 expression, non-parametric statistical tests were used. The Mann–Whitney test was used to analyze the difference of B4GALNT2 expression in normal and tumor tissues of mucinous vs. non-mucinous histological type. The Kruskal–Wallis test was used to evaluate B4GALNT2 mRNA expression across cancer stages and MSS/MSI groups. The survival curve was estimated by the Kaplan–Meier method, and the Mantel–Cox log-rank test was performed to test differences between the survival curves. Identification of highly expressed genes in the high and low B4GALNT2 expressers was performed through two-way ANOVA and Bonferroni’s multiple comparison test.
2.2. Cell Lines
LS174T(ATCCR® Number: CL-188™) cell line was transfected with an expression vector for the short form of B4GALNT2 cDNA cloned in pcDNA3 or with the empty vector as detailed previously [8], generating the two B4GALNT2-expressing clones S2 and S11 and the polyclonal negative control Neo population, respectively. Cells were cultured in DMEM supplemented with 10% FBS and antibiotics in a humidified incubator with a 5% CO2 atmosphere at 37 °C. B4GALNT2 enzymatic activity was measured as the difference between the incorporation of radioactive GalNAc on fetuin and asialofetuin, as previously described [5]. B4GALNT2 mRNA was measured by real-time (RT) PCR as previously described [17]. Western blot analysis with an anti-Sda antibody KM694 and an anti-sLex antibody (CSLEX1) was performed as detailed elsewhere [8]. Cell lines were genotyped using highly polymorphic short tandem repeat loci, which were amplified using the PowerPlex® 16 HS System (Promega). Fragment analysis was done on an ABI3730xl (Life Technologies), and the resulting data were analyzed with GeneMarker HID software (Softgenetics) by Microsynth (Switzerland). Reports are available on request.
2.3. Soft Agar Growth Assay
One milliliter of a 0.5% agar solution in complete DMEM was dispensed in each well of a six-well plate and allowed to solidify. On top of this layer of agar, 1 mL of a 0.3% agar solution in complete DMEM medium containing 1 × 10⁴ cells per well was dispensed in triplicate. The plates were incubated for two weeks at 37 °C in a humidified incubator. To evaluate the number of colonies formed, the plates were fixed and colored for one hour at room temperature with a solution containing formaldehyde (4%) and crystal violet (0.005%) in phosphate buffered saline (PBS, 20 mM phosphate buffer pH 7.5, 0.15 mM NaCl). Pictures were taken at 4X magnification, and colonies were counted. Statistical analysis was performed using the non-parametric Kolmogorov–Smirnov test.
2.4. Tridimensional (3D) Culture
Cells were seeded in six-well plates whose bottoms were coated with 0.5% agar in complete DMEM. Spheroid growth was monitored every 2–3 days. Owing to their non-adherent condition, it was impossible to quantitate spheroids by counting. Thus, cells were quantitatively collected and homogenized, and the protein concentration, as well as the volume of each homogenate, was measured. The number of cells was calculated using the protein concentration of a homogenate obtained from a known number of cells grown in standard conditions as a reference.
2.5. Wound-Healing Assay
The wound-healing assay was performed using Culture-Insert 2 Well (Ibidi). Aliquots of 5 × 10⁴ cells were seeded in each well. When the cells reached confluency, the insert was removed and the healing of the wound was measured by taking pictures at 4× magnification. The area free of cells was measured using the MRI Wound Healing Tool of ImageJ [18]. The statistical analysis was performed using two-way ANOVA and Tukey’s multiple comparisons test.
2.6. ALDEFLUOR Assay
ALDEFLUOR (Stem Cell Technologies) was activated following the manufacturer’s instructions and added to 5 × 10⁵ aliquots of cells. Half of the cell suspension was treated with DEAB, a specific ALDH inhibitor used as a negative control. After 45 min at 37 °C, cells were washed and suspended in ALDEFLUOR buffer. The fluorescent signal was acquired with a FACSCalibur flow cytometer and Cell Quest Pro software. On a dot plot with FL1 (green fluorescence) on the X axis and side scatter (SSC) on the Y axis, we set the fluorescence of the DEAB sample (negative control) and defined the area for ALDH-positive cells. Cells included in this area were considered ALDEFLUOR-positive.
2.7. Transcriptomic Analysis
Transcriptomic analysis of RNA from LS174T Neo and S2/S11 cells grown either in standard 2D conditions or in 3D conditions (as spheroids) was performed in duplicate using Agilent whole human genome oligo microarray (G4851A) as previously described [19]. Statistical analysis was performed using a moderated t-test, and the false discovery rate was controlled with the multiple testing correction Benjamini–Hochberg with Q = 0.05. Pathway analysis of differentially expressed genes was determined using the web-based software MetaCore (GeneGo, Thomson Reuters). Gene function was studied through an extensive literature search.
3. Results
3.1. Survey of the TCGA Database
The relationship between B4GALNT2 gene expression and clinical parameters of CRC and normal specimens was investigated in the transcriptomic data from the TCGA database. As shown in Figure 2A, the mean level of B4GALNT2 mRNA in CRC tissues was much lower than in normal tissues, albeit extremely variable. No significant association existed between B4GALNT2 expression and stage or microsatellite stability status (Figure 2B,C). However, B4GALNT2 expression was significantly higher in the groups of therapy responder (Figure 2D), non-mucinous subtype (Figure 2E), and wild-type TP53 (Figure 2F). On the other hand, little or no relationship was observed with KRAS, BRAF, and APC mutations (data not shown). The most striking effect of the level of B4GALNT2 expression was observed on the overall survival (Figure 2G). Patients falling in the lower 15th percentile (all lacking detectable B4GALNT2 mRNA) and those falling in the higher 15th percentile displayed very similar survival curves within the first 1000 days, while long-term survivals belonged exclusively to the high-B4GALNT2-expressers group (Figure 2G).
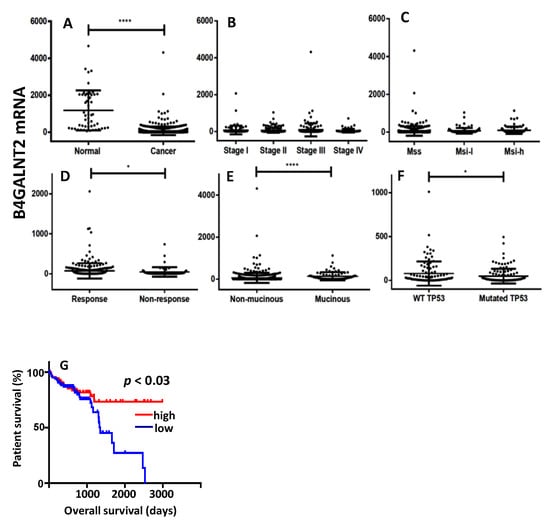
Figure 2.
The Cancer Genome Atlas (TCGA) data. (A) Expression level of B4GALNT2 mRNA in normal mucosa and colorectal cancer (CRC) specimens. (B–F) Expression of B4GALNT2 mRNA in CRC specimens grouped according to stage (B), microsatellite stability status (C), response to therapy (D) subtypes (E), and TP53 mutation (F). (G) Kaplan–Meier survival curves of patients grouped in the groups of high expressers (15th upper percentile, red) or no expressers (15th lower percentile, blu) of mRNA B4GALNT2 expression. MSS: microsatellite stable; MSI-l: microsatellite instable-low; MSI-h: microsatellite instable-high. * p ≤ 0.05; **** p ≤ 0.0001.
The cohorts of high and low B4GALNT2 expressers displayed very different gene expression signatures. In fact, samples from the upper percentile showed up-regulation of several genes (Table 1), five of which (CLCA1, FCGBP, MUC2, MUC5B, AGR2) were related to the formation of the mucous layer. Three genes were involved in the immune function (LCN2, IGJ, PIGR), particularly in the formation and transport of polymeric immunoglobulins, while three genes (REG1A, REG4, TFF3) were involved in repair and maintenance of the epithelial layer. On the contrary, the growth-promoting gene IGF2 displayed up-regulation in low B4GALNT2 expressers. Altogether, these data support a view in which high B4GALNT2 expressers displayed up-regulation of genes involved in functions associated with a normal epithelium (mucus formation, immunoglobulin secretion, and epithelial integrity), while low B4GALNT2 expressers were associated with the overexpression of a growth-promoting gene.

Table 1.
Genes modulated in high/low B4GALNT2 cohorts.
3.2. Phenotypic Impact of B4GALNT2 Expression on Colon Cancer Cells
Owing to the clear association between high B4GALNT2 and better prognosis, the impact of B4GALNT2 expression on the malignant phenotype of a colon cancer cell line was studied using, as a model, LS174T cells transfected with the short form of B4GALNT2 or mock-transfected [8]. The three cell lines analyzed were Neo—a polyclonal population of mock-transfectants—and S2 and S11, two B4GALNT2-transfected clones. As shown in Figure 1B, the level of B4GALNT2 mRNA and enzyme activity in mock transfectants was nearly undetectable, while it was high in S2 and S11 clones. In S2 and S11 clones, but not in Neo cells, the Sda antigen was strongly expressed on high-molecular-weight proteins. On the other hand, the sLex antigen, which is also carried by high-molecular-weight proteins, was more strongly expressed by Neo cells than by S2 and S11 clones (Figure 1C). This is due to the previously documented competition between the fucosyltransferases synthesizing sLex and B4GALNT2 [8,14] (Figure 1A).
Compared with mock-transfected Neo cells, both S2 and S11 clones displayed a strongly reduced ability to grow in a semi-solid medium (soft agar) (Figure 3A), forming 20–40% of the clones formed by Neo cells.
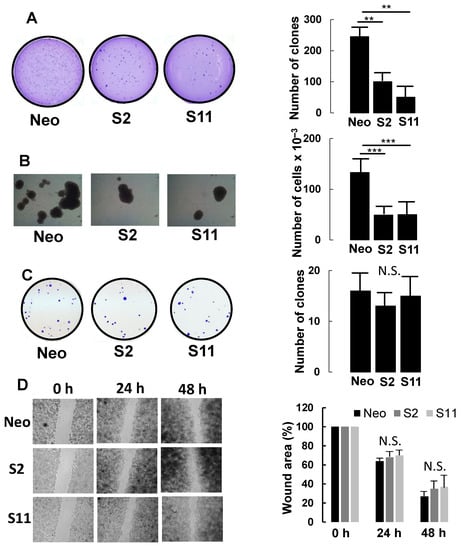
Figure 3.
Phenotypic characterization of B4GALNT2-expressing cells and mock-transfectants. (A) growth in 0.33% agar. (B) tridimensional growth as spheroids. (C) clone formation in standard growth conditions. (D) wound healing assay. Experimental details are provided in Materials and Methods. ** p ≤ 0.01, *** p ≤ 0.001, N.S. = Not significant.
B4GALNT2-expressing clones also displayed a 60% reduction in ability to grow as spheroids in a completely liquid medium (Figure 3B). Interestingly, the decreased clonogenic capability was evident only in conditions of poor or no adhesion. Indeed, when a small number of Neo, S2, or S11 cells were seeded in standard conditions, the number of growing colonies was similar (Figure 3C). Lastly, the capacity to heal a scratch wound was not significantly affected by B4GALNT2 expression clones (Figure 3D).
3.3. B4GALNT2 Expression Reduces the Number of Cancer Stem Cells
To investigate the relationship between B4GALNT2 expression and stemness, we analyzed the three cell lines for the expression of aldehyde dehydrogenase (ALDH), reported to be a stem-cell and cancer-initiating cell marker in many tissues, including colon tissue [20].
In a typical experiment (Figure 4), cells were incubated with the ALDH substrate ALDEFLUOR, either in the presence or in the absence of DEAB (a specific ALDH inhibitor) to provide a negative control. While the percentage of ALDH-positive cells in LS174T Neo was about 40%, it was around 30% in the two B4GALNT2 clones, consistent with a marked reduction in the number of cancer stem cells (CSC).
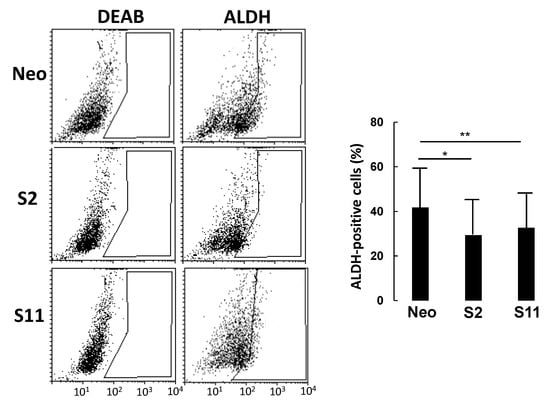
Figure 4.
ALDEFLUOR analysis. Cells were incubated with ALDEFLUOR either in the presence or in the absence of the inhibitor DEAB. Gates excluding all of the cells labelled in the presence of DEAB were set. Cells included in the gate in the absence of DEAB were considered to be ALDH-positive. Histograms report the percentage of ALDH-positive cells ± SD in three independent experiments. * p ≤ 0.05, ** p ≤ 0.01.
3.4. Impact of B4GALNT2 Expression on the Transcriptome of Colon Cancer Cells
To understand the origin of the dramatic effect of B4GALNT2 on the phenotype of LS174T cells and, in particular, on the ability to grow in non-adherent conditions, the impact of B4GALNT2 and of 3D growth in liquid medium on the transcriptome of LS174T cells was investigated by microarray analysis. Using this technology, the mean level of B4GALNT2 expression was found to be three in Neo and 230 in S2/S11 cells. The heat map graph displayed in Figure 5A reports the modulation of 142 genes showing a fold change ≥ 2 in LS174T S2 and S11, compared with Neo cells, grown in standard conditions.
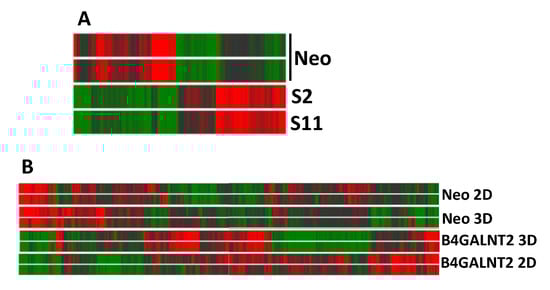
Figure 5.
Heatmaps of gene expression analysis. (A) B4GALNT2-expressing and control Neo LS174T cells grown in standard 2D conditions. (B) Cells grown in 3D conditions or in standard 2D conditions. High and low expression was normalized to the average expression across all samples. Differences were analyzed by the moderated t-test. Corrected p-value cut-off: 0.15; multiple test correction used: Benjamini–Hochberg.
Table 2 shows a synthesis of pathway analysis, indicating that stemness, intracellular signaling, and cell adhesion were among the significantly affected pathways.
Table 2.
Pathways modulated by B4GALNT2 expression.
A more in-depth analysis focused on the 25 genes modulated by B4GALNT2 by a fold change ≥ 4 (Table 3), revealed that four genes displayed up-regulation (above the red line) and 21 displayed down-regulation (below the red line).
Table 3.
Genes highly modulated by B4GALNT2 in LS174T cells.
A large number of modulated genes were found to be related with cancer. Through an extensive survey of the literature, we attributed a cancer-promoting activity or a cancer-restraining activity to the majority of the modulated genes. A violet or yellow label was assigned on the basis of the putative tumor-promoting or tumor-restraining change (violet for up-regulation of tumor-promoting or down-regulation of tumor-restraining and vice versa for the yellow label). Interestingly, only three changes were putatively tumor-promoting and 12 were tumor-restraining. Some genes, which appeared to be virtually switched off in B4GALNT2-expressing cells, are involved in the basic properties of cancer cells, such as stemness (SOX2, ROR1), epithelial to mesenchymal transition (EMT) (NID1, ALX1), and growth (FAM110B, PEG10, MID2). Overall, the transcriptomic changes induced by B4GALNT2 were consistent with a general down-regulation of gene expression and an attenuation of the neoplastic phenotype.
These data are consistent with a driving role of B4GALNT2 or its cognate Sda antigen in the regulation of several crucial genes in LS174T cells. If this driving role of B4GALNT2 on gene expression was also exerted in CRC tissues, a consistent regulation of these genes in TCGA patients could be observed. Thus, we asked whether those genes that we found to be up-regulated in LS174T S2 and S11 cells were also up-regulated in patients showing high B4GALNT2 levels in cancer tissues and vice versa for genes displaying down-regulation in S2/S11 cells. To this aim, we considered the same cohorts of patients shown in Figure 2G, comprising 15% of non-expressers and 15% of high expressers. For the 25 genes showing modulation by B4GALNT2 reported in Table 3, we determined the mean level of expression in the non-expressers and in the high-expressers cohorts, respectively (Table 4), from TCGA. The “consistency” column indicates whether the observed difference between non-expressers and high-expressers was consistent with the hypothesized role of B4GALNT2 in regulating gene expression. Out of the 25 genes, one was not expressed and 13 showed a difference consistent with the supposed role of B4GALNT2; for six genes, the change was statistically significant.
Table 4.
Gene expression comparison between TCGA cohort (Non- and High B4GALNT2 expressers and microarray analyisis of LS174T cells (S2/S11 comparison with Neo).
3.5. B4GALNT2 Expression Regulates the Transcriptional Response to 3D Culture
Owing to the markedly reduced ability to adapt to non-adherent growth displayed by B4GALNT2-expressing cells, we asked which genes were modulated by 3D culture in LS174T cells and which genes displayed a differential response to 3D culture conditions in B4GALNT2-expressing cells S2/S11. Many genes were modulated by 3D culture conditions, regardless of B4GALNT2 expression (Figure 5B). Among these, 106 displayed a fold change ≥ 4 (Table S2). Several strongly modulated genes were involved in energy metabolism, including glycolysis (PFKFB4, ALDOC, PGM1, PGK1), and several were part of the hypoxia response (CA9, EGLN3, EGR1). Some of these genes displayed extremely high expression levels and were all up-regulated (PGK1, LCN15, FABP1, ALDOC, PGM1, CA9). Among the genes involved in transcriptional regulation, the high level of expression of transcription factors FOS and FOSB and of the transcriptional regulator EGR1 in 2D culture and their dramatic down-regulation in 3D culture is noteworthy. On the other hand, among the genes involved in cell signaling, the gene KIT encoding a crucial tyrosine kinase receptor displayed a high level of up-regulation in 3D culture. Genes involved in cytoskeleton organization exhibited a general down-regulation, while those involved in detoxification displayed up-regulation. Finally, the strong up-regulation of the genes PIGZ, involved in the biosynthesis of the glycosylphosphatidylinositol (GPI)-anchor, and NDRG1, involved in stress response is of note.
All the above-mentioned genes displayed 3D culture modulation regardless of B4GALNT2 expression. A search for genes differentially modulated by 3D culture depending on the expression or non-expression of B4GALNT2 yielded a list of 31 genes, 13 of which showed up-regulation in response to 3D culture only in S2/S11 cells, while the remaining 18 showed down-regulation in response to 3D culture only in S2/S11 cells (Table 5). The most remarkable change is the concomitant strong down-regulation of five genes (KIZ, CEP120, DNAH6, SGOL2, STARD13) controlling cytoskeletal organization in mitosis and motility. This finding could provide a clue to explain the reduced ability of the B4GALNT2-expressing cells to adapt to non-adherent conditions of growth. Among the genes involved in cell signaling, it is important to highlight the concomitant down-regulation of three genes encoding taste receptors, which, besides tasting bitterness, can play a tumor-suppressive role. 3D culture appears to increase the propensity to apoptosis in B4GALNT2-expressing cells by modulating at least three genes: TNFAIP8L2, MYOD1, and PPM1K. Among the genes involved in transcriptional regulation, the marked down-regulation of PHF20L1, which stabilizes SOX2 post-translationally [21], must be noted, and is consistent with reduced stemness. Of the three genes related to immunity and inflammation, CTLA4 is a well-known inhibitory receptor of T lymphocytes and is surprisingly expressed by this CRC cell line. IL1A is an inflammatory cytokine, while TDO2 is involved in a pathway potentially suppressing anti-tumor immune responses.
Table 5.
Genes highly modulated by 3D only in B4GALNT2-expressing LS174T cells (clones S2/S11).
Afterward, we investigated whether the TCGA cohorts of non- or high B4GALNT2 expressers displayed parallel modulation of the same genes, focusing on genes belonging to the major functional classes (top five classes of Table 5). Table 6 shows that genes belonging to the groups “Cytoskeleton and mitosis” and “Transcription regulation” in Table 5 displayed significant consistent modulation in TCGA data, but genes TNFAIP8L2, involved in apoptosis, and IL1A involved in inflammation and immunity, were also consistently modulated. Altogether, these data point to some mechanisms through which B4GALNT2 expression reduces the ability to grow in conditions of poor adherence.
Table 6.
Gene expression comparison between TCGA cohort (Non- and High B4GALNT2 expressers and microarray analyisis of LS174T cells (modulated by 3D only in S2/S11).
4. Discussion
In this study, we show for the first time that in a large cohort of colon cancer samples, the mRNA of B4GALNT2 is dramatically down-regulated compared with normal tissue, consistent with previous observations of a reduced B4GALNT2 enzymatic activity in CRC tissues [8,10]. In addition, we observed that all patients surviving beyond three years displayed a high level of B4GALNT2 mRNA, indicating a strong relationship between high B4GALNT2 and lower malignancy. In other TCGA cohorts, the association of high B4GALNT2 with survival was not observed, suggesting that it is restricted to CRC. To understand whether high B4GALNT2 and lower malignancy were causally related, we analyzed the phenotype of LS174T cells permanently modified to express B4GALNT2 cDNA. This cell line was chosen because it is devoid of B4GALNT2 activity and of cognate Sda antigen (like the vast majority of colon cancer cell lines) and is one of the few CRC cell lines expressing the sLex antigen. In our system, B4GALNT2 expression resulted in a partial replacement of the sLex epitope with Sda. While little or no effect was observed on the ability to heal a scratch wound or to form clones in standard conditions of growth, B4GALNT2 expression resulted in a dramatic inhibition of the ability to grow in poor or no adherence, pointing to a specific effect of B4GALNT2 in regulating this property. The ability to survive and proliferate without the intracellular signals generated by the mechanosensors [23] is intimately associated with resistance to apoptosis and stemness. Consistently, we observed that in B4GALNT2-expressing cells, the percentage of stem cells was reduced. For this reason, we investigated the effect of B4GALNT2 on the transcriptome of transfected LS174T cell variants. The ability to modulate the transcriptome of cancer cells by a glycosyltransferase was previously documented [17,24,25,26]. Nevertheless, the transcriptomic changes induced by B4GALNT2 in standard conditions of growth were surprisingly relevant. In particular, the marked transcriptional down-regulation of protein-coding genes in B4GALNT2-expressing cells may conceivably be related to a reduced ability to perform several cellular functions. The fact that the vast majority of these genes displayed cancer-promoting activity in different systems is consistent with an attenuation of the cancer phenotype in LS174T cells. Moreover, a causative role of B4GALNT2 in the control of these genes was supported by the observation that in the TCGA cohorts of high and low B4GALNT2 expressers, the mean level of expression of these genes was in some cases significantly consistent with that observed in LS174T cells. Among the genes showing significant inverse association with B4GALNT2 expression in TCGA, SOX2 is particularly relevant for its role in CRC stemness [27]. Its dramatic down-regulation in S2/S11 clones can certainly contribute to explaining their reduced ability to grow in non-adherent conditions and their reduced content of stem cells. To understand which genes were modulated by non-adherent growth, we analyzed the transcriptome of cells grown as spheroids in 3D conditions. We were particularly interested in understanding which genes were differentially modulated by 3D growth, depending on their B4GALNT2 expression. Growth in 3D conditions modulates a large number of genes, mainly involved in energy metabolisms, transcription, cell signaling, and detoxifying activity. Several genes belong to the hypoxia response, which is not surprising, considering the hypoxic conditions present at the center of the spheroids [28]. However, the genes responding to 3D growth only in B4GALNT2-expressing cells appeared to impair mainly the function of microtubules in mitosis but also transcription, cell signaling, and apoptosis, thus explaining the reduced ability of B4GALNT2-expressing cells to grow in poorly adherent conditions. Interestingly, all the genes belonging to the groups “Cytoskeleton and mitosis” and “Transcription regulation” displayed consistent association with B4GALNT2 level in TCGA cohort. In addition, the gene TNFAIPL2, which promotes apoptosis, and the gene of the pro-inflammatory cytokine, IL1A, also displayed consistent modulation in the TCGA cohort. Although IL1A plays different and sometimes opposite roles when expressed by cells of the tumor microenvironment, when it is expressed by CRC cells, it is immunostimulatory and induces an anti-tumor immune response [29]. Current data support the notion that high B4GALNT2 is causally related to a better prognosis because it can reduce stemness and capability to grow in poorly adherent conditions, and it increases the propensity to apoptosis and stimulates anti-cancer immunity. Although our data do not clarify whether the observed effects of B4GALNT2 expression are due to the de novo expression of the Sda antigen or the down-regulation of sLex, they point to the potential usefulness of B4GALNT2 to stratify patients’ risk, contributing to the design of a personalized therapy of colon cancer.
Supplementary Materials
The following are available online at https://www.mdpi.com/2073-4409/9/4/948/s1: Table S1: Pathways modulated by B4GALNT2 expression; Table S2: Genes highly modulated by 3D culture in LS174T.
Author Contributions
Conceptualization, F.D. and M.F.; methodology, M.P., I.G.F, N.M. and M.O.; software, M.F., I.G.F. and M.P.; formal analysis, M.F.; investigation, M.P., I.G.F, N.M. and M.O.; writing—original draft preparation, F.D.; writing—review and editing, M.P., I.G.F, M.O, N.M., M.F. and F.D.; supervision, F.D.; funding acquisition, F.D. All authors have read and agreed to the published version of the manuscript.
Funding
This research was funded by the European Commission Horizon 2020 program under grant agreement number 676421 (GlyCoCan), by funds from the University of Bologna, and by the Pallotti Legacy for Cancer Research.
Acknowledgments
We would like to thank the LTTA Microarray Facility of the University of Ferrara (Italy) for performing the microarray experiments.
Conflicts of Interest
The authors declare no conflict of interest. The funders had no role in the design of the study; in the collection, analyses, or interpretation of data; in the writing of the manuscript, or in the decision to publish the results.
References
- Dall’Olio, F.; Malagolini, N.; Trinchera, M.; Chiricolo, M. Mechanisms of cancer-associated glycosylation changes. Front Biosci. 2012, 17, 670–699. [Google Scholar] [CrossRef] [PubMed]
- Pinho, S.S.; Reis, C.A. Glycosylation in cancer: Mechanisms and clinical implications. Nat. Rev. Cancer 2015, 15, 540–555. [Google Scholar] [CrossRef] [PubMed]
- Serafini-Cessi, F.; Dall’Olio, F. Guinea-pig kidney b-N-acetylgalactosaminyltransferase towards Tamm- Horsfall glycoprotein. Requirement of sialic acid in the acceptor for transferase activity. Biochem. J. 1983, 215, 483–489. [Google Scholar] [CrossRef] [PubMed]
- Smith, P.L.; Lowe, J.B. Molecular cloning of a murine N-acetylgalactosamine transferase cDNA that determines expression of the T lymphocyte-specific CT oligosaccharide differentiation antigen. J. Biol. Chem. 1994, 269, 15162–15171. [Google Scholar]
- Lo Presti, L.; Cabuy, E.; Chiricolo, M.; Dall’Olio, F. Molecular Cloning of the Human b1,4 N-Acetylgalactosaminyltransferase Responsible for the Biosynthesis of the Sda Histo-Blood Group Antigen: The Sequence Predicts a Very Long Cytoplasmic Domain. J. Biochem. (Tokyo) 2003, 134, 675–682. [Google Scholar] [CrossRef]
- Montiel, M.D.; Krzewinski-Recchi, M.A.; Delannoy, P.; Harduin-Lepers, A. Molecular cloning, gene organization and expression of the human UDP-GalNAc:Neu5Aca2-3Galb-R b1,4-N-acetylgalactosaminyltransferase responsible for the biosynthesis of the blood group Sda/Cad antigen: Evidence for an unusual extended cytoplasmic domain. Biochem. J. 2003, 373, 369–379. [Google Scholar] [CrossRef]
- Groux-Degroote, S.; Schulz, C.; Cogez, V.; Noel, M.; Portier, L.; Vicogne, D.; Solorzano, C.; Dall’Olio, F.; Steenackers, A.; Mortuaire, M.; et al. The extended cytoplasmic tail of the human B4GALNT2 is critical for its Golgi targeting and post-Golgi sorting. FEBS J. 2018, 285, 3442–3463. [Google Scholar] [CrossRef]
- Malagolini, N.; Santini, D.; Chiricolo, M.; Dall’Olio, F. Biosynthesis and expression of the Sda and sialyl Lewis x antigens in normal and cancer colon. Glycobiology 2007, 17, 688–697. [Google Scholar] [CrossRef]
- Dohi, T.; Yuyama, Y.; Natori, Y.; Smith, P.L.; Lowe, J.B.; Oshima, M. Detection of N-acetylgalactosaminyltransferase mRNA which determines expression of Sda blood group carbohydrate structure in human gastrointestinal mucosa and cancer. Int. J. Cancer 1996, 67, 626–631. [Google Scholar] [CrossRef]
- Malagolini, N.; Dall’Olio, F.; Di Stefano, G.; Minni, F.; Marrano, D.; Serafini-Cessi, F. Expression of UDP-GalNAc:NeuAc a2,3Gal b-R beta 1,4(GalNAc to Gal) N-acetylgalactosaminyltransferase involved in the synthesis of Sda antigen in human large intestine and colorectal carcinomas. Cancer Res. 1989, 49, 6466–6470. [Google Scholar]
- Trinchera, M.; Malagolini, N.; Chiricolo, M.; Santini, D.; Minni, F.; Caretti, A.; Dall’Olio, F. The biosynthesis of the selectin-ligand sialyl Lewis x in colorectal cancer tissues is regulated by fucosyltransferase VI and can be inhibited by an RNA interference-based approach. Int. J. Biochem. Cell Biol. 2011, 43, 130–139. [Google Scholar] [CrossRef] [PubMed]
- Trinchera, M.; Aronica, A.; Dall’Olio, F. Selectin Ligands Sialyl-Lewis a and Sialyl-Lewis x in Gastrointestinal Cancers. Biology 2017, 6, 16. [Google Scholar] [CrossRef] [PubMed]
- Groux-Degroote, S.; Wavelet, C.; Krzewinski-Recchi, M.A.; Portier, L.; Mortuaire, M.; Mihalache, A.; Trinchera, M.; Delannoy, P.; Malagolini, N.; Chiricolo, M.; et al. B4GALNT2 gene expression controls the biosynthesis of Sda and sialyl Lewis X antigens in healthy and cancer human gastrointestinal tract. Int. J. Biochem. Cell Biol. 2014, 53, 442–449. [Google Scholar] [CrossRef] [PubMed]
- Kawamura, Y.I.; Kawashima, R.; Fukunaga, R.; Hirai, K.; Toyama-Sorimachi, N.; Tokuhara, M.; Shimizu, T.; Dohi, T. Introduction of Sda carbohydrate antigen in gastrointestinal cancer cells eliminates selectin ligands and inhibits metastasis. Cancer Res. 2005, 65, 6220–6227. [Google Scholar] [CrossRef]
- Kawamura, Y.I.; Adachi, Y.; Curiel, D.T.; Kawashima, R.; Kannagi, R.; Nishimoto, N.; Dohi, T. Therapeutic adenoviral gene transfer of a glycosyltransferase for prevention of peritoneal dissemination and metastasis of gastric cancer. Cancer Gene Ther. 2014, 21, 427–433. [Google Scholar] [CrossRef]
- Firebrowse. Available online: http://firebrowse.org (accessed on 13 October 2019).
- Venturi, G.; Gomes, F.I.; Pucci, M.; Ferracin, M.; Malagolini, N.; Chiricolo, M.; Dall’Olio, F. Impact of sialyltransferase ST6GAL1 overexpression on different colon cancer cell types. Glycobiology 2019, 29, 684–695. [Google Scholar] [CrossRef]
- ImageJ-macros. Available online: http://dev.mri.cnrs.fr/projects/imagej-macros/wiki/Wound_Healing_Tool (accessed on 6 January 2011).
- Ferracin, M.; Bassi, C.; Pedriali, M.; Pagotto, S.; D’Abundo, L.; Zagatti, B.; Corra, F.; Musa, G.; Callegari, E.; Lupini, L.; et al. miR-125b targets erythropoietin and its receptor and their expression correlates with metastatic potential and ERBB2/HER2 expression. Mol. Cancer 2013, 12, 130. [Google Scholar] [CrossRef]
- Volonte, A.; Di, T.T.; Spinelli, M.; Todaro, M.; Sanvito, F.; Albarello, L.; Bissolati, M.; Ghirardelli, L.; Orsenigo, E.; Ferrone, S.; et al. Cancer-initiating cells from colorectal cancer patients escape from T cell-mediated immunosurveillance in vitro through membrane-bound IL-4. J. Immunol. 2014, 192, 523–532. [Google Scholar] [CrossRef]
- Wang, Q.; Yu, M.; Ma, Y.; Zhang, X.; Zhang, H.; Li, S.; Lan, R.; Lu, F. PHF20L1 antagonizes SOX2 proteolysis triggered by the MLL1/WDR5 complexes. Lab Invest 2018, 98, 1627–1641. [Google Scholar] [CrossRef]
- GeneCards: The Human Gene Database. Available online: https://www.genecards.org/ (accessed on 25 February 2020).
- Halder, G.; Dupont, S.; Piccolo, S. Transduction of mechanical and cytoskeletal cues by YAP and TAZ. Nat. Rev. Mol. Cell Biol. 2012, 13, 591–600. [Google Scholar] [CrossRef]
- Chong, Y.K.; Sandanaraj, E.; Koh, L.W.; Thangaveloo, M.; Tan, M.S.; Koh, G.R.; Toh, T.B.; Lim, G.G.; Holbrook, J.D.; Kon, O.L.; et al. ST3GAL1-Associated Transcriptomic Program in Glioblastoma Tumor Growth, Invasion, and Prognosis. J. Natl. Cancer Inst. 2016, 108. [Google Scholar] [CrossRef] [PubMed]
- Severino, P.F.; Silva, M.; Carrascal, M.; Malagolini, N.; Chiricolo, M.; Venturi, G.; Astolfi, A.; Catera, M.; Videira, P.A.; Dall’Olio, F. Expression of sialyl-Tn sugar antigen in bladder cancer cells affects response to Bacillus Calmette Guerin (BCG) and to oxidative damage. Oncotarget. 2017, 8, 54506–54517. [Google Scholar] [CrossRef] [PubMed][Green Version]
- Severino, P.F.; Silva, M.; Carrascal, M.; Malagolini, N.; Chiricolo, M.; Venturi, G.; Barbaro, F.R.; Astolfi, A.; Catera, M.; Videira, P.A.; et al. Oxidative damage and response to Bacillus Calmette-Guerin in bladder cancer cells expressing sialyltransferase ST3GAL1. BMC. Cancer 2018, 18, 198. [Google Scholar] [CrossRef] [PubMed]
- Takeda, K.; Mizushima, T.; Yokoyama, Y.; Hirose, H.; Wu, X.; Qian, Y.; Ikehata, K.; Miyoshi, N.; Takahashi, H.; Haraguchi, N.; et al. Sox2 is associated with cancer stem-like properties in colorectal cancer. Sci. Rep. 2018, 8, 17639. [Google Scholar] [CrossRef]
- Riffle, S.; Hegde, R.S. Modeling tumor cell adaptations to hypoxia in multicellular tumor spheroids. J. Exp. Clin. Cancer Res. 2017, 36, 102. [Google Scholar] [CrossRef] [PubMed]
- Voronov, E.; Apte, R.N. IL-1 in Colon Inflammation, Colon Carcinogenesis and Invasiveness of Colon Cancer. Cancer Microenviron. 2015, 8, 187–200. [Google Scholar] [CrossRef]
© 2020 by the authors. Licensee MDPI, Basel, Switzerland. This article is an open access article distributed under the terms and conditions of the Creative Commons Attribution (CC BY) license (http://creativecommons.org/licenses/by/4.0/).