Article

miR-1272 Exerts Tumor-Suppressive Functions in Prostate Cancer via HIP1 Suppression

1
Department of Applied Research and Technological Development, Fondazione IRCCS Istituto Nazionale dei Tumori, 20133 Milan, Italy
2
Department of Oncology and Hemato-oncology, University of Milan, 20133 Milan, Italy
3
Prostate Cancer Program, Fondazione IRCCS Istituto Nazionale dei Tumori, 20133 Milan, Italy
4
Radiation Oncology 1, Fondazione IRCCS Istituto Nazionale dei Tumori, 20133 Milan, Italy
5
Department of Biosciences, University of Milan, 20133 Milan, Italy
*
Authors to whom correspondence should be addressed.
These authors contributed equally to this work.
Current address: Department of Biomedical and Clinical Sciences L. Sacco, University of Milan, 20157 Milan, Italy.
Cells 2020, 9(2), 435; https://doi.org/10.3390/cells9020435
Submission received: 16 December 2019 / Revised: 24 January 2020 / Accepted: 11 February 2020 / Published: 13 February 2020
(This article belongs to the Special Issue Molecular and Cellular Mechanisms of Cancers: Prostate Cancer)

Abstract

:
The development of novel therapies or the improvement of currently used approaches to treat prostate cancer (PCa), the most frequently diagnosed male tumor in developed countries, is an urgent need. In this regard, the functional characterization of microRNAs, molecules shown to regulate a number of cancer-related pathways, is instrumental to their possible clinical exploitation. Here, we demonstrate the tumor-suppressive role of the so far uncharacterized miR-1272, which we found to be significantly down-modulated in PCa clinical specimens compared to normal tissues. Through a gain-of-function approach using miRNA mimics, we showed that miR-1272 supplementation in two PCa cell models (DU145 and 22Rv1) reverted the mesenchymal phenotype by affecting migratory and invasive properties, and reduced cell growth in vitro and in vivo in SCID mice. Additionally, by targeting HIP1 encoding the endocytic protein HIP1, miR-1272 balanced EGFR membrane turnover, thus affecting the downstream AKT/ERK pathways, and, ultimately, increasing PCa cell response to ionizing radiation. Overall, our results show that miR-1272 reconstitution can affect several tumor traits, thus suggesting this approach as a potential novel therapeutic strategy to be pursued for PCa, with the multiple aim of reducing tumor growth, enhancing response to radiotherapy and limiting metastatic dissemination.

Graphical Abstract

1. Introduction

Prostate cancer (PCa) represents the most frequently diagnosed cancer in men in the developed countries of Europe and USA [1,2]. Although radical surgery and radiotherapy turned out to be effective to control localized PCa, a significant proportion of patients still experience relapse, in the form of biochemical or local recurrence or metastasis [3]. The efficacy of androgen-deprivation therapy, the treatment of choice for metastatic tumors, is itself limited in time, thus making the management of castration-resistant disease challenging and the patient’s prognosis invariably poor [4]. In this scenario, the development of novel therapies or the implementation of currently used approaches is an urgent need.
MicroRNAs (miRNAs), endogenous small noncoding RNAs that negatively regulate gene expression at the post-transcriptional level [5], have been found aberrantly expressed in several human diseases, including cancer [6,7]. Specifically, depending on their target genes, miRNAs have been acknowledged to exert either pro- or anti-metastatic functions [8].
Based on the available literature, it is still difficult to outline the precise signature of miRNAs related to PCa pathogenesis and progression, however several miRNAs are emerging as master regulators of processes involved in different steps of cancer evolution and in drug response. For example, miR-29b, the expression of which is lower in PCa cells compared to normal cells, has been recently reported to inhibit prostate tumor growth in vivo and induce apoptosis by enhancing Bim expression [9]. Down-regulation of miR-130b in PCa cells was instead shown to significantly promote the proliferation, invasion and tubule formation of human umbilical vein endothelial cells, while ectopic expression of miR-130b blocked prostate cancer angiogenesis in vitro and in vivo [10]. We demonstrated that miR-205, a down-regulated miRNA in PCa tissues, is able to pleiotropically hamper PCa metastasis by reverting epithelial to mesenchymal transition (EMT) [11] and restoring the deposition of basement membrane by tumor cells [12]. Consistent with the role of EMT in the establishment of radioresistance [13], miR-205 can also increase response of PCa cells to ionizing radiation [14]. A tumor-suppressive behavior comparable to that of miR-205 was reported for miR-875-5p, which controls a different set of target genes [15].
Several efforts have been and are still being made to establish miRNA involvement in PCa with the long term perspective to introduce miRNA-based approaches as a novel strategy to withstand the disease, alone or in combination with the currently used therapies. Since the prelude to the development of miRNA-based therapies is the analysis of miRNA function in PCa initiation and progression, in this study, for the first time, we provide evidence of a putative tumor-suppressive role of miR-1272.
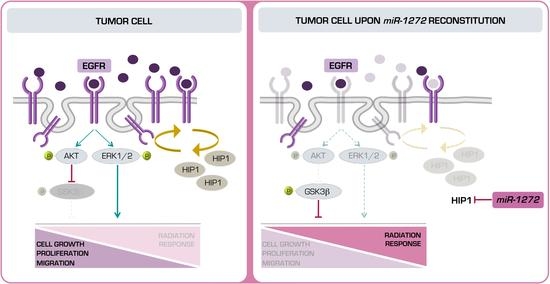
Specifically, we found that miR-1272 is down-modulated in PCa samples with respect to normal counterparts. In addition, we showed that, when restored in a couple of metastatic PCa cell lines, miR-1272 is able to hinder EMT, drastically reduce migration and invasion, limit cell growth and act as radiosensitizer by reducing the levels of Huntingtin Interacting Protein 1 (HIP1), whose overexpression has been associated with PCa and correlated with the severity of the disease.

2. Materials and Methods

2.1. Cell Culture

Established human PCa cell lines were purchased from American Type Culture Collection (ATCC, Rockville, MD, USA) and cultured in standard conditions. DU145 and 22Rv1 cells were cultured in RPMI-1640 medium (Lonza, Basel, Switzerland) supplemented with 10% FBS (Thermo Fisher Scientific Inc., Waltham, MA, USA). Cell lines were authenticated and periodically monitored by genetic profiling using short tandem repeat analysis (AmpFISTR Identifiler PCR amplification kit, Thermo Fisher Scientific Inc., Waltham, MA, USA). Cells were routinely checked for possible mycoplasma contamination through MycoAlert® Mycoplasma Detection Kit (Lonza, Basel, Switzerland).
Cell morphology was evaluated usually at day 3 after transfection using an Eclipse TE2000-S microscope (Nikon, Japan). Images were acquired by a Digital Camera DXM100F (Nikon, Japan).

2.2. Transfection

Cells were seeded at the density of 8000 cells/cm2 in culture vessels. Twenty-four hours later, medium was removed and cells were transfected with 20 nM mirVana miRNA mimic (miR-1272 MC13413, Thermo Fisher Scientific Inc., Waltham, MA, USA) or 30 nM siRNA (siHIP1, in sense format 5′-GGCUUAGGAUCGACAAGAA-3′, purchased from Eurofins MWG-Biotech, Ebesberg, Germany) for 4 h, using Optimem medium (Thermo Fisher Scientific Inc., Waltham, MA, USA) and Lipofectamine-2000 reagent (Thermo Fisher Scientific Inc., Waltham, MA, USA) according to the manufacturer’s protocol. A control mirVana miRNA mimic (miR-Neg mirVanaTM miRNA mimic Negative control #1, Thermo Fisher Scientific Inc., Waltham, MA, USA) and a control siRNA (siCtr, in sense format 5′-GCAUACAAUGGAGUUGUUA-3′, purchased from Eurofins MWG-Biotech, Ebesberg, Germany) with no homology to any known human mRNA were used for comparative analyses.

2.3. Cell Growth Evaluation

Cells were seeded in 6-well plates at the density of 4000 cells/cm2 and transfected with miRNA mimics or siRNAs 24 h later, as previously described. Daily, from day one to five, cells were detached and counted through a Coulter Counter (Beckman Coulter Life Sciences, Brea, CA, USA). Data were reported as cell percentage with respect to the number of miR-Neg or siCtr cells collected at day 1 (24 h). Cell doubling time of each cell line was calculated from growth curves of parental cells, as described in [16]. Staining for Ki-67 was determined by immunohistochemistry. Briefly, transfected cells were removed from dishes through scraper, formalix-fixed and paraffin-embedded. Some sections were then deparaffinised in xylene, rehydrated through graded alcohols to water, and subjected to immunohistochemical analysis using Ki-67 antibody (MIB-1, Dako; 1:200). Nuclei were counterstained with hematoxylin. Images were acquired by Nikon Eclipse E600 microscope using ACT-1 software (Nikon). At least 10 fields were scanned and the average number of Ki-67-positive and negative cells was plotted.

2.4. Apoptosis Analysis

Cell apoptosis was evaluated in terms of catalytic activity of Caspase-3 by using the APOPCYTO Caspase-3 Colorimetric Assay Kit (MBL International Corporation, Woburn, MA, USA), according to manufacturer’s protocol. Briefly, at 96 h after transfection, cells were detached, lysed and extracted proteins were incubated with the substrate N-acetylAsp-Glu-Val-Asp-AMC (DEVD-AMC). The hydrolysis of the proper substrate was evaluated through spectrofluorometry with 380-nm excitation and 460-nm emission filters by using POLARstar OPTIMA plate reader (BMG Labtech, Ortenberg, Germany). For terminal deoxynucleotidyl transferase dUTP nick end labeling (TUNEL) assay, transfected cells were fixed and treated by using the In Situ Cell Death Detection Kit (Roche) according to manufacturer’s instructions. The cells were subjected to FACS analysis (BD Accuri™ C6 Cytometer, Becton Dickinson, Basel CH) and data were reported in graph as the percentage of positive cells.

2.5. Migration and Invasion Assays

For migration and invasion assays, cells were cultured and transfected for 72 h as previously described and starved in serum-free medium for 24 h. Cells were transferred to the upper chamber of 24-well Transwell plates (Costar, Corning Incorporated, New York, NY, USA) in serum-free medium at a concentration of 120,000 cells/well. Medium supplemented with 10% of FBS was added to the lower chamber. After a 6 h-incubation at 37 °C, filters were fixed in 99% ethanol and stained with a 0.4% sulforhodamine B/1% acetic acid solution. Migrated cells were counted under a microscope. The same procedure was used for invasion assay, except that cells were seeded at 240,000 cells/well, Transwell chambers coated with 12.5 μg of Matrigel/well (BD Biosciences, San Jose, CA, USA), and samples processed after a 24 h-incubation.

2.6. Total RNA Extraction and RT-qPCR

RNA extraction and cDNA synthesis were performed as detailed in [17]. Briefly, RNA was isolated using QIAzol Lysis Reagent and miRNeasy Mini Kit (QIAGEN, Hilden, Germany) with DNase I digestion (QIAGEN, Hilden, Germany) according to the manufacturer’s instructions. cDNA was synthesized using High-Capacity cDNA Reverse Transcription kit (Thermo Fisher Scientific Inc., Waltham, MA, USA). For miRNA detection, TaqMan MicroRNA Reverse Transcription kit and sequence specific primers (Thermo Fisher Scientific Inc., Waltham, MA, USA) were used.
Quantification of gene or miRNA expression was assessed by RT-qPCR as widely described in [16] using No AmpErase TaqMan Universal PCR Master Mix (Thermo Fisher Scientific Inc., Waltham, MA, USA) and the specific TaqMan gene-expression assays (Thermo Fisher Scientific Inc., Waltham, MA, USA), as follows: miR-1272 (TaqMan® microRNA assay PN4427975), CDH1 (TaqMan® gene expression assay Hs00170423_m1), CTNNB1 (TaqMan® gene expression assay Hs00355045_m1), VIM (TaqMan® gene expression assay Hs00185584_m1). For comparative analyses, GAPDH (PN4326317E) and RNU48 (TaqMan® microRNA assay PN4440887) were used as endogenous controls for genes and miRNA, respectively. RT-qPCR results were reported as −ddCt or relative quantity (RQ = 2−ddCt) with respect to a calibrator sample using the comparative Ct (ddCt) method.

2.7. Gene Expression and Bioinformatic Analyses

Transcriptomic profile of DU145 cells transfected with miR-1272 synthetic mimic and those transfected with mock molecule (miR-Neg) were collected in triplicate from scanned images using Illumina BeadStudio v3.3.8 (Illumina) and processed using the lumi package [18] from Bioconductor v3.0 [19]. Raw data were log2-transformed, normalized with Robust Spline Normalization and filtered, keeping only probes with a detection p-value < 0.01 in at least one sample and probes not associated to official gene symbol were removed. Expression data were deposited in the Gene Expression Omnibus repository (GEO) with accession number GSE68883.
Differentially expressed genes between the two conditions were identified using the limma package [20], and significance was assessed by Benjamini–Hochberg false discovery rate (FDR) method in order to take into account the multiple-testing correction. Genes showing an FDR < 0.05 were considered significantly differentially expressed. Selecting only significantly up (fold change, FC > 0) and down regulated (FC < 0) genes an overrepresentation analysis was performed using WebGestalt on-line available tool [21]. Only enrichment with an FDR above 0.05 was considered significant.
miRNA expression data of tumor and non-neoplastic prostate samples from PCa patients were retrieved from GEO repository with accession number GSE76260, in the form of normalized data matrix.

2.8. In Silico miR-1272 Target Prediction

Prediction of miR-1272 target genes was accomplished using miRWalk (http://mirwalk.umm.uni-heidelberg.de/) and MtiBase online tools. The former solely contains in silico predictions from several target-prediction databases while the latter also includes information from experimental data such as ultraviolet cross-linking and immunoprecipitation (CLIP), microarray and RNA sequencing, ribosome-protected fragment sequencing and pulse stable isotope labelling with amino acids in culture (pSILAC) [22]. For miRWalk analysis, target genes were selected as those predicted by at least one database, while for MtiBase at least two prediction databases were considered in association with at least three supporting experiments.

2.9. Protein Extraction, Cytoplasmic/Membrane Fractionation and Western Blotting

Total protein extraction and immunoblotting experiments were performed as fully detailed in [16]. In this work the following antibodies were used: AKT (cs9272, Cell Signaling Technologies®, Danvers, MA, USA; 1:1000), β-catenin (sc59891, Santa Cruz Biotechnology, Santa Cruz, CA, USA; 1:200), β-tubulin (ab6160, abcam®, Cambridge, UK; 1:500), Caveolin-1 (610406, BD Biosciences, San Jose, CA, USA; 1:500), Cleaved PARP (cs9541, Cell Signaling Technologies®, Danvers, MA, USA; 1:1000), E-cadherin (sc7870, Santa Cruz Biotechnology, Santa Cruz, CA, USA; 1:500), EGFR (sc03, Santa Cruz Biotechnology, Santa Cruz, CA, USA; 1:200), ERK1/2 (ab17942, abcam®, Cambridge, UK; 1:1000), GSK3β (sc9166, Santa Cruz Biotechnology, Santa Cruz, CA, USA; 1:200), HIP1 (MA1-16747, Thermo Fisher Scientific Inc., Waltham, MA, USA; 1:500), PARP (cs9542, Cell Signaling Technologies®, Danvers, MA, USA; 1:1000), p-AKT (ab27773, abcam®, Cambridge, UK; 1:500), p-ERK1/2 (cs9101, Cell Signaling Technologies®, Danvers, MA, USA; 1:1000), p-GSK3β (S9, R&D System, Minneapolis, MN, USA; 1:1000), Slug (cs9585, Cell Signaling Technologies®, Danvers, MA, USA; 1:1000), Vimentin (sc32322, Santa Cruz Biotechnology, Santa Cruz, CA, USA; 1:200), Vinculin (V9131, Sigma-Aldrich, St. Louis, MO, USA; 1:5000).
For cytoplasmic/membrane protein separation, the Subcellular Proteins Fractionation Kit for Cultured Cells (Thermo Fisher Scientific Inc., Waltham, MA, USA) was used according to manufacturer’s protocol. Briefly, cultured cells were harvested, treated with buffers to selectively fractionate proteins from cytoplasm (cytoplasmic extraction buffer) and membrane (membrane extraction buffer), and properly centrifuged to enhance protein separation. Immunoblotting experiments were performed as for total proteins.
Quantification of all western blots has been reported in Supplementary Figure S1.

2.10. Immunofluorescence

Transfected cells grown for 72 h on μ-Slides 8 Well coverlips (ibidi®) were fixed with 4% formaldehyde and permeabilised with cold 70% ethanol. Cells were probed for 1 h with primary antibodies as follows: β-catenin (ab2982, abcam®, Cambridge, UK), β-tubulin (ab6046, abcam®, Cambridge, UK) and E-cadherin (ab1416, abcam®, Cambridge, UK); and subsequently with Alexa Fluor448-labeled or Alexa Fluor594-labeled secondary antibodies (Thermo Fisher Scientific Inc., Waltham, MA, USA) for 1 h at room temperature. Nuclei were counterstained with DAPI (ab104139, abcam®, Cambridge, UK; 1:15,000). Images were acquired by Nikon Eclipse E600 microscope using ACT-1 software (Nikon) and processed with ImageJ.

2.11. In Vivo Experiments

Experimental protocols were approved by the Ethics Committee for Animal Experimentation of Fondazione IRCCS Istituto Nazionale dei Tumori, and by the Italian Healthy Ministry (project identification code: 1120/2015-PR. Date of approval: 22nd October 2015). Ten million miR-Neg or miR-1272 DU145 cells were subcutaneously injected into the right flank of eight-week-old male SCID mice (Charles River, Calco, Italy). Each group contained ten mice. Animals were maintained under standard light and temperature conditions and had free access to food and water. Tumor growth was determined by measurement of tumor size with a Vernier caliper.

2.12. Irradiation Experiments

Irradiation experiments on DU145 cells transfected with miR-Neg or miR-1272 were performed as in El Bezawy et al. [14]. At day 10 after irradiation, colonies were fixed, stained and counted. The colony-forming efficiency was calculated as the ratio of the number of colonies (consisting of at least 50 cells) to the number of single cells seeded. The surviving fraction was calculated as the ratio of the colony-forming efficiency of the irradiated sample to that of the non-irradiated one. Triplicate wells were set up for each condition. Data are reported as a linear-quadratic equation, which has been well established to be a suitable model for the description of cell death upon irradiation [23].

2.13. Statistical Analyses

If not otherwise specified, data are presented as mean values +/± SD from at least three independent experiments. Statistical analysis was performed by two-tailed Student’s t test except for in vivo experiment where Mann–Whitney U test was applied. p-values < 0.05 were considered statistically significant.

3. Results

3.1. miR-1272 Reverts the Mesenchymal Phenotype and Affects the Migratory and Invasive Properties of PCa Cells

By analyzing miRNA expression profiles of prostate clinical samples (GSE76260), we observed that miR-1272 was significantly down-regulated (FC = −1.34) in 28 tumors compared to 32 normal prostate tissues (both obtained from radical prostatectomies) (Figure 1A, left). In the subset of patients (n = 26) with available matched tumor/normal specimens, 85% of cases were characterized by appreciable reduction of miR-1272 expression levels in cancer tissue compared to the non-neoplastic counterpart (Figure 1A, right).
To investigate the significance of miR-1272 down-regulation in PCa, we primarily performed in vitro gain-of-function experiments in two PCa cell lines (DU145 and 22Rv1) that express only barely detectable miR-1272 (Ct > 30) (Figure 1B), consistent with the data obtained on patients’ specimens. When orthotopically injected, DU145 cells have the ability to form metstatic nodes in the peritoneal surface and diaphragm [24]. Expression of miR-1272 was efficaciously restored in both cell lines using a synthetic mimic (miR-1272), as compared to cells transfected with a negative molecule (miR-Neg) (Figure 1B).
The most evident phenotypic alteration upon miR-1272 supplementation was a marked morphological change, consisting of an increase of cell size together with loss of typically mesenchymal morphological features and the acquisition of a more epithelial aspect (Figure 1C). Specifically, miR-1272 DU145 cells showed a decrease in the fraction of spindle-like cells and a parallel increase in that of enlarged, polygonal shaped and flattened cells with poorly defined profiles (Figure 1C, top). In miR-1272 22Rv1 cells, we observed the formation of syncytium-like structures, which made cell profiles almost indiscernible, indicating that cells tended to aggregate in tightly packed structures probably due to enhanced cell-cell adhesion (Figure 1C, bottom). Moreover, β-tubulin staining highlighted cytoskeletal redistribution: in miR-Neg DU145 cells, microtubules were oriented parallelly to the cortex, whereas they displayed a radial pattern of organization in miR-1272 DU145 cells (Figure 1D, top); in the 22Rv1 model, the filopodia and lamellipodia staining of miR-Neg cells was lost in the tightly embedded miR-1272 cells (Figure 1D, bottom). In addition, E-cadherin and β-catenin (which stabilizes E-cadherin complex) showed a strong co-localization at the cell membrane in miR-1272 compared to miR-Neg cells (Figure 1E), in both PCa models. Altogether, these changes comply with the evidence that miR-1272 restoration can induce a transition from a mesenchymal-like toward a more epithelial-like phenotype, as supported by the over-expression of the epithelial markers (E-cadherin and β-catenin) and the down-modulation of the mesenchymal ones (vimentin and slug) at mRNA and/or protein levels (Figure 1F,G). Coherent with the reversion of the mesenchymal phenotype, miR-1272 cells showed significantly impaired migratory (Figure 1H, top) and invasive (Figure 1H, bottom) capabilities compared to miR-Neg cells, suggesting the involvement of miR-1272 loss in the initial phases of the metastatic process, specifically EMT, migration and invasion.

3.2. miR-1272 Reduces the Growth of PCa Cell Lines Both In Vitro and In Vivo

Aside from miR-1272 capability to revert EMT, we noticed that miR-1272-transfected cells were markedly reduced in number when compared to the miR-Neg-transfected counterpart. Through daily evaluation from one day after the transfection until five days, we found that miR-1272 cell number increased more slowly than that of miR-Neg cells in both PCa models, though statistically significant differences could be appreciated in 22Rv1 cells only at the end of the experiment (Figure 2A). Consistent with this, miR-1272 reduced the number of Ki-67-positive cells in both cell lines, although at a different extent, which is indicative of a reduced proportion of actively proliferating cells (Supplementary Figure S2A). We asked whether such cell number reduction could be attributed to apoptosis induction. In this regard, we found a significant increase in the catalytic activity of Caspase-3 in both miR-1272 over-expressing PCa models at 96 h after transfection (Figure 2B), as well as augmented cleavage of PARP, which commands the down-stream activation of the apoptotic process (Figure 2C). Consistent with this, TUNEL assay showed increased number of apoptotic cells in miR-1272 transfectants in both cell lines (Supplementary Figure S2B). We reasoned that the latency between apoptosis induction (four days) and evidence of significantly reduced cell number (five days) in 22Rv1 cells may depend on the longer doubling time of these cells as compared to DU145 cells (doubling time of 39.39 vs. 29.96).
Moreover, to elucidate the behavior of miR-1272-reconstituted cells in the in vivo context, we subcutaneously injected miR-1272 or miR-Neg DU145 cells in the flank of male SCID mice. To ensure that injected cells could express miR-1272 for sufficient time to impact on xenograft take and growth, we had preliminarily verified in vitro that miR-1272 DU145 cells maintained significantly higher miRNA levels than miR-Neg cells for at least 14 days (Figure 2D). In line with in vitro cell growth data, miR-1272 supplementation resulted in a slower tumor growth in vivo, though not affecting xenograft take. At day 23 after cell injection, miR-1272 was still about 200-fold more expressed in miR-1272 xenografts as compared to miR-Neg ones (Figure 2F). As a whole, these results provide evidence about the putative involvement of miR-1272 in the impairment of PCa cell growth, which at least in part relies on the induction of apoptotic cell death.

3.3. HIP1 Is a Functional Target of miR-1272

To start understanding the mechanisms underlying the tumor-suppressive role of miR-1272 in PCa, gene expression profiles of DU145 cells transfected with miR-1272 mimic were comparatively evaluated to those of miR-Neg cells on a microarray platform. Differential expression analysis (FDR < 0.05) revealed 1804 and 1873 genes respectively up- and down-regulated in miR-1272 cells (Figure 3A). Over-representation analysis performed on such genes revealed a significant enrichment in “membrane trafficking” (FDR = 6.71 × 10⁻³) and “vescicle-mediated transport” (FDR = 2.63 × 10⁻²) annotations of REACTOME and in “endocytosis” (FDR = 3.57 × 10⁻³) annotations of KEGG pathway collections (Figure 3B).
In search for potential miR-1272 direct targets, down-regulated genes were crossed with the lists of predicted targets from miRWalk and MtiBase tools. The latter associates in silico predictions (obtained from five different miRNA target prediction tools) to experimental data from CLIP-Seq and technical validations. Overall, the resulting intersection included 14 candidate genes (Figure 3C), which are listed in Table 1 and plotted in Figure 3D.
The most significantly down-modulated target gene with the highest number of experimental validations resulted to be HIP1. One site complementary to miR-1272 seed is actually evident in position from 450 to 456 of HIP1 3′ UTR (Figure 3E, top). Notably, such sequence revealed to be conserved through vertebrates with PhyloP and PhastCons scores comparable to those of HIP1 last coding exon (Figure 3E, bottom). Intriguingly, HIP1 has been found significantly over-expressed in PCa [25] and reported to be involved in the down-modulation of several membrane receptors associated with a more aggressive behavior in a broad spectrum of human epithelial cancers [26]. Functionally, HIP1 regulates membrane trafficking by controlling the correct turn-over of membrane receptors and their resulting endocytosis and/or degradation [27]. Altogether these aspects prompted us to validate HIP1 as a potential miR-1272 target. In this regard, we confirmed repression of HIP1 at both mRNA (Figure 3F) and protein (Figure 3G) level in both miR-1272-transfected DU145 (consistent with gene expression data) and 22Rv1 cell lines.
To corroborate our hypothesis, we adopted a phenocopy strategy by using a specific siRNA against HIP1 (hereafter siHIP1). Primarily, we tested the efficacy of the siHIP1, which revealed to markedly down-modulate HIP1 at mRNA (Figure 3H) and, consequently, at protein level (Figure 3I). RNAi-mediated HIP1 knock-down was able to recapitulate several aspects of miR-1272 reconstituted phenotype. Specifically, morphological changes occurring in PCa cells depleted for the expression of HIP1 paralleled those of cells restored for miR-1272, in terms of appearance of more enlarged and tightly embedded cells (Figure 3J) as well as cytoskeletal re-organization (Figure 3K). HIP1-silenced cells also showed a significantly decreased cell growth (Figure 3L), which was appreciable starting from 72 h upon siRNA transfection in both PCa models, although to a different extent, in line with the effect produced by miR-1272 supplementation.
Overall, this evidence supports the hypothesis that at least part of miR-1272 tumor-suppressive effects are maybe ascribable to its ability to directly repress HIP1.

3.4. miR-1272 Affects EGFR/AKT/ERK Signaling and Increases Ionizing Radiation Response

HIP1 over-expression is often associated with a general unbalanced membrane receptor trafficking [26]. This aberration has been shown to promote tumor formation and lead to the amplification of the downstream signaling of growth factor receptors, among which is Epidermal Growth Factor Receptor (EGFR) [26]. In this regard, we evaluated EGFR membrane levels upon miR-1272 supplementation and observed that they were reduced in both miR-1272 PCa models (Figure 4A, Supplementary Figure S3A). Total EGFR amount was significantly down-modulated at protein level in both miR-1272 transfected PCa cell models (Figure 4B), suggesting a putative involvement of HIP1 in regulating EGFR protein turnover. Additionally, the EGFR/AKT/ERK axis (known to be involved in the regulation of cell growth, EMT and metastasis [27]) was found to be affected in miR-1272-restored cells (Figure 4B, Supplementary Figures S1H and S3B). Specifically, in DU145 cells, a feeble reduction of AKT expression was accompanied by a marked down-modulation of its active form, p-AKT, which in turn, could not act on its targets. Consistently, in miR-1272 cells we found lower levels of p-GSK3β, which is the inactive form of the pro-apoptotic protein GSK3β (Figure 4B). In parallel, ERK1/2 were found to be markedly reduced in their active phosphorylated forms in both DU145 and 22Rv1 cells, though in the latter model no major alterations of other components of AKT/GSK3β axis were observed (Figure 4B, Supplementary Figures S1H and S3B).
Given that radiotherapy represents one of the main treatment choices for organ-confined PCa, and based on the emerging evidence indicating miRNA involvement in EGFR-mediated radiosensitization in PCa models [14,15], we investigated whether miR-1272 supplementation could modify the sensitivity of DU145 cells to ionizing radiation. We found that miR-1272 was actually able to radiosensitize PCa cells, as suggested by the consistent reduction of clonogenic cell survival of miR-1272-reconstituted DU145 cells upon irradiation, as compared to miR-Neg cells (Figure 4C). Consistent with the evidence that HIP1 is a functional target of miR-1272, HIP1 silencing by siRNA phenocopied the increased radiosensitivity of miR-1272-transfected cells (Figure 4D).
Altogether these results let us to speculate about the tumor-suppressive role of miR-1272 in PCa context, by acting (albeit in a cell-model-dependent manner) mainly on EGFR turnover/membrane exposition, and subsequently on EGFR downstream pathways controlling cell growth, apoptosis, EMT and radiation response.

4. Discussion

Compelling evidence about the involvement of endocytic proteins in cancer initiation and progression has emerged recently [26]. However, the exact mechanism by which a disrupted regulation of the endocytic pathway may lead a normal cell to become cancerous is still completely unclear [26]. Several proteins are involved in endocytosis/clathrin-mediated pathways and in turn copious membrane-protein (e.g., growth factor receptors) turn-over is finely regulated by these mechanisms. In this regard, an impaired/unbalanced receptor-trafficking mediated by endocytosis has been associated to cell transformation and cancer [26].
Chiefly, HIP1, a cofactor in clathrin-mediated vescicle trafficking, was firstly found to be implicated in cancer as part of a chromosomal translocation in patients with chronic myelomonocytic leukemia [28]. Other studies revealed HIP1 to be deregulated in several human solid tumors [26]. Particularly, HIP1 expression was demonstrated to be more elevated in prostate and colon cancers with respect to their normal counterparts. In addition, HIP1 expression increased in parallel with PCa progression up to metastasis. Consistent with this evidence, primary prostate tumors lacking HIP1 expression were characterized by reduced frequency of disease progression, in terms of biochemical relapse, after radical prostatectomy [26]. Altogether, these findings suggested HIP1 as a putative prognostic biomarker and therapeutic target for PCa management [26].
Different layers of regulation may impact on HIP1 expression. In the last decades, miRNAs have gained increasing respect as regulators of various biological processes [29]. Hence, aberrant miRNA expression has been causatively associated with the pathogenesis of several diseases, including cancer [7]. Depending on the cellular context and the functions of their targets, miRNAs may act as oncomirs or tumor-suppressors. Generally, the down-modulation of a tumor-suppressor miRNA capable of controlling the expression of an oncogene may result in deregulated over-expression of the target, thus contributing to tumor development and progression [30]. Several tumor-suppressive miRNAs have been identified in PCa context, and their role clarified through functional studies. However, the function of miR-1272 in PCa, and in human cancer in general, has not been explored so far. Here, we show that miR-1272 is downregulated in PCa compared to adjacent normal tissue. The reconstitution of miR-1272 expression in PCa cells, inherently expressing negligible levels of the miRNA, resulted in a marked abrogation of its predicted target HIP1. Notably, the results of 6 Ago-CLIP sequencing experiments collected in Mtibase (Table 1) confirmed that miR-1272 binding site within HIP1 3′UTR is not merely predicted in silico but is also physically bound by Ago proteins within RNA-induced silencing complex. Such evidence confirms the functional repression of HIP1 by miR-1272, though not relying on the conventional luciferase reporter assays. Our results pave the way for future studies aimed at verifying whether pathological loss of miR-1272 in normal cells may lead to HIP1 over-expression, which in turn may dysregulate the endocytic pathway, ultimately disrupting signalling pathways that control growth, survival and migration.
Aberrant endocytic turnover may lead to the amplification of signal transduction cascades mediated by a sustained activation of growth factor receptors (e.g., EGFR). The upregulation of EGFR signalling has been widely associated with more aggressive behaviour in several human cancers [31]. In addition, in the context of PCa, the acquisition of a hormone-refractory state was suggested to be related to an excessive activation of the EGFR axis and the downstream pathways, including PI3K-AKT and ERK, thus impinging on several tumor traits [32]. In our PCa models, miR-1272 supplementation significantly reduced EGFR membrane exposition, presumably as a consequence of the restored correct receptor turn-over. Interestingly, such phenotype was recapitulated by the direct silencing of HIP1. MiR-1272-mediated impairment of EGFR signalling resulted in reduced activation of ERK1/2 and AKT-GSK3β axes, which ultimately led to reduced cell growth and migration, respectively. Similar results were reported in the context of fibroblast-like synoviocyte models of rheumatoid arthritis, one of the most common autoimmune diseases, where HIP1 expression was shown to be required for receptor tyrosine kinase (RTK) stabilization on the cell surface. In this regard, HIP1 abrogation was able to reduce fibroblast-like synoviocyte invasion proficiency by interfering with lamellipodia formation and cytoskeletal re-organization, a phenotype sustained by the deregulation of ERK1/2 signalling upon HIP1 silencing [33]. Again, during angiogenesis (i.e., the formation of new blood vessels from the pre-existing ones) for tissue repair in various pathological conditions such as ischemic cardiovascular events, endothelial cells are stimulated by VEGF to proliferate and migrate. In this context, miR-135a-3p was shown to be able to impair p38 signalling in response to VEGF stimulation through the suppression of HIP1. In addition, endothelial cell growth and migration resulted severely affected upon miR-135a-3p restoration [34]. Hence, the disruption of membrane receptor turn-over mediated by HIP1 shows comparable phenotypes and involves similar pathways in completely different settings. In the context of Huntington Disease (HD), another epigenetic regulator of HIP1 and of other HD-related factors is miR-128a [35]. The same miRNA was identified upon an integrative analysis of proteomic changes during PCa progression. The proteomic signature revealed the involvement of miR-128a (and miR-128b) in regulating the transition from organ-confined disease to metastasis. Precisely, miR-128 levels were reduced in invasive PCa compared to benign prostate epithelial, and miR-128 overexpression was able to attenuate invasion of PCa cells [36]. Comprehensively, miRNAs capable (or supposed) to target HIP1 were demonstrated to impair/affect migration and invasion, the prelude of which (in epithelial tumors) is EMT.
In this study, we elucidated the role of miR-1272 as repressor of EMT process. Aside from being a crucial step for the metastatic dissemination, which represents the main cause of death in PCa patients, EMT was reported as related to radioresistance in several tumors [37]. In PCa context, radiation therapy represents a standard of care whereas radiation resistance remains the main obstacle for long-term treatment efficacy. In fact, upon radiation, cancer cells activate several different pathways to overcome cytotoxic effects of treatment. In breast cancer, ionizing radiation was found to enable HER RTKs and the downstream pathways such as AKT and ERK1/2 [38]. The pro-survival effects mediated by the aforementioned pathways are related to the abolishment of the apoptotic stimuli and, concurrently, to the induction of cell cycle checkpoint response and DNA repair. In this regard, similar mechanisms of miRNA-mediated radiosensitization through RTKs have been recently described in PCa models. Primarily, miR-205, the role of which elicits great interest in PCa, was demonstrated to be involved in regulating EGFR nuclear-translocation, a mechanism known to control ionizing radiation response, by targeting PKCε [14]. In addition, in both prostate and breast cancers, miR-205 revealed to be capable to enhance radiation response by targeting ZEB1, a well-established EMT inhibitor [14,15,16,17,18,19,20,21,22,23,24,25,26,27,28,29,30,31,32,33,34,35,36,37,38,39]. Similarly, another miRNA, miR-875-5p, was found to radiosensitize PCa cells by targeting EGFR and thereby reducing receptor nuclear-translocation [15]. Altogether, these findings suggest that the complex network existing between miRNAs, EGFR, ERK1/2 axis and EMT process is involved in radioresistance. Here, we proved, for the first time, the radiosensitizing effect of miR-1272 in PCa, and showed that this effect is at least in part mediated by HIP1 suppression.
Overall, a putative therapeutic approach based on miR-1272 reconstitution in association with ionizing radiation may improve PCa response to conventional radiotherapy, as we showed that miR-1272 can reduce the activity of EGFR/AKT/ERK1-2 pathways, known to be triggered as pro-survival signals upon irradiation. A potential clinical interest for miR-1272 may also lie on its ability to affect cell growth and EMT. In this regard, a miR-1272-based therapy in an organ-confined PCa context may primarily represent a suitable strategy to reduce tumor growth and enhance response to radiotherapy. Additionally, miR-1272 may also prevent EMT, the first step of metastatic cascade. Prerequisite to the development of any miR-1272-based therapeutic approach would be the setting up of miRNA mimic delivery strategies streamlined for efficiency and specificity of prostate targeting.

Supplementary Materials

The following are available online at https://www.mdpi.com/2073-4409/9/2/435/s1, Figure S1: The figure reports quantification of all western blots. Densitometry data are reported as raw normalized values (arbitrary units) towards the loading control of each blot. Figure S2: Plots indicating the percentages of (A) Ki-67-positive and negative cells and (B) TUNEL-positive cells in miR-Neg and miR-1272-transfected DU145 and 22Rv1 cells, Figure S3: (A) Representative immunoblotting showing protein levels of cytoplasmic and membrane-associated EGFR in miR-Neg and miR-1272-transfected 22Rv1 cells. β-tubulin and E-cadherin were used as controls for cytoplasm/membrane fractionation. (B) Representative immunoblotting showing protein levels of EGFR/AKT/GSK3β/ERK pathway members in miR-Neg and miR-1272-transfected 22Rv1 cells. Vinculin was used as endogenous control.

Author Contributions

Conceptualization, P.G. and N.Z.; investigation, F.R., D.C., R.E.B., V.D., M.T., V.Z. and P.G.; data curation and formal analysis, S.P. and P.G.; resources, R.V., P.G. and N.Z.; supervision, P.G. and N.Z.; visualization, F.R., R.E.B., V.D. and P.G.; writing—original draft, F.R. and P.G.; writing—review and editing, R.E.B., V.D., P.G. and N.Z.; funding acquisition, P.G. and N.Z. All authors have read and agreed to the published version of the manuscript.

Funding

This research was funded by AIRC, grant number 11542 (P.G.) and 15191 (N.Z.), and by I. Monzino Foundation (N.Z.).

Acknowledgments

We thank the Platform of Integrated Biology of Fondazione IRCCS Istituto Nazionale dei Tumori for microarray experiments and Valentina Profumo for helping in the initial steps of the work.

Conflicts of Interest

The authors declare no conflict of interest.The funders had no role in the design of the study; in the collection, analyses, or interpretation of data; in the writing of the manuscript, or in the decision to publish the results.

References

  1. Ferlay, J.; Steliarova-Foucher, E.; Lortet-Tieulent, J.; Rosso, S.; Coebergh, J.W.; Comber, H.; Forman, D.; Bray, F. Cancer incidence and mortality patterns in Europe: Estimates for 40 countries in 2012. Eur. J. Cancer 2013, 49, 1374–1403. [Google Scholar] [CrossRef] [Green Version]
  2. Siegel, R.L.; Miller, K.D.; Jemal, A. Cancer statistics, 2019. CA Cancer J. Clin. 2019, 69, 7–34. [Google Scholar] [CrossRef] [Green Version]
  3. Mottet, N.; Bellmunt, J.; Bolla, M.; Briers, E.; Cumberbatch, M.G.; De Santis, M.; Fossati, N.; Gross, T.; Henry, A.M.; Joniau, S.; et al. EAU-ESTRO-SIOG Guidelines on Prostate Cancer. Part 1: Screening, Diagnosis, and Local Treatment with Curative Intent. Eur. Urol. 2017, 71, 618–629. [Google Scholar] [CrossRef] [PubMed]
  4. Cornford, P.; Bellmunt, J.; Bolla, M.; Briers, E.; De Santis, M.; Gross, T.; Henry, A.M.; Joniau, S.; Lam, T.B.; Mason, M.D.; et al. EAU-ESTRO-SIOG Guidelines on Prostate Cancer. Part II: Treatment of Relapsing, Metastatic, and Castration-Resistant Prostate Cancer. Eur. Urol. 2017, 71, 630–642. [Google Scholar] [CrossRef] [PubMed]
  5. Krol, J.; Loedige, I.; Filipowicz, W. The widespread regulation of microRNA biogenesis, function and decay. Nat. Rev. Genet. 2010, 11, 597–610. [Google Scholar] [CrossRef] [PubMed]
  6. Hesse, M.; Arenz, C. MicroRNA maturation and human disease. Methods Mol. Biol. 2014, 1095, 11–25. [Google Scholar] [PubMed]
  7. Lee, Y.S.; Dutta, A. MicroRNAs in cancer. Annu. Rev. Pathol. 2009, 4, 199–227. [Google Scholar] [CrossRef] [PubMed]
  8. Profumo, V.; Doldi, V.; Gandellini, P.; Zaffaroni, N. Targeting microRNAs to withstand cancer metastasis. Methods Mol. Biol. 2015, 1218, 415–437. [Google Scholar]
  9. Sur, S.; Steele, R.; Shi, X.; Ray, R.B. miRNA-29b Inhibits Prostate Tumor Growth and Induces Apoptosis by Increasing Bim Expression. Cells 2019, 8, 1455. [Google Scholar] [CrossRef] [Green Version]
  10. Mu, H.Q.; He, Y.H.; Wang, S.B.; Yang, S.; Wang, Y.J.; Nan, C.J.; Bao, Y.F.; Xie, Q.P.; Chen, Y.H. MiR-130b/TNFα/NF-κB/VEGFA loop inhibits prostate cancer angiogenesis. Clin. Transl. Oncol. 2020, 22, 111–121. [Google Scholar] [CrossRef]
  11. Gandellini, P.; Folini, M.; Longoni, N.; Pennati, M.; Binda, M.; Colecchia, M.; Salvioni, R.; Supino, R.; Moretti, R.; Limonta, P.; et al. miR-205 Exerts tumor-suppressive functions in human prostate through down-regulation of protein kinase Cepsilon. Cancer Res. 2009, 69, 2287–2295. [Google Scholar] [CrossRef] [Green Version]
  12. Gandellini, P.; Profumo, V.; Casamichele, A.; Fenderico, N.; Borrelli, S.; Petrovich, G.; Santilli, G.; Callari, M.; Colecchia, M.; Pozzi, S.; et al. miR-205 regulates basement membrane deposition in human prostate: Implications for cancer development. Cell Death Differ. 2012, 19, 1750–1760. [Google Scholar] [CrossRef] [PubMed] [Green Version]
  13. Nantajit, D.; Lin, D.; Li, J.J. The network of epithelial-mesenchymal transition: Potential new targets for tumor resistance. J. Cancer Res. Clin. Oncol. 2015, 141, 1697–1713. [Google Scholar] [CrossRef] [PubMed] [Green Version]
  14. El Bezawy, R.; Tinelli, S.; Tortoreto, M.; Doldi, V.; Zuco, V.; Folini, M.; Stucchi, C.; Rancati, T.; Valdagni, R.; Gandellini, P.; et al. miR-205 enhances radiation sensitivity of prostate cancer cells by impairing DNA damage repair through PKCε and ZEB1 inhibition. J. Exp. Clin. Cancer Res. 2019, 38, 51. [Google Scholar] [CrossRef]
  15. El Bezawy, R.; Cominetti, D.; Fenderico, N.; Zuco, V.; Beretta, G.L.; Dugo, M.; Arrighetti, N.; Stucchi, C.; Rancati, T.; Valdagni, R.; et al. miR-875-5p counteracts epithelial-to-mesenchymal transition and enhances radiation response in prostate cancer through repression of the EGFR-ZEB1 axis. Cancer Lett. 2017, 395, 53–62. [Google Scholar] [CrossRef]
  16. Doubling Time Computing. Available online: http://www.douling-time.com/compute.php (accessed on 28 November 2019).
  17. Profumo, V.; Forte, B.; Percio, S.; Rotundo, F.; Doldi, V.; Ferrari, E.; Fenderico, N.; Dugo, M.; Romagnoli, D.; Benelli, M.; et al. LEADeR role of miR-205 host gene as long noncoding RNA in prostate basal cell differentiation. Nat. Commun. 2019, 10, 307. [Google Scholar] [CrossRef] [Green Version]
  18. Du, P.; Kibbe, W.A.; Lin, S.M. lumi: A pipeline for processing Illumina microarray. Bioinformatics 2008, 24, 1547–1548. [Google Scholar] [CrossRef] [Green Version]
  19. Gentleman, R.C.; Carey, V.J.; Bates, D.M.; Bolstad, B.; Dettling, M.; Dudoit, S. Bioconductor: Open software development for computational biology and bioinformatics. Genome Biol. 2004, 5, R80. [Google Scholar] [CrossRef] [Green Version]
  20. Smyth, G.K. Linear models and empirical bayes methods for assessing differential expression in microarray experiments. Stat. Appl. Genet. Mol. Biol. 2004, 3, 1–25. [Google Scholar] [CrossRef]
  21. Wang, J.; Vasaikar, S.; Shi, Z.; Greer, M.; Zhang, B. WebGestalt 2017: A more comprehensive, powerful, flexible and interactive gene set enrichment analysis toolkit. Nucleic Acids Res. 2017, 45, W130–W137. [Google Scholar] [CrossRef]
  22. Guo, Z.W.; Xie, C.; Yang, J.R.; Li, J.H.; Yang, J.H.; Zheng, L. MtiBase: A database for decoding microRNA target sites located within CDS and 5′UTR regions from CLIP-Seq and expression profile datasets. Database 2015, 2015, bav102. [Google Scholar] [CrossRef] [PubMed] [Green Version]
  23. Bodgi, L.; Canet, A.; Pujo-Menjouet, L.; Lesne, A.; Victor, J.M.; Foray, N. Mathematical models of radiation action on living cells: From the target theory to the modern approaches. A historical and critical review. J. Theor. Biol. 2016, 394, 93–101. [Google Scholar] [CrossRef] [PubMed]
  24. Gravina, G.L.; Tortoreto, M.; Mancini, A.; Addis, A.; Di Cesare, E.; Lenzi, A.; Landesman, Y.; McCauley, D.; Kauffman, M.; Shacham, S.; et al. XPO1/CRM1-selective inhibitors of nuclear export (SINE) reduce tumor spreading and improve overall survival in preclinical models of prostate cancer (PCa). J. Hematol. Oncol. 2014, 7, 46. [Google Scholar] [CrossRef] [PubMed] [Green Version]
  25. Rao, D.S.; Hyun, T.S.; Kumar, P.D.; Mizukami, I.F.; Rubin, M.A.; Lucas, P.C. Huntingtin-interacting protein 1 is overexpressed in prostate and colon cancer and is critical for cellular survival. J. Clin. Investig. 2002, 110, 351–360. [Google Scholar] [CrossRef] [PubMed]
  26. Hyun, T.S.; Ross, T.S. HIP1: Trafficking roles and regulation of tumorigenesis. Trends Mol. Med. 2004, 10, 194–199. [Google Scholar] [CrossRef]
  27. Wang, Z. ErbB Receptors and Cancer. Methods Mol. Biol. 2017, 1652, 3–35. [Google Scholar]
  28. Ross, T.S.; Bernard, O.A.; Berger, R.; Gilliland, D.G. Fusion of Huntingtin interacting protein 1 to platelet-derived growth factor beta receptor (PDGFbetaR) in chronic myelomonocytic leukemia with t(5;7)(q33;q11.2). Blood 1998, 91, 4419–4426. [Google Scholar] [CrossRef]
  29. Bartel, D.P. Metazoan MicroRNAs. Cell 2018, 173, 20–51. [Google Scholar] [CrossRef]
  30. Calin, G.A.; Croce, C.M. MicroRNA signatures in human cancers. Nat. Rev. Cancer 2006, 6, 857–866. [Google Scholar] [CrossRef]
  31. Mendelsohn, J.; Baselga, J. Status of epidermal growth factor receptor antagonists in the biology and treatment of cancer. Am. J. Clin. Oncol. 2003, 21, 2787–2799. [Google Scholar] [CrossRef]
  32. Traish, A.M.; Morgentaler, A. Epidermal growth factor receptor expression escapes androgen regulation in prostate cancer: A potential molecular switch for tumour growth. Br. J. Cancer. 2009, 101, 1949–1956. [Google Scholar] [CrossRef] [PubMed] [Green Version]
  33. Laragione, T.; Brenner, M.; Lahiri, A.; Gao, E.; Harris, C.; Gulko, P.S. Huntingtin-interacting protein 1 (HIP1) regulates arthritis severity and synovial fibroblast invasiveness by altering PDGFR and Rac1 signalling. Ann. Rheum. Dis. 2018, 77, 1627–1635. [Google Scholar] [CrossRef]
  34. Icli, B.; Wu, W.; Ozdemir, D.; Li, H.; Haemmig, S.; Liu, X.; Giatsidis, G.; Cheng, H.S.; Avci, S.N.; Kurt, M.; et al. MicroRNA-135a-3p regulates angiogenesis and tissue repair by targeting p38 signaling in endothelial cells. FASEB J. 2019, 33, 5599–5614. [Google Scholar] [CrossRef] [PubMed]
  35. Kocerha, J.; Xu, Y.; Prucha, M.S.; Zhao, D.; Chan, A.W. microRNA-128a dysregulation in transgenic Huntington’s disease monkeys. Mol. Brain. 2014, 7, 46. [Google Scholar] [CrossRef] [Green Version]
  36. Khan, A.P.; Poisson, L.M.; Bhat, V.B.; Fermin, D.; Zhao, R.; Kalyana-Sundaram, S.; Michailidis, G.; Nesvizhskii, A.I.; Omenn, G.S.; Chinnaiyan, A.M.; et al. Quantitative proteomic profiling of prostate cancer reveals a role for miR-128 in prostate cancer. Mol. Cell. Proteom. 2010, 9, 298–312. [Google Scholar] [CrossRef] [PubMed] [Green Version]
  37. Smith, B.N.; Bhowmick, N.A. Role of EMT in Metastasis and Therapy Resistance. J. Clin. Med. 2016, 5, 17. [Google Scholar] [CrossRef] [Green Version]
  38. Hein, A.L.; Ouellette, M.M.; Yan, Y. Radiation-induced signaling pathways that promote cancer cell survival. Int. J. Oncol. 2014, 45, 1813–1819. [Google Scholar] [CrossRef] [Green Version]
  39. Wu, H.; Mo, Y.Y. Targeting miR-205 in breast cancer. Expert Opin. Ther. Targets 2009, 13, 1439–1448. [Google Scholar] [CrossRef]
Figure 1. miR-1272 reverts the mesenchymal phenotype and affects migratory and invasive properties of PCa cells. (A) miR-1272 expression in prostate normal and tumor tissue specimens, as from microarray analysis (left). miR-1272 expression in matched normal/tumor pairs is reported (right). (B) Representative RT-qPCR showing the expression levels of endogenous control RNU48 (beige columns) and miR-1272 (green columns) in untreated, miR-Neg and miR-1272 transfected DU145 and 22Rv1 cell lines. Expression values are reported as Cycle threshold (Ct). (C) Representative bright-field microphotographs showing morphological changes occurring in miR-1272 transfected DU145 and 22Rv1 cell lines as compared to miR-Neg cells. Scale bar, 50 μm. (D) Representative immunofluorescence microphotographs showing the organization of β-tubulin cytoskeleton in miR-1272 transfected DU145 and 22Rv1 cell lines as compared to miR-Neg cells. Scale bar, 50 μm. (E) Representative immunofluorescence microphotographs showing E-cadherin (green), β-catenin (red) and their co-localization (yellow merge) at membrane levels in miR-1272 transfected DU145 and 22Rv1 cell lines as compared to miR-Neg cells. Scale bar, 50 μm. (F) RT-qPCR showing the relative expression of epithelial (brick red columns) and mesenchymal (petrol blue columns) markers in miR-1272 transfected DU145 (top) and 22Rv1 (bottom) cells with respect to miR-Neg cells, at day 2 after transfection. Expression values are reported as mean −ddCt (+SD) as from 3 independent experiments, using GAPDH as endogenous control. (G) Immunoblotting showing protein levels of epithelial (brick red) and mesenchymal (petrol blue) markers in miR-1272 transfected DU145 (top) and 22Rv1 (bottom) cells with respect to miR-Neg cells. β-tubulin was used as endogenous control. (H) Bar plots reporting the mean percentage (+ SD) of migrated (top) and invaded (bottom) cells in miR-Neg (used as control) and miR-1272 transfected DU145 and 22Rv1 cell lines, as assessed by transwell assay. The results are reported as percentage of miR-Neg cells and represent the average of 3 independent experiments. * p < 0.05, ** p < 0.01, Student′s t-test.
Cells 09 00435 g001
Figure 2. miR-1272 reduces the growth of PCa cell lines both in vitro and in vivo. (A) Graphs reporting the growth of miR-Neg and miR-1272 transfected DU145 (top) and 22Rv1 (bottom) cells at different time points after transfection. Data are reported as percentage (mean ± SD as from 3 independent experiments) of cell number in each condition with respect to the number of miR-Neg cells collected at 24 h. (B) Bar plots reporting the relative catalytic activity of Caspase-3 (mean + SD from 3 independent experiments), an indicator of apoptosis induction, at 96 h after transfection of DU145 and 22Rv1 cells with miR-Neg and miR-1272. (C) Representative immunoblotting showing protein levels of cleaved and total PARP in miR-Neg and miR-1272 transfected DU145 (left) and 22Rv1 (right) cells. β-tubulin was used as endogenous control. (D) RT-qPCR showing relative expression of miR-1272 in miR-1272 transfected DU145 cells with respect to miR-Neg cells, at different time points after transfection. RNU48 was used as endogenous control. (E) Graph reporting the tumor growth volume (mean + SD) of xenografts originated from miR-Neg and miR-1272 transfected DU145 cells (10 mice per group), as measured with a Vernier caliper on the indicated days after cell injection into SCID mice. (F) RT-qPCR showing relative expression of miR-1272 in xenografts derived from miR-1272 transfected DU145 cells as compared to those derived from miR-Neg cells, at 23 days after injection into SCID mice. RNU48 was used as endogenous control. * p < 0.05, ** p < 0.01, *** p < 0.001, Student’s t-test.
Cells 09 00435 g002
Figure 3. HIP1 is a functional target of miR-1272. (A) Volcano plot showing fold-change (FC) and false discovery rate (FDR) of differentially expressed genes (red: up, blue: down) in miR-1272 transfected DU145 cells as compared to miR-Neg cells, as measured by microarray analysis. (B) Graph reporting FDR values of pathways enriched in gene ontology analysis carried out on genes differentially expressed genes upon miR-1272 supplementation. (C) Venn diagram indicating the number of genes significantly down-regulated in microarray analysis of miR-1272 cells and the number of genes predicted to be targets of miR-1272 as from miRWalk or MtiBase. The fourteen genes shared among the 3 lists are included in Table 1. (D) Plot reporting FC and FDR values of the 14 genes emerging from intersections.(E) Representation of miR-1272 duplexed with the 3′UTR of HIP1 mRNA, as from TargenScanHuman (http://www.targetscan.org/vert_72/) (top). Conservation of the miRNA binding site across vertebrates is made evident by graphs of PhastCons and PhyloP scores, as from UCSC Genome Browser (https://genome.ucsc.edu) (bottom). (F) RT-qPCR showing the relative expression of HIP1 in miR-1272 transfected DU145 and 22Rv1 cells with respect to miR-Neg cells, at day 2 after transfection. Expression values are reported as −ddCt (+SD) as from 3 independent experiments, using GAPDH as endogenous control. (G) Representative immunoblotting showing protein levels of HIP1 in miR-Neg and miR-1272 transfected DU145 (left) and 22Rv1 (right) cells. β-tubulin was used as endogenous control. (H) RT-qPCR showing the relative expression of HIP1 in siHIP1-transfected DU145 and 22Rv1 cells with respect to siCtr cells, at day 2 after transfection. Expression values are reported as −ddCt (+ SD) as from 3 independent experiments, using GAPDH as endogenous control. (I) Representative immunoblotting showing protein levels of HIP1 in siCtr and siHIP1 transfected DU145 (left) and 22Rv1 (right) cells. β-tubulin was used as endogenous control. (J) Representative bright-field microphotographs showing morphological changes occurring in siHIP1 transfected DU145 and 22Rv1 cell lines as compared to siCtr cells. Scale bar, 50 μm. (K) Representative immunofluorescence microphotographs showing the organization of β-tubulin cytoskeleton in siHIP1 transfected DU145 and 22Rv1 cell lines as compared to siCtr cells. Scale bar, 50 μm. (L) Graphs reporting the growth of siCtr and siHIP1 transfected DU145 (left) and 22Rv1 (right) cells at different time points after transfection. Data are reported as percentage (mean ± SD as from 3 independent experiments) of cell number in each condition with respect to the number of siCtr cells collected at 24 h. * p < 0.05, ** p < 0.01, *** p < 0.001, Student’s t-test.
Cells 09 00435 g003
Figure 4. miR-1272 affects EGFR/AKT/ERK signaling and increases ionizing radiation response. (A) Representative immunoblotting showing protein levels of cytoplasmic and membrane-associated EGFR and E-cadherin in miR-Neg and miR-1272 transfected DU145 cells. β-tubulin and Caveolin-1 were used as controls for cytoplasm/membrane fractionation. (B) Representative immunoblotting showing protein levels of EGFR/AKT/GSK3β/ERK pathway members in miR-Neg and miR-1272 transfected DU145 cells. Vinculin was used as endogenous control. (C) Clonogenic cell survival of DU145 cells transfected with miR-Neg or miR-1272 and exposed to increasing doses of irradiation (2, 4, 6 and 8 Gy). The surviving fraction is reported as mean ± SD values from 3 independent experiments. (D) Clonogenic cell survival of DU145 cells transfected with siCtr or siHIP1 and exposed to increasing doses of irradiation (2, 4, 6 and 8 Gy). The surviving fraction is reported as mean ± SD values from 3 independent experiments. * p < 0.05, ** p < 0.01, *** p < 0.001, Student’s t-test.
Cells 09 00435 g004
Table 1. Fourteen bona fide miR-1272 targets.
SymbolCLIP-seq *Gene NamelogFCFDR
HIP16huntingtin interacting protein 1−1.086.66 × 10−11
BCL11A5B-cell CLL/lymphoma 11A (zinc finger protein)−0.537.79 × 10−5
FOXK28forkhead box K2−0.484.22 × 10−3
ATF63activating transcription factor 6−0.447.87 × 10−4
SMARCA24SWI/SNF related, matrix associated, actin dependent regulator of chromatin, subfamily a, member 2−0.438.57 × 10−5
CERS62ceramide synthase 6−0.416.79 × 10−4
ZNRD13zinc ribbon domain containing 1−0.402.01 × 10−3
MRPL910mitochondrial ribosomal protein L9−0.381.03 × 10−3
GHITM4growth hormone inducible transmembrane protein−0.323.74 × 10−3
DAPK12death-associated protein kinase 1−0.323.89 × 10−3
PURB7purine-rich element binding protein B−0.293.51 × 10−2
TTC52tetratricopeptide repeat domain 5−0.273.84 × 10−2
BCL2L23BCL2-like 2−0.271.72 × 10−2
HTRA12HtrA serine peptidase 1−0.253.47 × 10−2
* number of CLIP-seq experiments supporting the association between Ago proteins and miR-1272 binding site within the 3′UTR of the indicated gene.

