Fibroblasts from the Human Skin Dermo-Hypodermal Junction are Distinct from Dermal Papillary and Reticular Fibroblasts and from Mesenchymal Stem Cells and Exhibit a Specific Molecular Profile Related to Extracellular Matrix Organization and Modeling


Abstract
1. Introduction
2. Materials and Methods
2.1. Fibroblast Isolation and Culture
2.1.1. Human Skin Biopsy Collection
2.1.2. Fp and Fr
2.1.3. Bidimensional Mass Culture
2.2. Mesenchymal Stem Cell (MSC) Isolation and Culture
2.2.1. BM-MSCs
2.2.2. Ad-MSCs
2.2.3. Amnion, Chorion, and Umbilical Cord MSCs
2.2.4. Bidimensional Mass Cultures
2.3. Colony Assay
2.4. Three-Dimensional Fibroblast Contractility Assay
2.5. Three-Dimensional Skin Reconstruction
2.6. Neosynthetized ECM Samples
2.7. Mesodermal Differentiation Assays
2.7.1. Adipocyte Lineage
2.7.2. Osteoblast Lineage
2.7.3. Chondrocyte Lineage
2.8. Transcriptome Analysis
2.8.1. RNA Extraction
2.8.2. Microarray Transcriptome Profiling
2.8.3. qRT-PCR
2.9. Immunofluorescence
2.9.1. Tissue Section Staining
2.9.2. Cell Staining
2.9.3. ECM Staining
2.10. Western Blot Analysis
2.11. Statistics
3. Results
3.1. Cellular Characteristics and Growth Potential Distinguish F-DHJ from Fp and Fr
3.2. Behavior in 3D Tissue and Differentiation Potential Distinguish F-DHJ from Fp and Fr
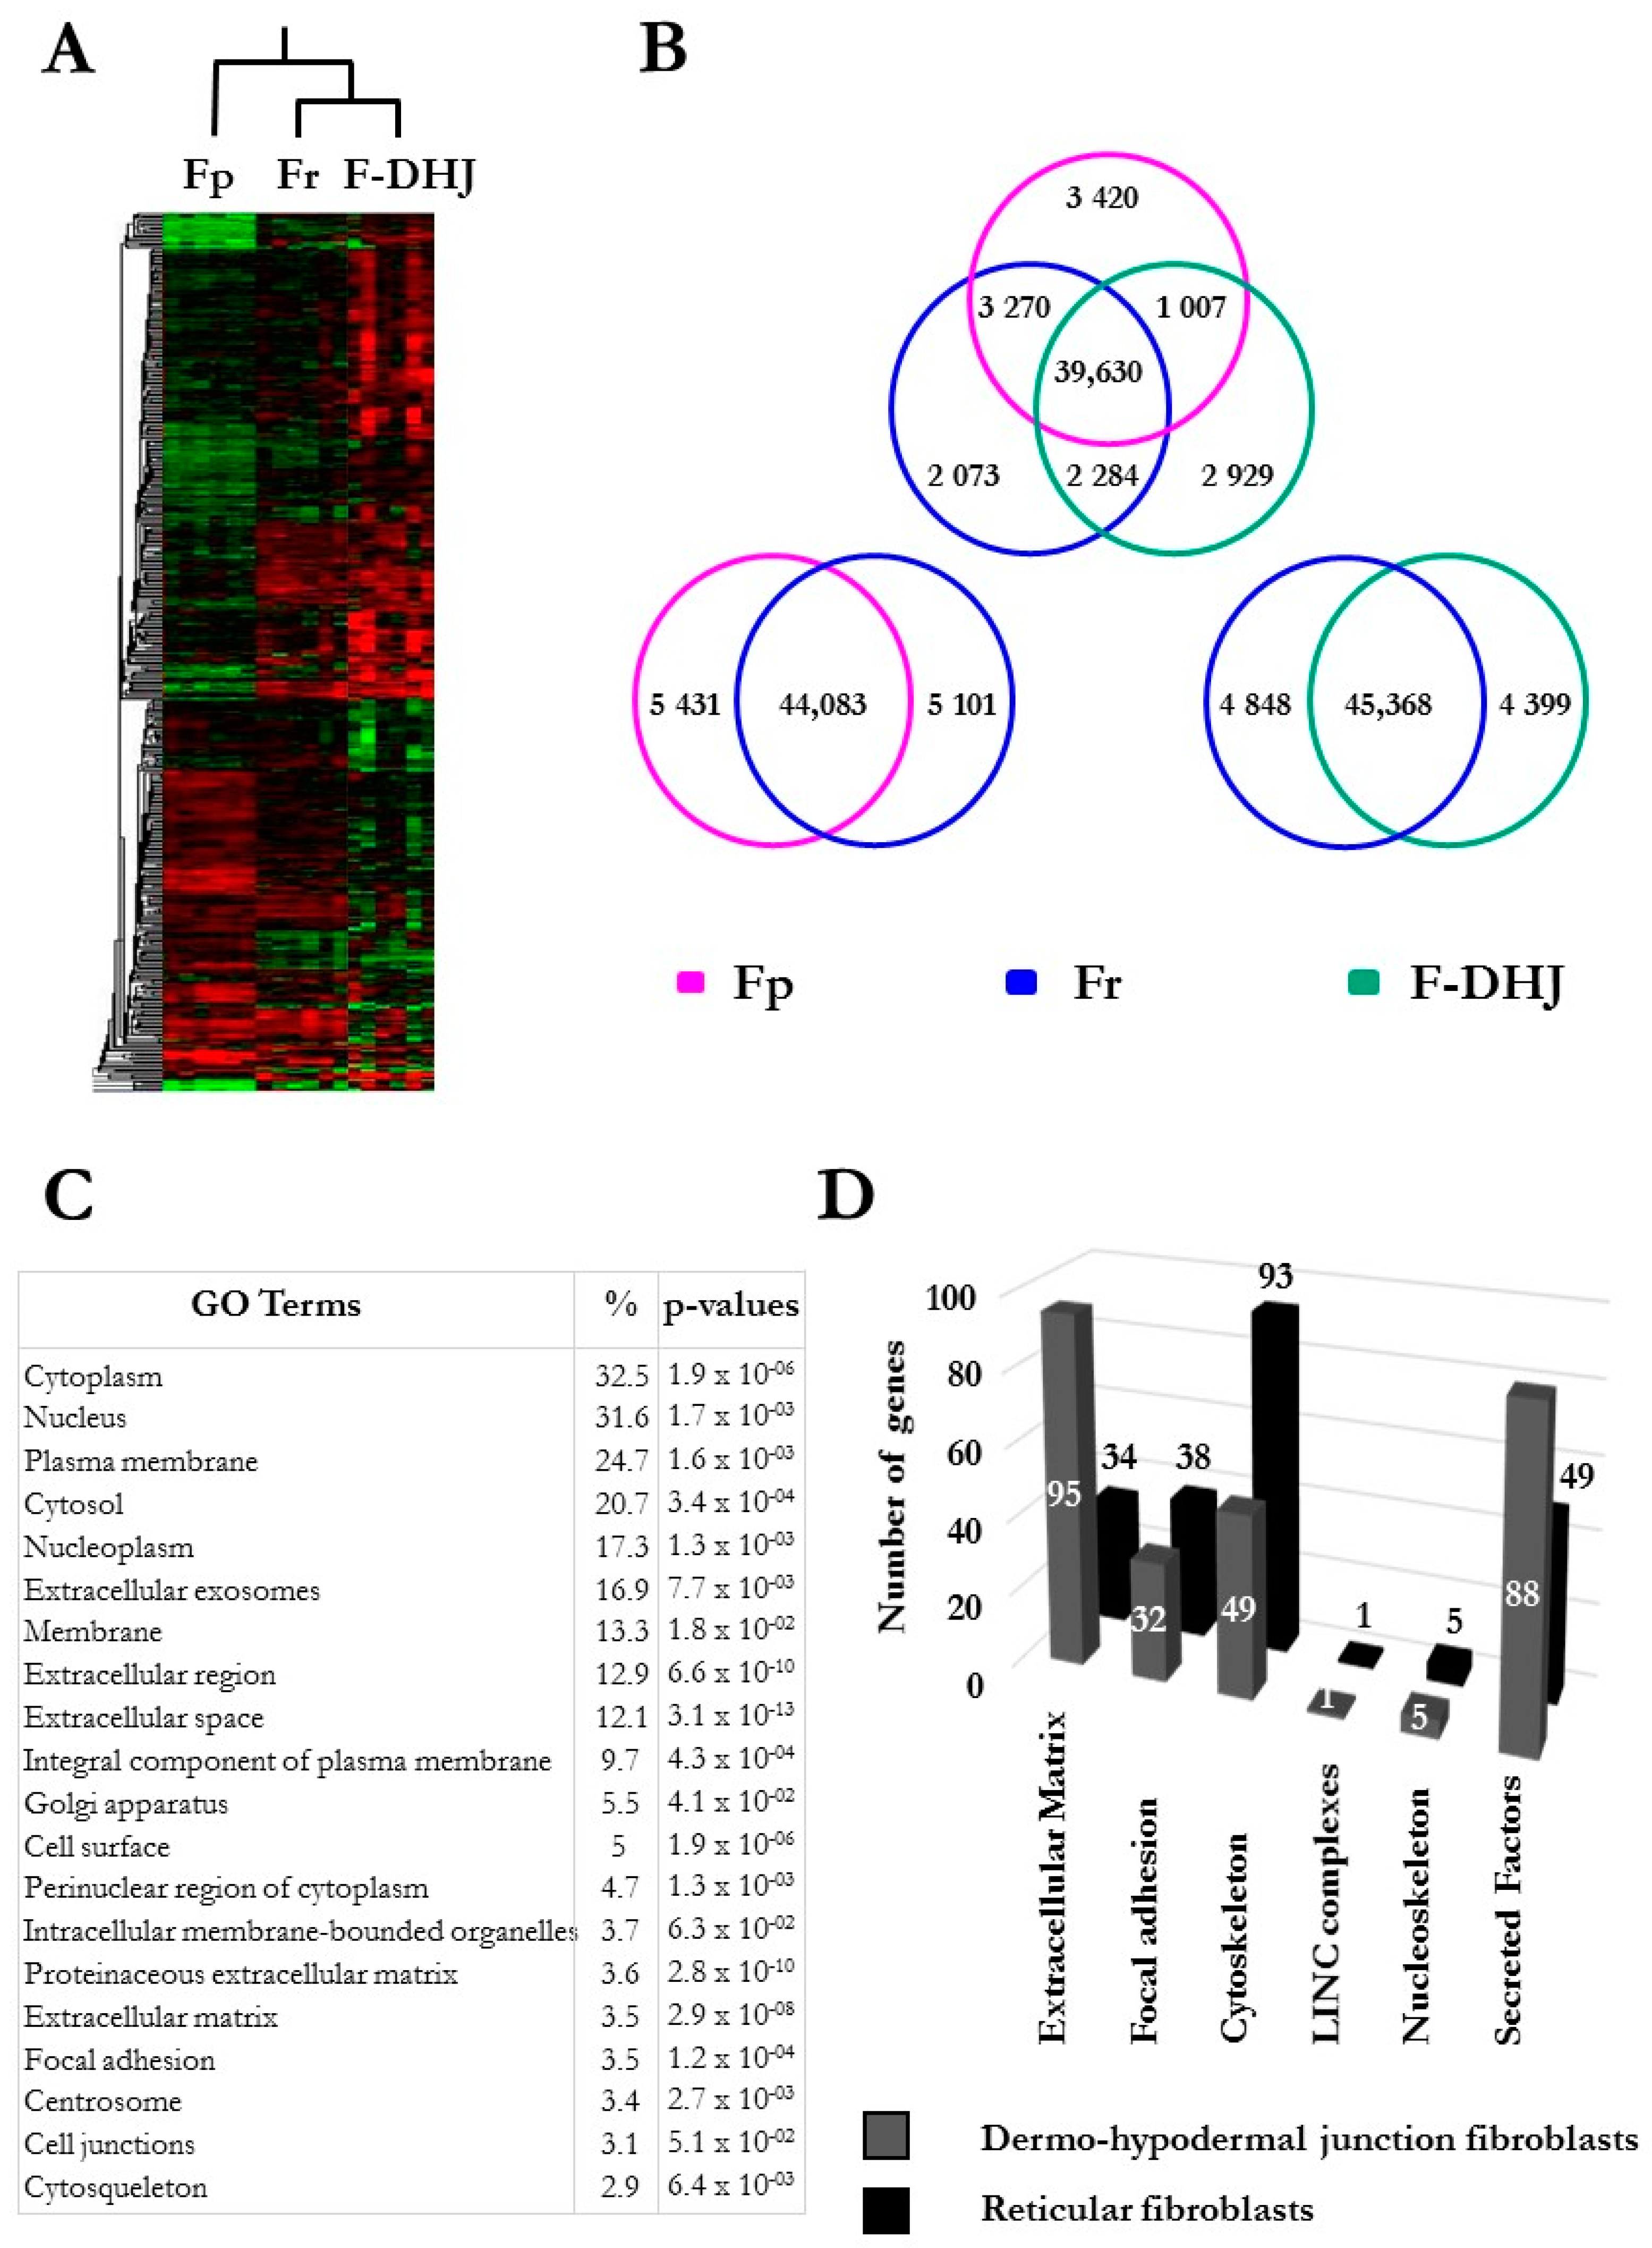
3.3. Molecular Profiles Distinguish the Fp, Fr, and F-DHJ Fibroblast Populations
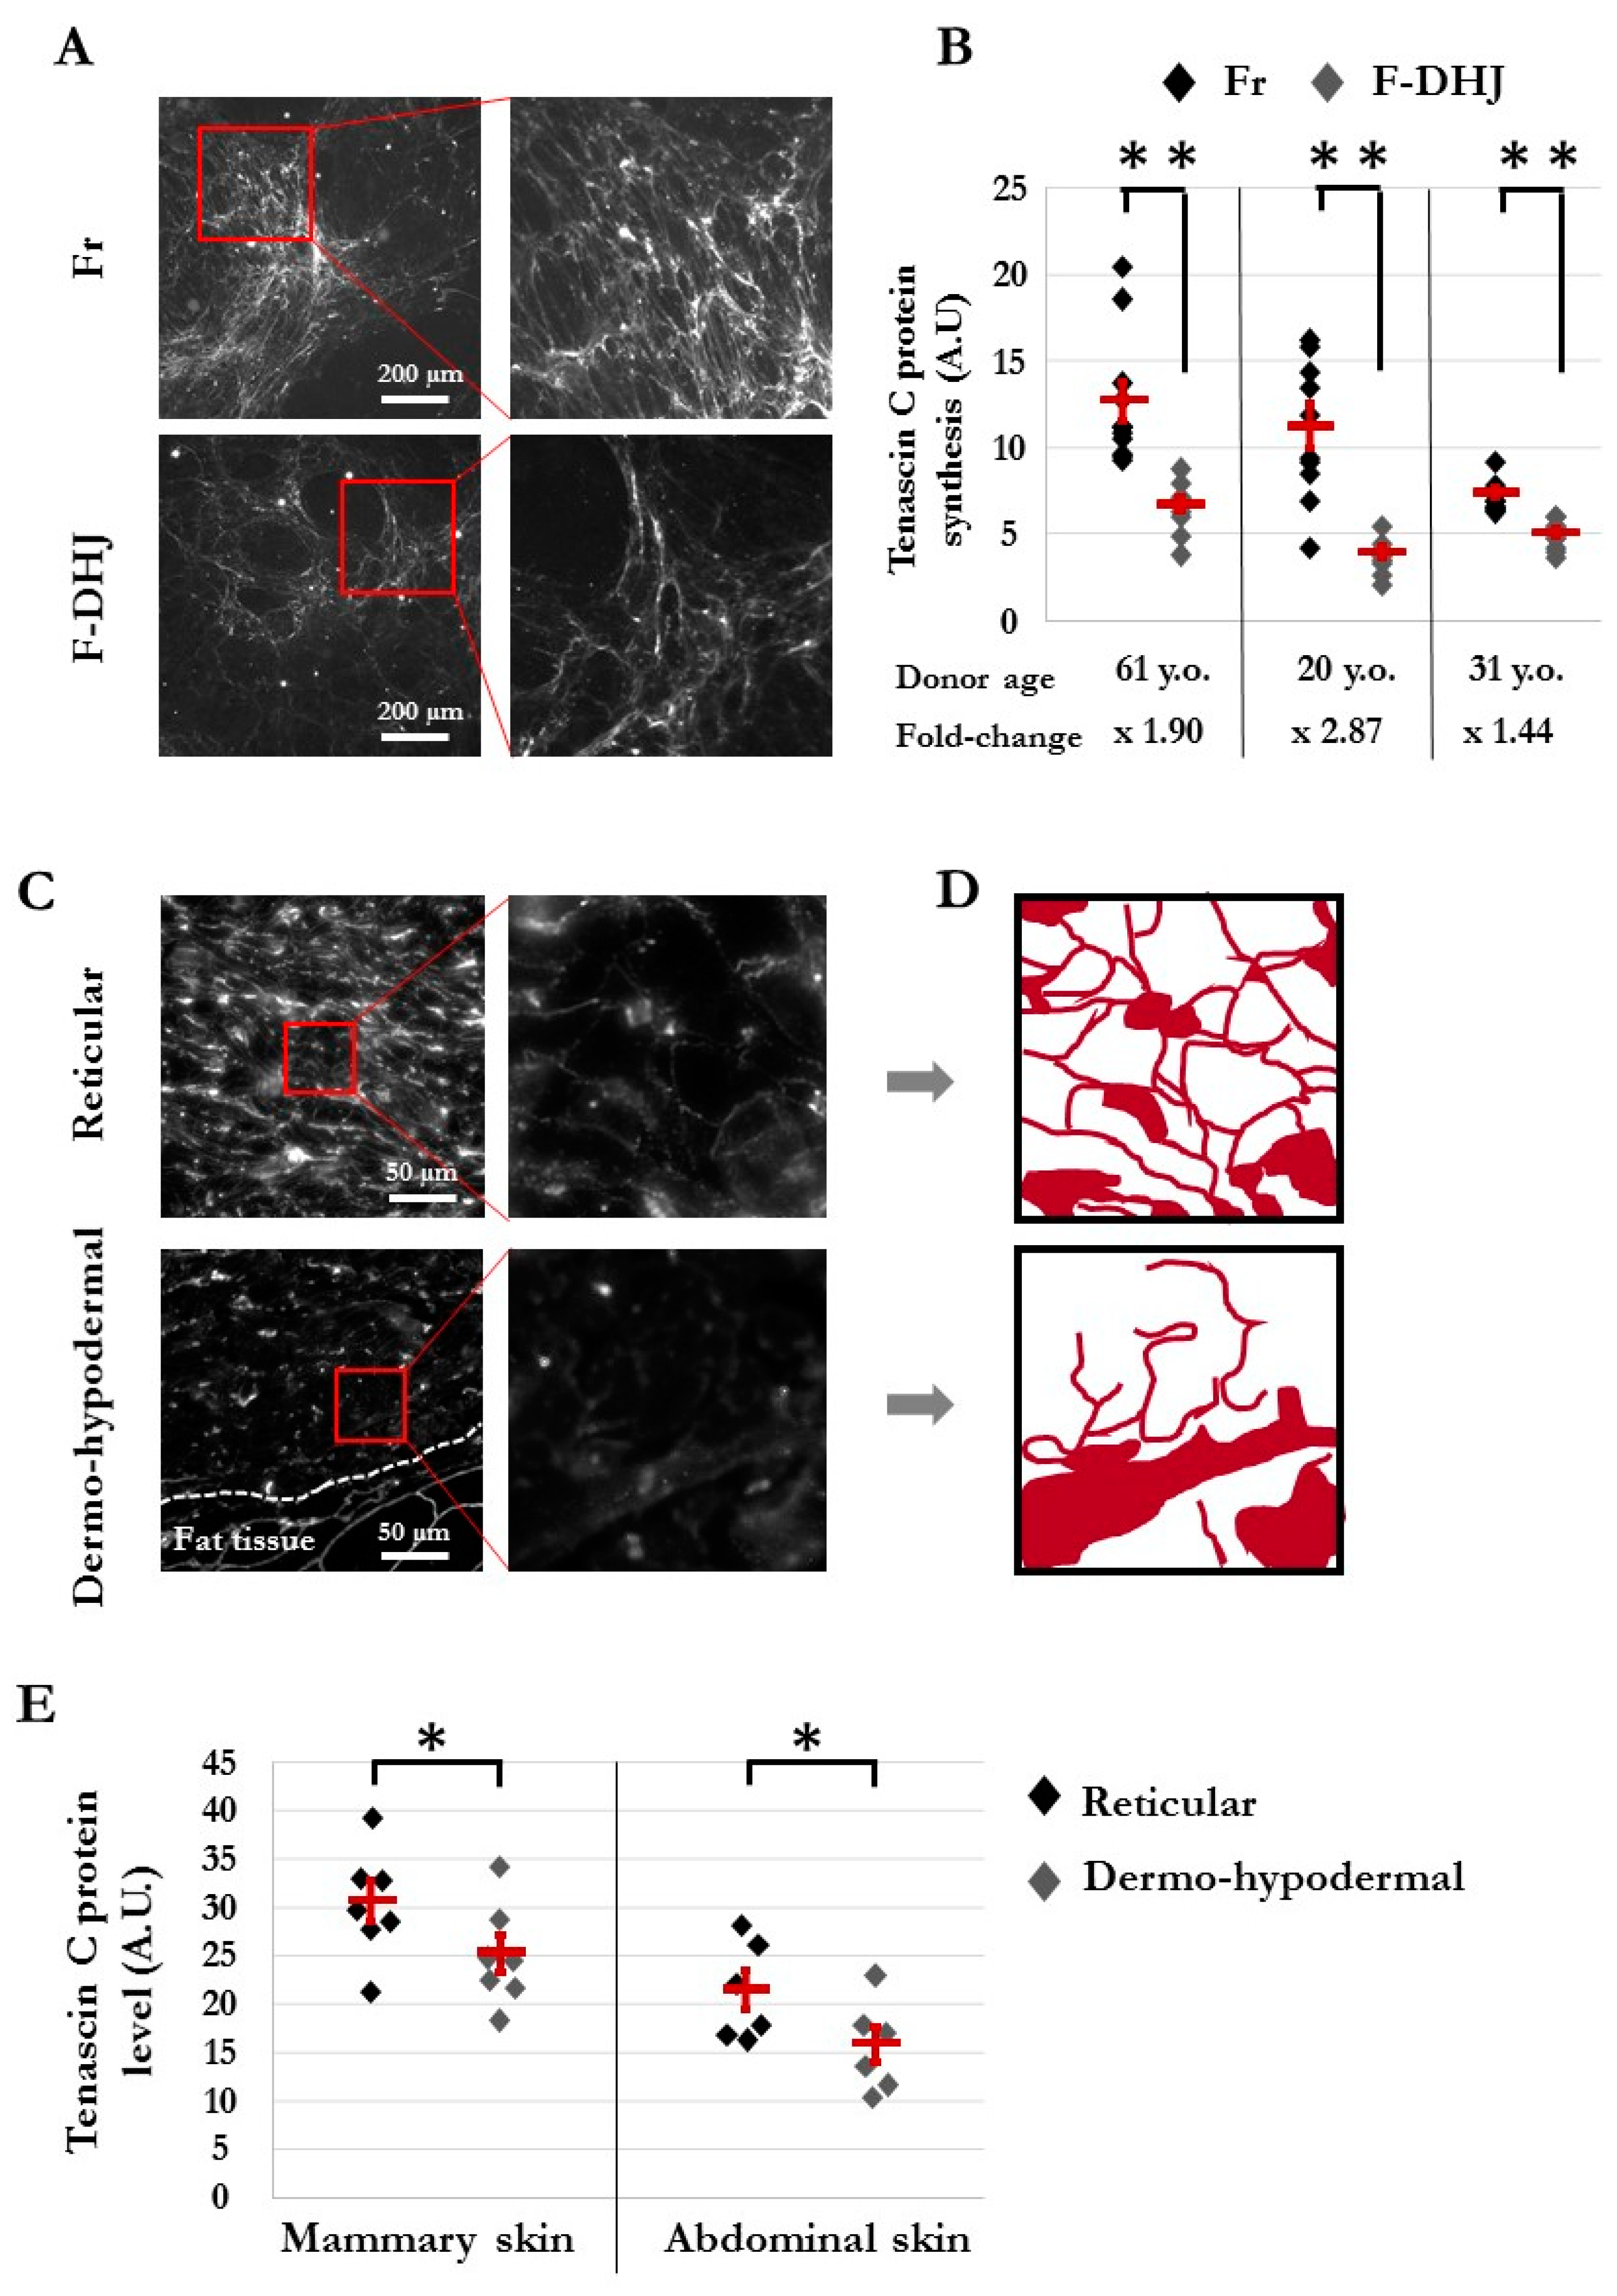
3.4. The Dermo-Hypodermal Junction and Reticular Dermis Differ in Their Matrix Architectural Meshwork
3.5. F-DHJ Fibroblasts and Adipose-Derived MSCs Exhibit Distinct Transcriptome Profiles
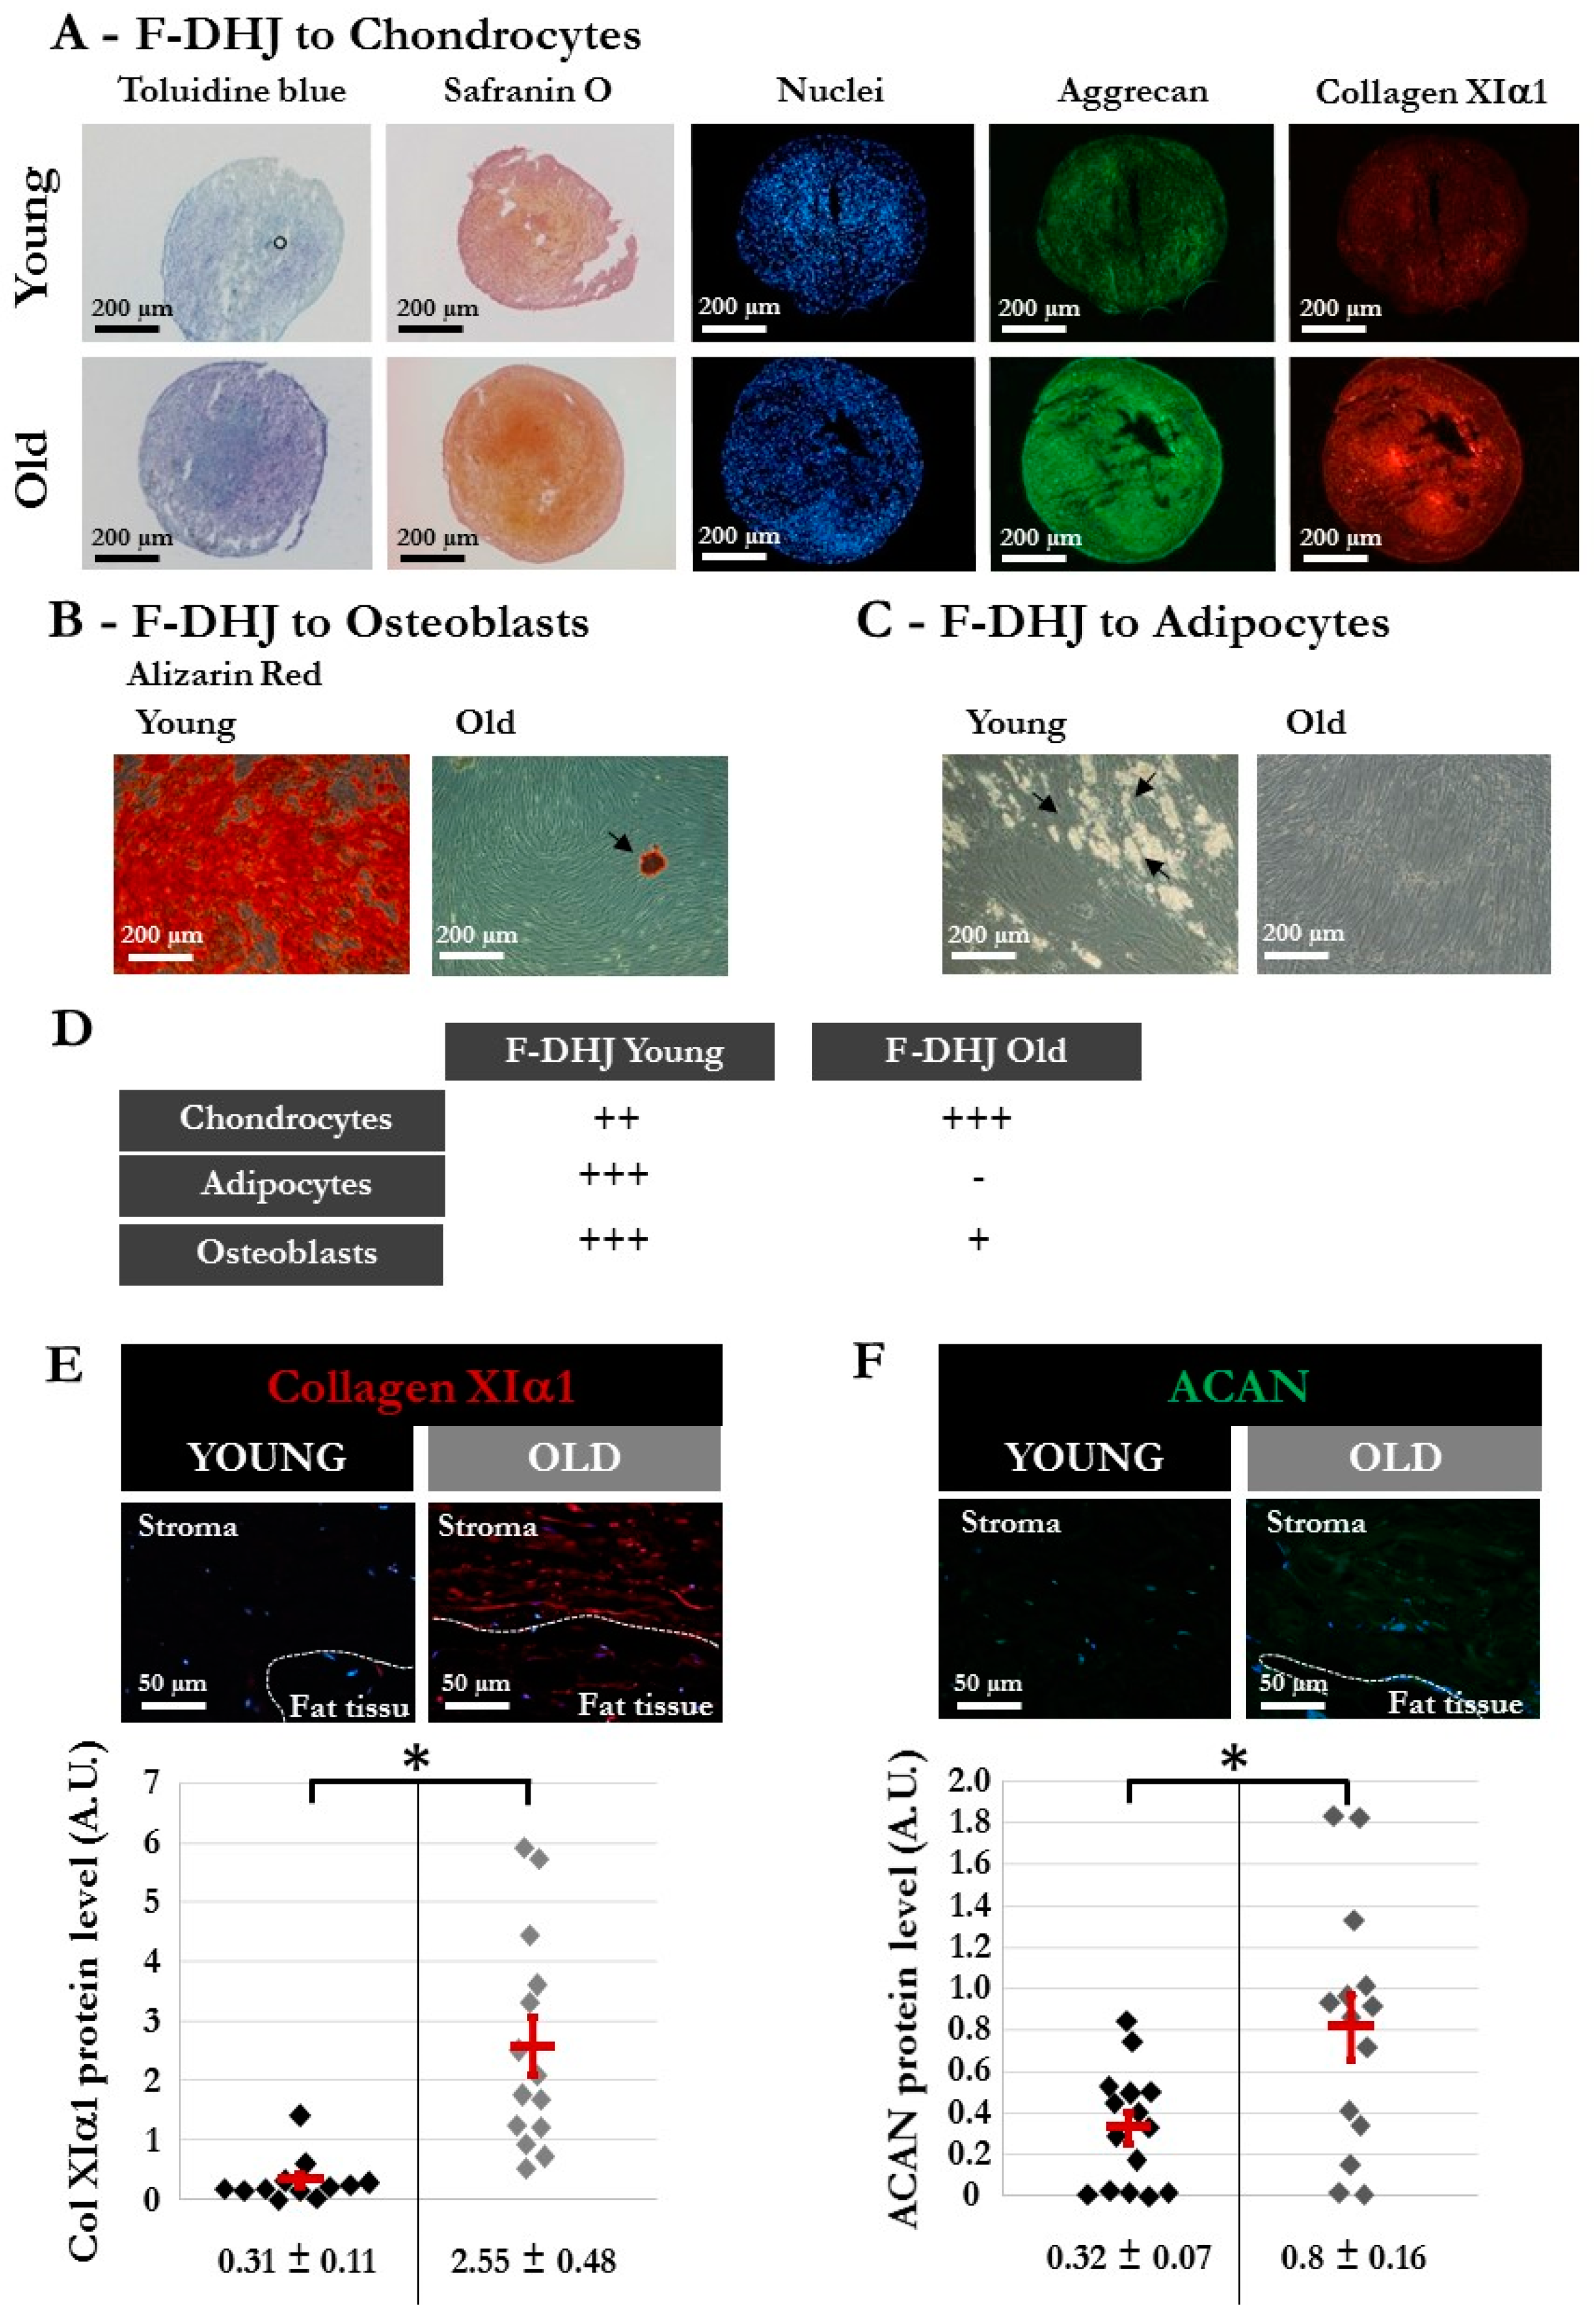
3.6. Differentiation Capacity is Reduced in F-DHJ from Aged Skin
4. Discussion
5. Patent
Author Contributions
Funding
Conflicts of Interest
References
- Smith, L.T.; Holbrook, K.A. Development of dermal connective tissue in human embryonic and fetal skin. Scan Electron Microsc. 1982, 4, 1745–1751. [Google Scholar]
- Smith, L.T.; Holbrook, K.A.; Byers, P.H. Structure of the dermal matrix during development and in the adult. J. Investig. Dermatol. 1982, 79 (Suppl. 1), 93s–104s. [Google Scholar] [CrossRef]
- Haydont, V.; Bernard, B.A.; Fortunel, N.O. Age-related evolutions of the dermis: Clinical signs, fibroblast and extracellular matrix dynamics. Mech. Ageing Dev. 2019, 177, 150–156. [Google Scholar] [CrossRef] [PubMed]
- Harper, R.A.; Grove, G. Human skin fibroblasts derived from papillary and reticular dermis: Differences in growth potential in vitro. Science 1979, 204, 526–527. [Google Scholar] [CrossRef] [PubMed]
- Mine, S.; Fortunel, N.O.; Pageon, H.; Asselineau, D. Aging alters functionally human dermal papillary fibroblasts but not reticular fibroblasts: A new view of skin morphogenesis and aging. PLoS ONE 2008, 3, e4066. [Google Scholar] [CrossRef] [PubMed]
- Janson, D.G.; Saintigny, G.; van Adrichem, A.; Mahé, C.; El Ghalbzouri, A. Different gene expression patterns in human papillary and reticular fibroblasts. J. Investig. Dermatol. 2012, 132, 2565–2572. [Google Scholar] [CrossRef] [PubMed]
- Nauroy, P.; Barruche, V.; Marchand, L.; Nindorera-Badara, S.; Bordes, S.; Closs, B.; Ruggiero, F. Human Dermal Fibroblast Subpopulations Display Distinct Gene Signatures Related to Cell Behaviors and Matrisome. J. Investig. Dermatol. 2017, 137, 1787–1789. [Google Scholar] [CrossRef]
- Haydont, V.; Neiveyans, V.; Zucchi, H.; Fortunel, N.O.; Asselineau, D. Genome-wide profiling of adult human papillary and reticular fibroblasts identifies ACAN, Col XI α1, and PSG1 as general biomarkers of dermis ageing, and KANK4 as an exemplary effector of papillary fibroblast ageing, related to contractility. Mech. Ageing Dev. 2019, 177, 157–181. [Google Scholar] [CrossRef]
- Haydont, V.; Neiveyans, V.; Fortunel, N.O.; Asselineau, D. Transcriptome profiling of human papillary and reticular fibroblasts from adult interfollicular dermis pinpoints the ‘tissue skeleton’ gene network as a component of skin chrono-ageing. Mech. Ageing Dev. 2019, 179, 60–77. [Google Scholar] [CrossRef]
- Breathnach, A.S. Development and differentiation of dermal cells in man. J. Investig. Dermatol. 1978, 71, 2–8. [Google Scholar] [CrossRef]
- Mills, S.J.; Cowin, A.J.; Kaur, P. Pericytes, mesenchymal stem cells and the wound healing process. Cells 2013, 2, 621–634. [Google Scholar] [CrossRef] [PubMed]
- Zhuang, L.; Lawlor, K.T.; Schlueter, H.; Pieterse, Z.; Yu, Y.; Kaur, P. Pericytes promote skin regeneration by inducing epidermal cell polarity and planar cell divisions. Life Sci. Alliance 2018, 1, e201700009. [Google Scholar] [CrossRef] [PubMed]
- Rusu, M.C.; Mirancea, N.; Mănoiu, V.S.; Vâlcu, M.; Nicolescu, M.I.; Păduraru, D. Skin telocytes. Ann. Anat. 2012, 194, 359–367. [Google Scholar] [CrossRef] [PubMed]
- Ceafalan, L.; Gherghiceanu, M.; Popescu, L.M.; Simionescu, O. Telocytes in human skin--are they involved in skin regeneration? J. Cell Mol. Med. 2012, 16, 1405–1420. [Google Scholar] [CrossRef]
- Manole, C.G.; Gherghiceanu, M.; Simionescu, O. Telocyte dynamics in psoriasis. J. Cell Mol. Med. 2015, 19, 1504–1519. [Google Scholar] [CrossRef]
- Shoshkes-Carmel, M.; Wang, Y.J.; Wangensteen, K.J.; Tóth, B.; Kondo, A.; Massasa, E.E.; Itzkovitz, S.; Kaestner, K.H. Subepithelial telocytes are an important source of Wnts that supports intestinal crypts. Nature 2018, 557, 242–246. [Google Scholar] [CrossRef]
- Gherghiceanu, M.; Popescu, L.M. Cardiac telocytes—Their junctions and functional implications. Cell Tissue Res. 2012, 348, 265–279. [Google Scholar] [CrossRef]
- Fertig, E.T.; Gherghiceanu, M.; Popescu, L.M. Extracellular vesicles release by cardiac telocytes: Electron microscopy and electron tomography. J. Cell Mol. Med. 2014, 18, 1938–1943. [Google Scholar] [CrossRef]
- Manole, C.G.; Simionescu, O. The Cutaneous Telocytes. Adv. Exp. Med. Biol. 2016, 913, 303–323. [Google Scholar]
- Peltzer, J.; Montespan, F.; Thepenier, C.; Boutin, L.; Uzan, G.; Rouas-Freiss, N.; Lataillade, J.J. Heterogeneous functions of perinatal mesenchymal stromal cells require a preselection before their banking for clinical use. Stem Cells Dev. 2015, 24, 329–344. [Google Scholar] [CrossRef]
- Asselineau, D.; Bernhard, B.; Bailly, C.; Darmon, M. Epidermal morphogenesis and induction of the 67 kD keratin polypeptide by culture of human keratinocytes at the liquid-air interface. Exp. Cell Res. 1985, 159, 536–539. [Google Scholar] [CrossRef]
- Rheinwald, J.G.; Green, H. Serial cultivation of strains of human epidermal keratinocytes: The formation of keratinizing colonies from single cells. Cell 1975, 6, 331–343. [Google Scholar] [CrossRef]
- Beacham, D.A.; Amatangelo, M.D.; Cukierman, E. Preparation of extracellular matrices produced by cultured and primary fibroblasts. Curr. Protoc. Cell Biol. 2007, 33. [Google Scholar] [CrossRef] [PubMed]
- Gabbiani, G. Modulation of fibroblastic cytoskeletal features during wound healing and fibrosis. Pathol. Res. Pract. 1994, 190, 851–853. [Google Scholar] [CrossRef]
- Pei, H.; Yao, Y.; Yang, Y.; Liao, K.; Wu, J.R. Krüppel-like factor KLF9 regulates PPARγ transactivation at the middle stage of adipogenesis. Cell Death Differ. 2011, 18, 315–327. [Google Scholar] [CrossRef] [PubMed]
- Kudo, A. Periostin in fibrillogenesis for tissue regeneration: Periostin actions inside and outside the cell. Cell Mol. Life Sci. 2011, 68, 3201–3207. [Google Scholar] [CrossRef]
- Spicer, A.P.; Joo, A.; Bowling, R.A., Jr. A hyaluronan binding link protein gene family whose members are physically linked adjacent to chondroitin sulfate proteoglycan core protein genes: The missing links. J. Biol. Chem. 2003, 278, 21083–21091. [Google Scholar] [CrossRef]
- Kiani, C.; Chen, L.; Wu, Y.J.; Yee, A.J.; Yang, B.B. Structure and function of aggrecan. Cell Res. 2002, 12, 19–32. [Google Scholar] [CrossRef]
- Kadler, K.E.; Hill, A.; Canty-Laird, E.G. Collagen fibrillogenesis: Fibronectin, integrins, and minor collagens as organizers and nucleators. Curr. Opin. Cell Biol. 2008, 20, 495–501. [Google Scholar] [CrossRef]
- Kielty, C.M.; Sherratt, M.J.; Shuttleworth, C.A. Elastic fibres. J. Cell Sci. 2002, 115, 2817–2828. [Google Scholar]
- Driskell, R.R.; Lichtenberger, B.M.; Hoste, E.; Kretzschmar, K.; Simons, B.D.; Charalambous, M.; Ferron, S.R.; Herault, Y.; Pavlovic, G.; Ferguson-Smith, A.C.; et al. Distinct fibroblast lineages determine dermal architecture in skin development and repair. Nature 2013, 504, 277–281. [Google Scholar] [CrossRef] [PubMed]
- Salzer, M.C.; Lafzi, A.; Berenguer-Llergo, A.; Youssif, C.; Castellanos, A.; Solanas, G.; Peixoto, F.O.; Stephan-Otto Attolini, C.; Prats, N.; Aguilera, M.; et al. Identity Noise and Adipogenic Traits Characterize Dermal Fibroblast Aging. Cell 2018, 175, 1575–1590. [Google Scholar] [CrossRef] [PubMed]
- Korosec, A.; Frech, S.; Gesslbauer, B.; Vierhapper, M.; Radtke, C.; Petzelbauer, P.; Lichtenberger, B.M. Lineage Identity and Location within the Dermis Determine the Function of Papillary and Reticular Fibroblasts in Human Skin. J. Investig. Dermatol. 2019, 139, 342–351. [Google Scholar] [CrossRef] [PubMed]
- Philippeos, C.; Telerman, S.B.; Oulès, B.; Pisco, A.O.; Shaw, T.J.; Elgueta, R.; Lombardi, G.; Driskell, R.R.; Soldin, M.; Lynch, M.D.; et al. Spatial and Single-Cell Transcriptional Profiling Identifies Functionally Distinct Human Dermal Fibroblast Subpopulations. J. Investig. Dermatol. 2018, 138, 811–825. [Google Scholar] [CrossRef] [PubMed]
- Brun, C.; Ly Ka So, S.; Maginiot, F.; Bensussan, A.; Michel, L.; Larghero, J.; Wong, H.; Oddos, T.; Cras, A. Intrinsically aged dermal fibroblasts fail to differentiate into adipogenic lineage. Exp. Dermatol. 2016, 25, 906–909. [Google Scholar] [CrossRef] [PubMed]
- Solé-Boldo, L.; Raddatz, G.; Schütz, S.; Mallm, J.P.; Rippe, K.; Lonsdorf, A.S.; Rodríguez-Paredes, M.; Lyko, F. Single-cell transcriptomes of the aging human skin reveal loss of fibroblast priming. BioRxiv. 2019, 633131. [Google Scholar] [CrossRef]
- Wollina, U.; Wetzker, R.; Abdel-Naser, M.B.; Kruglikov, I.L. Role of adipose tissue in facial aging. Clin. Interv. Aging 2017, 12, 2069–2076. [Google Scholar] [CrossRef]
- Marsh, E.; Gonzalez, D.G.; Lathrop, E.A.; Boucher, J.; Greco, V. Positional Stability and Membrane Occupancy Define Skin Fibroblast Homeostasis In Vivo. Cell 2018, 175, 1620–1633.e13. [Google Scholar] [CrossRef]
- Varani, J.; Dame, M.K.; Rittie, L.; Fligiel, S.E.; Kang, S.; Fisher, G.J.; Voorhees, J.J. Decreased collagen production in chronologically aged skin: Roles of age-dependent alteration in fibroblast function and defective mechanical stimulation. Am. J. Pathol. 2006, 168, 1861–1888. [Google Scholar] [CrossRef]


| Gene Symbol | Supplier Reference |
|---|---|
| ACAN | QT00001365 |
| CADM1 | QT00050001 |
| COL11A1 | QT00088711 |
| DIRAS3 | QT00040558 |
| EFHD1 | QT00086163 |
| EMCN | QT00025158 |
| FGF9 | QT00000091 |
| GAPDH | QT01192646 |
| KLF9 | QT00208537 |
| LIMCH1 | QT00038794 |
| MGST1 | QT00063357 |
| NPR3 | QT00047250 |
| RHOJ | QT00092078 |
| SFRP2 | QT00073220 |
| SOST | QT00219968 |
| SOX11 | QT00221466 |
| TBP | QT00000721 |
| TGFB2 | QT02290316 |
| TOX | QT00070063 |
| UCP2 | QT00014140 |
| VCAM1 | QT00018347 |
| Protein name | Supplier | Reference | Dilution |
|---|---|---|---|
| alpha Sm actin | Sigma (Saint-Quentin Falaviers—France) | A5228 | 1/200 |
| ACAN (Aggrecan) * | Abcam (Paris—France) | ab3778 | 1/20 |
| Col XI a1 | Sigma (Saint-Quentin Falaviers—France) | SAB4500393 | 1/50 |
| Desmine (clone D33) | Dako—Agilent (France) | M0760 | 1/50 |
| GAPDH | Interchim for Meridian (France) | H86504M | 1/2000 |
| KLF9 | Abcam (Paris—France) | ab170980 | 1/100 (IHC)–1/1000 (WB) |
| Phalloïdine Rhodamin | Invitrogen (France) | R415 | 1/50 |
| TNC (Tenascin C) | Novus Biologicals (Abington—UK) | NB110-68136 | 1/50 |
| Vimentin | TEBU (Le Perray-en-Yvelines—France) | MON3005 | 1/10 |
| Goat anti-Mouse Alexa 488 | Molecular Probes Invitrogen (France) | A21121 | 1/250 |
| Goat anti-Rabbit Alexa 555 | Molecular Probes Invitrogen (France) | A21428 | 1/250 |
| Zenon Alexa 488 | Molecular Probes Invitrogen (France) | Z25002 | |
| Goat anti-Rabbit HRP | Thermo-Fisher, France | 32460 | 1/2000 |
| UP in Fr | UP in F-DHJ | ||||||||
|---|---|---|---|---|---|---|---|---|---|
| Extracellular Matrix Genes | |||||||||
| Probe Set ID | Gene Symbol | Gene Title | adj-pval | FC | Probe Set ID | Gene Symbol | Gene Title | adj-pval | FC |
| 205941_s_at | COL10A1 | collagen, type X, alpha 1 | 9.41 × 10⁻³ | 4.23 | 220518_at | ABI3BP | ABI family, member 3 (NESH) binding protein | 2.37 × 10⁻² | 2.92 |
| 211343_s_at | COL13A1 | collagen, type XIII, alpha 1 | 1.44 × 10⁻² | 2.26 | 1559077_at | ABI3BP | ABI family, member 3 (NESH) binding protein | 7.43 × 10⁻² | 2.49 |
| 211809_x_at | COL13A1 | collagen, type XIII, alpha 1 | 2.74 × 10⁻² | 1.74 | 222486_s_at | ADAMTS1 | ADAM metallopeptidase with thrombospondin type 1 motif, 1 | 2.76 × 10⁻² | 2.33 |
| 221900_at | COL8A2 | collagen, type VIII, alpha 2 | 2.88 × 10⁻¹ | 2.23 | 222162_s_at | ADAMTS1 | ADAM metallopeptidase with thrombospondin type 1 motif, 1 | 4.36 × 10⁻² | 1.91 |
| 226824_at | CPXM2 | carboxypeptidase X (M14 family), member 2 | 2.01 × 10⁻¹ | 1.88 | 226997_at | ADAMTS12 | ADAM metallopeptidase with thrombospondin type 1 motif, 12 | 3.75 × 10⁻³ | 2.78 |
| 221541_at | CRISPLD2 | cysteine-rich secretory protein LCCL domain containing 2 | 5.98 × 10⁻² | 2.03 | 214913_at | ADAMTS3 | ADAM metallopeptidase with thrombospondin type 1 motif, 3 | 1.94 × 10⁻² | 1.94 |
| 206595_at | CST6 | cystatin E/M | 2.34 × 10⁻² | 3.12 | 237411_at | ADAMTS6 | ADAM metallopeptidase with thrombospondin type 1 motif, 6 | 1.36 × 10⁻¹ | 1.61 |
| 225681_at | CTHRC1 | collagen triple helix repeat containing 1 | 1.31 × 10⁻² | 2.82 | 224396_s_at | ASPN | asporin | 2.47 × 10⁻² | 4.48 |
| 202450_s_at | CTSK | cathepsin K | 2.05 × 10⁻¹ | 1.76 | 219087_at | ASPN | asporin | 1.32 × 10⁻² | 3.54 |
| 213068_at | DPT | dermatopontin | 8.16 × 10⁻² | 3.67 | 203477_at | COL15A1 | collagen, type XV, alpha 1 | 2.18 × 10⁻¹ | 2.78 |
| 207977_s_at | DPT | dermatopontin | 1.24 × 10⁻¹ | 2.85 | 209082_s_at | COL18A1 | collagen, type XVIII, alpha 1 | 6.56 × 10⁻⁴ | 2.99 |
| 222885_at | EMCN | endomucin | 6.59 × 10⁻² | 2.74 | 209081_s_at | COL18A1 | collagen, type XVIII, alpha 1 | 3.92 × 10⁻³ | 2.83 |
| 227874_at | EMCN | endomucin | 2.70 × 10⁻¹ | 1.81 | 208096_s_at | COL21A1 | collagen, type XXI, alpha 1 | 1.12 × 10⁻² | 6.88 |
| 219436_s_at | EMCN | endomucin | 1.79 × 10⁻¹ | 1.77 | 232458_at | COL3A1 | Collagen, type III, alpha 1 | 6.64 × 10⁻³ | 2.66 |
| 224374_s_at | EMILIN2 | elastin microfibril interfacer 2 | 6.75 × 10⁻² | 1.68 | 211981_at | COL4A1 | collagen, type IV, alpha 1 | 2.12 × 10⁻³ | 1.93 |
| 203088_at | FBLN5 | fibulin 5 | 2.24 × 10⁻² | 1.88 | 211980_at | COL4A1 | collagen, type IV, alpha 1 | 1.66 × 10⁻³ | 1.61 |
| 203638_s_at | FGFR2 | fibroblast growth factor receptor 2 | 3.21 × 10⁻³ | 4.52 | 222073_at | COL4A3 | collagen, type IV, alpha 3 (Goodpasture antigen) | 2.28 × 10⁻² | 1.70 |
| 208228_s_at | FGFR2 | fibroblast growth factor receptor 2 | 2.04 × 10⁻² | 2.52 | 229779_at | COL4A4 | collagen, type IV, alpha 4 | 2.85 × 10⁻⁸ | 5.32 |
| 210187_at | FKBP1A | FK506 binding protein 1A, 12 kDa | 8.48 × 10⁻² | 1.81 | 214602_at | COL4A4 | collagen, type IV, alpha 4 | 2.30 × 10⁻⁵ | 4.16 |
| 226145_s_at | FRAS1 | Fraser syndrome 1 | 6.34 × 10⁻² | 2.31 | 213110_s_at | COL4A5 | collagen, type IV, alpha 5 | 1.05 × 10⁻¹ | 3.62 |
| 204983_s_at | GPC4 | glypican 4 | 3.14 × 10⁻² | 2.07 | 52255_s_at | COL5A3 | collagen, type V, alpha 3 | 2.47 × 10⁻³ | 3.07 |
| 204984_at | GPC4 | glypican 4 | 1.57 × 10⁻² | 2.02 | 218975_at | COL5A3 | collagen, type V, alpha 3 | 2.83 × 10⁻³ | 2.65 |
| 235944_at | HMCN1 | hemicentin 1 | 3.52 × 10⁻⁵ | 6.28 | 205832_at | CPA4 | carboxypeptidase A4 | 2.37 × 10⁻² | 4.34 |
| 203417_at | MFAP2 | microfibrillar-associated prot 2 | 8.08 × 10⁻² | 1.70 | 201116_s_at | CPE | carboxypeptidase E | 7.11 × 10⁻³ | 2.37 |
| 204580_at | MMP12 | matrix metallopeptidase 12 (macrophage elastase) | 2.58 × 10⁻¹ | 2.17 | 201117_s_at | CPE | carboxypeptidase E | 4.90 × 10⁻³ | 2.10 |
| 205828_at | MMP3 | matrix metallopeptidase 3 | 4.79 × 10⁻³ | 7.70 | 227138_at | CRTAP | cartilage associated protein | 1.31 × 10⁻² | 1.63 |
| 209596_at | MXRA5 | matrix-remodelling associated 5 | 2.09 × 10⁻² | 2.52 | 201360_at | CST3 | cystatin C | 6.11 × 10⁻² | 1.55 |
| 236088_at | NTNG1 | netrin G1 | 2.16 × 10⁻² | 2.55 | 201487_at | CTSC | cathepsin C | 6.11 × 10⁻⁵ | 2.41 |
| 222722_at | OGN | osteoglycin | 1.91 × 10⁻¹ | 2.04 | 225646_at | CTSC | cathepsin C | 1.80 × 10⁻³ | 2.32 |
| 228186_s_at | RSPO3 | R-spondin 3 homolog (X. laevis) | 1.35 × 10⁻² | 2.98 | 225647_s_at | CTSC | cathepsin C | 1.37 × 10⁻³ | 2.25 |
| 218638_s_at | SPON2 | spondin 2, extracellular matrix prot | 3.07 × 10⁻² | 2.84 | 231234_at | CTSC | cathepsin C | 5.72 × 10⁻³ | 2.03 |
| 216005_at | TNC | Tenascin C | 1.24 × 10⁻² | 2.61 | 202295_s_at | CTSH | cathepsin H | 4.00 × 10⁻² | 1.85 |
| 201645_at | TNC | tenascin C | 4.34 × 10⁻² | 1.59 | 209335_at | DCN | decorin | 1.02 × 10⁻¹ | 2.05 |
| 211896_s_at | DCN | decorin | 2.16 × 10⁻¹ | 1.69 | |||||
| 211813_x_at | DCN | decorin | 1.52 × 10⁻¹ | 1.68 | |||||
| 201893_x_at | DCN | decorin | 1.77 × 10⁻¹ | 1.56 | |||||
| 1568779_a_at | ECM2 | extracellular matrix protein 2 | 1.76 × 10⁻¹ | 1.71 | |||||
| 206101_at | ECM2 | extracellular matrix protein 2 | 2.50 × 10⁻¹ | 1.57 | |||||
| 201843_s_at | EFEMP1 | EGF-containing fibulin-like extracellular matrix protein 1 | 7.68 × 10⁻⁴ | 3.62 | |||||
| 201842_s_at | EFEMP1 | EGF-containing fibulin-like extracellular matrix protein 1 | 4.62 × 10⁻⁴ | 2.87 | |||||
| 228421_s_at | EFEMP1 | EGF-containing fibulin-like extracellular matrix protein 1 | 2.23 × 10⁻¹ | 1.61 | |||||
| 226911_at | EGFLAM | EGF-like, fibronectin type III and laminin G domains | 3.95 × 10⁻³ | 4.36 | |||||
| 204834_at | FGL2 | fibrinogen-like 2 | 4.12 × 10⁻⁴ | 6.37 | |||||
| 227265_at | FGL2 | fibrinogen-like 2 | 4.28 × 10⁻³ | 3.56 | |||||
| 202709_at | FMOD | fibromodulin | 1.12 × 10⁻³ | 2.96 | |||||
| 205206_at | KAL1 | Kallmann syndrome 1 sequence | 9.65 × 10⁻⁴ | 7.84 | |||||
| 227048_at | LAMA1 | laminin, alpha 1 | 2.82 × 10⁻¹ | 1.83 | |||||
| 216840_s_at | LAMA2 | laminin, alpha 2 | 5.17 × 10⁻³ | 2.80 | |||||
| 205116_at | LAMA2 | laminin, alpha 2 | 1.05 × 10⁻² | 2.67 | |||||
| 213519_s_at | LAMA2 | laminin, alpha 2 | 1.10 × 10⁻² | 2.57 | |||||
| 210150_s_at | LAMA5 | laminin, alpha 5 | 4.86 × 10⁻² | 1.57 | |||||
| 211651_s_at | LAMB1 | laminin, beta 1 | 8.27 × 10⁻² | 1.54 | |||||
| 200770_s_at | LAMC1 | laminin, gamma 1 (formerly LAMB2) | 7.61 × 10⁻⁶ | 1.91 | |||||
| 200771_at | LAMC1 | laminin, gamma 1 (formerly LAMB2) | 7.75 × 10⁻⁷ | 1.90 | |||||
| 202267_at | LAMC2 | laminin, gamma 2 | 7.41 × 10⁻⁴ | 10.0 | |||||
| 200923_at | LGALS3BP LOC100133842 | lectin, galactoside-binding, soluble, 3 binding protein similar to lectin, galactoside-binding, soluble, 3 binding protein | 1.02 × 10⁻² | 2.45 | |||||
| 242767_at | LMCD1 | LIM and cysteine-rich domains 1 | 1.72 × 10⁻² | 2.01 | |||||
| 202998_s_at | LOXL2 | lysyl oxidase-like 2 | 4.16 × 10⁻³ | 1.59 | |||||
| 227145_at | LOXL4 | lysyl oxidase-like 4 | 3.15 × 10⁻² | 2.43 | |||||
| 219922_s_at | LTBP3 | latent transforming growth factor beta binding protein 3 | 7.19 × 10⁻² | 1.64 | |||||
| 227308_x_at | LTBP3 | latent transforming growth factor beta binding protein 3 | 2.22 × 10⁻³ | 1.53 | |||||
| 213765_at | MFAP5 | microfibrillar associated prot 5 | 3.51 × 10⁻³ | 1.61 | |||||
| 213764_s_at | MFAP5 | microfibrillar associated prot 5 | 3.23 × 10⁻³ | 1.53 | |||||
| 210605_s_at | MFGE8 | milk fat globule-EGF factor 8 protein | 1.80 × 10⁻¹ | 1.75 | |||||
| 202291_s_at | MGP | matrix Gla protein | 3.10 × 10⁻⁴ | 7.14 | |||||
| 207847_s_at | MUC1 | mucin 1, cell surface associated | 1.58 × 10⁻¹ | 2.38 | |||||
| 213693_s_at | MUC1 | mucin 1, cell surface associated | 2.03 × 10⁻² | 2.04 | |||||
| 204114_at | NID2 | nidogen 2 (osteonidogen) | 2.32 × 10⁻³ | 2.83 | |||||
| 223315_at | NTN4 | netrin 4 | 1.76 × 10⁻⁴ | 14.27 | |||||
| 201860_s_at | PLAT | plasminogen activator, tissue | 2.56 × 10⁻² | 2.15 | |||||
| 211668_s_at | PLAU | plasminogen activator, urokinase | 2.43 × 10⁻¹ | 1.99 | |||||
| 228224_at | PRELP | proline/arginine-rich end leucine-rich repeat protein | 2.74 × 10⁻² | 3.46 | |||||
| 204223_at | PRELP | proline/arginine-rich end leucine-rich repeat protein | 3.27 × 10⁻² | 3.27 | |||||
| 205923_at | RELN | reelin | 3.58 × 10⁻⁸ | 9.15 | |||||
| 202376_at | SERPINA3 | serpin peptidase inhibitor, clade A (alpha-1 antiproteinase, antitrypsin), member 3 | 6.25 × 10⁻² | 2.05 | |||||
| 204614_at | SERPINB2 | serpin peptidase inhibitor, clade B (ovalbumin), member 2 | 9.41 × 10⁻² | 5.27 | |||||
| 209723_at | SERPINB9 | serpin peptidase inhibitor, clade B (ovalbumin), member 9 | 5.41 × 10⁻³ | 2.25 | |||||
| 200986_at | SERPING1 | serpin peptidase inhibitor, clade G (C1 inhibitor), member 1 | 2.27 × 10⁻¹ | 1.72 | |||||
| 205352_at | SERPINI1 | serpin peptidase inhibitor, clade I (neuroserpin), member 1 | 1.54 × 10⁻³ | 2.71 | |||||
| 213493_at | SNED1 | sushi, nidogen and EGF-like domains 1 | 3.24 × 10⁻² | 2.47 | |||||
| 213488_at | SNED1 | sushi, nidogen and EGF-like domains 1 | 2.30 × 10⁻¹ | 1.94 | |||||
| 205236_x_at | SOD3 | superoxide dismutase 3, extracellular | 1.15 × 10⁻¹ | 1.71 | |||||
| 202363_at | SPOCK1 | sparc/osteonectin, cwcv and kazal-like domains proteoglycan (testican) 1 | 5.31 × 10⁻³ | 2.13 | |||||
| 201858_s_at | SRGN | serglycin | 3.34 × 10⁻⁴ | 8.11 | |||||
| 201859_at | SRGN | serglycin | 3.81 × 10⁻⁴ | 4.87 | |||||
| 219552_at | SVEP1 | sushi, von Willebrand factor type A, EGF and pentraxin domain containing 1 | 1.07 × 10⁻¹ | 1.70 | |||||
| 213247_at | SVEP1 | sushi, von Willebrand factor type A, EGF and pentraxin domain containing 1 | 6.04 × 10⁻² | 1.70 | |||||
| 226506_at | THSD4 | thrombospondin, type I, domain containing 4 | 6.68 × 10⁻⁴ | 3.97 | |||||
| 222835_at | THSD4 | thrombospondin, type I, domain containing 4 | 5.26 × 10⁻⁵ | 3.43 | |||||
| 219058_x_at | TINAGL1 | tubulointerstitial nephritis antigen-like 1 | 8.12 × 10⁻³ | 2.50 | |||||
| 216333_x_at | TNXA TNXB | tenascin XA pseudogene tenascin XB | 7.97 × 10⁻⁵ | 11.18 | |||||
| 206093_x_at | TNXA TNXB | tenascin XA pseudogene tenascin XB | 5.32 × 10⁻⁵ | 10.76 | |||||
| 213451_x_at | TNXA TNXB | tenascin XA pseudogene tenascin XB | 1.65 × 10⁻⁴ | 9.71 | |||||
| 208609_s_at | TNXB | tenascin XB | 7.07 × 10⁻⁵ | 8.99 | |||||
| Focal Adhesion Points | |||||||||
| Probe Set ID | Gene Symbol | Gene Title | adj-pval | FC | Probe Set ID | Gene Symbol | Gene Title | adj-pval | FC |
| 205730_s_at | ABLIM3 | actin binding LIM protein family, member 3 | 1.06 × 10⁻¹ | 1.53 | 200965_s_at | ABLIM1 | actin binding LIM protein 1 | 2.02 × 10⁻⁵ | 4.17 |
| 213497_at | ABTB2 | ankyrin repeat and BTB (POZ) domain containing 2 | 6.59 × 10⁻² | 1.61 | 205882_x_at | ADD3 | adducin 3 (gamma) | 6.45 × 10⁻³ | 1.59 |
| 205268_s_at | ADD2 | adducin 2 (beta) | 8.16 × 10⁻⁴ | 7.50 | 201752_s_at | ADD3 | adducin 3 (gamma) | 9.71 × 10⁻³ | 1.56 |
| 205771_s_at | AKAP7 | A kinase (PRKA) anchor prot 7 | 1.03 × 10⁻¹ | 1.58 | 227529_s_at | AKAP12 | A kinase (PRKA) anchor prot 12 | 6.81 × 10⁻³ | 8.03 |
| 205257_s_at | AMPH | amphiphysin | 1.45 × 10⁻⁷ | 6.02 | 227530_at | AKAP12 | A kinase (PRKA) anchor prot 12 | 4.43 × 10⁻³ | 6.10 |
| 1552619_a_at | ANLN | anillin, actin binding protein | 3.48 × 10⁻² | 2.47 | 210517_s_at | AKAP12 | A kinase (PRKA) anchor prot 12 | 6.53 × 10⁻³ | 4.66 |
| 222608_s_at | ANLN | anillin, actin binding protein | 4.60 × 10⁻² | 2.25 | 202920_at | ANK2 | ankyrin 2, neuronal | 8.40 × 10⁻³ | 2.34 |
| 203526_s_at | APC | adenomatous polyposis coli | 3.34 × 10⁻³ | 1.60 | 206385_s_at | ANK3 | ankyrin 3, node of Ranvier (ankyrin G) | 3.69 × 10⁻³ | 3.16 |
| 204492_at | ARHGAP11A | Rho GTPase activating protein 11A | 3.11 × 10⁻² | 2.12 | 227337_at | ANKRD37 | ankyrin repeat domain 37 | 4.35 × 10⁻⁶ | 6.04 |
| 37577_at | ARHGAP19 | Rho GTPase activating protein 19 | 9.72 × 10⁻⁴ | 1.72 | 204671_s_at | ANKRD6 | ankyrin repeat domain 6 | 3.20 × 10⁻² | 2.12 |
| 206298_at | ARHGAP22 | Rho GTPase activating protein 22 | 8.57 × 10⁻³ | 1.58 | 204672_s_at | ANKRD6 | ankyrin repeat domain 6 | 5.69 × 10⁻² | 1.96 |
| 201288_at | ARHGDIB | Rho GDP dissociation inhibitor (GDI) beta | 3.85 × 10⁻² | 1.54 | 228368_at | ARHGAP20 | Rho GTPase activating prot 20 | 1.15 × 10⁻⁴ | 5.72 |
| 204092_s_at | AURKA | aurora kinase A | 2.07 × 10⁻² | 2.88 | 227911_at | ARHGAP28 | Rho GTPase activating prot 28 | 1.07 × 10⁻³ | 2.38 |
| 208079_s_at | AURKA | aurora kinase A | 3.80 × 10⁻² | 2.45 | 206167_s_at | ARHGAP6 | Rho GTPase activating prot 6 | 1.09 × 10⁻¹ | 1.65 |
| 209464_at | AURKB | aurora kinase B | 1.04 × 10⁻² | 2.92 | 205109_s_at | ARHGEF4 | Rho guanine nucleotide exchange factor (GEF) 4 | 1.49 × 10⁻¹ | 1.53 |
| 205294_at | BAIAP2 | BAI1-associated protein 2 | 2.67 × 10⁻³ | 1.51 | 201615_x_at | CALD1 | caldesmon 1 | 1.61 × 10⁻¹ | 1.79 |
| 210334_x_at | BIRC5 | baculoviral IAP repeat-containing 5 | 1.01 × 10⁻² | 2.69 | 201616_s_at | CALD1 | caldesmon 1 | 1.89 × 10⁻² | 1.53 |
| 202094_at | BIRC5 | baculoviral IAP repeat-containing 5 | 4.10 × 10⁻² | 2.63 | 236473_at | CC2D2A | coiled-coil and C2 domain containing 2A | 2.18 × 10⁻³ | 2.56 |
| 202095_s_at | BIRC5 | baculoviral IAP repeat-containing 5 | 1.72 × 10⁻² | 2.47 | 203139_at | DAPK1 | death-associated protein kinase 1 | 2.66 × 10⁻² | 3.97 |
| 220935_s_at | CDK5RAP2 | CDK5 regulatory subunit associated protein 2 | 1.91 × 10⁻⁷ | 1.78 | 229800_at | DCLK1 | Doublecortin-like kinase 1 | 1.78 × 10⁻¹ | 1.99 |
| 204962_s_at | CENPA | centromere protein A | 3.83 × 10⁻² | 2.88 | 217208_s_at | DLG1 | discs, large homolog 1 (Drosophila) | 6.19 × 10⁻³ | 2.32 |
| 210821_x_at | CENPA | centromere protein A | 4.21 × 10⁻³ | 1.98 | 202515_at | DLG1 | discs, large homolog 1 (Drosophila) | 1.59 × 10⁻³ | 1.72 |
| 205046_at | CENPE | centromere protein E, 312 kDa | 7.08 × 10⁻² | 2.65 | 202514_at | DLG1 | discs, large homolog 1 (Drosophila) | 6.69 × 10⁻³ | 1.72 |
| 209172_s_at | CENPF | centromere protein F, 350/400 ka (mitosin) | 1.33 × 10⁻² | 2.98 | 230229_at | DLG1 | Discs, large homolog 1 (Drosophila) | 1.49 × 10⁻¹ | 1.63 |
| 207828_s_at | CENPF | centromere protein F, 350/400 ka (mitosin) | 2.29 × 10⁻² | 2.94 | 202516_s_at | DLG1 | discs, large homolog 1 (Drosophila) | 5.92 × 10⁻² | 1.60 |
| 231772_x_at | CENPH | centromere protein H | 2.74 × 10⁻² | 1.82 | 203881_s_at | DMD | dystrophin | 1.06 × 10⁻⁴ | 5.02 |
| 214804_at | CENPI | centromere protein I | 5.29 × 10⁻² | 1.96 | 208086_s_at | DMD | dystrophin | 2.36 × 10⁻² | 1.58 |
| 207590_s_at | CENPI | centromere protein I | 1.62 × 10⁻² | 1.88 | 227081_at | DNALI1 | dynein, axonemal, light intermediate chain 1 | 2.64 × 10⁻² | 1.64 |
| 223513_at | CENPJ | centromere protein J | 2.83 × 10⁻² | 1.69 | 226875_at | DOCK11 | dedicator of cytokinesis 11 | 4.24 × 10⁻⁴ | 1.78 |
| 222848_at | CENPK | centromere protein K | 1.00 × 10⁻¹ | 1.94 | 1554863_s_at | DOK5 | docking protein 5 | 1.93 × 10⁻² | 1.59 |
| 1554271_a_at | CENPL | centromere protein L | 1.69 × 10⁻¹ | 1.54 | 214844_s_at | DOK5 | docking protein 5 | 2.98 × 10⁻³ | 1.52 |
| 218741_at | CENPM | centromere protein M | 1.86 × 10⁻² | 2.36 | 220161_s_at | EPB41L4B | erythrocyte membrane protein band 4.1 like 4B | 5.64 × 10⁻² | 2.33 |
| 219555_s_at | CENPN | centromere protein N | 9.25 × 10⁻³ | 1.89 | 209829_at | FAM65B | family with sequence similarity 65, member B | 3.97 × 10⁻² | 2.58 |
| 222118_at | CENPN | centromere protein N | 1.24 × 10⁻¹ | 1.84 | 206707_x_at | FAM65B | family with sequence similarity 65, member B | 3.02 × 10⁻² | 2.20 |
| 228559_at | CENPN | centromere protein N | 8.63 × 10⁻² | 1.74 | 226129_at | FAM83H | family with sequence similarity 83, member H | 2.04 × 10⁻² | 1.75 |
| 226118_at | CENPO | centromere protein O | 6.22 × 10⁻² | 1.78 | 227948_at | FGD4 | FYVE, RhoGEF and PH domain containing 4 | 9.89 × 10⁻⁴ | 3.94 |
| 219294_at | CENPQ | centromere protein Q | 5.50 × 10⁻² | 1.56 | 230559_x_at | FGD4 | FYVE, RhoGEF and PH domain containing 4 | 3.65 × 10⁻³ | 2.66 |
| 205642_at | CEP110 | centrosomal protein 110 kDa | 6.59 × 10⁻³ | 1.87 | 225167_at | FRMD4A | FERM domain containing 4A | 1.45 × 10⁻² | 2.04 |
| 239413_at | CEP152 | centrosomal protein 152 kDa | 3.34 × 10⁻³ | 1.71 | 225163_at | FRMD4A | FERM domain containing 4A | 8.39 × 10⁻³ | 1.98 |
| 218542_at | CEP55 | centrosomal protein 55 kDa | 2.63 × 10⁻² | 2.44 | 225168_at | FRMD4A | FERM domain containing 4A | 2.22 × 10⁻² | 1.76 |
| 206324_s_at | DAPK2 | death-associated protein kinase 2 | 7.47 × 10⁻² | 1.73 | 1560031_at | FRMD4A | FERM domain containing 4A | 1.07 × 10⁻³ | 1.71 |
| 227666_at | DCLK2 | doublecortin-like kinase 2 | 7.38 × 10⁻² | 1.52 | 208476_s_at | FRMD4A | FERM domain containing 4A | 7.85 × 10⁻³ | 1.69 |
| 207147_at | DLX2 | distal-less homeobox 2 | 1.94 × 10⁻² | 6.12 | 1554034_a_at | FRMD4A | FERM domain containing 4A | 2.32 × 10⁻¹ | 1.57 |
| 215116_s_at | DNM1 | dynamin 1 | 2.03 × 10⁻⁴ | 3.83 | 239290_at | FRMPD4 | FERM and PDZ domain containing 4 | 1.74 × 10⁻¹ | 1.56 |
| 219279_at | DOCK10 | dedicator of cytokinesis 10 | 2.60 × 10⁻² | 1.66 | 203037_s_at | MTSS1 | metastasis suppressor 1 | 2.31 × 10⁻³ | 4.32 |
| 213160_at | DOCK2 | dedicator of cytokinesis 2 | 1.12 × 10⁻⁴ | 1.76 | 212096_s_at | MTUS1 | mitochondrial tumor supp 1 | 1.02 × 10⁻¹ | 2.47 |
| 205003_at | DOCK4 | dedicator of cytokinesis 4 | 1.44 × 10⁻¹ | 1.54 | 212095_s_at | MTUS1 | mitochondrial tumor supp 1 | 1.08 × 10⁻¹ | 1.74 |
| 206710_s_at | EPB41L3 | erythrocyte membrane protein band 4.1-like 3 | 1.31 × 10⁻² | 3.52 | 228098_s_at | MYLIP | myosin regulatory light chain interacting protein | 5.16 × 10⁻² | 1.57 |
| 212681_at | EPB41L3 | erythrocyte membrane protein band 4.1-like 3 | 1.38 × 10⁻² | 3.22 | 220319_s_at | MYLIP | myosin regulatory light chain interacting protein | 4.55 × 10⁻² | 1.50 |
| 211776_s_at | EPB41L3 | erythrocyte membrane protein band 4.1-like 3 | 1.48 × 10⁻² | 3.20 | 237206_at | MYOCD | myocardin | 8.62 × 10⁻³ | 3.85 |
| 218980_at | FHOD3 | formin homology 2 domain containing 3 | 7.93 × 10⁻³ | 3.13 | 213782_s_at | MYOZ2 | myozenin 2 | 8.68 × 10⁻² | 2.16 |
| 238621_at | FMN1 | formin 1 | 6.44 × 10⁻³ | 2.47 | 207148_x_at | MYOZ2 | myozenin 2 | 8.91 × 10⁻² | 2.07 |
| 1555471_a_at | FMN2 | formin 2 | 2.05 × 10⁻² | 1.85 | 219073_s_at | OSBPL10 | oxysterol binding protein-like 10 | 3.31 × 10⁻² | 2.11 |
| 223618_at | FMN2 | formin 2 | 2.05 × 10⁻² | 1.82 | 209621_s_at | PDLIM3 | PDZ and LIM domain 3 | 8.38 × 10⁻² | 3.31 |
| 215017_s_at | FNBP1L | formin binding protein 1-like | 3.68 × 10⁻³ | 1.52 | 213684_s_at | PDLIM5 | PDZ and LIM domain 5 | 6.28 × 10⁻³ | 1.87 |
| 230645_at | FRMD3 | FERM domain containing 3 | 2.69 × 10⁻¹ | 1.63 | 221994_at | PDLIM5 | PDZ and LIM domain 5 | 2.46 × 10⁻³ | 1.81 |
| 230831_at | FRMD5 | FERM domain containing 5 | 1.02 × 10⁻² | 2.87 | 203242_s_at | PDLIM5 | PDZ and LIM domain 5 | 1.86 × 10⁻³ | 1.68 |
| 238756_at | GAS2L3 | Growth arrest-specific 2 like 3 | 1.22 × 10⁻² | 2.33 | 216804_s_at | PDLIM5 | PDZ and LIM domain 5 | 4.90 × 10⁻³ | 1.60 |
| 235709_at | GAS2L3 | growth arrest-specific 2 like 3 | 2.92 × 10⁻² | 1.81 | 207717_s_at | PKP2 | plakophilin 2 | 2.96 × 10⁻² | 3.09 |
| 226308_at | HAUS8 | HAUS augmin-like complex, subunit 8 | 3.75 × 10⁻² | 1.71 | 201927_s_at | PKP4 | plakophilin 4 | 2.90 × 10⁻¹ | 1.68 |
| 226364_at | HIP1 | Huntingtin interacting protein 1 | 1.05 × 10⁻³ | 2.73 | 227148_at | PLEKHH2 | pleckstrin homology domain containing, family H member 2 | 3.16 × 10⁻³ | 3.05 |
| 205425_at | HIP1 | huntingtin interacting protein 1 | 9.54 × 10⁻³ | 2.66 | 203407_at | PPL | periplakin | 7.99 × 10⁻³ | 3.20 |
| 218934_s_at | HSPB7 | heat shock 27 kDa protein family, member 7 (cardiovascular) | 7.51 × 10⁻² | 2.16 | 226627_at | SEPT8 | septin 8 | 1.20 × 10⁻¹ | 1.74 |
| 227750_at | KALRN | kalirin, RhoGEF kinase | 8.61 × 10⁻³ | 1.53 | 226438_at | SNTB1 | syntrophin, beta 1 (dystrophin-associated protein A1, 59 kDa, basic component 1) | 1.03 × 10⁻² | 1.84 |
| 229125_at | KANK4 | KN motif and ankyrin repeat domains 4 | 1.76 × 10⁻² | 3.51 | 214708_at | SNTB1 | syntrophin, beta 1 (dystrophin-associated protein A1, 59 kDa, basic component 1) | 3.83 × 10⁻² | 1.53 |
| 204444_at | KIF11 | kinesin family member 11 | 4.00 × 10⁻² | 2.43 | 227179_at | STAU2 | staufen, RNA binding protein, homolog 2 (Drosophila) | 1.58 × 10⁻² | 1.89 |
| 236641_at | KIF14 | kinesin family member 14 | 1.15 × 10⁻² | 3.50 | 212565_at | STK38L | serine/threonine kinase 38 like | 5.74 × 10⁻⁵ | 1.94 |
| 206364_at | KIF14 | kinesin family member 14 | 5.29 × 10⁻² | 2.87 | 212572_at | STK38L | serine/threonine kinase 38 like | 5.09 × 10⁻³ | 1.53 |
| 219306_at | KIF15 | kinesin family member 15 | 1.87 × 10⁻² | 2.65 | 202796_at | SYNPO | synaptopodin | 7.05 × 10⁻² | 2.18 |
| 221258_s_at | KIF18A | kinesin family member 18A | 1.25 × 10⁻² | 2.79 | 227662_at | SYNPO2 | synaptopodin 2 | 1.29 × 10⁻¹ | 3.30 |
| 222039_at | KIF18B | kinesin family member 18B | 6.34 × 10⁻² | 2.25 | 213135_at | TIAM1 | T-cell lymphoma invasion and metastasis 1 | 1.12 × 10⁻¹ | 1.65 |
| 218755_at | KIF20A | kinesin family member 20A | 1.17 × 10⁻² | 2.81 | 209904_at | TNNC1 | troponin C type 1 (slow) | 6.34 × 10⁻² | 2.76 |
| 205235_s_at | KIF20B | kinesin family member 20B | 1.83 × 10⁻² | 1.95 | 215389_s_at | TNNT2 | troponin T type 2 (cardiac) | 5.06 × 10⁻² | 3.22 |
| 216969_s_at | KIF22 | kinesin family member 22 | 9.75 × 10⁻² | 1.92 | 210276_s_at | TRIOBP | TRIO and F-actin binding prot | 6.96 × 10⁻² | 1.52 |
| 202183_s_at | KIF22 | kinesin family member 22 | 6.19 × 10⁻³ | 1.65 | 223279_s_at | UACA | uveal autoantigen with coiled-coil domains and ankyrin repeats | 6.84 × 10⁻³ | 1.79 |
| 204709_s_at | KIF23 | kinesin family member 23 | 3.68 × 10⁻² | 2.55 | 238868_at | UACA | uveal autoantigen with coiled-coil domains and ankyrin repeats | 1.37 × 10⁻¹ | 1.66 |
| 244427_at | KIF23 | Kinesin family member 23 | 2.68 × 10⁻³ | 1.76 | |||||
| 209408_at | KIF2C | kinesin family member 2C | 3.86 × 10⁻² | 2.95 | |||||
| 211519_s_at | KIF2C | kinesin family member 2C | 2.04 × 10⁻² | 2.80 | |||||
| 218355_at | KIF4A | kinesin family member 4A | 3.29 × 10⁻² | 2.60 | |||||
| 209680_s_at | KIFC1 | kinesin family member C1 | 1.72 × 10⁻² | 2.43 | |||||
| 206316_s_at | KNTC1 | kinetochore associated 1 | 1.88 × 10⁻² | 1.86 | |||||
| 224823_at | MYLK | myosin light chain kinase | 1.91 × 10⁻¹ | 1.72 | |||||
| 236718_at | MYO10 | myosin X | 1.05 × 10⁻³ | 1.86 | |||||
| 244350_at | MYO10 | myosin X | 1.45 × 10⁻² | 1.70 | |||||
| 241966_at | MYO5A | myosin VA (heavy chain 12, myoxin) | 2.21 × 10⁻² | 1.51 | |||||
| 201774_s_at | NCAPD2 | non-SMC condensin I complex, subunit D2 | 1.30 × 10⁻¹ | 1.57 | |||||
| 212789_at | NCAPD3 | non-SMC condensin II complex, subunit D3 | 5.55 × 10⁻² | 1.56 | |||||
| 218663_at | NCAPG | non-SMC condensin I complex, subunit G | 1.03 × 10⁻¹ | 2.23 | |||||
| 218662_s_at | NCAPG | non-SMC condensin I complex, subunit G | 8.24 × 10⁻² | 2.11 | |||||
| 219588_s_at | NCAPG2 | non-SMC condensin II complex, subunit G2 | 2.03 × 10⁻² | 1.86 | |||||
| 212949_at | NCAPH | non-SMC condensin I complex, subunit H | 3.01 × 10⁻² | 2.58 | |||||
| 204641_at | NEK2 | NIMA (never in mitosis gene a)-related kinase 2 | 2.34 × 10⁻² | 2.97 | |||||
| 211080_s_at | NEK2 | NIMA (never in mitosis gene a)-related kinase 2 | 4.89 × 10⁻³ | 2.64 | |||||
| 223381_at | NUF2 | NUF2, NDC80 kinetochore complex component, homolog (S. cerevisiae) | 8.44 × 10⁻² | 2.67 | |||||
| 219978_s_at | NUSAP1 | nucleolar and spindle associated protein 1 | 1.39 × 10⁻¹ | 2.48 | |||||
| 218039_at | NUSAP1 | nucleolar and spindle associated protein 1 | 2.98 × 10⁻² | 2.42 | |||||
| 204972_at | OAS2 | 2’-5’-oligoadenylate synthetase 2, 69/71 kDa | 2.83 × 10⁻¹ | 1.68 | |||||
| 209626_s_at | OSBPL3 | oxysterol binding protein-like 3 | 5.77 × 10⁻² | 1.67 | |||||
| 238575_at | OSBPL6 | oxysterol binding protein-like 6 | 1.17 × 10⁻² | 2.13 | |||||
| 223805_at | OSBPL6 | oxysterol binding protein-like 6 | 9.15 × 10⁻³ | 2.09 | |||||
| 218644_at | PLEK2 | pleckstrin 2 | 4.94 × 10⁻³ | 2.63 | |||||
| 218009_s_at | PRC1 | protein regulator of cytokinesis 1 | 2.03 × 10⁻² | 2.37 | |||||
| 222077_s_at | RACGAP1 | Rac GTPase activating protein 1 | 1.49 × 10⁻² | 1.99 | |||||
| 219263_at | RNF128 | ring finger protein 128 | 2.50 × 10⁻² | 3.03 | |||||
| 230730_at | SGCD | sarcoglycan, delta (35 kDa dystrophin-associated glycoprotein) | 2.17 × 10⁻² | 3.65 | |||||
| 213543_at | SGCD | sarcoglycan, delta (35 kDa dystrophin-associated glycoprotein) | 2.12 × 10⁻² | 3.57 | |||||
| 228602_at | SGCD | sarcoglycan, delta (35 kDa dystrophin-associated glycoprotein) | 6.41 × 10⁻² | 3.55 | |||||
| 214492_at | SGCD | sarcoglycan, delta (35 kDa dystrophin-associated glycoprotein) | 5.41 × 10⁻³ | 3.18 | |||||
| 210329_s_at | SGCD | sarcoglycan, delta (35 kDa dystrophin-associated glycoprotein) | 8.64 × 10⁻³ | 2.72 | |||||
| 210330_at | SGCD | sarcoglycan, delta (35 kDa dystrophin-associated glycoprotein) | 3.47 × 10⁻² | 2.43 | |||||
| 207302_at | SGCG | sarcoglycan, gamma (35 kDa dystrophin-associated glycoprotein) | 1.42 × 10⁻¹ | 3.09 | |||||
| 217678_at | SLC7A11 | solute carrier family 7, (cationic amino acid transporter, y+ system) member 11 | 7.43 × 10⁻² | 1.53 | |||||
| 209921_at | SLC7A11 | solute carrier family 7, (cationic amino acid transporter, y+ system) member 11 | 3.18 × 10⁻² | 1.53 | |||||
| 1556583_a_at | SLC8A1 | solute carrier family 8 (sodium/calcium exchanger), member 1 | 1.96 × 10⁻¹ | 1.85 | |||||
| 241752_at | SLC8A1 | solute carrier family 8 (sodium/calcium exchanger), member 1 | 2.94 × 10⁻¹ | 1.61 | |||||
| 200783_s_at | STMN1 | stathmin 1 | 1.16 × 10⁻² | 2.14 | |||||
| 222557_at | STMN3 | stathmin-like 3 | 1.48 × 10⁻² | 1.83 | |||||
| 212703_at | TLN2 | talin 2 | 5.18 × 10⁻⁴ | 1.84 | |||||
| 206117_at | TPM1 | tropomyosin 1 (alpha) | 5.66 × 10⁻³ | 2.26 | |||||
| 210052_s_at | TPX2 | TPX2, microtubule-associated, homolog (Xenopus laevis) | 1.78 × 10⁻² | 2.56 | |||||
| 1555938_x_at | VIM | vimentin | 2.81 × 10⁻² | 2.00 | |||||
| 202663_at | WIPF1 | WAS/WASL interacting protein family, member 1 | 6.39 × 10⁻³ | 1.64 | |||||
| 202664_at | WIPF1 | WAS/WASL interacting protein family, member 1 | 5.61 × 10⁻⁴ | 1.58 | |||||
| 202665_s_at | WIPF1 | WAS/WASL interacting protein family, member 1 | 2.97 × 10⁻³ | 1.51 | |||||
| Cytoskeleton | |||||||||
| Probe Set ID | Gene Symbol | Gene Title | adj-pval | FC | Probe Set ID | Gene Symbol | Gene Title | adj-pval | FC |
| 205132_at | ACTC1 | actin, alpha, cardiac muscle 1 | 1.80 × 10⁻³ | 4.22 | 203563_at | AFAP1 | actin filament associated protein 1 | 2.27 × 10⁻³ | 1.90 |
| 230925_at | APBB1IP | amyloid beta (A4) precursor protein-binding, family B, member 1 interacting protein | 1.66 × 10⁻² | 2.50 | 206488_s_at | CD36 | CD36 molecule (thrombospondin receptor) | 1.46 × 10⁻⁸ | 20.69 |
| 226292_at | CAPN5 | calpain 5 | 2.20 × 10⁻⁴ | 1.51 | 209555_s_at | CD36 | CD36 molecule (thrombospondin receptor) | 3.58 × 10⁻⁸ | 19.05 |
| 217523_at | CD44 | CD44 molecule (Indian blood group) | 1.89 × 10⁻² | 1.64 | 228766_at | CD36 | CD36 molecule (thrombospondin receptor) | 2.97 × 10⁻⁶ | 11.94 |
| 220115_s_at | CDH10 | cadherin 10, type 2 (T2-cadherin) | 1.94 × 10⁻¹ | 1.90 | 201005_at | CD9 | CD9 molecule | 7.82 × 10⁻⁴ | 2.58 |
| 207030_s_at | CSRP2 | cysteine and glycine-rich protein 2 | 1.93 × 10⁻² | 1.74 | 201131_s_at | CDH1 | cadherin 1, type 1, E-cadherin (epithelial) | 4.31 × 10⁻² | 2.54 |
| 211126_s_at | CSRP2 | cysteine and glycine-rich protein 2 | 2.34 × 10⁻² | 1.71 | 204726_at | CDH13 | cadherin 13, H-cadherin (heart) | 3.20 × 10⁻² | 2.60 |
| 214724_at | DIXDC1 | DIX domain containing 1 | 1.14 × 10⁻² | 1.53 | 203256_at | CDH3 | cadherin 3, type 1, P-cadherin (placental) | 3.21 × 10⁻² | 1.84 |
| 202668_at | EFNB2 | ephrin-B2 | 1.85 × 10⁻¹ | 3.24 | 200621_at | CSRP1 | cysteine and glycine-rich protein 1 | 1.70 × 10⁻² | 1.56 |
| 205031_at | EFNB3 | ephrin-B3 | 2.95 × 10⁻¹⁰ | 2.47 | 203716_s_at | DPP4 | dipeptidyl-peptidase 4 | 4.05 × 10⁻² | 1.93 |
| 1555480_a_at | FBLIM1 | filamin binding LIM protein 1 | 1.07 × 10⁻² | 1.89 | 211478_s_at | DPP4 | dipeptidyl-peptidase 4 | 2.67 × 10⁻¹ | 1.80 |
| 1554795_a_at | FBLIM1 | filamin binding LIM protein 1 | 2.26 × 10⁻² | 1.61 | 203717_at | DPP4 | dipeptidyl-peptidase 4 | 1.08 × 10⁻¹ | 1.67 |
| 225258_at | FBLIM1 | filamin binding LIM protein 1 | 2.87 × 10⁻³ | 1.56 | 227955_s_at | EFNA5 | ephrin-A5 | 4.68 × 10⁻² | 1.94 |
| 204379_s_at | FGFR3 | fibroblast growth factor receptor 3 | 9.77 × 10⁻² | 2.01 | 214036_at | EFNA5 | ephrin-A5 | 1.32 × 10⁻¹ | 1.53 |
| 242592_at | GPR137C | G protein-coupled receptor 137C | 1.50 × 10⁻² | 2.18 | 201983_s_at | EGFR | epidermal growth factor receptor (erythroblastic leukemia viral (v-erb-b) oncogene homolog, avian) | 1.75 × 10⁻³ | 1.82 |
| 235961_at | GPR161 | G protein-coupled receptor 161 | 4.34 × 10⁻⁴ | 1.56 | 201809_s_at | ENG | endoglin | 2.31 × 10⁻³ | 2.06 |
| 230369_at | GPR161 | G protein-coupled receptor 161 | 3.44 × 10⁻² | 1.53 | 201539_s_at | FHL1 | four and a half LIM domains 1 | 8.39 × 10⁻³ | 6.09 |
| 229055_at | GPR68 | G protein-coupled receptor 68 | 7.83 × 10⁻³ | 1.70 | 214505_s_at | FHL1 | four and a half LIM domains 1 | 6.48 × 10⁻³ | 5.76 |
| 234303_s_at | GPR85 | G protein-coupled receptor 85 | 7.25 × 10⁻² | 2.04 | 210299_s_at | FHL1 | four and a half LIM domains 1 | 1.55 × 10⁻³ | 5.39 |
| 203632_s_at | GPRC5B | G protein-coupled receptor, family C, group 5, member B | 1.76 × 10⁻¹ | 1.92 | 210298_x_at | FHL1 | four and a half LIM domains 1 | 6.70 × 10⁻³ | 5.18 |
| 222899_at | ITGA11 | integrin, alpha 11 | 1.21 × 10⁻² | 1.59 | 201540_at | FHL1 | four and a half LIM domains 1 | 4.21 × 10⁻⁴ | 3.20 |
| 227314_at | ITGA2 | integrin, alpha 2 (CD49B, alpha 2 subunit of VLA-2 receptor) | 5.68 × 10⁻² | 2.53 | 222853_at | FLRT3 | fibronectin leucine rich transmembrane protein 3 | 7.40 × 10⁻⁴ | 3.36 |
| 205032_at | ITGA2 | integrin, alpha 2 (CD49B, alpha 2 subunit of VLA-2 receptor) | 3.78 × 10⁻² | 2.41 | 219250_s_at | FLRT3 | fibronectin leucine rich transmembrane protein 3 | 4.52 × 10⁻² | 2.12 |
| 228080_at | LAYN | layilin | 4.84 × 10⁻³ | 2.59 | 212950_at | GPR116 | G protein-coupled receptor 116 | 1.98 × 10⁻¹ | 3.52 |
| 216250_s_at | LPXN | leupaxin | 2.03 × 10⁻⁵ | 3.08 | 213094_at | GPR126 | G protein-coupled receptor 126 | 9.65 × 10⁻⁴ | 5.14 |
| 210869_s_at | MCAM | melanoma cell adhesion molecule | 1.03 × 10⁻⁶ | 7.67 | 232267_at | GPR133 | G protein-coupled receptor 133 | 1.46 × 10⁻² | 2.44 |
| 209087_x_at | MCAM | melanoma cell adhesion molecule | 1.08 × 10⁻⁶ | 7.38 | 228949_at | GPR177 | G protein-coupled receptor 177 | 3.16 × 10⁻⁴ | 2.71 |
| 211340_s_at | MCAM | melanoma cell adhesion molecule | 1.07 × 10⁻⁶ | 6.81 | 228950_s_at | GPR177 | G protein-coupled receptor 177 | 3.49 × 10⁻³ | 2.63 |
| 209086_x_at | MCAM | melanoma cell adhesion molecule | 2.85 × 10⁻⁸ | 5.09 | 221958_s_at | GPR177 | G protein-coupled receptor 177 | 1.52 × 10⁻³ | 2.50 |
| 203062_s_at | MDC1 | mediator of DNA damage checkpoint 1 | 3.87 × 10⁻³ | 1.58 | 229105_at | GPR39 | G protein-coupled receptor 39 | 2.66 × 10⁻² | 1.90 |
| 212843_at | NCAM1 | neural cell adhesion molecule 1 | 8.99 × 10⁻⁷ | 4.58 | 212070_at | GPR56 | G protein-coupled receptor 56 | 2.12 × 10⁻² | 1.78 |
| 227394_at | NCAM1 | neural cell adhesion molecule 1 | 1.26 × 10⁻⁶ | 3.16 | 203108_at | GPRC5A | G protein-coupled receptor, family C, group 5, member A | 2.08 × 10⁻³ | 8.54 |
| 213438_at | NFASC | neurofascin homolog (chicken) | 3.12 × 10⁻² | 2.57 | 202638_s_at | ICAM1 | intercellular adhesion molecule 1 | 1.31 × 10⁻¹ | 2.21 |
| 230242_at | NFASC | neurofascin homolog (chicken) | 5.17 × 10⁻³ | 2.19 | 202637_s_at | ICAM1 | intercellular adhesion molecule 1 | 7.04 × 10⁻² | 1.70 |
| 243645_at | NFASC | neurofascin homolog (chicken) | 2.12 × 10⁻³ | 2.03 | 205885_s_at | ITGA4 | integrin, alpha 4 (antigen CD49D, alpha 4 subunit of VLA-4 receptor) | 2.52 × 10⁻¹ | 1.71 |
| 219773_at | NOX4 | NADPH oxidase 4 | 8.60 × 10⁻² | 1.80 | 216331_at | ITGA7 | integrin, alpha 7 | 1.01 × 10⁻² | 3.76 |
| 37966_at | PARVB | parvin, beta | 4.78 × 10⁻¹⁰ | 2.88 | 209663_s_at | ITGA7 | integrin, alpha 7 | 4.49 × 10⁻² | 3.70 |
| 204629_at | PARVB | parvin, beta | 2.58 × 10⁻⁸ | 2.28 | 204990_s_at | ITGB4 | integrin, beta 4 | 8.14 × 10⁻² | 1.67 |
| 37965_at | PARVB | parvin, beta | 7.26 × 10⁻⁵ | 1.98 | 226189_at | ITGB8 | integrin, beta 8 | 2.19 × 10⁻² | 1.69 |
| 216253_s_at | PARVB | parvin, beta | 4.90 × 10⁻³ | 1.80 | 220765_s_at | LIMS2 | LIM and senescent cell antigen-like domains 2 | 1.80 × 10⁻² | 1.80 |
| 225977_at | PCDH18 | protocadherin 18 | 4.98 × 10⁻³ | 2.18 | 226974_at | NEDD4L | neural precursor cell expressed, developmentally down-regulated 4-like | 4.84 × 10⁻² | 2.02 |
| 225975_at | PCDH18 | protocadherin 18 | 1.29 × 10⁻² | 1.76 | 212448_at | NEDD4L | neural precursor cell expressed, developmentally down-regulated 4-like | 9.48 × 10⁻² | 1.78 |
| 207011_s_at | PTK7 | PTK7 protein tyrosine kinase 7 | 3.74 × 10⁻³ | 2.23 | 212445_s_at | NEDD4L | neural precursor cell expressed, developmentally down-regulated 4-like | 1.04 × 10⁻¹ | 1.76 |
| 1555324_at | PTK7 | PTK7 protein tyrosine kinase 7 | 5.32 × 10⁻³ | 1.78 | 202150_s_at | NEDD9 | neural precursor cell expressed, developmentally down-regulated 9 | 3.21 × 10⁻³ | 1.97 |
| 207419_s_at | RAC2 | ras-related C3 botulinum toxin substrate 2 (rho family, small GTP binding protein Rac2) | 1.39 × 10⁻² | 2.37 | 202149_at | NEDD9 | neural precursor cell expressed, developmentally down-regulated 9 | 3.93 × 10⁻⁴ | 1.90 |
| 213603_s_at | RAC2 | ras-related C3 botulinum toxin substrate 2 (rho family, small GTP binding protein Rac2) | 8.95 × 10⁻³ | 2.13 | 228635_at | PCDH10 | protocadherin 10 | 2.55 × 10⁻³ | 3.91 |
| 223168_at | RHOU | ras homolog gene family, member U | 1.13 × 10⁻⁵ | 3.13 | 223435_s_at | PCDHA1 PCDHA10 PCDHA11 PCDHA12 PCDHA13 PCDHA2 PCDHA3 PCDHA4 PCDHA5 PCDHA6 PCDHA7 PCDHA8 PCDHA9 PCDHAC1 PCDHAC2 | protocadherin alpha 1 protocadherin alpha 10 protocadherin alpha 11 protocadherin alpha 12 protocadherin alpha 13 protocadherin alpha 2 protocadherin alpha 3 protocadherin alpha 4 protocadherin alpha 5 protocadherin alpha 6 protocadherin alpha 7 protocadherin alpha 8 protocadherin alpha 9 protocadherin alpha C, 1 protocadherin alpha C, 2 | 2.40 × 10⁻³ | 2.23 |
| 201286_at | SDC1 | syndecan 1 | 7.78 × 10⁻³ | 3.11 | 202565_s_at | SVIL | supervillin | 5.25 × 10⁻³ | 3.45 |
| 201287_s_at | SDC1 | syndecan 1 | 3.47 × 10⁻³ | 3.04 | 202566_s_at | SVIL | supervillin | 5.31 × 10⁻² | 2.32 |
| 202898_at | SDC3 | syndecan 3 | 2.98 × 10⁻² | 1.66 | 206702_at | TEK | TEK tyrosine kinase, endothelial | 4.91 × 10⁻⁴ | 3.67 |
| 218087_s_at | SORBS1 | sorbin and SH3 domain containing 1 | 1.05 × 10⁻² | 4.48 | |||||
| 222513_s_at | SORBS1 | sorbin and SH3 domain containing 1 | 3.04 × 10⁻² | 2.95 | |||||
| 208850_s_at | THY1 | Thy-1 cell surface antigen | 2.80 × 10⁻¹ | 1.91 | |||||
| 213869_x_at | THY1 | Thy-1 cell surface antigen | 1.38 × 10⁻¹ | 1.77 | |||||
| 208851_s_at | THY1 | Thy-1 cell surface antigen | 2.50 × 10⁻¹ | 1.70 | |||||
| 217853_at | TNS3 | tensin 3 | 5.51 × 10⁻⁵ | 2.61 | |||||
| 217979_at | TSPAN13 | tetraspanin 13 | 1.08 × 10⁻⁴ | 4.67 | |||||
| 227307_at | TSPAN18 | Tetraspanin 18 | 2.78 × 10⁻⁴ | 3.95 | |||||
| 227236_at | TSPAN2 | tetraspanin 2 | 1.85 × 10⁻¹ | 2.19 | |||||
| 214606_at | TSPAN2 | tetraspanin 2 | 1.19 × 10⁻¹ | 1.83 | |||||
| LINC Complexes | |||||||||
| Probe Set ID | Gene Symbol | Gene Title | adj-pval | FC | Probe Set ID | Gene Symbol | Gene Title | adj-pval | FC |
| 203145_at | SPAG5 | sperm associated antigen 5 | 2.63 × 10⁻² | 2.48 | 219888_at | SPAG4 | sperm associated antigen 4 | 8.03 × 10⁻² | 1.87 |
| Nucleoskeleton | |||||||||
| Probe Set ID | Gene Symbol | Gene Title | adj-pval | FC | Probe Set ID | Gene Symbol | Gene Title | adj-pval | FC |
| 205436_s_at | H2AFX | H2A histone family, member X | 1.88 × 10⁻² | 1.71 | 215071_s_at | HIST1H2AC | histone cluster 1, H2ac | 2.13 × 10⁻² | 1.70 |
| 214463_x_at | HIST1H4J | histone cluster 1, H4j | 1.24 × 10⁻² | 1.53 | 214455_at | HIST1H2BC | histone cluster 1, H2bc | 1.34 × 10⁻² | 1.71 |
| 201795_at | LBR | lamin B receptor | 8.68 × 10⁻⁴ | 1.88 | 236193_at | HIST1H2BC | histone cluster 1, H2bc | 1.57 × 10⁻² | 1.60 |
| 203276_at | LMNB1 | lamin B1 | 8.33 × 10⁻² | 2.42 | 209911_x_at | HIST1H2BD | histone cluster 1, H2bd | 1.63 × 10⁻² | 1.63 |
| 209753_s_at | TMPO | thymopoietin | 5.06 × 10⁻³ | 1.98 | 208527_x_at | HIST1H2BE | histone cluster 1, H2be | 4.22 × 10⁻³ | 1.54 |
| 224944_at | TMPO | thymopoietin | 5.13 × 10⁻³ | 1.84 | 232035_at | HIST1H4B | Histone cluster 1, H4b | 5.60 × 10⁻³ | 1.96 |
| 209754_s_at | TMPO | thymopoietin | 2.51 × 10⁻² | 1.83 | 208180_s_at | HIST1H4B | Histone cluster 1, H4b | 1.34 × 10⁻¹ | 1.59 |
| 203432_at | TMPO | thymopoietin | 1.02 × 10⁻¹ | 1.64 | |||||
| Secreted Factors | |||||||||
| Probe Set ID | Gene Symbol | Gene Title | adj-pval | FC | Probe Set ID | Gene Symbol | Gene Title | adj-pval | FC |
| 205608_s_at | ANGPT1 | angiopoietin 1 | 1.27 × 10⁻⁴ | 3.04 | 231773_at | ANGPTL1 | angiopoietin-like 1 | 3.01 × 10⁻² | 2.12 |
| 205609_at | ANGPT1 | angiopoietin 1 | 7.38 × 10⁻⁶ | 2.97 | 224339_s_at | ANGPTL1 | angiopoietin-like 1 | 7.59 × 10⁻² | 1.71 |
| 213001_at | ANGPTL2 | angiopoietin-like 2 | 1.03 × 10⁻¹ | 1.50 | 239183_at | ANGPTL1 | angiopoietin-like 1 | 8.51 × 10⁻² | 1.50 |
| 220988_s_at | C1QTNF3 | C1q and tumor necrosis factor related protein 3 | 9.99 × 10⁻² | 1.78 | 221009_s_at | ANGPTL4 | angiopoietin-like 4 | 6.59 × 10⁻³ | 2.88 |
| 1405_i_at | CCL5 | chemokine (C-C motif) ligand 5 | 1.12 × 10⁻¹ | 1.56 | 223333_s_at | ANGPTL4 | angiopoietin-like 4 | 1.80 × 10⁻¹ | 2.11 |
| 203666_at | CXCL12 | chemokine (C-X-C motif) ligand 12 (stromal cell-derived factor 1) | 6.11 × 10⁻³ | 2.98 | 209546_s_at | APOL1 | apolipoprotein L, 1 | 1.42 × 10⁻¹ | 1.78 |
| 209687_at | CXCL12 | chemokine (C-X-C motif) ligand 12 (stromal cell-derived factor 1) | 1.99 × 10⁻² | 2.24 | 221087_s_at | APOL3 | apolipoprotein L, 3 | 6.19 × 10⁻² | 1.83 |
| 222484_s_at | CXCL14 | chemokine (C-X-C motif) ligand 14 | 5.41 × 10⁻⁴ | 7.47 | 205239_at | AREG | amphiregulin | 1.14 × 10⁻¹ | 1.75 |
| 218002_s_at | CXCL14 | chemokine (C-X-C motif) ligand 14 | 1.22 × 10⁻³ | 6.46 | 202701_at | BMP1 | bone morphogenetic protein 1 | 5.22 × 10⁻² | 1.54 |
| 204602_at | DKK1 | dickkopf homolog 1 (Xenopus laevis) | 2.42 × 10⁻² | 2.04 | 205289_at | BMP2 | bone morphogenetic protein 2 | 2.65 × 10⁻² | 2.54 |
| 219908_at | DKK2 | dickkopf homolog 2 (Xenopus laevis) | 7.38 × 10⁻⁴ | 4.54 | 205290_s_at | BMP2 | bone morphogenetic protein 2 | 8.44 × 10⁻² | 2.25 |
| 228952_at | ENPP1 | ectonucleotide pyrophosphatase/phosphodiesterase 1 | 5.77 × 10⁻⁷ | 4.95 | 211518_s_at | BMP4 | bone morphogenetic protein 4 | 1.68 × 10⁻² | 4.03 |
| 229088_at | ENPP1 | ectonucleotide pyrophosphatase/phosphodiesterase 1 | 5.38 × 10⁻⁷ | 4.83 | 206176_at | BMP6 | bone morphogenetic protein 6 | 2.52 × 10⁻² | 2.33 |
| 205066_s_at | ENPP1 | ectonucleotide pyrophosphatase/phosphodiesterase 1 | 3.10 × 10⁻⁵ | 4.76 | 239349_at | C1QTNF7 | C1q and tumor necrosis factor related protein 7 | 2.49 × 10⁻¹ | 1.53 |
| 205065_at | ENPP1 | ectonucleotide pyrophosphatase/phosphodiesterase 1 | 3.78 × 10⁻⁷ | 3.82 | 202357_s_at | C2 CFB | complement component 2 complement factor B | 3.16 × 10⁻³ | 3.85 |
| 205110_s_at | FGF13 | fibroblast growth factor 13 | 3.58 × 10⁻⁸ | 4.73 | 217767_at | C3 | complement component 3 | 2.71 × 10⁻¹ | 2.42 |
| 214240_at | GAL | galanin prepropeptide | 9.61 × 10⁻² | 1.59 | 208451_s_at | C4A C4B | complement component 4A (Rodgers blood group) complement component 4B (Chido blood group) | 1.98 × 10⁻¹ | 1.83 |
| 205505_at | GCNT1 | glucosaminyl (N-acetyl) transferase 1, core 2 (beta-1,6-N-acetylglucosaminyltransferase) | 1.70 × 10⁻⁵ | 1.66 | 206407_s_at | CCL13 | chemokine (C-C motif) ligand 13 | 8.28 × 10⁻² | 3.52 |
| 240509_s_at | GREM2 | gremlin 2, cysteine knot superfamily, homolog (Xenopus laevis) | 2.66 × 10⁻³ | 3.23 | 216598_s_at | CCL2 | chemokine (C-C motif) ligand 2 | 5.57 × 10⁻⁴ | 8.18 |
| 235504_at | GREM2 | gremlin 2, cysteine knot superfamily, homolog (Xenopus laevis) | 9.10 × 10⁻³ | 3.11 | 206508_at | CD70 | CD70 molecule | 1.14 × 10⁻¹ | 2.44 |
| 220794_at | GREM2 | gremlin 2, cysteine knot superfamily, homolog (Xenopus laevis) | 2.06 × 10⁻² | 2.76 | 213800_at | CFH | complement factor H | 8.63 × 10⁻⁵ | 6.48 |
| 206326_at | GRP | gastrin-releasing peptide | 3.05 × 10⁻² | 1.59 | 215388_s_at | CFH CFHR1 | complement factor H complement factor H-related 1 | 4.95 × 10⁻⁶ | 10.91 |
| 203821_at | HBEGF | heparin-binding EGF-like growth factor | 1.31 × 10⁻¹ | 1.64 | 206910_x_at | CFHR2 | complement factor H-related 2 | 8.81 × 10⁻³ | 1.60 |
| 203819_s_at | IGF2BP3 | insulin-like growth factor 2 mRNA binding protein 3 | 4.18 × 10⁻² | 2.51 | 209395_at | CHI3L1 | chitinase 3-like 1 (cartilage glycoprotein-39) | 1.10 × 10⁻² | 4.08 |
| 203820_s_at | IGF2BP3 | insulin-like growth factor 2 mRNA binding protein 3 | 6.30 × 10⁻² | 2.13 | 209396_s_at | CHI3L1 | chitinase 3-like 1 (cartilage glycoprotein-39) | 4.55 × 10⁻² | 1.94 |
| 212143_s_at | IGFBP3 | insulin-like growth factor binding protein 3 | 1.26 × 10⁻² | 1.54 | 206315_at | CRLF1 | cytokine receptor-like factor 1 | 8.40 × 10⁻³ | 3.23 |
| 227760_at | IGFBPL1 | insulin-like growth factor binding protein-like 1 | 3.76 × 10⁻³ | 1.94 | 209774_x_at | CXCL2 | chemokine (C-X-C motif) ligand 2 | 1.37 × 10⁻¹ | 3.03 |
| 204773_at | IL11RA | interleukin 11 receptor, alpha | 1.36 × 10⁻³ | 1.97 | 207850_at | CXCL3 | chemokine (C-X-C motif) ligand 3 | 2.50 × 10⁻¹ | 2.07 |
| 206172_at | IL13RA2 | interleukin 13 receptor, alpha 2 | 8.39 × 10⁻² | 3.56 | 219837_s_at | CYTL1 | cytokine-like 1 | 1.99 × 10⁻¹ | 2.02 |
| 227997_at | IL17RD | interleukin 17 receptor D | 9.70 × 10⁻² | 1.70 | 219501_at | ENOX1 | ecto-NOX disulfide-thiol exchanger 1 | 1.82 × 10⁻² | 2.35 |
| 222062_at | IL27RA | interleukin 27 receptor, alpha | 4.50 × 10⁻⁴ | 3.73 | 226213_at | ERBB3 | v-erb-b2 erythroblastic leukemia viral oncogene homolog 3 (avian) | 1.84 × 10⁻² | 2.49 |
| 205926_at | IL27RA | interleukin 27 receptor, alpha | 5.58 × 10⁻⁴ | 1.67 | 205738_s_at | FABP3 | fatty acid binding protein 3, muscle and heart (mammary-derived growth inhibitor) | 2.56 × 10⁻¹ | 1.70 |
| 226218_at | IL7R | interleukin 7 receptor | 9.41 × 10⁻² | 1.71 | 203980_at | FABP4 | fatty acid binding protein 4, adipocyte | 5.11 × 10⁻² | 2.16 |
| 205798_at | IL7R | interleukin 7 receptor | 1.78 × 10⁻¹ | 1.59 | 205117_at | FGF1 | fibroblast growth factor 1 (acidic) | 8.61 × 10⁻³ | 2.95 |
| 231798_at | NOG | noggin | 6.76 × 10⁻⁵ | 3.98 | 1552721_a_at | FGF1 | fibroblast growth factor 1 (acidic) | 1.47 × 10⁻² | 2.71 |
| 206343_s_at | NRG1 | neuregulin 1 | 6.34 × 10⁻³ | 2.68 | 208240_s_at | FGF1 | fibroblast growth factor 1 (acidic) | 9.05 × 10⁻² | 1.73 |
| 206237_s_at | NRG1 | neuregulin 1 | 7.90 × 10⁻² | 2.15 | 231382_at | FGF18 | Fibroblast growth factor 18 | 1.71 × 10⁻¹ | 2.09 |
| 208230_s_at | NRG1 | neuregulin 1 | 1.20 × 10⁻² | 1.90 | 211029_x_at | FGF18 | fibroblast growth factor 18 | 2.54 × 10⁻¹ | 1.64 |
| 204766_s_at | NUDT1 | nudix (nucleoside diphosphate linked moiety X)-type motif 1 | 2.22 × 10⁻⁵ | 1.59 | 221577_x_at | GDF15 | growth differentiation factor 15 | 3.41 × 10⁻² | 2.03 |
| 213131_at | OLFM1 | olfactomedin 1 | 1.82 × 10⁻¹ | 1.71 | 206614_at | GDF5 | growth differentiation factor 5 | 4.96 × 10⁻² | 2.01 |
| 213125_at | OLFML2B | olfactomedin-like 2B | 2.17 × 10⁻¹ | 1.93 | 201348_at | GPX3 | glutathione peroxidase 3 (plasma) | 2.15 × 10⁻² | 3.24 |
| 218162_at | OLFML3 | olfactomedin-like 3 | 3.28 × 10⁻² | 1.72 | 214091_s_at | GPX3 | glutathione peroxidase 3 (plasma) | 7.64 × 10⁻² | 1.99 |
| 222719_s_at | PDGFC | platelet derived growth factor C | 2.01 × 10⁻³ | 1.61 | 209960_at | HGF | hepatocyte growth factor (hepapoietin A; scatter factor) | 7.99 × 10⁻² | 3.24 |
| 201578_at | PODXL | podocalyxin-like | 1.11 × 10⁻² | 5.15 | 210997_at | HGF | hepatocyte growth factor (hepapoietin A; scatter factor) | 2.26 × 10⁻² | 2.96 |
| 210195_s_at | PSG1 | pregnancy specific beta-1-glycoprotein 1 | 2.14 × 10⁻¹ | 1.82 | 210998_s_at | HGF | hepatocyte growth factor (hepapoietin A; scatter factor) | 3.94 × 10⁻² | 1.80 |
| 208134_x_at | PSG2 | pregnancy specific beta-1-glycoprotein 2 | 1.56 × 10⁻³ | 3.17 | 210619_s_at | HYAL1 | hyaluronoglucosaminidase 1 | 1.86 × 10⁻³ | 3.19 |
| 203399_x_at | PSG3 | pregnancy specific beta-1-glycoprotein 3 | 8.06 × 10⁻³ | 3.33 | 209540_at | IGF1 | insulin-like growth factor 1 (somatomedin C) | 2.78 × 10⁻¹ | 1.97 |
| 215821_x_at | PSG3 | pregnancy specific beta-1-glycoprotein 3 | 2.08 × 10⁻² | 2.47 | 209542_x_at | IGF1 | insulin-like growth factor 1 (somatomedin C) | 2.03 × 10⁻¹ | 1.57 |
| 211741_x_at | PSG3 | pregnancy specific beta-1-glycoprotein 3 | 1.76 × 10⁻² | 2.22 | 202718_at | IGFBP2 | insulin-like growth factor binding protein 2, 36 kDa | 8.69 × 10⁻² | 3.80 |
| 204830_x_at | PSG5 | pregnancy specific beta-1-glycoprotein 5 | 8.14 × 10⁻³ | 3.53 | 201508_at | IGFBP4 | insulin-like growth factor binding protein 4 | 1.12 × 10⁻¹ | 1.68 |
| 209738_x_at | PSG6 | pregnancy specific beta-1-glycoprotein 6 | 7.00 × 10⁻³ | 3.35 | 203426_s_at | IGFBP5 | insulin-like growth factor binding protein 5 | 2.55 × 10⁻² | 3.31 |
| 208106_x_at | PSG6 | pregnancy specific beta-1-glycoprotein 6 | 4.99 × 10⁻³ | 3.26 | 211958_at | IGFBP5 | insulin-like growth factor binding protein 5 | 2.16 × 10⁻¹ | 2.76 |
| 209594_x_at | PSG9 | pregnancy specific beta-1-glycoprotein 9 | 5.91 × 10⁻³ | 3.49 | 1555997_s_at | IGFBP5 | insulin-like growth factor binding protein 5 | 1.64 × 10⁻¹ | 2.46 |
| 207733_x_at | PSG9 | pregnancy specific beta-1-glycoprotein 9 | 1.20 × 10⁻² | 3.03 | 203425_s_at | IGFBP5 | insulin-like growth factor binding protein 5 | 1.58 × 10⁻¹ | 1.80 |
| 212187_x_at | PTGDS | prostaglandin D2 synthase 21 kDa (brain) | 5.94 × 10⁻³ | 1.91 | 206295_at | IL18 | interleukin 18 (interferon-gamma-inducing factor) | 3.70 × 10⁻² | 3.75 |
| 211748_x_at | PTGDS | prostaglandin D2 synthase 21 kDa (brain) | 2.12 × 10⁻³ | 1.69 | 207526_s_at | IL1RL1 | interleukin 1 receptor-like 1 | 1.32 × 10⁻¹ | 2.07 |
| 206631_at | PTGER2 | prostaglandin E receptor 2 (subtype EP2), 53 kDa | 4.68 × 10⁻² | 1.71 | 242809_at | IL1RL1 | Interleukin 1 receptor-like 1 | 2.38 × 10⁻¹ | 1.60 |
| 211737_x_at | PTN | pleiotrophin | 7.25 × 10⁻² | 3.28 | 221111_at | IL26 | interleukin 26 | 4.68 × 10⁻² | 3.44 |
| 209465_x_at | PTN | pleiotrophin | 4.83 × 10⁻² | 3.24 | 209821_at | IL33 | interleukin 33 | 1.79 × 10⁻¹ | 1.50 |
| 209466_x_at | PTN | pleiotrophin | 1.03 × 10⁻¹ | 2.42 | 205207_at | IL6 | interleukin 6 (interferon, beta 2) | 2.42 × 10⁻⁴ | 3.20 |
| 209897_s_at | SLIT2 | slit homolog 2 (Drosophila) | 1.55 × 10⁻² | 1.98 | 204863_s_at | IL6ST | interleukin 6 signal transducer (gp130, oncostatin M receptor) | 1.97 × 10⁻² | 1.99 |
| 205016_at | TGFA | transforming growth factor, alpha | 4.19 × 10⁻² | 3.27 | 211000_s_at | IL6ST | interleukin 6 signal transducer (gp130, oncostatin M receptor) | 1.21 × 10⁻² | 1.88 |
| 203085_s_at | TGFB1 | transforming growth factor, beta 1 | 7.50 × 10⁻³ | 1.60 | 204926_at | INHBA | inhibin, beta A | 1.44 × 10⁻² | 2.47 |
| 236561_at | TGFBR1 | Transforming growth factor, beta receptor 1 | 4.05 × 10⁻² | 1.71 | 210511_s_at | INHBA | inhibin, beta A | 4.64 × 10⁻³ | 2.42 |
| 203887_s_at | THBD | thrombomodulin | 2.94 × 10⁻¹ | 2.27 | 205266_at | LIF | leukemia inhibitory factor (cholinergic differentiation factor) | 7.91 × 10⁻² | 2.44 |
| 239336_at | THBS1 | Thrombospondin 1 | 1.84 × 10⁻¹ | 1.58 | 219181_at | LIPG | lipase, endothelial | 3.51 × 10⁻² | 2.89 |
| 227420_at | TNFAIP8L1 | tumor necrosis factor, alpha-induced protein 8-like 1 | 3.38 × 10⁻³ | 1.71 | 205381_at | LRRC17 | leucine rich repeat containing 17 | 2.67 × 10⁻⁴ | 18.57 |
| 219478_at | WFDC1 | WAP four-disulfide core domain 1 | 3.17 × 10⁻² | 5.38 | 216320_x_at | MST1 | macrophage stimulating 1 (hepatocyte growth factor-like) | 1.05 × 10⁻¹ | 1.53 |
| 221029_s_at | WNT5B | wingless-type MMTV integration site family, member 5B | 5.20 × 10⁻⁴ | 2.39 | 231361_at | NLGN1 | Neuroligin 1 | 4.86 × 10⁻² | 3.33 |
| 223537_s_at | WNT5B | wingless-type MMTV integration site family, member 5B | 2.99 × 10⁻² | 1.65 | 205893_at | NLGN1 | neuroligin 1 | 7.72 × 10⁻² | 3.23 |
| 204501_at | NOV | nephroblastoma overexpressed gene | 2.01 × 10⁻² | 2.95 | |||||
| 214321_at | NOV | nephroblastoma overexpressed gene | 1.69 × 10⁻² | 2.60 | |||||
| 217525_at | OLFML1 | olfactomedin-like 1 | 5.70 × 10⁻² | 3.66 | |||||
| 213075_at | OLFML2A | olfactomedin-like 2A | 1.64 × 10⁻² | 2.12 | |||||
| 205729_at | OSMR | oncostatin M receptor | 6.53 × 10⁻² | 1.71 | |||||
| 224942_at | PAPPA | pregnancy-associated plasma protein A, pappalysin 1 | 2.20 × 10⁻² | 1.88 | |||||
| 1559400_s_at | PAPPA | pregnancy-associated plasma protein A, pappalysin 1 | 3.28 × 10⁻² | 1.84 | |||||
| 201981_at | PAPPA | pregnancy-associated plasma protein A, pappalysin 1 | 3.78 × 10⁻² | 1.74 | |||||
| 224940_s_at | PAPPA | pregnancy-associated plasma protein A, pappalysin 1 | 1.72 × 10⁻² | 1.73 | |||||
| 224941_at | PAPPA | pregnancy-associated plasma protein A, pappalysin 1 | 1.36 × 10⁻² | 1.69 | |||||
| 228128_x_at | PAPPA | pregnancy-associated plasma protein A, pappalysin 1 | 2.13 × 10⁻² | 1.64 | |||||
| 205560_at | PCSK5 | proprotein convertase subtilisin/kexin type 5 | 2.21 × 10⁻³ | 2.70 | |||||
| 213652_at | PCSK5 | Proprotein convertase subtilisin/kexin type 5 | 5.18 × 10⁻⁴ | 2.66 | |||||
| 205559_s_at | PCSK5 | proprotein convertase subtilisin/kexin type 5 | 1.23 × 10⁻³ | 2.52 | |||||
| 227759_at | PCSK9 | proprotein convertase subtilisin/kexin type 9 | 2.34 × 10⁻² | 1.97 | |||||
| 216867_s_at | PDGFA | platelet-derived growth factor alpha polypeptide | 2.46 × 10⁻² | 1.97 | |||||
| 222860_s_at | PDGFD | platelet derived growth factor D | 1.50 × 10⁻¹ | 1.57 | |||||
| 1555778_a_at | POSTN | periostin, osteoblast specific factor | 4.41 × 10⁻³ | 4.30 | |||||
| 214981_at | POSTN | periostin, osteoblast specific factor | 2.20 × 10⁻³ | 2.96 | |||||
| 210809_s_at | POSTN | periostin, osteoblast specific factor | 8.30 × 10⁻³ | 2.47 | |||||
| 207808_s_at | PROS1 | protein S (alpha) | 3.88 × 10⁻³ | 1.51 | |||||
| 213421_x_at | PRSS3 | protease, serine, 3 | 2.41 × 10⁻² | 2.68 | |||||
| 210367_s_at | PTGES | prostaglandin E synthase | 3.17 × 10⁻⁴ | 4.21 | |||||
| 207388_s_at | PTGES | prostaglandin E synthase | 4.23 × 10⁻² | 2.51 | |||||
| 224950_at | PTGFRN | prostaglandin F2 receptor negative regulator | 4.86 × 10⁻² | 1.78 | |||||
| 211892_s_at | PTGIS | prostaglandin I2 (prostacyclin) synthase | 4.91 × 10⁻² | 2.06 | |||||
| 210702_s_at | PTGIS | prostaglandin I2 (prostacyclin) synthase | 1.13 × 10⁻¹ | 1.70 | |||||
| 208131_s_at | PTGIS | prostaglandin I2 (prostacyclin) synthase | 2.43 × 10⁻² | 1.67 | |||||
| 211756_at | PTHLH | parathyroid hormone-like hormone | 6.78 × 10⁻² | 3.45 | |||||
| 206300_s_at | PTHLH | parathyroid hormone-like hormone | 7.08 × 10⁻² | 2.86 | |||||
| 210355_at | PTHLH | parathyroid hormone-like hormone | 1.70 × 10⁻¹ | 2.21 | |||||
| 206157_at | PTX3 | pentraxin-related gene, rapidly induced by IL-1 beta | 1.47 × 10⁻⁴ | 2.21 | |||||
| 201482_at | QSOX1 | quiescin Q6 sulfhydryl oxidase 1 | 2.19 × 10⁻³ | 1.68 | |||||
| 223824_at | RNLS | renalase, FAD-dependent amine oxidase | 5.18 × 10⁻⁴ | 1.74 | |||||
| 204035_at | SCG2 | secretogranin II (chromogranin C) | 2.66 × 10⁻² | 2.56 | |||||
| 205475_at | SCRG1 | scrapie responsive protein 1 | 6.88 × 10⁻⁷ | 7.73 | |||||
| 213716_s_at | SECTM1 | secreted and transmembrane 1 | 3.32 × 10⁻² | 3.29 | |||||
| 203071_at | SEMA3B | sema domain, immunoglobulin domain (Ig), short basic domain, secreted, (semaphorin) 3B | 6.35 × 10⁻² | 2.54 | |||||
| 203788_s_at | SEMA3C | sema domain, immunoglobulin domain (Ig), short basic domain, secreted, (semaphorin) 3C | 6.34 × 10⁻⁴ | 2.51 | |||||
| 203789_s_at | SEMA3C | sema domain, immunoglobulin domain (Ig), short basic domain, secreted, (semaphorin) 3C | 3.13 × 10⁻³ | 1.64 | |||||
| 33323_r_at | SFN | stratifin | 1.80 × 10⁻¹ | 2.42 | |||||
| 223122_s_at | SFRP2 | secreted frizzled-related prot 2 | 2.86 × 10⁻¹ | 2.33 | |||||
| 204051_s_at | SFRP4 | secreted frizzled-related prot 4 | 4.79 × 10⁻² | 4.23 | |||||
| 204052_s_at | SFRP4 | secreted frizzled-related prot 4 | 1.56 × 10⁻¹ | 2.58 | |||||
| 210665_at | TFPI | tissue factor pathway inhibitor (lipoprotein-associated coagulation inhibitor) | 4.02 × 10⁻² | 3.69 | |||||
| 210664_s_at | TFPI | tissue factor pathway inhibitor (lipoprotein-associated coagulation inhibitor) | 2.35 × 10⁻² | 3.50 | |||||
| 209676_at | TFPI | tissue factor pathway inhibitor (lipoprotein-associated coagulation inhibitor) | 2.96 × 10⁻² | 3.35 | |||||
| 213258_at | TFPI | tissue factor pathway inhibitor (lipoprotein-associated coagulation inhibitor) | 2.61 × 10⁻² | 3.24 | |||||
| 228121_at | TGFB2 | transforming growth factor, beta 2 | 1.08 × 10⁻⁶ | 5.13 | |||||
| 209909_s_at | TGFB2 | transforming growth factor, beta 2 | 5.47 × 10⁻⁵ | 3.64 | |||||
| 204731_at | TGFBR3 | transforming growth factor, beta receptor III | 2.06 × 10⁻¹ | 1.70 | |||||
| 203083_at | THBS2 | thrombospondin 2 | 4.84 × 10⁻⁶ | 2.83 | |||||
| 202644_s_at | TNFAIP3 | tumor necrosis factor, alpha-induced protein 3 | 1.61 × 10⁻³ | 3.88 | |||||
| 202643_s_at | TNFAIP3 | tumor necrosis factor, alpha-induced protein 3 | 4.35 × 10⁻³ | 3.52 | |||||
| 206025_s_at | TNFAIP6 | tumor necrosis factor, alpha-induced protein 6 | 1.57 × 10⁻² | 2.29 | |||||
| 206026_s_at | TNFAIP6 | tumor necrosis factor, alpha-induced protein 6 | 3.57 × 10⁻² | 2.15 | |||||
| 210260_s_at | TNFAIP8 | tumor necrosis factor, alpha-induced protein 8 | 5.99 × 10⁻⁴ | 2.01 | |||||
| 208296_x_at | TNFAIP8 | tumor necrosis factor, alpha-induced protein 8 | 1.11 × 10⁻³ | 1.94 | |||||
| 235737_at | TSLP | thymic stromal lymphopoietin | 1.72 × 10⁻¹ | 2.02 | |||||
| 210513_s_at | VEGFA | vascular endothelial growth factor A | 9.18 × 10⁻² | 1.57 | |||||
| 205648_at | WNT2 | wingless-type MMTV integration site family member 2 | 2.83 × 10⁻¹ | 2.08 | |||||
| UP in Dermal Fibroblasts | UP in MSCs | ||||||||
|---|---|---|---|---|---|---|---|---|---|
| Extracellular Matrix Genes | |||||||||
| Probe Set ID | Gene Symbol | Gene Title | adj-pval | FC | Probe Set ID | Gene Symbol | Gene Title | adj-pval | FC |
| 205679_x_at | ACAN | aggrecan | 8.39 × 10⁻²² | 25.41 | 209765_at | ADAM19 | ADAM metallopeptidase domain 19 (meltrin beta) | 7.41 × 10⁻²⁸ | 8.60 |
| 207692_s_at | ACAN | aggrecan | 7.55 × 10⁻²¹ | 23.23 | 226997_at | ADAMTS12 | ADAM metallopeptidase with thrombospondin type 1 motif, 12 | 9.13 × 10⁻¹³ | 4.00 |
| 217161_x_at | ACAN | aggrecan | 1.14 × 10⁻²⁰ | 20.79 | 214913_at | ADAMTS3 | ADAM metallopeptidase with thrombospondin type 1 motif, 3 | 1.26 × 10⁻¹⁰ | 4.41 |
| 232570_s_at | ADAM33 | ADAM metallopeptidase domain 33 | 2.07 × 10⁻⁹ | 4.20 | 1570351_at | ADAMTS6 | ADAM metallopeptidase with thrombospondin type 1 motif, 6 | 3.98 × 10⁻¹⁵ | 2.31 |
| 233868_x_at | ADAM33 | ADAM metallopeptidase domain 33 | 3.16 × 10⁻⁸ | 2.98 | 222043_at | CLU | clusterin | 5.59 × 10⁻⁴ | 2.05 |
| 214454_at | ADAMTS2 | ADAM metallopeptidase with thrombospondin type 1 motif, 2 | 4.55 × 10⁻¹⁴ | 2.74 | 225288_at | COL27A1 | collagen, type XXVII, alpha 1 | 3.75 × 10⁻⁹ | 2.35 |
| 229357_at | ADAMTS5 | ADAM metallopeptidase with thrombospondin type 1, motif, 5 | 1.26 × 10⁻¹⁶ | 22.33 | 213110_s_at | COL4A5 | collagen, type IV, alpha 5 | 2.61 × 10⁻³ | 3.17 |
| 219935_at | ADAMTS5 | ADAM metallopeptidase with thrombospondin type 1 motif, 5 | 6.18 × 10⁻¹⁶ | 21.71 | 204136_at | COL7A1 | collagen, type VII, alpha 1 | 5.86 × 10⁻⁵ | 2.46 |
| 235368_at | ADAMTS5 | ADAM metallopeptidase with thrombospondin type 1 motif, 5 | 1.86 × 10⁻¹⁵ | 11.70 | 223475_at | CRISPLD1 | cysteine-rich secretory protein LCCL domain containing 1 | 2.40 × 10⁻⁵ | 2.02 |
| 219087_at | ASPN | asporin | 3.78 × 10⁻¹⁵ | 18.79 | 201487_at | CTSC | cathepsin C | 2.84 × 10⁻¹³ | 3.90 |
| 224396_s_at | ASPN | asporin | 6.26 × 10⁻⁶ | 3.63 | 225646_at | CTSC | cathepsin C | 1.77 × 10⁻⁷ | 2.77 |
| 201262_s_at | BGN | biglycan | 4.64 × 10⁻¹⁰ | 3.10 | 225647_s_at | CTSC | cathepsin C | 4.24 × 10⁻⁷ | 2.64 |
| 213905_x_at | BGN | biglycan | 5.80 × 10⁻⁷ | 2.15 | 231234_at | CTSC | cathepsin C | 7.29 × 10⁻⁸ | 2.40 |
| 201261_x_at | BGN | biglycan | 1.53 × 10⁻⁶ | 2.00 | 229115_at | DYNC1H1 | dynein, cytoplasmic 1, heavy chain 1 | 8.64 × 10⁻⁵ | 2.02 |
| 241986_at | BMPER | BMP binding endothelial regulator | 1.17 × 10⁻⁹ | 2.75 | 207379_at | EDIL3 | EGF-like repeats and discoidin I-like domains 3 | 2.94 × 10⁻⁴ | 2.09 |
| 227526_at | CDON | Cdon homolog (mouse) | 1.16 × 10⁻⁶ | 2.34 | 226911_at | EGFLAM | EGF-like, fibronectin type III and laminin G domains | 5.99 × 10⁻⁵ | 3.25 |
| 209732_at | CLEC2B | C-type lectin domain family 2, member B | 9.58 × 10⁻¹⁸ | 66.68 | 203184_at | FBN2 | fibrillin 2 | 5.58 × 10⁻⁵ | 6.34 |
| 1556209_at | CLEC2B | C-type lectin domain family 2, member B | 4.34 × 10⁻⁶ | 4.46 | 236028_at | IBSP | integrin-binding sialoprotein | 1.83 × 10⁻³ | 2.85 |
| 205200_at | CLEC3B | C-type lectin domain family 3, member B | 1.76 × 10⁻¹² | 17.53 | 223689_at | IGF2BP1 | insulin-like growth factor 2 mRNA binding protein 1 | 1.37 × 10⁻¹⁷ | 5.58 |
| 217428_s_at | COL10A1 | collagen, type X, alpha 1 | 3.42 × 10⁻⁴ | 3.59 | 203819_s_at | IGF2BP3 | insulin-like growth factor 2 mRNA binding protein 3 | 1.72 × 10⁻²⁸ | 39.96 |
| 205941_s_at | COL10A1 | collagen, type X, alpha 1 | 5.32 × 10⁻⁴ | 3.30 | 203820_s_at | IGF2BP3 | insulin-like growth factor 2 mRNA binding protein 3 | 1.52 × 10⁻²⁹ | 30.51 |
| 231879_at | COL12A1 | collagen, type XII, alpha 1 | 7.44 × 10⁻¹⁵ | 5.04 | 216493_s_at | IGF2BP3 | insulin-like growth factor 2 mRNA binding protein 3 | 2.04 × 10⁻²² | 6.25 |
| 234951_s_at | COL12A1 | collagen, type XII, alpha 1 | 3.01 × 10⁻⁸ | 3.71 | 205206_at | KAL1 | Kallmann syndrome 1 sequence | 8.59 × 10⁻⁶ | 5.25 |
| 225664_at | COL12A1 | collagen, type XII, alpha 1 | 5.13 × 10⁻¹¹ | 2.60 | 202728_s_at | LTBP1 | latent transforming growth factor beta binding protein 1 | 3.50 × 10⁻¹² | 4.74 |
| 231766_s_at | COL12A1 | collagen, type XII, alpha 1 | 1.68 × 10⁻⁶ | 2.34 | 202729_s_at | LTBP1 | latent transforming growth factor beta binding protein 1 | 2.67 × 10⁻¹² | 3.43 |
| 203477_at | COL15A1 | collagen, type XV, alpha 1 | 2.08 × 10⁻¹¹ | 18.96 | 223614_at | MMP16 | matrix metallopeptidase 16 (membrane-inserted) | 7.85 × 10⁻¹¹ | 3.87 |
| 211966_at | COL4A2 | collagen, type IV, alpha 2 | 2.64 × 10⁻⁴ | 2.52 | 207012_at | MMP16 | matrix metallopeptidase 16 (membrane-inserted) | 4.43 × 10⁻¹³ | 3.63 |
| 226277_at | COL4A3BP | collagen, type IV, alpha 3 (Goodpasture antigen) binding protein | 6.82 × 10⁻³⁴ | 2.01 | 229346_at | NES | nestin | 6.51 × 10⁻¹⁸ | 6.19 |
| 229779_at | COL4A4 | collagen, type IV, alpha 4 | 2.16 × 10⁻⁶ | 3.00 | 218678_at | NES | nestin | 3.67 × 10⁻⁹ | 3.84 |
| 221900_at | COL8A2 | collagen, type VIII, alpha 2 | 1.22 × 10⁻⁷ | 4.76 | 201860_s_at | PLAT | plasminogen activator, tissue | 3.31 × 10⁻¹⁶ | 6.86 |
| 52651_at | COL8A2 | collagen, type VIII, alpha 2 | 3.02 × 10⁻⁸ | 3.51 | 205479_s_at | PLAU | plasminogen activator, urokinase | 4.34 × 10⁻²⁸ | 22.23 |
| 205713_s_at | COMP | cartilage oligomeric matrix protein | 1.03 × 10⁻²⁶ | 115.83 | 211668_s_at | PLAU | plasminogen activator, urokinase | 2.42 × 10⁻²⁰ | 12.30 |
| 226824_at | CPXM2 | carboxypeptidase X (M14 family), member 2 | 1.74 × 10⁻⁸ | 5.71 | 211924_s_at | PLAUR | plasminogen activator, urokinase receptor | 7.22 × 10⁻¹⁷ | 2.73 |
| 208978_at | CRIP2 | cysteine-rich protein 2 | 6.66 × 10⁻¹⁴ | 6.14 | 210845_s_at | PLAUR | plasminogen activator, urokinase receptor | 2.18 × 10⁻²² | 2.69 |
| 221541_at | CRISPLD2 | cysteine-rich secretory protein LCCL domain containing 2 | 1.80 × 10⁻⁵ | 2.74 | 206007_at | PRG4 | proteoglycan 4 | 1.12 × 10⁻⁶ | 2.17 |
| 204971_at | CSTA | cystatin A (stefin A) | 9.43 × 10⁻⁵ | 3.43 | 221872_at | RARRES1 | retinoic acid receptor responder (tazarotene induced) 1 | 5.43 × 10⁻¹⁹ | 6.46 |
| 209101_at | CTGF | connective tissue growth factor | 5.63 × 10⁻¹⁰ | 2.09 | 206392_s_at | RARRES1 | retinoic acid receptor responder (tazarotene induced) 1 | 1.34 × 10⁻¹⁶ | 4.46 |
| 200661_at | CTSA | cathepsin A | 5.53 × 10⁻¹⁷ | 2.18 | 222784_at | SMOC1 | SPARC related modular calcium binding 1 | 4.56 × 10⁻⁴ | 2.10 |
| 200766_at | CTSD | cathepsin D | 5.83 × 10⁻¹⁸ | 2.96 | 201858_s_at | SRGN | serglycin | 1.63 × 10⁻⁶ | 6.82 |
| 203657_s_at | CTSF | cathepsin F | 1.31 × 10−37 | 7.43 | 201859_at | SRGN | serglycin | 3.48 × 10⁻⁷ | 4.90 |
| 202295_s_at | CTSH | cathepsin H | 8.10 × 10⁻⁵ | 2.03 | 209277_at | TFPI2 | tissue factor pathway inhibitor 2 | 3.21 × 10⁻¹³ | 10.83 |
| 203758_at | CTSO | cathepsin O | 5.40 × 10⁻¹¹ | 2.37 | 209278_s_at | TFPI2 | tissue factor pathway inhibitor 2 | 4.82 × 10⁻¹² | 6.13 |
| 210042_s_at | CTSZ | cathepsin Z | 4.41 × 10⁻¹³ | 2.63 | 209909_s_at | TGFB2 | transforming growth factor, beta 2 | 1.36 × 10⁻⁹ | 7.65 |
| 209335_at | DCN | decorin | 2.15 × 10⁻¹⁷ | 5.05 | 228121_at | TGFB2 | transforming growth factor, beta 2 | 2.09 × 10⁻⁷ | 5.04 |
| 211896_s_at | DCN | decorin | 2.64 × 10⁻¹⁷ | 4.08 | 220407_s_at | TGFB2 | transforming growth factor, beta 2 | 2.05 × 10⁻⁹ | 3.60 |
| 211813_x_at | DCN | decorin | 1.62 × 10⁻¹⁶ | 3.47 | 201042_at | TGM2 | transglutaminase 2 | 7.33 × 10⁻¹² | 8.42 |
| 201893_x_at | DCN | decorin | 1.32 × 10⁻¹⁶ | 3.17 | 211573_x_at | TGM2 | transglutaminase 2 | 6.53 × 10⁻²⁵ | 4.14 |
| 213068_at | DPT | dermatopontin | 2.61 × 10⁻²² | 47.71 | 211003_x_at | TGM2 | transglutaminase 2 | 6.51 × 10⁻²³ | 3.00 |
| 207977_s_at | DPT | dermatopontin | 1.64 × 10⁻¹⁹ | 20.11 | 222835_at | THSD4 | thrombospondin, type I, domain containing 4 | 2.65 × 10⁻⁹ | 4.10 |
| 213071_at | DPT | dermatopontin | 2.41 × 10⁻¹⁸ | 14.09 | 226506_at | THSD4 | thrombospondin, type I, domain containing 4 | 3.76 × 10⁻⁷ | 3.35 |
| 209365_s_at | ECM1 | extracellular matrix protein 1 | 1.55 × 10⁻²⁶ | 3.53 | 202643_s_at | TNFAIP3 | tumor necrosis factor, alpha-induced protein 3 | 1.91 × 10⁻⁹ | 4.48 |
| 206101_at | ECM2 | extracellular matrix protein 2, female organ and adipocyte specific | 6.39 × 10⁻¹³ | 10.63 | 202644_s_at | TNFAIP3 | tumor necrosis factor, alpha-induced protein 3 | 2.35 × 10⁻⁸ | 3.98 |
| 201843_s_at | EFEMP1 | EGF-containing fibulin-like extracellular matrix protein 1 | 4.72 × 10⁻³ | 2.04 | 206025_s_at | TNFAIP6 | tumor necrosis factor, alpha-induced protein 6 | 4.06 × 10⁻⁵ | 2.04 |
| 209356_x_at | EFEMP2 | EGF-containing fibulin-like extracellular matrix protein 2 | 2.39 × 10⁻²¹ | 3.14 | |||||
| 212670_at | ELN | elastin | 0.00 × 10+00 | 34.17 | |||||
| 222885_at | EMCN | endomucin | 6.61 × 10⁻⁸ | 4.14 | |||||
| 227874_at | EMCN | endomucin | 6.01 × 10⁻⁶ | 2.25 | |||||
| 204363_at | F3 | coagulation factor III (thromboplastin, tissue factor) | 2.04 × 10⁻⁶ | 5.30 | |||||
| 202995_s_at | FBLN1 | fibulin 1 | 4.84 × 10⁻⁸ | 2.48 | |||||
| 203886_s_at | FBLN2 | fibulin 2 | 7.69 × 10⁻²¹ | 18.44 | |||||
| 203088_at | FBLN5 | fibulin 5 | 7.88 × 10⁻²⁸ | 10.14 | |||||
| 203638_s_at | FGFR2 | fibroblast growth factor receptor 2 | 1.16 × 10⁻¹¹ | 6.98 | |||||
| 227265_at | FGL2 | fibrinogen-like 2 | 1.58 × 10⁻⁵ | 6.33 | |||||
| 204834_at | FGL2 | fibrinogen-like 2 | 2.20 × 10⁻⁷ | 5.59 | |||||
| 202709_at | FMOD | fibromodulin | 4.30 × 10⁻²² | 8.88 | |||||
| 226930_at | FNDC1 | fibronectin type III domain containing 1 | 2.46 × 10⁻¹⁹ | 47.43 | |||||
| 226145_s_at | FRAS1 | Fraser syndrome 1 | 0.00 × 10+00 | 76.26 | |||||
| 202755_s_at | GPC1 | glypican 1 | 3.75 × 10⁻¹⁵ | 2.10 | |||||
| 204984_at | GPC4 | glypican 4 | 5.19 × 10⁻¹⁵ | 9.94 | |||||
| 204983_s_at | GPC4 | glypican 4 | 8.43 × 10⁻¹² | 5.40 | |||||
| 230204_at | HAPLN1 | hyaluronan and proteoglycan link protein 1 | 2.18 × 10⁻⁷ | 7.98 | |||||
| 205523_at | HAPLN1 | hyaluronan and proteoglycan link protein 1 | 5.24 × 10⁻⁷ | 7.86 | |||||
| 205524_s_at | HAPLN1 | hyaluronan and proteoglycan link protein 1 | 5.34 × 10⁻⁸ | 7.86 | |||||
| 230895_at | HAPLN1 | hyaluronan and proteoglycan link protein 1 | 6.93 × 10⁻⁷ | 7.40 | |||||
| 227262_at | HAPLN3 | hyaluronan and proteoglycan link protein 3 | 5.18 × 10⁻¹⁶ | 4.01 | |||||
| 235944_at | HMCN1 | hemicentin 1 | 5.33 × 10⁻⁸ | 4.24 | |||||
| 201185_at | HTRA1 | HtrA serine peptidase 1 | 3.62 × 10⁻¹⁰ | 3.08 | |||||
| 209541_at | IGF1 | insulin-like growth factor 1 (somatomedin C) | 4.41 × 10⁻⁶ | 2.51 | |||||
| 202718_at | IGFBP2 | insulin-like growth factor binding protein 2, 36 kDa | 1.20 × 10⁻² | 2.37 | |||||
| 212143_s_at | IGFBP3 | insulin-like growth factor binding protein 3 | 1.20 × 10⁻²³ | 28.32 | |||||
| 210095_s_at | IGFBP3 | insulin-like growth factor binding protein 3 | 5.39 × 10⁻¹⁹ | 9.31 | |||||
| 211959_at | IGFBP5 | insulin-like growth factor binding protein 5 | 2.35 × 10⁻¹¹ | 5.19 | |||||
| 203424_s_at | IGFBP5 | insulin-like growth factor binding protein 5 | 7.05 × 10⁻⁷ | 4.65 | |||||
| 211958_at | IGFBP5 | insulin-like growth factor binding protein 5 | 1.68 × 10⁻⁷ | 3.69 | |||||
| 1555997_s_at | IGFBP5 | insulin-like growth factor binding protein 5 | 9.64 × 10⁻⁶ | 2.41 | |||||
| 203426_s_at | IGFBP5 | insulin-like growth factor binding protein 5 | 2.17 × 10⁻⁴ | 2.08 | |||||
| 203851_at | IGFBP6 | insulin-like growth factor binding protein 6 | 2.87 × 10⁻⁷ | 2.03 | |||||
| 227760_at | IGFBPL1 | insulin-like growth factor binding protein-like 1 | 6.32 × 10⁻²⁰ | 2.75 | |||||
| 218574_s_at | LMCD1 | LIM and cysteine-rich domains 1 | 1.08 × 10⁻²⁰ | 5.35 | |||||
| 242767_at | LMCD1 | LIM and cysteine-rich domains 1 | 2.61 × 10⁻⁵ | 2.23 | |||||
| 201744_s_at | LUM | lumican | 3.33 × 10⁻⁹ | 2.53 | |||||
| 212713_at | MFAP4 | microfibrillar-associated prot 4 | 5.47 × 10⁻²⁵ | 11.79 | |||||
| 209758_s_at | MFAP5 | microfibrillar associated prot 5 | 8.86 × 10⁻⁹ | 9.84 | |||||
| 213765_at | MFAP5 | microfibrillar associated prot 5 | 1.07 × 10⁻⁷ | 9.67 | |||||
| 213764_s_at | MFAP5 | microfibrillar associated prot 5 | 8.21 × 10⁻⁸ | 8.97 | |||||
| 210605_s_at | MFGE8 | milk fat globule-EGF factor 8 protein | 2.85 × 10⁻⁸ | 3.58 | |||||
| 202291_s_at | MGP | matrix Gla protein | 5.61 × 10⁻⁵ | 5.61 | |||||
| 204475_at | MMP1 | matrix metallopeptidase 1 (interstitial collagenase) | 3.34 × 10⁻⁴ | 3.31 | |||||
| 204580_at | MMP12 | matrix metallopeptidase 12 (macrophage elastase) | 8.73 × 10⁻⁴ | 2.60 | |||||
| 205828_at | MMP3 | matrix metallopeptidase 3 (stromelysin 1, progelatinase) | 5.32 × 10⁻⁸ | 16.81 | |||||
| 213693_s_at | MUC1 | mucin 1, cell surface associated | 2.96 × 10⁻¹⁸ | 3.90 | |||||
| 207847_s_at | MUC1 | mucin 1, cell surface associated | 3.37 × 10⁻¹¹ | 3.78 | |||||
| 209596_at | MXRA5 | matrix-remodelling associated 5 | 6.87 × 10⁻²⁶ | 30.61 | |||||
| 235836_at | MXRA7 | matrix-remodelling associated 7 | 7.77 × 10⁻¹⁰ | 2.16 | |||||
| 213422_s_at | MXRA8 | matrix-remodelling associated 8 | 9.88 × 10⁻³⁰ | 2.13 | |||||
| 214321_at | NOV | nephroblastoma overexpressed gene | 6.98 × 10⁻²⁰ | 10.34 | |||||
| 204501_at | NOV | nephroblastoma overexpressed gene | 4.71 × 10⁻⁹ | 2.90 | |||||
| 1564494_s_at | P4HB | prolyl 4-hydroxylase, beta polypeptide | 7.83 × 10⁻²³ | 3.48 | |||||
| 219295_s_at | PCOLCE2 | procollagen C-endopeptidase enhancer 2 | 3.15 × 10⁻⁶ | 7.20 | |||||
| 226522_at | PODN | podocan | 3.74 × 10⁻¹² | 3.16 | |||||
| 1555778_a_at | POSTN | periostin, osteoblast specific factor | 1.43 × 10⁻³ | 2.70 | |||||
| 210809_s_at | POSTN | periostin, osteoblast specific factor | 3.60 × 10⁻⁴ | 2.31 | |||||
| 228224_at | PRELP | proline/arginine-rich end leucine-rich repeat protein | 1.49 × 10⁻¹³ | 6.34 | |||||
| 204223_at | PRELP | proline/arginine-rich end leucine-rich repeat protein | 3.05 × 10⁻¹⁰ | 4.16 | |||||
| 209496_at | RARRES2 | retinoic acid receptor responder (tazarotene induced) 2 | 5.58 × 10⁻⁹ | 4.86 | |||||
| 205923_at | RELN | reelin | 8.98 × 10⁻⁴ | 2.09 | |||||
| 228186_s_at | RSPO3 | R-spondin 3 homolog (Xenopus laevis) | 5.88 × 10⁻¹⁴ | 5.81 | |||||
| 202037_s_at | SFRP1 | secreted frizzled-related prot 1 | 1.60 × 10⁻⁴ | 2.53 | |||||
| 202035_s_at | SFRP1 | secreted frizzled-related prot 1 | 2.84 × 10⁻³ | 2.35 | |||||
| 202036_s_at | SFRP1 | secreted frizzled-related prot 1 | 3.39 × 10⁻³ | 2.18 | |||||
| 223122_s_at | SFRP2 | secreted frizzled-related prot 2 | 1.65 × 10⁻²⁹ | 54.89 | |||||
| 223121_s_at | SFRP2 | secreted frizzled-related prot 2 | 5.66 × 10⁻¹⁸ | 13.22 | |||||
| 203813_s_at | SLIT3 | slit homolog 3 (Drosophila) | 1.22 × 10⁻²¹ | 10.53 | |||||
| 223869_at | SOST | sclerosteosis | 1.85 × 10⁻⁷ | 4.21 | |||||
| 213247_at | SVEP1 | sushi, von Willebrand factor type A, EGF and pentraxin domain containing 1 | 5.98 × 10⁻¹³ | 5.61 | |||||
| 219552_at | SVEP1 | sushi, von Willebrand factor type A, EGF and pentraxin domain containing 1 | 8.40 × 10⁻¹¹ | 2.87 | |||||
| 205016_at | TGFA | transforming growth factor, alpha | 9.81 × 10⁻¹⁹ | 9.55 | |||||
| 203085_s_at | TGFB1 | transforming growth factor beta 1 | 9.57 × 10⁻¹⁴ | 2.17 | |||||
| 239336_at | THBS1 | Thrombospondin 1 | 7.00 × 10⁻²⁶ | 7.23 | |||||
| 201107_s_at | THBS1 | thrombospondin 1 | 7.00 × 10⁻²⁶ | 6.92 | |||||
| 201108_s_at | THBS1 | thrombospondin 1 | 5.67 × 10⁻²⁸ | 4.10 | |||||
| 235086_at | THBS1 | Thrombospondin 1 | 1.09 × 10⁻¹⁶ | 3.35 | |||||
| 215775_at | THBS1 | Thrombospondin 1 | 5.62 × 10⁻¹⁸ | 2.96 | |||||
| 201109_s_at | THBS1 | thrombospondin 1 | 7.70 × 10⁻²³ | 2.47 | |||||
| 201150_s_at | TIMP3 | TIMP metallopeptidase inhibitor 3 | 2.68 × 10⁻⁹ | 2.06 | |||||
| 201149_s_at | TIMP3 | TIMP metallopeptidase inhibitor 3 | 2.03 × 10⁻⁵ | 2.02 | |||||
| 201645_at | TNC | tenascin C | 6.48 × 10⁻⁷ | 2.67 | |||||
| 216005_at | TNC | Tenascin C | 1.97 × 10⁻³ | 2.27 | |||||
| 213451_x_at | TNXA / TNXB | tenascin XA pseudogene tenascin XB | 7.61 × 10⁻⁹ | 7.23 | |||||
| 206093_x_at | TNXA / TNXB | tenascin XA pseudogene tenascin XB | 3.25 × 10⁻⁸ | 6.27 | |||||
| 216333_x_at | TNXA / TNXB | tenascin XA pseudogene tenascin XB | 1.07 × 10⁻⁷ | 6.23 | |||||
| 208609_s_at | TNXB | tenascin XB | 2.48 × 10⁻⁵ | 3.26 | |||||
| 235616_at | TSHZ2 | teashirt zinc finger homeobox 2 | 8.68 × 10⁻⁸ | 2.28 | |||||
| 227899_at | VIT | vitrin | 6.33 × 10⁻¹⁰ | 3.99 | |||||
| 210102_at | VWA5A | von Willebrand factor A domain containing 5A | 9.24 × 10⁻⁶ | 2.64 | |||||
| Focal Adhesion Points | |||||||||
| Probe Set ID | Gene Symbol | Gene Title | adj-pval | FC | Probe Set ID | Gene Symbol | Gene Title | adj-pval | FC |
| 200965_s_at | ABLIM1 | actin binding LIM protein 1 | 5.19 × 10⁻⁵ | 2.74 | 206385_s_at | ANK3 | ankyrin 3, node of Ranvier (ankyrin G) | 4.82 × 10⁻⁸ | 3.98 |
| 205268_s_at | ADD2 | adducin 2 (beta) | 6.03 × 10⁻⁷ | 3.71 | 218950_at | ARAP3 | ArfGAP with RhoGAP domain, ankyrin repeat and PH domain 3 | 3.65 × 10⁻¹⁵ | 2.95 |
| 202022_at | ALDOC | aldolase C, fructose-bisphosphate | 6.50 × 10⁻²¹ | 6.09 | 227911_at | ARHGAP28 | Rho GTPase activating protein 28 | 2.26 × 10⁻¹¹ | 3.59 |
| 202920_at | ANK2 | ankyrin 2, neuronal | 7.80 × 10⁻⁸ | 3.58 | 206167_s_at | ARHGAP6 | Rho GTPase activating protein 6 | 1.68 × 10⁻⁸ | 2.90 |
| 213606_s_at | ARHGDIA | Rho GDP dissociation inhibitor (GDI) alpha | 2.12 × 10⁻¹⁵ | 2.88 | 1555812_a_at | ARHGDIB | Rho GDP dissociation inhibitor (GDI) beta | 4.29 × 10⁻⁵ | 2.17 |
| 201167_x_at | ARHGDIA | Rho GDP dissociation inhibitor (GDI) alpha | 2.10 × 10⁻¹⁴ | 2.36 | 218501_at | ARHGEF3 | Rho guanine nucleotide exchange factor (GEF) 3 | 1.16 × 10⁻¹⁵ | 3.82 |
| 222696_at | AXIN2 | axin 2 | 3.23 × 10⁻⁶ | 2.37 | 227372_s_at | BAIAP2L1 | BAI1-associated protein 2-like 1 | 6.04 × 10⁻¹⁴ | 2.08 |
| 227850_x_at | CDC42EP5 | CDC42 effector protein (Rho GTPase binding) 5 | 3.62 × 10⁻⁸ | 2.20 | 213373_s_at | CASP8 | caspase 8, apoptosis-related cysteine peptidase | 7.10 × 10⁻¹⁷ | 2.15 |
| 228739_at | CYS1 | cystin 1 | 4.46 × 10⁻²⁶ | 5.02 | 234936_s_at | CC2D2A | coiled-coil and C2 domain containing 2A | 3.92 × 10⁻²⁶ | 3.10 |
| 220559_at | EN1 | engrailed homeobox 1 | 2.00 × 10⁻¹⁹ | 15.83 | 203881_s_at | DMD | dystrophin | 8.99 × 10⁻⁵ | 2.84 |
| 206710_s_at | EPB41L3 | erythrocyte membrane protein band 4.1-like 3 | 4.86 × 10⁻⁴ | 3.86 | 242283_at | DNAH14 | dynein, axonemal, heavy chain 14 | 4.14 × 10⁻¹⁸ | 2.72 |
| 212681_at | EPB41L3 | erythrocyte membrane protein band 4.1-like 3 | 4.79 × 10⁻⁴ | 3.39 | 205186_at | DNALI1 | dynein, axonemal, light intermediate chain 1 | 3.02 × 10⁻¹² | 2.71 |
| 211776_s_at | EPB41L3 | erythrocyte membrane protein band 4.1-like 3 | 5.45 × 10⁻⁴ | 3.26 | 227081_at | DNALI1 | dynein, axonemal, light intermediate chain 1 | 1.38 × 10⁻⁶ | 2.00 |
| 226129_at | FAM83H | family with sequence similarity 83, member H | 1.37 × 10⁻⁹ | 2.03 | 212838_at | DNMBP | dynamin binding protein | 2.88 × 10⁻¹⁶ | 2.05 |
| 212288_at | FNBP1 | formin binding protein 1 | 9.29 × 10⁻¹⁹ | 2.31 | 228674_s_at | EML4 | echinoderm microtubule associated protein like 4 | 1.66 × 10⁻¹⁹ | 2.39 |
| 230389_at | FNBP1 | formin binding protein 1 | 2.64 × 10⁻¹¹ | 2.19 | 220386_s_at | EML4 | echinoderm microtubule associated protein like 4 | 1.34 × 10⁻¹⁶ | 2.32 |
| 230645_at | FRMD3 | FERM domain containing 3 | 8.23 × 10⁻¹² | 3.10 | 223068_at | EML4 | echinoderm microtubule associated protein like 4 | 3.04 × 10⁻²² | 2.18 |
| 229893_at | FRMD3 | FERM domain containing 3 | 1.74 × 10⁻¹⁰ | 2.18 | 201340_s_at | ENC1 | ectodermal-neural cortex (with BTB-like domain) | 4.58 × 10⁻⁷ | 2.76 |
| 226364_at | HIP1 | Huntingtin interacting prot 1 | 2.94 × 10⁻⁷ | 2.09 | 1555137_a_at | FGD6 | FYVE, RhoGEF and PH domain containing 6 | 2.15 × 10⁻⁸ | 2.23 |
| 209558_s_at | HIP1R | huntingtin interacting prot 1 related | 3.28 × 10⁻¹⁵ | 2.09 | 219901_at | FGD6 | FYVE, RhoGEF and PH domain containing 6 | 1.02 × 10⁻⁸ | 2.22 |
| 226352_at | JMY | junction mediating and regulatory protein, p53 cofactor | 1.44 × 10⁻¹⁵ | 5.56 | 225167_at | FRMD4A | FERM domain containing 4A | 2.68 × 10⁻¹⁹ | 4.09 |
| 241985_at | JMY | junction mediating and regulatory protein, p53 cofactor | 1.04 × 10⁻¹⁶ | 2.12 | 208476_s_at | FRMD4A | FERM domain containing 4A | 3.98 × 10⁻¹⁵ | 3.51 |
| 226534_at | KITLG | KIT ligand | 1.06 × 10⁻⁵ | 2.21 | 225163_at | FRMD4A | FERM domain containing 4A | 3.05 × 10⁻¹⁷ | 3.31 |
| 213371_at | LDB3 | LIM domain binding 3 | 1.66 × 10⁻² | 2.05 | 225168_at | FRMD4A | FERM domain containing 4A | 9.69 × 10⁻¹⁷ | 2.99 |
| 227219_x_at | MAP1LC3A | microtubule-associated protein 1 light chain 3 alpha | 1.93 × 10⁻¹⁸ | 2.79 | 1560031_at | FRMD4A | FERM domain containing 4A | 2.08 × 10⁻¹³ | 2.76 |
| 224378_x_at | MAP1LC3A | microtubule-associated protein 1 light chain 3 alpha | 2.64 × 10⁻¹⁴ | 2.72 | 230831_at | FRMD5 | FERM domain containing 5 | 1.24 × 10⁻¹⁹ | 6.37 |
| 232011_s_at | MAP1LC3A | microtubule-associated protein 1 light chain 3 alpha | 1.07 × 10⁻¹³ | 2.60 | 220773_s_at | GPHN | gephyrin | 9.51 × 10⁻¹⁹ | 2.13 |
| 208786_s_at | MAP1LC3B | microtubule-associated protein 1 light chain 3 beta | 5.66 × 10⁻³² | 2.26 | 223319_at | GPHN | gephyrin | 7.91 × 10⁻¹⁸ | 2.06 |
| 205442_at | MFAP3L | microfibrillar-associated protein 3-like | 6.52 × 10⁻¹⁴ | 6.61 | 202962_at | KIF13B | kinesin family member 13B | 1.09 × 10⁻¹⁹ | 2.74 |
| 204631_at | MYH2 | myosin, heavy chain 2, skeletal muscle, adult | 7.89 × 10⁻⁸ | 6.38 | 226003_at | KIF21A | kinesin family member 21A | 2.27 × 10⁻²⁵ | 2.33 |
| 201058_s_at | MYL9 | myosin, light chain 9, regulatory | 1.46 × 10⁻⁷ | 2.00 | 231875_at | KIF21A | kinesin family member 21A | 1.40 × 10⁻¹⁶ | 2.21 |
| 228098_s_at | MYLIP | myosin regulatory light chain interacting protein | 5.37 × 10⁻²⁷ | 7.57 | 225613_at | MAST4 | Microtubule associated serine/threonine kinase family member 4 | 2.87 × 10⁻¹⁶ | 3.50 |
| 223130_s_at | MYLIP | myosin regulatory light chain interacting protein | 1.59 × 10⁻²⁸ | 7.13 | 225611_at | MAST4 | Microtubule associated serine/threonine kinase family member 4 | 6.91 × 10⁻¹⁵ | 2.95 |
| 220319_s_at | MYLIP | myosin regulatory light chain interacting protein | 7.00 × 10⁻¹⁶ | 2.93 | 40016_g_at | MAST4 | microtubule associated serine/threonine kinase family member 4 | 5.49 × 10⁻¹⁵ | 2.43 |
| 223129_x_at | MYLIP | myosin regulatory light chain interacting protein | 1.25 × 10⁻¹⁴ | 2.03 | 213511_s_at | MTMR1 | myotubularin related protein 1 | 2.10 × 10⁻²⁰ | 2.23 |
| 202555_s_at | MYLK | myosin light chain kinase | 2.64 × 10⁻⁵ | 2.37 | 216095_x_at | MTMR1 | myotubularin related protein 1 | 4.13 × 10⁻²¹ | 2.09 |
| 224823_at | MYLK | myosin light chain kinase | 3.68 × 10⁻⁵ | 2.11 | 237206_at | MYOCD | myocardin | 7.88 × 10⁻³ | 2.36 |
| 212338_at | MYO1D | myosin ID | 3.13 × 10⁻¹⁴ | 8.06 | 219073_s_at | OSBPL10 | oxysterol binding protein-like 10 | 5.46 × 10⁻⁸ | 2.27 |
| 223464_at | OSBPL5 | oxysterol binding protein-like 5 | 1.87 × 10⁻¹⁷ | 2.26 | 219938_s_at | PSTPIP2 | proline-serine-threonine phosphatase interacting protein 2 | 9.14 × 10⁻¹³ | 2.08 |
| 209019_s_at | PINK1 | PTEN induced putative kinase 1 | 2.23 × 10⁻²⁶ | 2.64 | 223471_at | RAB3IP | RAB3A interacting protein (rabin3) | 4.80 × 10⁻²⁴ | 4.06 |
| 209018_s_at | PINK1 | PTEN induced putative kinase 1 | 8.46 × 10⁻²⁶ | 2.62 | 219045_at | RHOF | ras homolog gene family, member F (in filopodia) | 3.42 × 10⁻¹⁸ | 3.29 |
| 226627_at | SEPT8 | septin 8 | 1.33 × 10⁻⁹ | 2.22 | 219263_at | RNF128 | ring finger protein 128 | 3.33 × 10⁻³ | 2.11 |
| 230730_at | SGCD | sarcoglycan, delta (35 kDa dystrophin-associated glycoprotein) | 3.81 × 10⁻¹³ | 10.01 | 204967_at | SHROOM2 | shroom family member 2 | 2.29 × 10⁻¹⁴ | 15.26 |
| 213543_at | SGCD | sarcoglycan, delta (35 kDa dystrophin-associated glycoprotein) | 4.91 × 10⁻¹³ | 8.70 | 213109_at | TNIK | TRAF2 and NCK interacting kinase | 8.89 × 10⁻⁶ | 2.75 |
| 228602_at | SGCD | sarcoglycan, delta (35 kDa dystrophin-associated glycoprotein) | 1.66 × 10⁻⁸ | 5.55 | 213107_at | TNIK | TRAF2 and NCK interacting kinase | 1.18 × 10⁻⁴ | 2.51 |
| 210330_at | SGCD | sarcoglycan, delta (35 kDa dystrophin-associated glycoprotein) | 1.25 × 10⁻¹² | 4.80 | 216251_s_at | TTLL12 | tubulin tyrosine ligase-like family, member 12 | 1.63 × 10⁻¹⁷ | 2.07 |
| 210329_s_at | SGCD | sarcoglycan, delta (35 kDa dystrophin-associated glycoprotein) | 1.01 × 10⁻¹⁰ | 3.87 | 1552257_a_at | TTLL12 | tubulin tyrosine ligase-like family, member 12 | 1.20 × 10⁻¹⁸ | 2.00 |
| 214492_at | SGCD | sarcoglycan, delta (35 kDa dystrophin-associated glycoprotein) | 3.87 × 10⁻⁷ | 2.93 | 203702_s_at | TTLL4 | tubulin tyrosine ligase-like family, member 4 | 3.28 × 10⁻¹⁷ | 2.24 |
| 207302_at | SGCG | sarcoglycan, gamma (35 kDa dystrophin-associated glycoprotein) | 6.41 × 10⁻²⁸ | 38.26 | |||||
| 228400_at | SHROOM3 | shroom family member 3 | 1.15 × 10⁻²⁴ | 15.85 | |||||
| 225548_at | SHROOM3 | shroom family member 3 | 2.47 × 10⁻²⁴ | 11.91 | |||||
| 217678_at | SLC7A11 | solute carrier family 7, (cationic amino acid transporter, y+ system) member 11 | 1.52 × 10⁻⁷ | 2.36 | |||||
| 203516_at | SNTA1 | syntrophin, alpha 1 (dystrophin-associated protein A1, 59 kDa, acidic component) | 1.56 × 10⁻¹⁹ | 2.89 | |||||
| 201061_s_at | STOM | stomatin | 2.06 × 10⁻²³ | 2.38 | |||||
| 209306_s_at | SWAP70 | SWAP-70 protein | 3.61 × 10−37 | 2.22 | |||||
| 209307_at | SWAP70 | SWAP-70 protein | 3.18 × 10⁻²⁵ | 2.07 | |||||
| 209904_at | TNNC1 | troponin C type 1 (slow) | 6.23 × 10⁻⁵ | 2.12 | |||||
| 238688_at | TPM1 | Tropomyosin 1 (alpha) | 1.82 × 10⁻⁹ | 2.70 | |||||
| 206117_at | TPM1 | tropomyosin 1 (alpha) | 6.69 × 10⁻¹¹ | 2.33 | |||||
| 202479_s_at | TRIB2 | tribbles homolog 2 (Drosophila) | 1.37 × 10⁻¹¹ | 2.20 | |||||
| 202478_at | TRIB2 | tribbles homolog 2 (Drosophila) | 3.53 × 10⁻¹⁰ | 2.09 | |||||
| 213908_at | WHAMML1 /2 | WAS protein homolog associated with actin, golgi membranes and microtubules-like 1 /2 | 4.06 × 10⁻²¹ | 3.52 | |||||
| 1557261_at | WHAMML1 /2 | WAS protein homolog associated with actin, golgi membranes and microtubules-like 1 /2 | 2.06 × 10⁻¹⁵ | 3.26 | |||||
| Cytoskeleton | |||||||||
| Probe Set ID | Gene Symbol | Gene Title | adj-pval | FC | Probe Set ID | Gene Symbol | Gene Title | adj-pval | FC |
| 205132_at | ACTC1 | actin, alpha, cardiac muscle 1 | 1.23 × 10⁻³⁴ | 78.69 | 202274_at | ACTG2 | actin, gamma 2, smooth muscle, enteric | 6.12 × 10⁻¹⁰ | 13.98 |
| 220115_s_at | CDH10 | cadherin 10, type 2 (T2-cadherin) | 1.12 × 10⁻⁷ | 3.11 | 210517_s_at | AKAP12 | A kinase (PRKA) anchor protein 12 | 6.41 × 10⁻⁶ | 3.58 |
| 205532_s_at | CDH6 | cadherin 6, type 2, K-cadherin (fetal kidney) | 1.02 × 10⁻² | 2.36 | 227529_s_at | AKAP12 | A kinase (PRKA) anchor protein 12 | 1.17 × 10⁻² | 2.42 |
| 232898_at | DAB2 | disabled homolog 2, mitogen-responsive phosphoprotein (Drosophila) | 8.32 × 10⁻¹⁰ | 3.32 | 227530_at | AKAP12 | A kinase (PRKA) anchor protein 12 | 6.85 × 10⁻³ | 2.41 |
| 201279_s_at | DAB2 | disabled homolog 2, mitogen-responsive phosphoprotein (Drosophila) | 1.60 × 10⁻¹⁸ | 2.30 | 206298_at | ARHGAP22 | Rho GTPase activating protein 22 | 4.33 × 10⁻³⁰ | 4.16 |
| 201280_s_at | DAB2 | disabled homolog 2, mitogen-responsive phosphoprotein (Drosophila) | 3.78 × 10⁻²¹ | 2.28 | 201005_at | CD9 | CD9 molecule | 7.48 × 10⁻⁶ | 2.96 |
| 201278_at | DAB2 | disabled homolog 2, mitogen-responsive phosphoprotein (Drosophila) | 1.77 × 10⁻²³ | 2.26 | 214297_at | CSPG4 | chondroitin sulfate proteoglycan 4 | 8.70 × 10⁻⁵ | 2.37 |
| 210757_x_at | DAB2 | disabled homolog 2, mitogen-responsive phosphoprotein (Drosophila) | 4.14 × 10⁻¹⁸ | 2.17 | 220512_at | DLC1 | deleted in liver cancer 1 | 2.59 × 10⁻¹⁵ | 3.03 |
| 240873_x_at | DAB2 | disabled homolog 2, mitogen-responsive phosphoprotein (Drosophila) | 1.06 × 10⁻¹³ | 2.08 | 211478_s_at | DPP4 | dipeptidyl-peptidase 4 | 2.91 × 10⁻¹⁹ | 11.71 |
| 214724_at | DIXDC1 | DIX domain containing 1 | 1.31 × 10⁻⁹ | 2.20 | 203716_s_at | DPP4 | dipeptidyl-peptidase 4 | 2.07 × 10⁻²¹ | 10.11 |
| 224814_at | DPP7 | dipeptidyl-peptidase 7 | 1.13 × 10⁻²¹ | 2.61 | 203717_at | DPP4 | dipeptidyl-peptidase 4 | 9.35 × 10⁻¹⁹ | 6.79 |
| 205031_at | EFNB3 | ephrin-B3 | 1.05 × 10⁻⁹ | 2.43 | 217901_at | DSG2 | desmoglein 2 | 1.05 × 10⁻¹⁰ | 19.57 |
| 208228_s_at | FGFR2 | fibroblast growth factor receptor 2 | 9.30 × 10⁻¹⁰ | 3.71 | 1553105_s_at | DSG2 | desmoglein 2 | 4.29 × 10⁻⁹ | 7.96 |
| 204379_s_at | FGFR3 | fibroblast growth factor receptor 3 | 1.66 × 10⁻¹⁹ | 4.70 | 227955_s_at | EFNA5 | ephrin-A5 | 1.28 × 10⁻¹⁰ | 4.10 |
| 201539_s_at | FHL1 | four and a half LIM domains 1 | 2.10 × 10⁻⁴ | 2.76 | 214036_at | EFNA5 | ephrin-A5 | 1.68 × 10⁻⁷ | 2.33 |
| 214505_s_at | FHL1 | four and a half LIM domains 1 | 6.14 × 10⁻⁴ | 2.37 | 202669_s_at | EFNB2 | ephrin-B2 | 2.57 × 10⁻² | 2.16 |
| 210299_s_at | FHL1 | four and a half LIM domains 1 | 2.65 × 10⁻⁴ | 2.29 | 201983_s_at | EGFR | epidermal growth factor receptor | 3.46 × 10⁻¹⁰ | 2.10 |
| 210298_x_at | FHL1 | four and a half LIM domains 1 | 6.34 × 10⁻⁴ | 2.27 | 218796_at | FERMT1 | fermitin family homolog 1 (Drosophila) | 2.45 × 10⁻¹² | 4.17 |
| 208748_s_at | FLOT1 | flotillin 1 | 5.72 × 10⁻⁷ | 3.13 | 60474_at | FERMT1 | fermitin family homolog 1 (Drosophila) | 9.46 × 10⁻¹³ | 3.84 |
| 222899_at | ITGA11 | integrin, alpha 11 | 1.08 × 10⁻²¹ | 26.89 | 242422_at | G3BP1 | GTPase activating protein (SH3 domain) binding protein 1 | 3.82 × 10⁻⁵ | 2.28 |
| 215177_s_at | ITGA6 | integrin, alpha 6 | 9.34 × 10⁻¹¹ | 6.34 | 206383_s_at | G3BP2 | GTPase activating protein (SH3 domain) binding protein 2 | 1.94 × 10⁻¹⁷ | 2.17 |
| 201656_at | ITGA6 | integrin, alpha 6 | 5.30 × 10⁻¹¹ | 4.58 | 206074_s_at | HMGA1 | high mobility group AT-hook 1 | 8.66 × 10⁻²² | 2.89 |
| 214265_at | ITGA8 | integrin, alpha 8 | 7.06 × 10⁻⁷ | 4.79 | 208025_s_at | HMGA2 | high mobility group AT-hook 2 | 5.89 × 10⁻²⁹ | 22.82 |
| 227297_at | ITGA9 | integrin, alpha 9 | 6.70 × 10⁻⁸ | 2.35 | 1567224_at | HMGA2 | high mobility group AT-hook 2 | 2.78 × 10⁻²¹ | 4.79 |
| 202803_s_at | ITGB2 | integrin, beta 2 (complement component 3 receptor 3 and 4 subunit) | 9.97 × 10⁻⁹ | 2.63 | 1558683_a_at | HMGA2 | high mobility group AT-hook 2 | 3.31 × 10⁻²⁵ | 4.32 |
| 226189_at | ITGB8 | integrin, beta 8 | 8.02 × 10⁻¹⁴ | 6.70 | 1561633_at | HMGA2 | high mobility group AT-hook 2 | 4.45 × 10⁻²² | 3.95 |
| 205422_s_at | ITGBL1 | integrin, beta-like 1 (with EGF-like repeat domains) | 2.20 × 10⁻¹⁶ | 12.03 | 1558682_at | HMGA2 | high mobility group AT-hook 2 | 3.32 × 10⁻²² | 2.27 |
| 231993_at | ITGBL1 | Integrin, beta-like 1 (with EGF-like repeat domains) | 1.41 × 10⁻¹⁵ | 10.90 | 202638_s_at | ICAM1 | intercellular adhesion molecule 1 | 3.48 × 10⁻⁵ | 2.74 |
| 214927_at | ITGBL1 | integrin, beta-like 1 (with EGF-like repeat domains) | 2.34 × 10⁻¹³ | 8.91 | 202637_s_at | ICAM1 | intercellular adhesion molecule 1 | 6.68 × 10⁻⁸ | 2.33 |
| 1557080_s_at | ITGBL1 | integrin, beta-like 1 (with EGF-like repeat domains) | 1.48 × 10⁻¹² | 8.22 | 213620_s_at | ICAM2 | intercellular adhesion molecule 2 | 3.73 × 10⁻¹³ | 2.64 |
| 1557079_at | ITGBL1 | Integrin, beta-like 1 (with EGF-like repeat domains) | 3.54 × 10⁻¹⁶ | 7.56 | 213446_s_at | IQGAP1 | IQ motif containing GTPase activating protein 1 | 1.13 × 10⁻⁶ | 2.08 |
| 228080_at | LAYN | layilin | 8.17 × 10⁻¹⁰ | 2.89 | 206766_at | ITGA10 | integrin, alpha 10 | 2.50 × 10⁻⁶ | 4.61 |
| 220765_s_at | LIMS2 | LIM and senescent cell antigen-like domains 2 | 1.13 × 10⁻¹⁰ | 2.99 | 227314_at | ITGA2 | integrin, alpha 2 (CD49B, alpha 2 subunit of VLA-2 receptor) | 6.15 × 10⁻⁸ | 3.59 |
| 202674_s_at | LMO7 | LIM domain 7 | 4.31 × 10⁻¹⁴ | 2.85 | 205032_at | ITGA2 | integrin, alpha 2 (CD49B, alpha 2 subunit of VLA-2 receptor) | 4.90 × 10⁻⁷ | 2.82 |
| 242722_at | LMO7 | LIM domain 7 | 4.41 × 10⁻¹⁰ | 2.49 | 204627_s_at | ITGB3 | integrin, beta 3 (platelet glycoprotein IIIa, antigen CD61) | 9.77 × 10⁻⁹ | 2.61 |
| 213490_s_at | MAP2K2 | mitogen-activated protein kinase kinase 2 | 7.78 × 10⁻⁵ | 2.09 | 223800_s_at | LIMS3 | LIM and senescent cell antigen-like domains 3 | 4.73 × 10⁻¹⁹ | 4.89 |
| 213438_at | NFASC | neurofascin homolog (chicken) | 1.78 × 10⁻¹⁶ | 16.35 | 209615_s_at | PAK1 | p21 protein (Cdc42/Rac)-activated kinase 1 | 3.17 × 10⁻¹⁵ | 2.06 |
| 230242_at | NFASC | neurofascin homolog (chicken) | 2.51 × 10⁻¹² | 3.55 | 228635_at | PCDH10 | protocadherin 10 | 2.29 × 10⁻¹¹ | 16.71 |
| 243645_at | NFASC | neurofascin homolog (chicken) | 6.86 × 10⁻¹⁵ | 2.84 | 205534_at | PCDH7 | protocadherin 7 | 2.49 × 10⁻⁴ | 3.81 |
| 222455_s_at | PARVA | parvin, alpha | 5.02 × 10⁻²⁸ | 2.01 | 228640_at | PCDH7 | protocadherin 7 | 7.79 × 10⁻³ | 2.84 |
| 37965_at | PARVB | parvin, beta | 8.71 × 10⁻⁹ | 2.05 | 205535_s_at | PCDH7 | protocadherin 7 | 6.91 × 10⁻⁵ | 2.57 |
| 225977_at | PCDH18 | protocadherin 18 | 2.01 × 10⁻²⁴ | 7.05 | 219737_s_at | PCDH9 | protocadherin 9 | 2.28 × 10⁻³ | 2.60 |
| 225975_at | PCDH18 | protocadherin 18 | 5.95 × 10⁻²³ | 5.41 | 238419_at | PHLDB2 | pleckstrin homology-like domain, family B, member 2 | 1.23 × 10⁻⁸ | 3.41 |
| 223854_at | PCDHB10 | protocadherin beta 10 | 2.58 × 10⁻¹¹ | 2.37 | 214374_s_at | PPFIBP1 | PTPRF interacting protein, binding protein 1 (liprin beta 1) | 5.08 × 10⁻⁸ | 2.07 |
| 232099_at | PCDHB16 | protocadherin beta 16 | 7.07 × 10⁻¹⁵ | 3.65 | 203650_at | PROCR | protein C receptor, endothelial (EPCR) | 1.20 × 10⁻¹⁴ | 2.89 |
| 231725_at | PCDHB2 | protocadherin beta 2 | 1.82 × 10⁻³⁰ | 10.23 | 216915_s_at | PTPN12 | protein tyrosine phosphatase, non-receptor type 12 | 2.10 × 10⁻⁸ | 2.00 |
| 212841_s_at | PPFIBP2 | PTPRF interacting protein, binding protein 2 (liprin beta 2) | 9.85 × 10⁻³² | 4.48 | 202565_s_at | SVIL | supervillin | 3.65 × 10⁻⁶ | 2.95 |
| 207011_s_at | PTK7 | PTK7 protein tyrosine kinase 7 | 1.50 × 10⁻⁶ | 2.06 | 206702_at | TEK | TEK tyrosine kinase, endothelial | 3.34 × 10⁻¹⁵ | 13.28 |
| 227557_at | SCARF2 | scavenger receptor class F, member 2 | 1.76 × 10⁻¹⁸ | 2.42 | 223314_at | TSPAN14 | tetraspanin 14 | 1.52 × 10⁻¹⁵ | 2.71 |
| 212154_at | SDC2 | syndecan 2 | 1.02 × 10⁻¹⁴ | 2.45 | 221002_s_at | TSPAN14 | tetraspanin 14 | 2.48 × 10⁻¹⁵ | 2.01 |
| 212157_at | SDC2 | syndecan 2 | 3.60 × 10⁻¹² | 2.16 | 209890_at | TSPAN5 | tetraspanin 5 | 5.39 × 10⁻²⁶ | 2.00 |
| 212158_at | SDC2 | syndecan 2 | 7.05 × 10⁻¹³ | 2.10 | 203868_s_at | VCAM1 | vascular cell adhesion molecule 1 | 2.90 × 10⁻⁴ | 4.10 |
| 202898_at | SDC3 | syndecan 3 | 2.33 × 10⁻⁹ | 2.98 | |||||
| 226438_at | SNTB1 | syntrophin, beta 1 (dystrophin-associated protein A1, 59 kDa, basic component 1) | 2.90 × 10⁻⁴ | 2.11 | |||||
| 218087_s_at | SORBS1 | sorbin and SH3 domain containing 1 | 2.49 × 10⁻⁴ | 3.11 | |||||
| 222513_s_at | SORBS1 | sorbin and SH3 domain containing 1 | 4.61 × 10⁻³ | 2.00 | |||||
| 225728_at | SORBS2 | sorbin and SH3 domain containing 2 | 9.66 × 10⁻⁴ | 2.52 | |||||
| 204288_s_at | SORBS2 | sorbin and SH3 domain containing 2 | 1.01 × 10⁻³ | 2.10 | |||||
| 202796_at | SYNPO | synaptopodin | 8.58 × 10⁻⁴ | 2.06 | |||||
| 225720_at | SYNPO2 | synaptopodin 2 | 8.30 × 10⁻¹⁶ | 15.40 | |||||
| 225895_at | SYNPO2 | synaptopodin 2 | 6.69 × 10⁻¹⁶ | 9.94 | |||||
| 225721_at | SYNPO2 | synaptopodin 2 | 2.22 × 10⁻¹⁶ | 9.02 | |||||
| 225894_at | SYNPO2 | synaptopodin 2 | 4.14 × 10⁻¹⁵ | 4.97 | |||||
| 40837_at | TLE2 | transducin-like enhancer of split 2 (E(sp1) homolog, Drosophila) | 1.54 × 10⁻¹⁵ | 3.71 | |||||
| 221747_at | TNS1 | tensin 1 | 4.25 × 10⁻¹⁰ | 2.00 | |||||
| 227307_at | TSPAN18 | Tetraspanin 18 | 2.81 × 10⁻⁹ | 4.58 | |||||
| 227236_at | TSPAN2 | tetraspanin 2 | 4.44 × 10⁻⁶ | 3.18 | |||||
| 209264_s_at | TSPAN4 | tetraspanin 4 | 3.72 × 10⁻¹¹ | 2.46 | |||||
| LINC Complexes | |||||||||
| Probe Set ID | Gene Symbol | Gene Title | adj-pval | FC | Probe Set ID | Gene Symbol | Gene Title | adj-pval | FC |
| 209230_s_at | NUPR1 | nuclear protein 1 | 2.43 × 10⁻¹⁵ | 12.15 | 206550_s_at | NUP155 | nucleoporin 155 kDa | 1.03 × 10⁻¹⁵ | 2.04 |
| 219888_at | SPAG4 | sperm associated antigen 4 | 1.16 × 10⁻⁹ | 3.27 | 225470_at | NUP35 | nucleoporin 35 kDa | 1.38 × 10⁻²¹ | 2.06 |
| 232027_at | SYNE1 | Spectrin repeat containing, nuclear envelope 1 | 1.61 × 10⁻¹⁷ | 6.92 | |||||
| 209447_at | SYNE1 | spectrin repeat containing, nuclear envelope 1 | 5.46 × 10⁻¹² | 2.25 | |||||
| Nucleoskeleton | |||||||||
| Probe Set ID | Gene Symbol | Gene Title | adj-pval | FC | Probe Set ID | Gene Symbol | Gene Title | adj-pval | FC |
| 215071_s_at | HIST1H2AC | histone cluster 1, H2ac | 8.12 × 10⁻⁹ | 2.61 | 227048_at | LAMA1 | laminin, alpha 1 | 7.19 × 10⁻¹¹ | 4.99 |
| 209911_x_at | HIST1H2BD | histone cluster 1, H2bd | 1.44 × 10⁻⁷ | 2.08 | 211651_s_at | LAMB1 | laminin, beta 1 | 2.68 × 10⁻²¹ | 2.83 |
| 214290_s_at | HIST2H2AA3 HIST2H2AA4 | histone cluster 2, H2aa3 histone cluster 2, H2aa4 | 1.07 × 10⁻¹⁰ | 2.38 | 201505_at | LAMB1 | laminin, beta 1 | 6.03 × 10⁻²⁰ | 2.43 |
| 218280_x_at | HIST2H2AA3 HIST2H2AA4 | histone cluster 2, H2aa3 histone cluster 2, H2aa4 | 8.30 × 10⁻¹¹ | 2.22 | 242918_at | NASP | Nuclear autoantigenic sperm protein (histone-binding) | 1.21 × 10⁻⁴ | 2.15 |
| 202708_s_at | HIST2H2BE | histone cluster 2, H2be | 1.53 × 10⁻⁸ | 2.20 | 201970_s_at | NASP | nuclear autoantigenic sperm protein (histone-binding) | 2.90 × 10⁻¹⁶ | 2.04 |
| 221582_at | HIST3H2A | histone cluster 3, H2a | 1.51 × 10⁻¹⁹ | 2.39 | 209754_s_at | TMPO | thymopoietin | 7.79 × 10⁻¹⁵ | 2.99 |
| 205116_at | LAMA2 | laminin, alpha 2 | 1.03 × 10⁻¹⁰ | 4.64 | 209753_s_at | TMPO | thymopoietin | 3.32 × 10⁻⁸ | 2.02 |
| 216840_s_at | LAMA2 | laminin, alpha 2 | 4.12 × 10⁻¹⁰ | 4.36 | |||||
| 213519_s_at | LAMA2 | laminin, alpha 2 | 1.78 × 10⁻¹⁰ | 3.97 | |||||
| 202202_s_at | LAMA4 | laminin, alpha 4 | 7.35 × 10⁻⁶ | 5.39 | |||||
| 210089_s_at | LAMA4 | laminin, alpha 4 | 1.39 × 10⁻⁷ | 3.10 | |||||
| 216264_s_at | LAMB2 | laminin, beta 2 (laminin S) | 1.72 × 10⁻²⁶ | 2.94 | |||||
| Secreted Factors | |||||||||
| Probe Set ID | Gene Symbol | Gene Title | adj-pval | FC | Probe Set ID | Gene Symbol | Gene Title | adj-pval | FC |
| 229819_at | A1BG | alpha-1-B glycoprotein | 1.21 × 10⁻¹⁴ | 2.11 | 204694_at | AFP | alpha-fetoprotein | 2.77 × 10⁻¹² | 2.11 |
| 202912_at | ADM | adrenomedullin | 9.27 × 10⁻¹⁰ | 2.59 | 221009_s_at | ANGPTL4 | angiopoietin-like 4 | 4.26 × 10⁻²⁵ | 21.5 |
| 205141_at | ANG | angiogenin, ribonuclease, RNase A family, 5 | 7.82 × 10⁻¹³ | 2.35 | 223333_s_at | ANGPTL4 | angiopoietin-like 4 | 1.89 × 10⁻²¹ | 11.7 |
| 213001_at | ANGPTL2 | angiopoietin-like 2 | 5.71 × 10⁻²³ | 7.43 | 205239_at | AREG | amphiregulin | 9.14 × 10⁻⁷ | 2.28 |
| 213004_at | ANGPTL2 | angiopoietin-like 2 | 9.64 × 10⁻²⁶ | 4.96 | 211518_s_at | BMP4 | bone morphogenetic protein 4 | 6.50 × 10⁻³ | 2.09 |
| 219514_at | ANGPTL2 | angiopoietin-like 2 | 4.12 × 10⁻²² | 2.90 | 209301_at | CA2 | carbonic anhydrase II | 1.60 × 10⁻⁶ | 8.34 |
| 238987_at | B4GALT1 | UDP-Gal:betaGlcNAc beta 1,4- galactosyltransferase, polypeptide 1 | 1.32 × 10⁻⁸ | 2.15 | 216598_s_at | CCL2 | chemokine (C-C motif) ligand 2 | 7.24 × 10⁻⁸ | 6.16 |
| 206176_at | BMP6 | bone morphogenetic protein 6 | 9.19 × 10⁻⁵ | 2.75 | 205476_at | CCL20 | chemokine (C-C motif) ligand 20 | 2.08 × 10⁻⁶ | 2.24 |
| 220988_s_at | C1QTNF3 | C1q and tumor necrosis factor related protein 3 | 7.54 × 10⁻⁹ | 2.28 | 208075_s_at | CCL7 | chemokine (C-C motif) ligand 7 | 2.99 × 10⁻⁹ | 2.30 |
| 223499_at | C1QTNF5 MFRP | C1q and tumor necrosis factor related protein 5 /membrane frizzled-related protein | 2.40 × 10⁻²⁵ | 8.01 | 215388_s_at | CFH CFHR1 | complement factor H complement factor H-related 1 | 1.27 × 10⁻³ | 2.82 |
| 235221_at | CBLN3 | cerebellin 3 precursor | 5.03 × 10⁻¹² | 2.22 | 209395_at | CHI3L1 | chitinase 3-like 1 (cartilage glycoprotein-39) | 9.49 × 10⁻⁵ | 5.50 |
| 209616_s_at | CES1 | carboxylesterase 1 (monocyte/macrophage serine esterase 1) | 1.15 × 10⁻⁴ | 2.88 | 209396_s_at | CHI3L1 | chitinase 3-like 1 (cartilage glycoprotein-39) | 3.39 × 10⁻⁴ | 3.69 |
| 205382_s_at | CFD | complement factor D (adipsin) | 2.42 × 10⁻¹⁸ | 5.81 | 235099_at | CMTM8 | CKLF-like MARVEL transmembrane domain containing 8 | 7.13 × 10⁻⁵ | 2.02 |
| 200884_at | CKB | creatine kinase, brain | 2.07 × 10⁻³¹ | 6.59 | 205832_at | CPA4 | carboxypeptidase A4 | 5.82 × 10⁻³ | 2.61 |
| 201117_s_at | CPE | carboxypeptidase E | 3.74 × 10⁻³² | 34.67 | 204470_at | CXCL1 | chemokine (C-X-C motif) ligand 1 | 2.10 × 10⁻⁸ | 9.57 |
| 201116_s_at | CPE | carboxypeptidase E | 9.98 × 10⁻³² | 26.80 | 209774_x_at | CXCL2 | chemokine (C-X-C motif) ligand 2 | 1.84 × 10⁻¹³ | 14.5 |
| 206100_at | CPM | carboxypeptidase M | 7.56 × 10⁻⁶ | 2.80 | 207850_at | CXCL3 | chemokine (C-X-C motif) ligand 3 | 3.30 × 10⁻¹⁷ | 15.1 |
| 201200_at | CREG1 | cellular repressor of E1A-stimulated genes 1 | 1.40 × 10⁻¹⁰ | 2.97 | 214974_x_at | CXCL5 | chemokine (C-X-C motif) ligand 5 | 5.88 × 10⁻¹¹ | 12.1 |
| 201360_at | CST3 | cystatin C | 6.04 × 10⁻¹⁵ | 2.23 | 215101_s_at | CXCL5 | chemokine (C-X-C motif) ligand 5 | 5.26 × 10⁻¹⁰ | 8.60 |
| 206595_at | CST6 | cystatin E/M | 6.70 × 10⁻¹³ | 7.45 | 206336_at | CXCL6 | chemokine (C-X-C motif) ligand 6 (granulocyte chemotactic protein 2) | 2.59 × 10⁻⁴ | 5.46 |
| 209687_at | CXCL12 | chemokine (C-X-C motif) ligand 12 (stromal cell-derived factor 1) | 2.68 × 10⁻¹⁰ | 8.12 | 213092_x_at | DNAJC9 | DnaJ (Hsp40) homolog, subfamily C, member 9 | 5.56 × 10⁻¹³ | 2.08 |
| 203666_at | CXCL12 | chemokine (C-X-C motif) ligand 12 (stromal cell-derived factor 1) | 1.08 × 10⁻⁷ | 6.47 | 201430_s_at | DPYSL3 | dihydropyrimidinase-like 3 | 3.53 × 10⁻¹¹ | 2.69 |
| 222484_s_at | CXCL14 | chemokine (C-X-C motif) ligand 14 | 2.55 × 10⁻¹⁴ | 8.48 | 201431_s_at | DPYSL3 | dihydropyrimidinase-like 3 | 1.07 × 10⁻¹¹ | 2.61 |
| 218002_s_at | CXCL14 | chemokine (C-X-C motif) ligand 14 | 1.02 × 10⁻¹³ | 7.50 | 206254_at | EGF | epidermal growth factor (beta-urogastrone) | 1.25 × 10⁻⁷ | 2.37 |
| 212977_at | CXCR7 | chemokine (C-X-C motif) receptor 7 | 2.78 × 10⁻¹³ | 17.10 | 1559072_a_at | ELFN2 | extracellular leucine-rich repeat and fibronectin type III domain containing 2 | 2.43 × 10⁻⁸ | 2.17 |
| 232746_at | CXCR7 | Chemokine (C-X-C motif) receptor 7 | 4.11 × 10⁻⁶ | 2.28 | 205767_at | EREG | epiregulin | 1.96 × 10⁻¹⁰ | 5.08 |
| 222996_s_at | CXXC5 | CXXC finger 5 | 1.25 × 10⁻⁹ | 2.33 | 208378_x_at | FGF5 | fibroblast growth factor 5 | 2.27 × 10⁻¹² | 2.17 |
| 233955_x_at | CXXC5 | CXXC finger 5 | 2.25 × 10⁻⁹ | 2.29 | 210310_s_at | FGF5 | fibroblast growth factor 5 | 5.16 × 10⁻¹¹ | 2.13 |
| 224516_s_at | CXXC5 | CXXC finger 5 | 1.17 × 10⁻⁸ | 2.19 | 206614_at | GDF5 | growth differentiation factor 5 | 1.17 × 10⁻¹⁷ | 6.75 |
| 207169_x_at | DDR1 | discoidin domain receptor tyrosine kinase 1 | 2.84 × 10⁻¹⁰ | 2.06 | 38037_at | HBEGF | heparin-binding EGF-like growth factor | 1.51 × 10⁻⁹ | 3.17 |
| 204602_at | DKK1 | dickkopf homolog 1 (Xenopus laevis) | 9.91 × 10⁻⁷ | 2.54 | 203821_at | HBEGF | heparin-binding EGF-like growth factor | 2.98 × 10⁻⁹ | 3.15 |
| 202196_s_at | DKK3 | dickkopf homolog 3 (Xenopus laevis) | 8.90 × 10⁻¹⁰ | 4.17 | 209960_at | HGF | hepatocyte growth factor (hepapoietin A; scatter factor) | 6.82 × 10⁻¹⁰ | 8.20 |
| 221127_s_at | DKK3 | dickkopf homolog 3 (Xenopus laevis) | 2.77 × 10⁻¹¹ | 3.45 | 210997_at | HGF | hepatocyte growth factor (hepapoietin A; scatter factor) | 2.11 × 10⁻⁶ | 4.34 |
| 214247_s_at | DKK3 | dickkopf homolog 3 (Xenopus laevis) | 1.33 × 10⁻⁸ | 2.71 | 210998_s_at | HGF | hepatocyte growth factor (hepapoietin A; scatter factor) | 1.82 × 10⁻⁴ | 2.28 |
| 230508_at | DKK3 | dickkopf homolog 3 (Xenopus laevis) | 8.73 × 10⁻⁵ | 2.07 | 206924_at | IL11 | interleukin 11 | 6.19 × 10⁻⁶ | 2.45 |
| 222802_at | EDN1 | endothelin 1 | 8.74 × 10⁻⁷ | 4.31 | 210118_s_at | IL1A | interleukin 1, alpha | 4.81 × 10⁻⁴ | 2.87 |
| 218995_s_at | EDN1 | endothelin 1 | 3.17 × 10⁻⁶ | 4.06 | 205067_at | IL1B | interleukin 1, beta | 1.25 × 10⁻⁵ | 5.09 |
| 227708_at | EEF1A1 | eukaryotic translation elongation factor 1 alpha 1 | 1.54 × 10⁻¹⁴ | 2.03 | 39402_at | IL1B | interleukin 1, beta | 4.60 × 10⁻⁵ | 4.09 |
| 201313_at | ENO2 | enolase 2 (gamma, neuronal) | 2.61 × 10⁻⁸ | 2.11 | 209821_at | IL33 | interleukin 33 | 5.24 × 10⁻⁵ | 2.71 |
| 210839_s_at | ENPP2 | ectonucleotide pyrophosphatase/phosphodiesterase 2 | 9.19 × 10⁻¹⁰ | 12.01 | 204863_s_at | IL6ST | interleukin 6 signal transducer (gp130, oncostatin M receptor) | 1.19 × 10⁻⁸ | 2.33 |
| 209392_at | ENPP2 | ectonucleotide pyrophosphatase/phosphodiesterase 2 | 2.29 × 10⁻¹⁰ | 10.40 | 211000_s_at | IL6ST | interleukin 6 signal transducer (gp130, oncostatin M receptor) | 3.36 × 10⁻⁸ | 2.17 |
| 205756_s_at | F8 | coagulation factor VIII, procoagulant component | 2.18 × 10⁻⁸ | 2.13 | 202859_x_at | IL8 | interleukin 8 | 4.66 × 10⁻⁸ | 8.46 |
| 226722_at | FAM20C | family with sequence similarity 20, member C | 3.87 × 10⁻⁷ | 2.58 | 211506_s_at | IL8 | interleukin 8 | 2.57 × 10⁻⁶ | 5.63 |
| 205110_s_at | FGF13 | fibroblast growth factor 13 | 7.54 × 10⁻⁹ | 3.02 | 204926_at | INHBA | inhibin, beta A | 1.82 × 10⁻¹⁴ | 4.83 |
| 204422_s_at | FGF2 | fibroblast growth factor 2 (basic) | 6.77 × 10⁻¹⁹ | 2.29 | 210511_s_at | INHBA | inhibin, beta A | 6.98 × 10⁻⁸ | 4.63 |
| 205782_at | FGF7 | fibroblast growth factor 7 (keratinocyte growth factor) | 1.37 × 10⁻¹¹ | 10.94 | 205266_at | LIF | leukemia inhibitory factor (cholinergic differentiation factor) | 4.28 × 10⁻¹⁰ | 6.74 |
| 1554741_s_at | FGF7 KGFLP1 KGFLP2 | fibroblast growth factor 7 (keratinocyte growth factor) keratinocyte growth factor-like protein 1 keratinocyte growth factor-like protein 2 | 6.50 × 10⁻¹¹ | 7.49 | 205381_at | LRRC17 | leucine rich repeat containing 17 | 5.79 × 10⁻¹³ | 42.4 |
| 206404_at | FGF9 | fibroblast growth factor 9 (glia-activating factor) | 1.50 × 10⁻⁵ | 2.74 | 207703_at | NLGN4Y | neuroligin 4, Y-linked | 6.00 × 10⁻⁹ | 5.96 |
| 209093_s_at | GBA GBAP | glucosidase, beta; acid (includes glucosylceramidase) glucosidase, beta; acid, pseudogene | 1.35 × 10⁻¹⁸ | 2.01 | 229838_at | NUCB2 | nucleobindin 2 | 4.07 × 10⁻²² | 2.21 |
| 205498_at | GHR | growth hormone receptor | 5.70 × 10⁻⁶ | 2.11 | 216867_s_at | PDGFA | platelet-derived growth factor alpha polypeptide | 4.78 × 10⁻¹⁰ | 3.93 |
| 220794_at | GREM2 | gremlin 2, cysteine knot superfamily, homolog (Xenopus laevis) | 1.54 × 10⁻²⁹ | 52.50 | 205463_s_at | PDGFA | platelet-derived growth factor alpha polypeptide | 3.82 × 10⁻¹⁰ | 3.83 |
| 240509_s_at | GREM2 | gremlin 2, cysteine knot superfamily, homolog (Xenopus laevis) | 3.80 × 10⁻³³ | 45.90 | 221898_at | PDPN | podoplanin | 2.45 × 10⁻⁸ | 3.21 |
| 235504_at | GREM2 | gremlin 2, cysteine knot superfamily, homolog (Xenopus laevis) | 2.59 × 10⁻³³ | 37.93 | 204879_at | PDPN | podoplanin | 8.06 × 10⁻⁷ | 2.10 |
| 216041_x_at | GRN | granulin | 4.12 × 10⁻²⁶ | 2.77 | 218454_at | PLBD1 | phospholipase B domain containing 1 | 7.38 × 10⁻⁷ | 2.70 |
| 200678_x_at | GRN | granulin | 8.63 × 10⁻²⁷ | 2.60 | 213449_at | POP1 | processing of precursor 1, ribonuclease P/MRP subunit (S. cerevisiae) | 6.40 × 10⁻¹² | 2.14 |
| 211284_s_at | GRN | granulin | 1.04 × 10⁻²⁶ | 2.45 | 213421_x_at | PRSS3 | protease, serine, 3 | 9.97 × 10⁻⁴ | 2.31 |
| 206326_at | GRP | gastrin-releasing peptide | 1.71 × 10⁻⁵ | 2.37 | 207463_x_at | PRSS3 | protease, serine, 3 | 2.59 × 10⁻³ | 2.17 |
| 204773_at | IL11RA | interleukin 11 receptor, alpha | 9.87 × 10⁻¹² | 2.32 | 206631_at | PTGER2 | prostaglandin E receptor 2 (subtype EP2), 53 kDa | 2.43 × 10⁻⁹ | 2.96 |
| 206295_at | IL18 | interleukin 18 (interferon-gamma-inducing factor) | 6.66 × 10⁻³ | 2.15 | 204897_at | PTGER4 | prostaglandin E receptor 4 (subtype EP4) | 1.62 × 10⁻⁵ | 4.35 |
| 202948_at | IL1R1 | interleukin 1 receptor, type I | 2.88 × 10⁻¹⁰ | 2.33 | 227146_at | QSOX2 | quiescin Q6 sulfhydryl oxidase 2 | 1.21 × 10⁻²³ | 2.14 |
| 228575_at | IL20RB | interleukin 20 receptor beta | 3.21 × 10⁻³³ | 20.03 | 204916_at | RAMP1 | receptor (G protein-coupled) activity modifying protein 1 | 5.83 × 10⁻⁵ | 2.06 |
| 221658_s_at | IL21R | interleukin 21 receptor | 5.81 × 10⁻¹⁰ | 2.67 | 219140_s_at | RBP4 | retinol binding protein 4, plasma | 1.87 × 10⁻⁴ | 2.28 |
| 226333_at | IL6R | interleukin 6 receptor | 1.33 × 10⁻⁹ | 2.61 | 206805_at | SEMA3A | sema domain, immunoglobulin domain (Ig), short basic domain, secreted, (semaphorin) 3A | 1.29 × 10⁻⁵ | 2.54 |
| 206693_at | IL7 | interleukin 7 | 7.42 × 10⁻⁸ | 2.00 | 244163_at | SEMA3A | sema domain, immunoglobulin domain (Ig), short basic domain, secreted, (semaphorin) 3A | 4.25 × 10⁻⁷ | 2.02 |
| 226218_at | IL7R | interleukin 7 receptor | 4.57 × 10⁻¹⁴ | 12.12 | 230345_at | SEMA7A | semaphorin 7A, GPI membrane anchor (John Milton Hagen blood group) | 5.22 × 10⁻⁸ | 2.70 |
| 205798_at | IL7R | interleukin 7 receptor | 5.98 × 10⁻¹⁵ | 10.35 | 209723_at | SERPINB9 | serpin peptidase inhibitor, clade B (ovalbumin), member 9 | 1.23 × 10⁻⁷ | 4.73 |
| 205258_at | INHBB | inhibin, beta B | 4.04 × 10⁻⁷ | 6.33 | 205576_at | SERPIND1 | serpin peptidase inhibitor, clade D (heparin cofactor), member 1 | 1.39 × 10⁻⁶ | 2.04 |
| 205051_s_at | KIT | v-kit Hardy-Zuckerman 4 feline sarcoma viral oncogene homolog | 1.65 × 10⁻¹³ | 6.91 | 213600_at | SIPA1L3 | signal-induced proliferation-associated 1 like 3 | 4.01 × 10⁻²³ | 2.39 |
| 207092_at | LEP | leptin | 4.09 × 10⁻⁵ | 2.83 | 37831_at | SIPA1L3 | signal-induced proliferation-associated 1 like 3 | 3.40 × 10⁻²⁵ | 2.07 |
| 206584_at | LY96 | lymphocyte antigen 96 | 1.50 × 10⁻¹⁹ | 2.46 | 204466_s_at | SNCA | synuclein, alpha (non A4 component of amyloid precursor) | 8.83 × 10⁻⁶ | 3.50 |
| 232224_at | MASP1 | mannan-binding lectin serine peptidase 1 (C4/C2 activating component of Ra-reactive factor) | 4.44 × 10⁻⁷ | 5.65 | 201562_s_at | SORD | sorbitol dehydrogenase | 4.85 × 10⁻¹⁵ | 2.16 |
| 201621_at | NBL1 | neuroblastoma, suppression of tumorigenicity 1 | 2.11 × 10⁻⁹ | 2.66 | 242408_at | STYX | serine/threonine/tyrosine interacting protein | 3.00 × 10⁻⁸ | 2.02 |
| 37005_at | NBL1 | neuroblastoma, suppression of tumorigenicity 1 | 1.16 × 10⁻⁸ | 2.33 | 209676_at | TFPI | tissue factor pathway inhibitor (lipoprotein-associated coagulation inhibitor) | 4.68 × 10⁻⁵ | 2.43 |
| 205893_at | NLGN1 | neuroligin 1 | 7.98 × 10⁻³ | 2.09 | 213258_at | TFPI | tissue factor pathway inhibitor (lipoprotein-associated coagulation inhibitor) | 3.07 × 10⁻⁵ | 2.34 |
| 231361_at | NLGN1 | Neuroligin 1 | 4.26 × 10⁻³ | 2.02 | 210664_s_at | TFPI | tissue factor pathway inhibitor (lipoprotein-associated coagulation inhibitor) | 1.32 × 10⁻⁴ | 2.22 |
| 231798_at | NOG | noggin | 2.87 × 10−41 | 97.99 | 235737_at | TSLP | thymic stromal lymphopoietin | 5.21 × 10⁻¹⁴ | 6.10 |
| 206343_s_at | NRG1 | neuregulin 1 | 4.21 × 10⁻⁴ | 2.02 | 213425_at | WNT5A | wingless-type MMTV integration site family, member 5A | 1.06 × 10⁻¹³ | 4.23 |
| 218625_at | NRN1 | neuritin 1 | 3.68 × 10⁻¹⁵ | 29.54 | 205990_s_at | WNT5A | wingless-type MMTV integration site family, member 5A | 6.42 × 10⁻¹⁴ | 3.76 |
| 200649_at | NUCB1 | nucleobindin 1 | 7.18 × 10⁻¹² | 2.05 | 238105_x_at | WNT7B | wingless-type MMTV integration site family, member 7B | 1.17 × 10⁻¹¹ | 2.58 |
| 213131_at | OLFM1 | olfactomedin 1 | 5.16 × 10⁻³⁵ | 18.89 | |||||
| 205591_at | OLFM1 | olfactomedin 1 | 0.00 × 10+00 | 15.89 | |||||
| 214620_x_at | PAM | peptidylglycine alpha-amidating monooxygenase | 8.58 × 10⁻²³ | 2.25 | |||||
| 202336_s_at | PAM | peptidylglycine alpha-amidating monooxygenase | 1.74 × 10⁻²² | 2.25 | |||||
| 212958_x_at | PAM | peptidylglycine alpha-amidating monooxygenase | 1.18 × 10⁻²¹ | 2.09 | |||||
| 219304_s_at | PDGFD | platelet derived growth factor D | 1.83 × 10⁻¹⁵ | 9.33 | |||||
| 209652_s_at | PGF | placental growth factor | 1.69 × 10⁻⁶ | 2.11 | |||||
| 201578_at | PODXL | podocalyxin-like | 7.00 × 10⁻²⁰ | 20.38 | |||||
| 207808_s_at | PROS1 | protein S (alpha) | 8.76 × 10⁻⁹ | 3.01 | |||||
| 200866_s_at | PSAP | prosaposin | 2.12 × 10⁻¹³ | 2.29 | |||||
| 208257_x_at | PSG1 | pregnancy specific beta-1-glycoprotein 1 | 7.51 × 10⁻⁷ | 6.45 | |||||
| 210195_s_at | PSG1 | pregnancy specific beta-1-glycoprotein 1 | 1.76 × 10⁻⁸ | 3.21 | |||||
| 210196_s_at | PSG1 | pregnancy specific beta-1-glycoprotein 1 | 3.24 × 10⁻⁵ | 2.18 | |||||
| 208134_x_at | PSG2 | pregnancy specific beta-1-glycoprotein 2 | 4.46 × 10⁻¹⁹ | 5.98 | |||||
| 211741_x_at | PSG3 | pregnancy specific beta-1-glycoprotein 3 | 3.72 × 10⁻²⁷ | 28.52 | |||||
| 203399_x_at | PSG3 | pregnancy specific beta-1-glycoprotein 3 | 4.42 × 10⁻³⁰ | 25.95 | |||||
| 215821_x_at | PSG3 | pregnancy specific beta-1-glycoprotein 3 | 1.34 × 10⁻²² | 7.87 | |||||
| 208191_x_at | PSG4 | pregnancy specific beta-1-glycoprotein 4 | 6.32 × 10⁻⁶ | 8.81 | |||||
| 204830_x_at | PSG5 | pregnancy specific beta-1-glycoprotein 5 | 9.42 × 10⁻²⁹ | 200.65 | |||||
| 209738_x_at | PSG6 | pregnancy specific beta-1-glycoprotein 6 | 4.68 × 10⁻²⁹ | 78.75 | |||||
| 208106_x_at | PSG6 | pregnancy specific beta-1-glycoprotein 6 | 2.35 × 10⁻²⁸ | 51.80 | |||||
| 205602_x_at | PSG7 | pregnancy specific beta-1-glycoprotein 7 | 1.27 × 10⁻⁵ | 4.78 | |||||
| 209594_x_at | PSG9 | pregnancy specific beta-1-glycoprotein 9 | 1.83 × 10⁻²⁹ | 89.31 | |||||
| 207733_x_at | PSG9 | pregnancy specific beta-1-glycoprotein 9 | 5.66 × 10⁻²⁶ | 12.06 | |||||
| 212187_x_at | PTGDS | prostaglandin D2 synthase 21 kDa (brain) | 1.76 × 10⁻⁵ | 3.89 | |||||
| 211748_x_at | PTGDS | prostaglandin D2 synthase 21 kDa (brain) | 6.16 × 10⁻⁶ | 3.30 | |||||
| 211663_x_at | PTGDS | prostaglandin D2 synthase 21 kDa (brain) | 7.37 × 10⁻⁴ | 2.32 | |||||
| 213933_at | PTGER3 | prostaglandin E receptor 3 (subtype EP3) | 3.46 × 10⁻⁷ | 3.51 | |||||
| 1555097_a_at | PTGFR | prostaglandin F receptor (FP) | 5.53 × 10⁻⁸ | 2.27 | |||||
| 207177_at | PTGFR | prostaglandin F receptor (FP) | 1.00 × 10⁻⁷ | 2.21 | |||||
| 206187_at | PTGIR | prostaglandin I2 (prostacyclin) receptor (IP) | 1.11 × 10⁻¹³ | 2.31 | |||||
| 208131_s_at | PTGIS | prostaglandin I2 (prostacyclin) synthase | 2.20 × 10⁻¹⁶ | 42.66 | |||||
| 211892_s_at | PTGIS | prostaglandin I2 (prostacyclin) synthase | 2.07 × 10⁻⁸ | 3.10 | |||||
| 210702_s_at | PTGIS | prostaglandin I2 (prostacyclin) synthase | 7.89 × 10⁻⁹ | 2.99 | |||||
| 211756_at | PTHLH | parathyroid hormone-like hormone | 8.63 × 10⁻³ | 2.07 | |||||
| 215253_s_at | RCAN1 | regulator of calcineurin 1 | 1.52 × 10⁻⁶ | 2.47 | |||||
| 203498_at | RCAN2 | regulator of calcineurin 2 | 1.23 × 10−39 | 49.77 | |||||
| 226272_at | RCAN3 | RCAN family member 3 | 1.16 × 10⁻¹² | 2.59 | |||||
| 213716_s_at | SECTM1 | secreted and transmembrane 1 | 1.48 × 10⁻⁴ | 2.14 | |||||
| 226492_at | SEMA6D | sema domain, transmembrane domain (TM), and cytoplasmic domain, (semaphorin) 6D | 1.30 × 10⁻⁴ | 2.71 | |||||
| 200986_at | SERPING1 | serpin peptidase inhibitor, clade G (C1 inhibitor), member 1 | 2.81 × 10⁻²⁰ | 13.38 | |||||
| 204596_s_at | STC1 | stanniocalcin 1 | 1.03 × 10⁻⁴ | 2.89 | |||||
| 204595_s_at | STC1 | stanniocalcin 1 | 3.40 × 10⁻⁵ | 2.12 | |||||
| 203438_at | STC2 | stanniocalcin 2 | 1.40 × 10⁻⁶ | 2.84 | |||||
| 203439_s_at | STC2 | stanniocalcin 2 | 9.48 × 10⁻⁵ | 2.27 | |||||
| 212344_at | SULF1 | sulfatase 1 | 4.55 × 10⁻¹² | 9.94 | |||||
| 212353_at | SULF1 | sulfatase 1 | 5.41 × 10⁻¹⁰ | 8.59 | |||||
| 212354_at | SULF1 | sulfatase 1 | 6.12 × 10⁻¹¹ | 8.19 | |||||
| 224724_at | SULF2 | sulfatase 2 | 2.31 × 10⁻¹⁰ | 3.82 | |||||
| 207426_s_at | TNFSF4 | tumor necrosis factor (ligand) superfamily, member 4 | 1.47 × 10⁻² | 2.59 | |||||
| 206907_at | TNFSF9 | tumor necrosis factor (ligand) superfamily, member 9 | 2.10 × 10⁻¹⁶ | 4.73 | |||||
| 219478_at | WFDC1 | WAP four-disulfide core domain 1 | 2.78 × 10⁻¹⁵ | 35.49 | |||||
| 205792_at | WISP2 | WNT1 inducible signaling pathway protein 2 | 3.53 × 10⁻⁴ | 2.90 | |||||
© 2020 by the authors. Licensee MDPI, Basel, Switzerland. This article is an open access article distributed under the terms and conditions of the Creative Commons Attribution (CC BY) license (http://creativecommons.org/licenses/by/4.0/).
Share and Cite
Haydont, V.; Neiveyans, V.; Perez, P.; Busson, É.; Lataillade, J.-J.; Asselineau, D.; Fortunel, N.O. Fibroblasts from the Human Skin Dermo-Hypodermal Junction are Distinct from Dermal Papillary and Reticular Fibroblasts and from Mesenchymal Stem Cells and Exhibit a Specific Molecular Profile Related to Extracellular Matrix Organization and Modeling. Cells 2020, 9, 368. https://doi.org/10.3390/cells9020368
Haydont V, Neiveyans V, Perez P, Busson É, Lataillade J-J, Asselineau D, Fortunel NO. Fibroblasts from the Human Skin Dermo-Hypodermal Junction are Distinct from Dermal Papillary and Reticular Fibroblasts and from Mesenchymal Stem Cells and Exhibit a Specific Molecular Profile Related to Extracellular Matrix Organization and Modeling. Cells. 2020; 9(2):368. https://doi.org/10.3390/cells9020368
Chicago/Turabian StyleHaydont, Valérie, Véronique Neiveyans, Philippe Perez, Élodie Busson, Jean-Jacques Lataillade, Daniel Asselineau, and Nicolas O. Fortunel. 2020. "Fibroblasts from the Human Skin Dermo-Hypodermal Junction are Distinct from Dermal Papillary and Reticular Fibroblasts and from Mesenchymal Stem Cells and Exhibit a Specific Molecular Profile Related to Extracellular Matrix Organization and Modeling" Cells 9, no. 2: 368. https://doi.org/10.3390/cells9020368
APA StyleHaydont, V., Neiveyans, V., Perez, P., Busson, É., Lataillade, J.-J., Asselineau, D., & Fortunel, N. O. (2020). Fibroblasts from the Human Skin Dermo-Hypodermal Junction are Distinct from Dermal Papillary and Reticular Fibroblasts and from Mesenchymal Stem Cells and Exhibit a Specific Molecular Profile Related to Extracellular Matrix Organization and Modeling. Cells, 9(2), 368. https://doi.org/10.3390/cells9020368