Tannic Acid Promotes TRAIL-Induced Extrinsic Apoptosis by Regulating Mitochondrial ROS in Human Embryonic Carcinoma Cells

 ,
,  , , , and
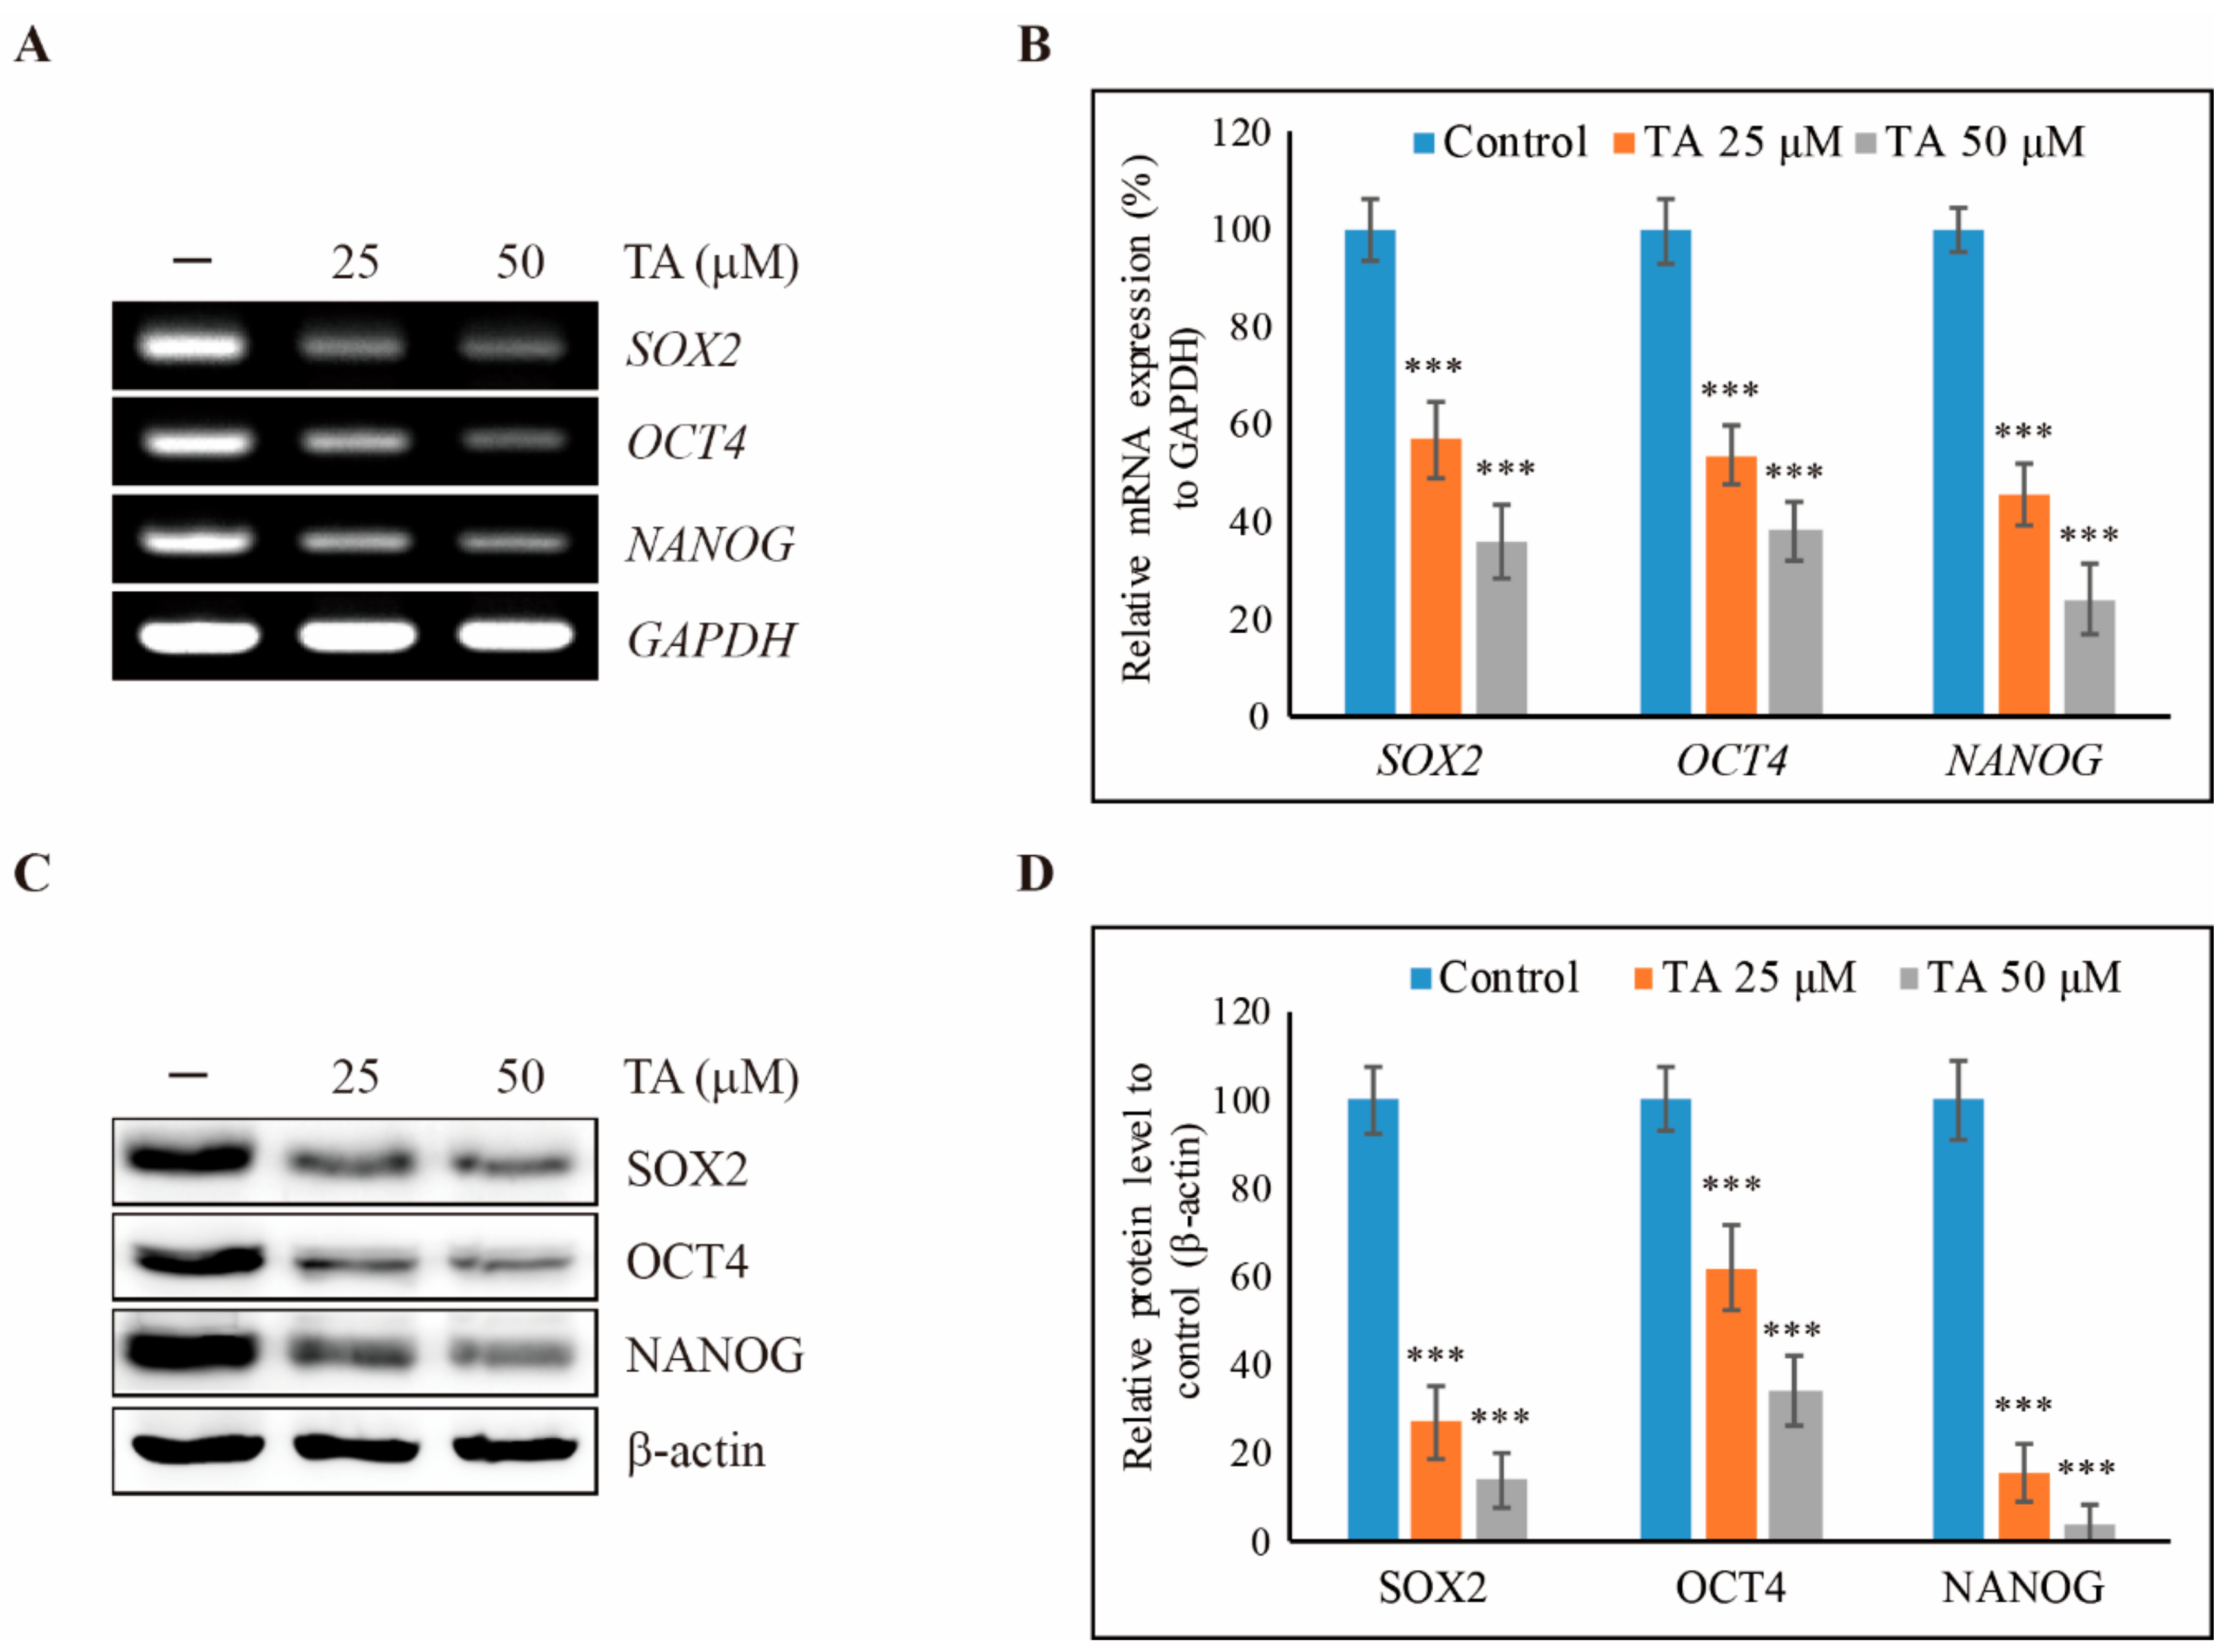
Abstract
1. Introduction
2. Materials and Methods
2.1. Antibodies and Cell Culture Reagents
2.2. Cell Culture and Treatment
2.3. Cell Proliferation Inhibition
2.4. Western Blotting
2.5. Reverse Transcription-Polymerase Chain Reaction (RT-PCR)
2.6. RNA Sequencing Analysis
2.7. Quantitative Polymerase Chain Reaction (Real-Time qPCR)
2.8. Cell Cycle Analysis
2.9. Apoptosis Analysis
2.10. Fluorescence-Activated Cell Sorting (FACS) Analysis for Mitochondrial Membrane Potential and ROS
2.11. Caspase-Glo 3/7 Assay
2.12. ATP Determination Assay
2.13. Human TRAIL Enzyme-Linked Immunosorbent Assay (ELISA)
2.14. Statistical Analyses
3. Results
3.1. TA Inhibits Cell Proliferation of NCCIT Cells as Well as Cancer Stem Cell Markers
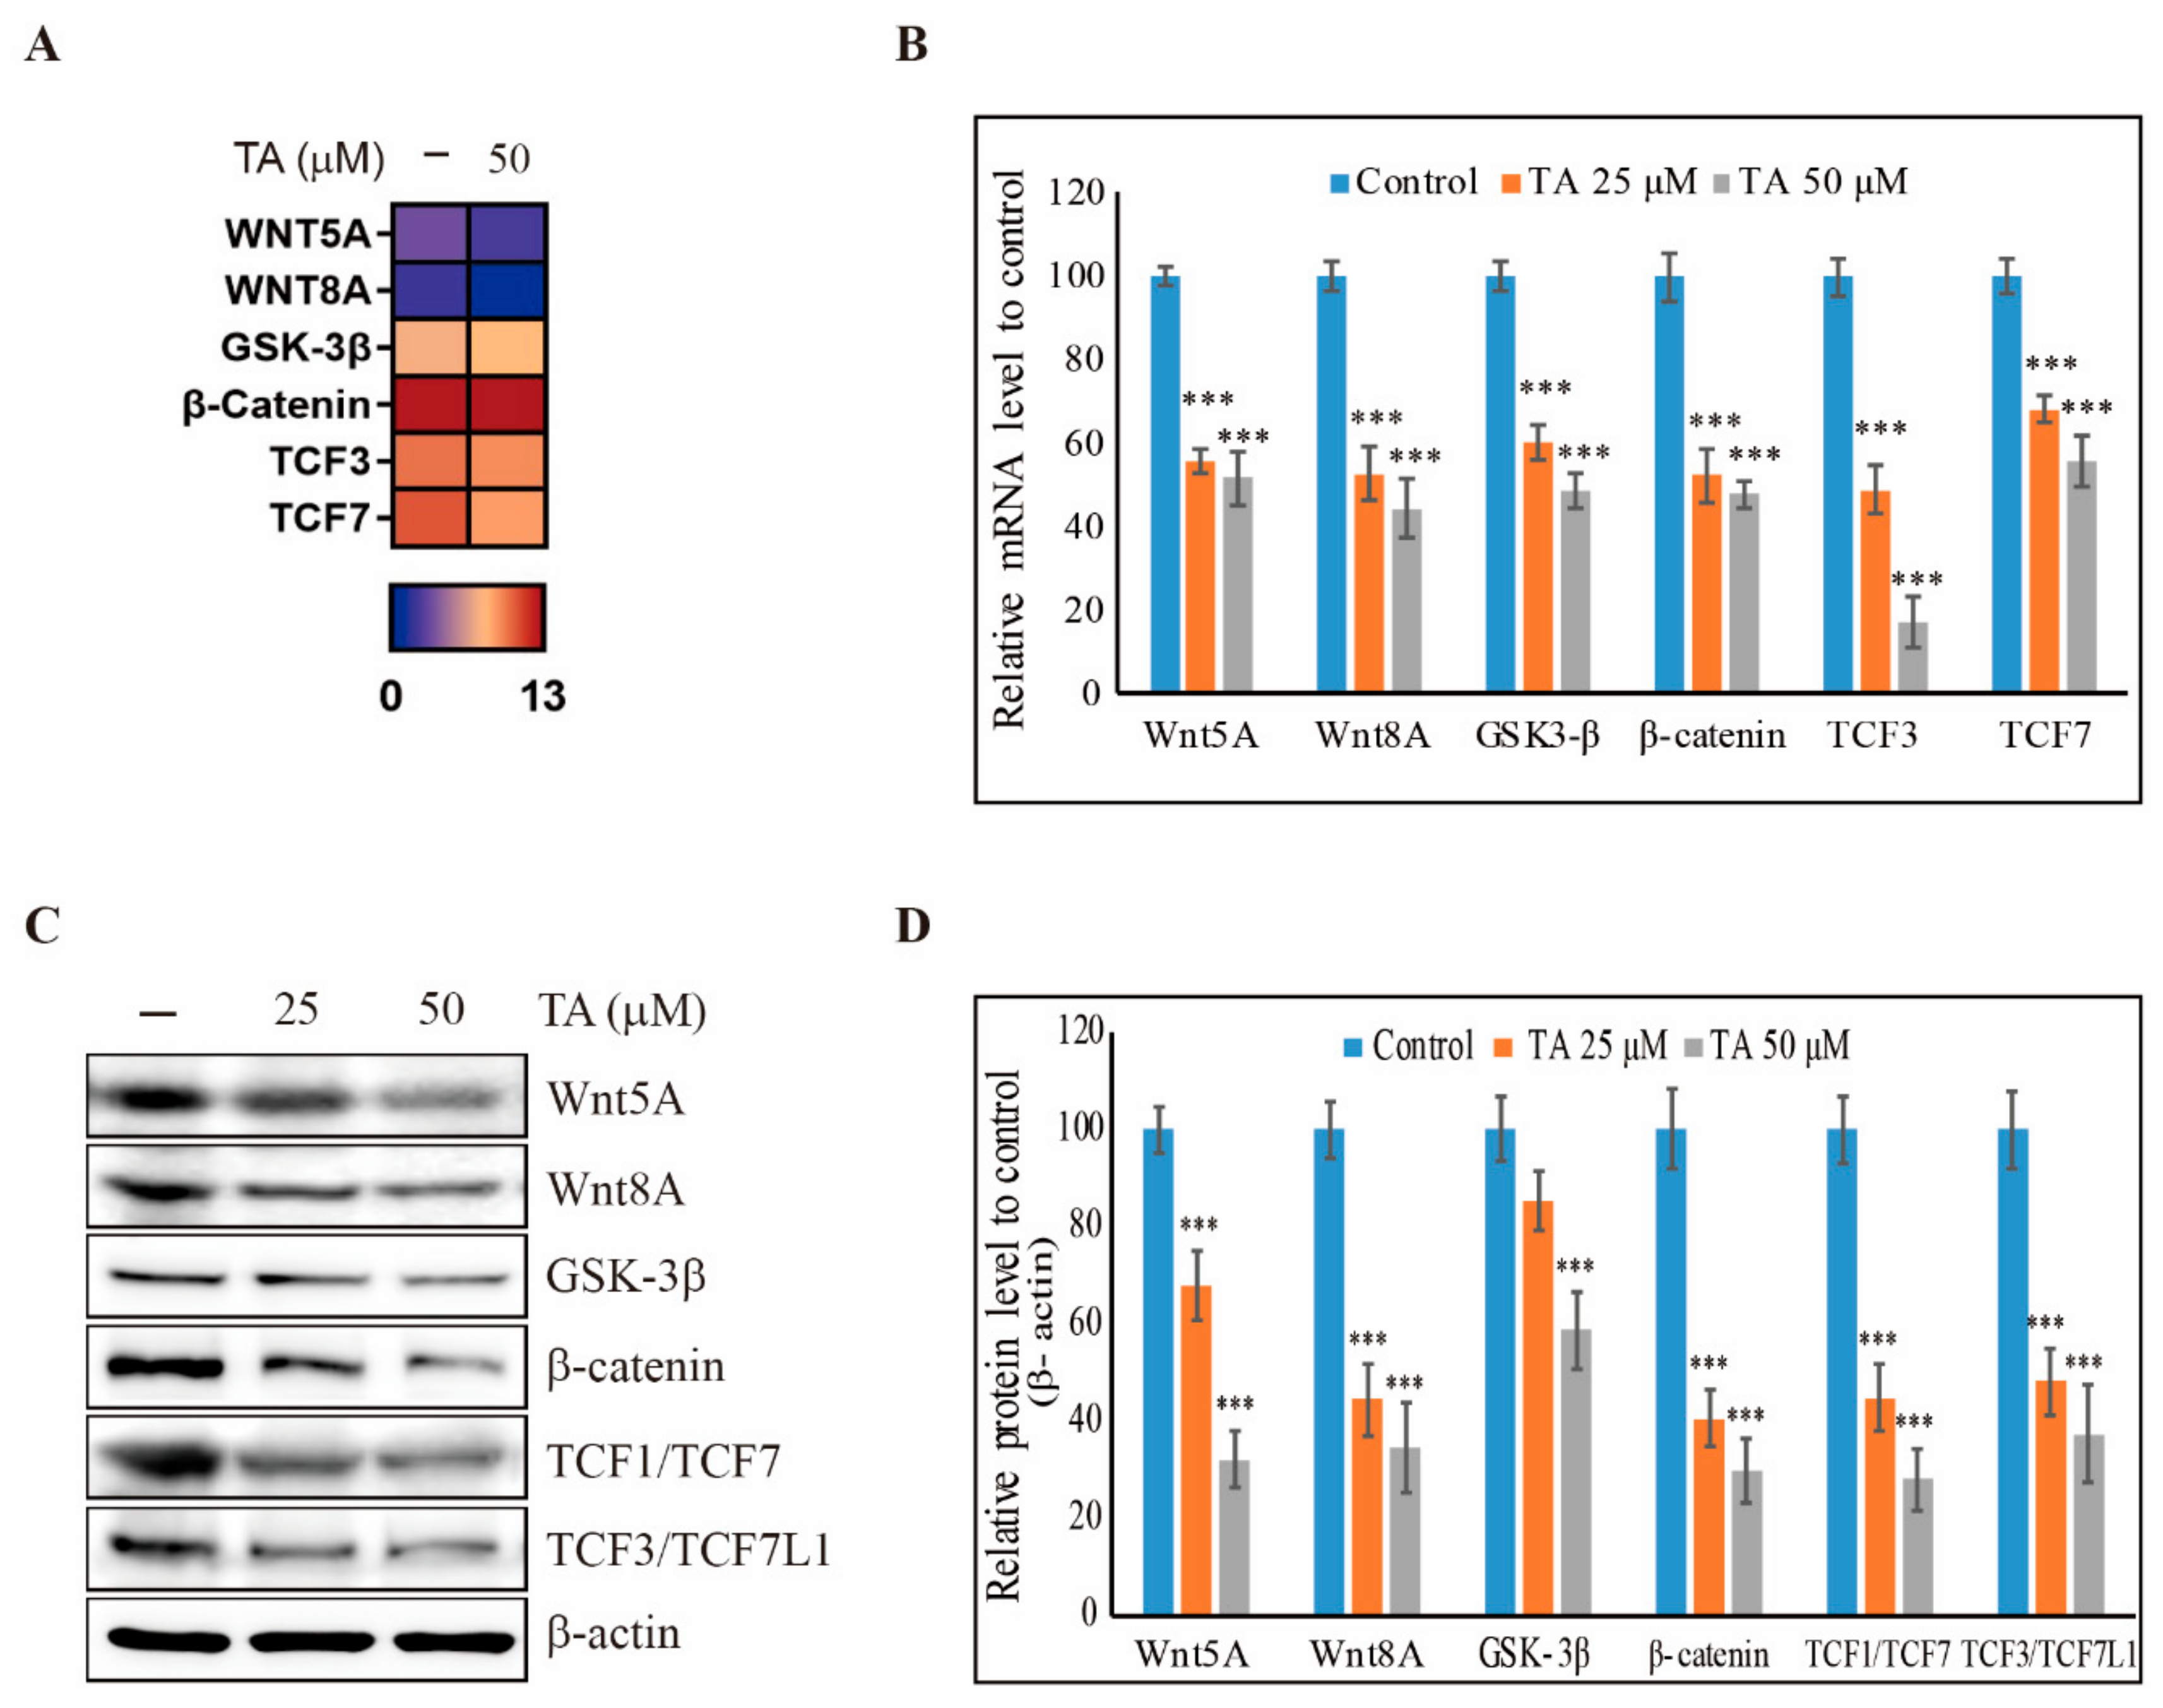
3.2. TA Downregulates the Wnt/β-Catenin Pathway in NCCIT Cells
3.3. TA Induces Sub-G1 Cell Cycle Arrest in NCCIT Cells
3.4. TA Induces Apoptosis in NCCIT Cells
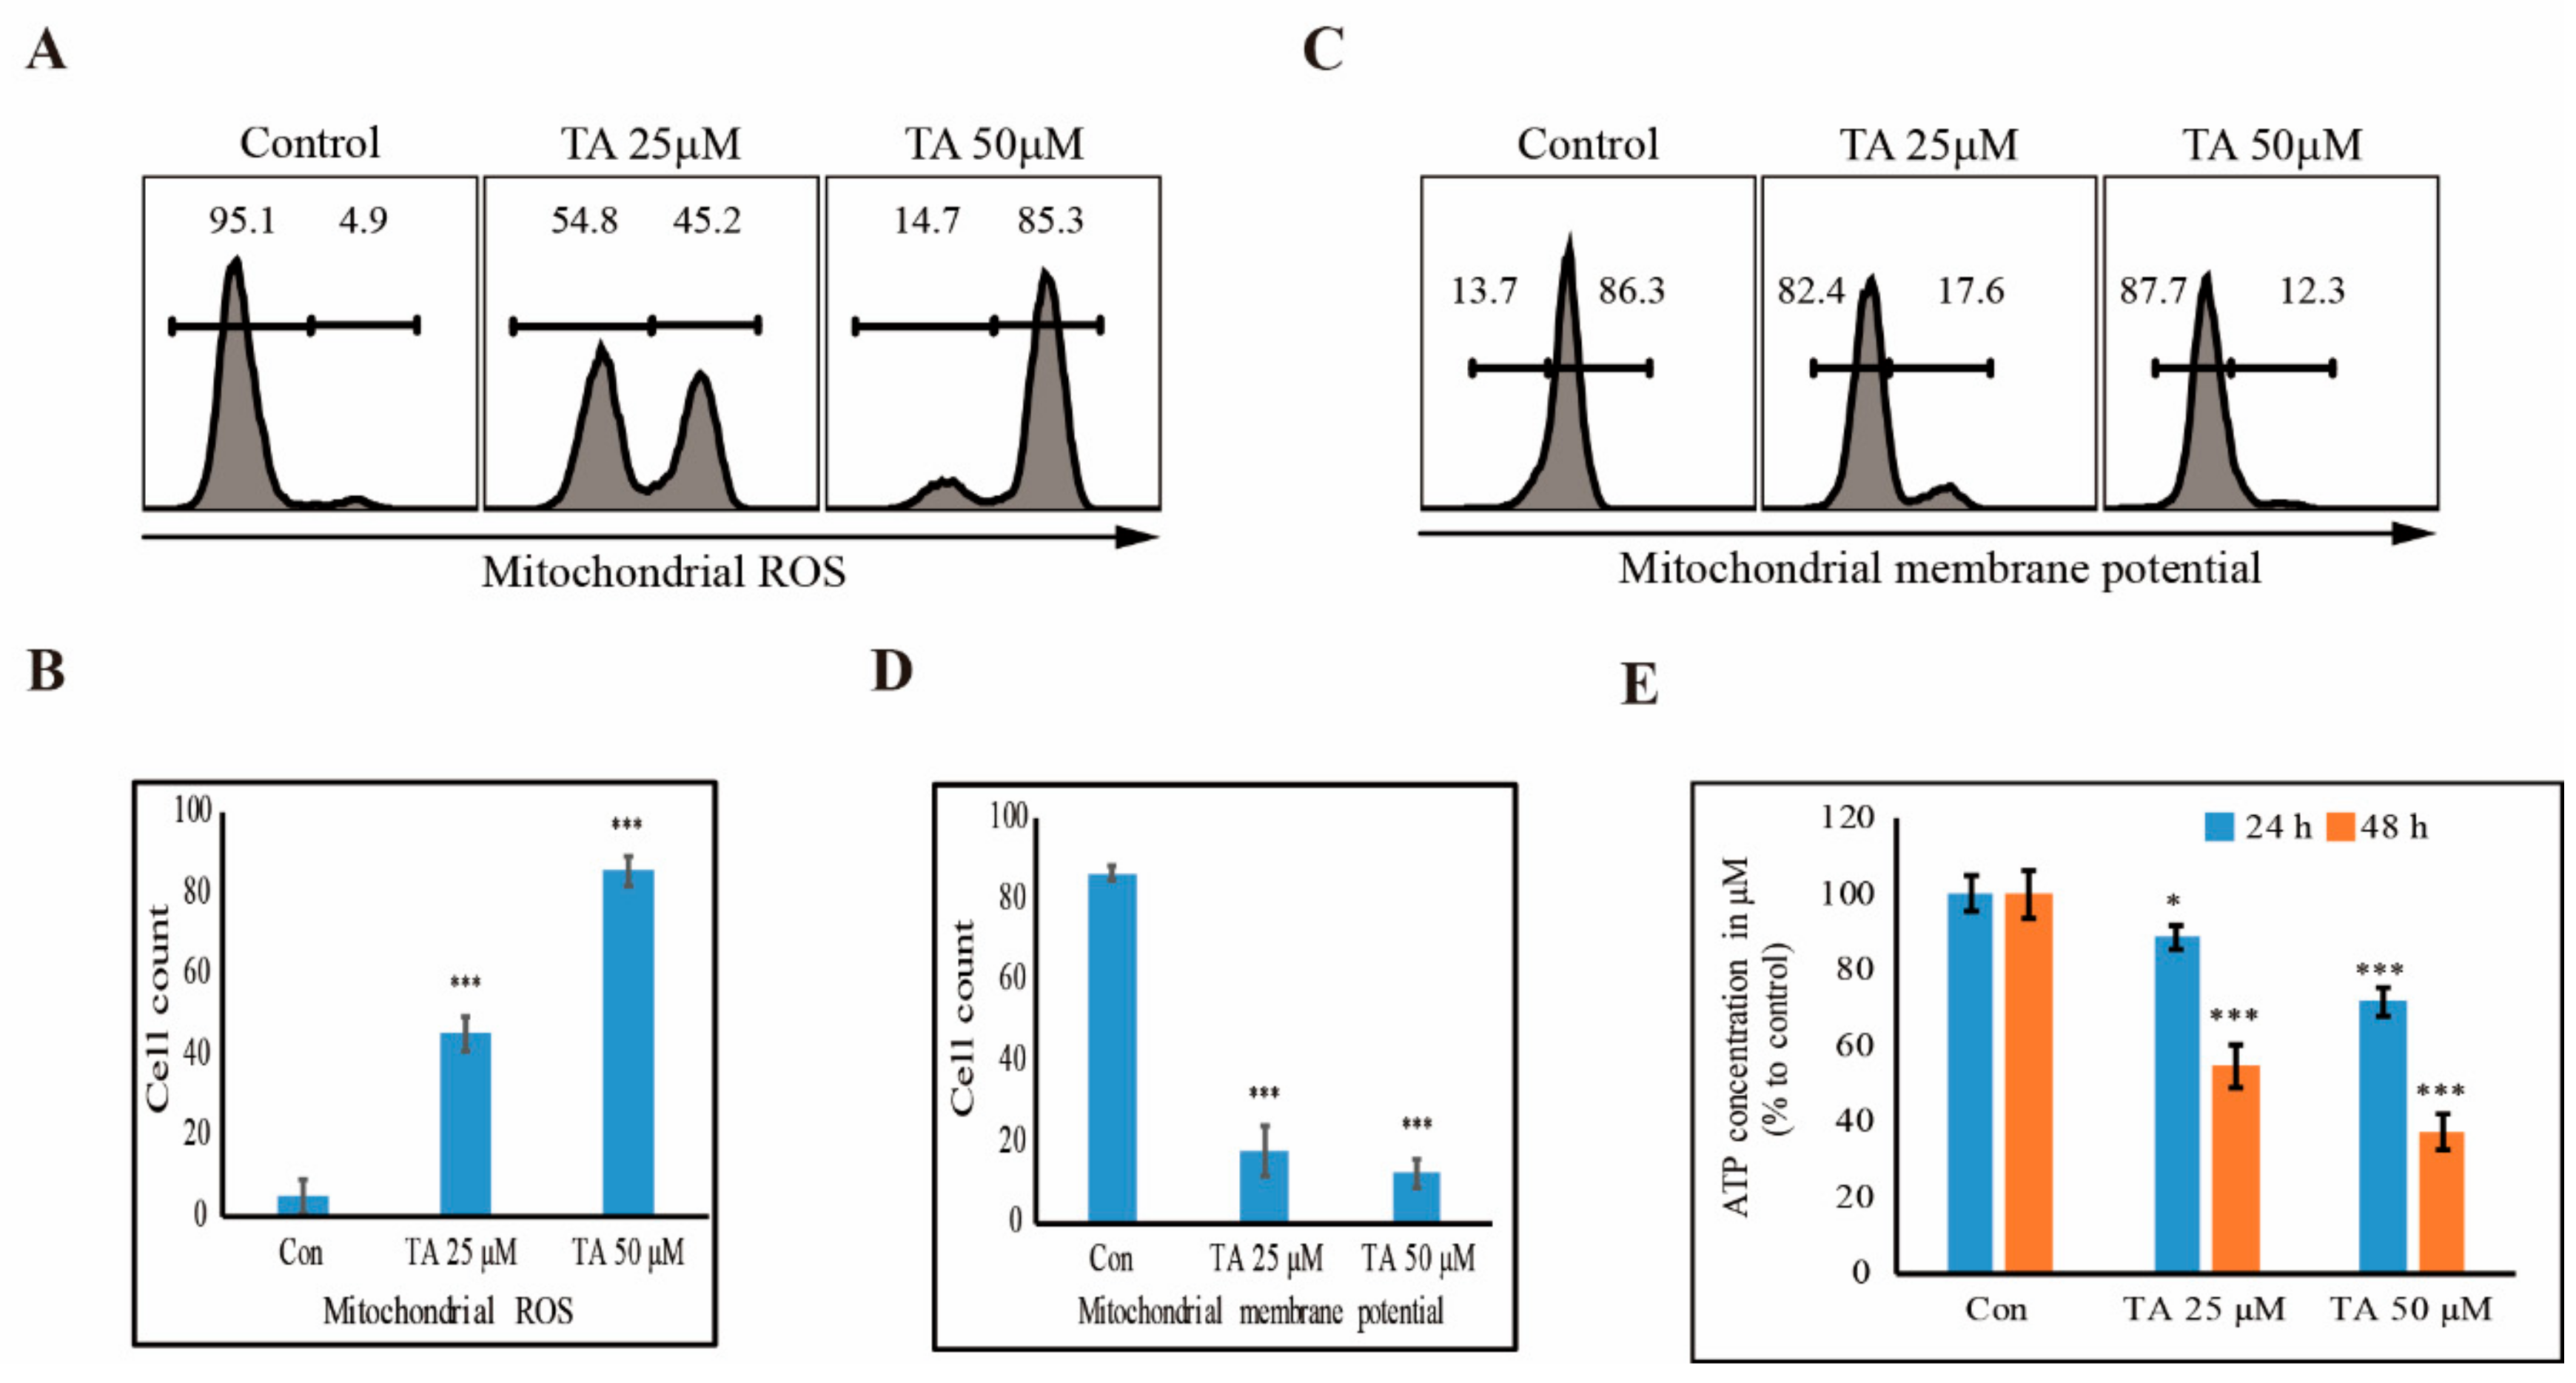
3.5. TA Induces mROS and Inhibits the Production of ATP in NCCIT Cells
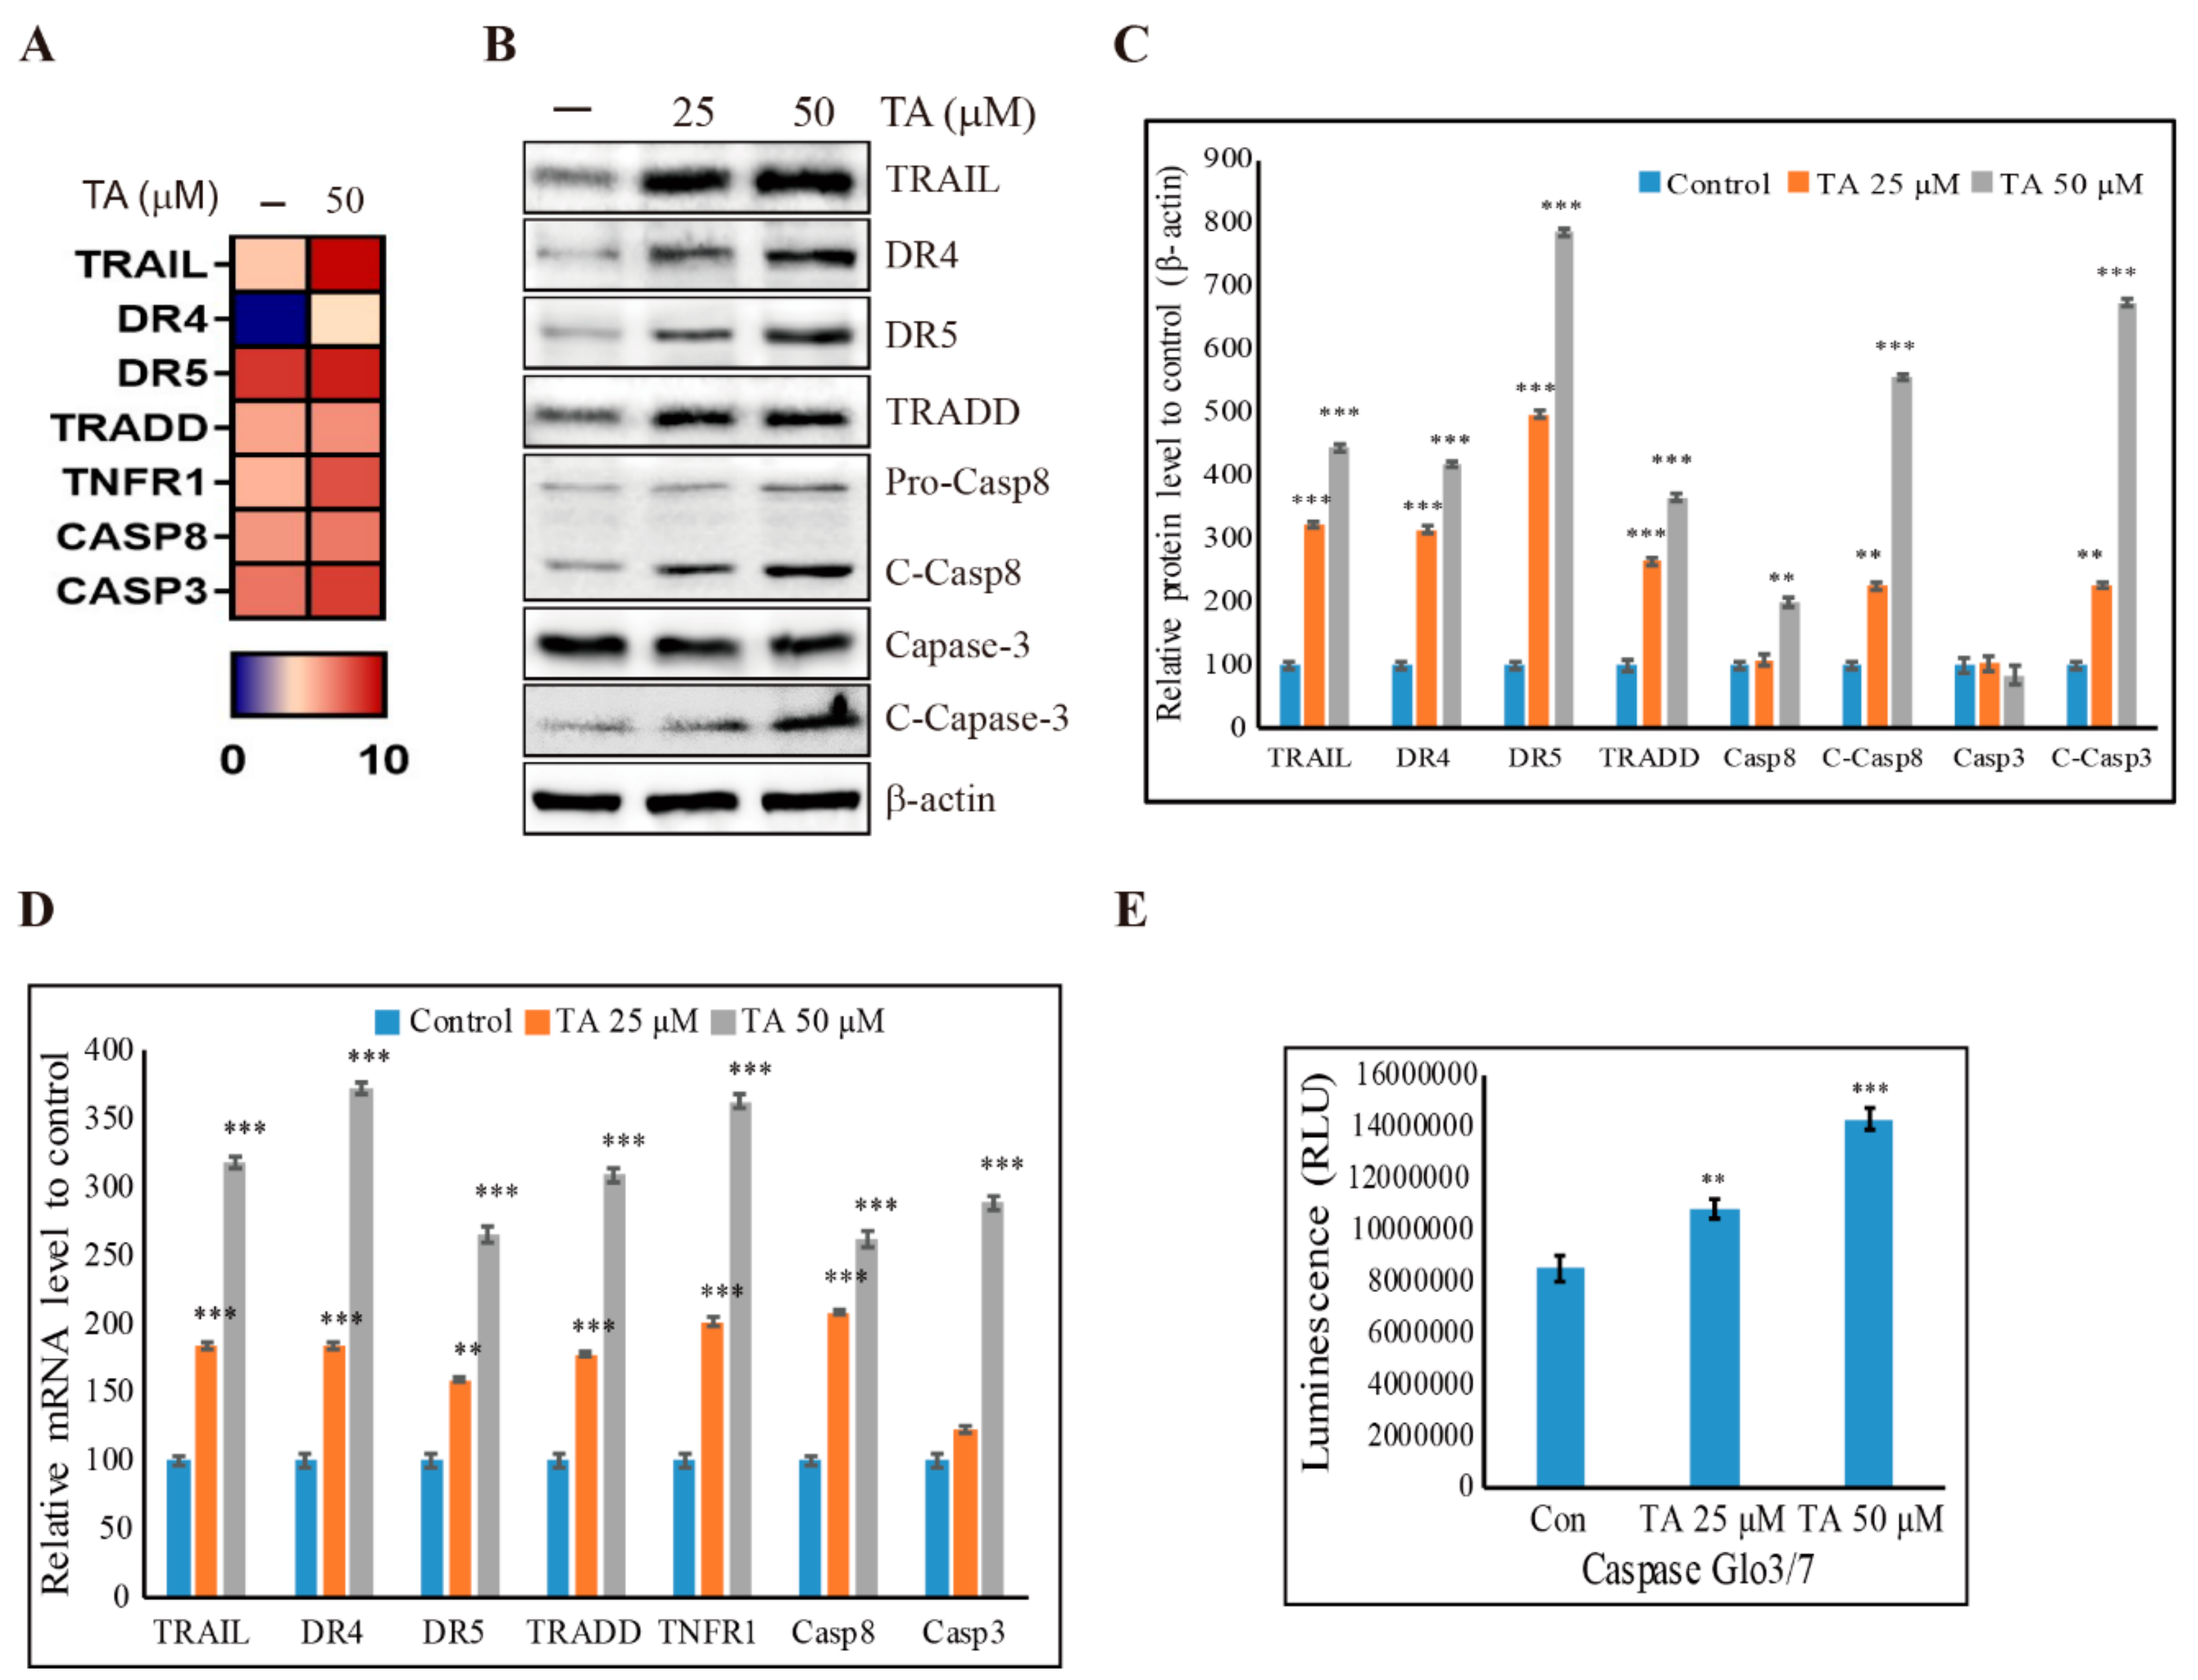
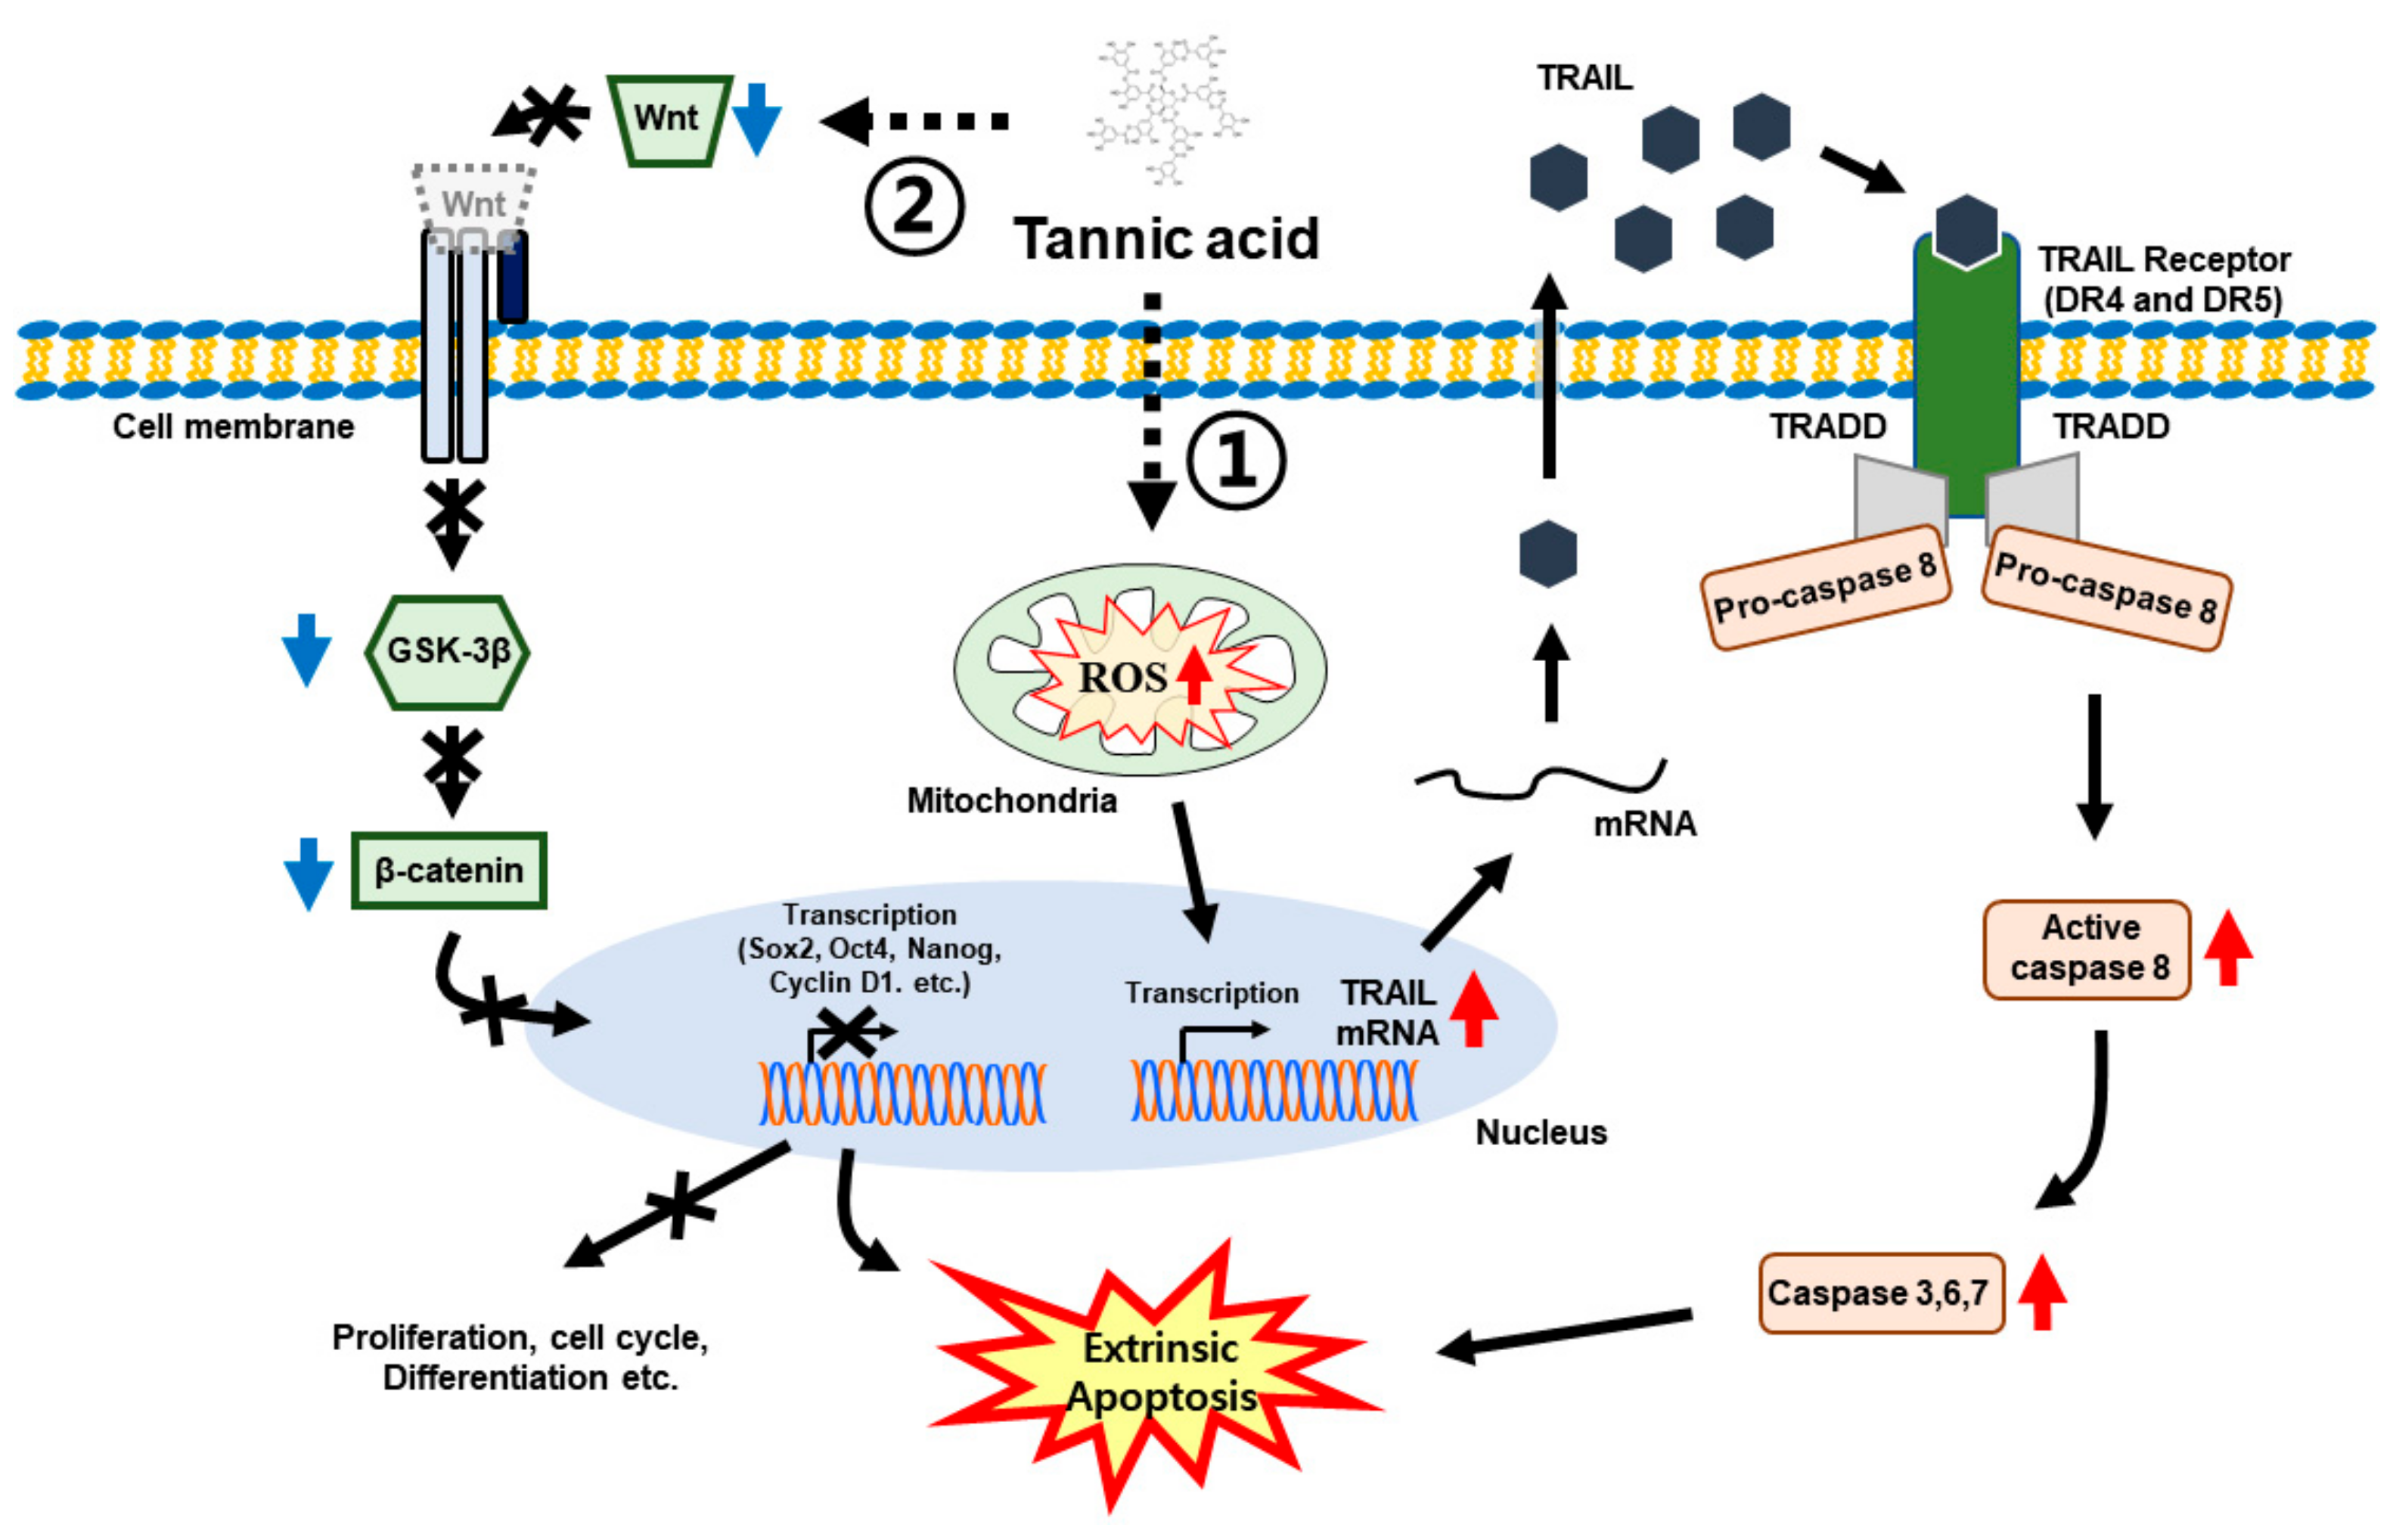
3.6. Induction of Extrinsic Pathway of Apoptosis by TA in NCCIT Cells
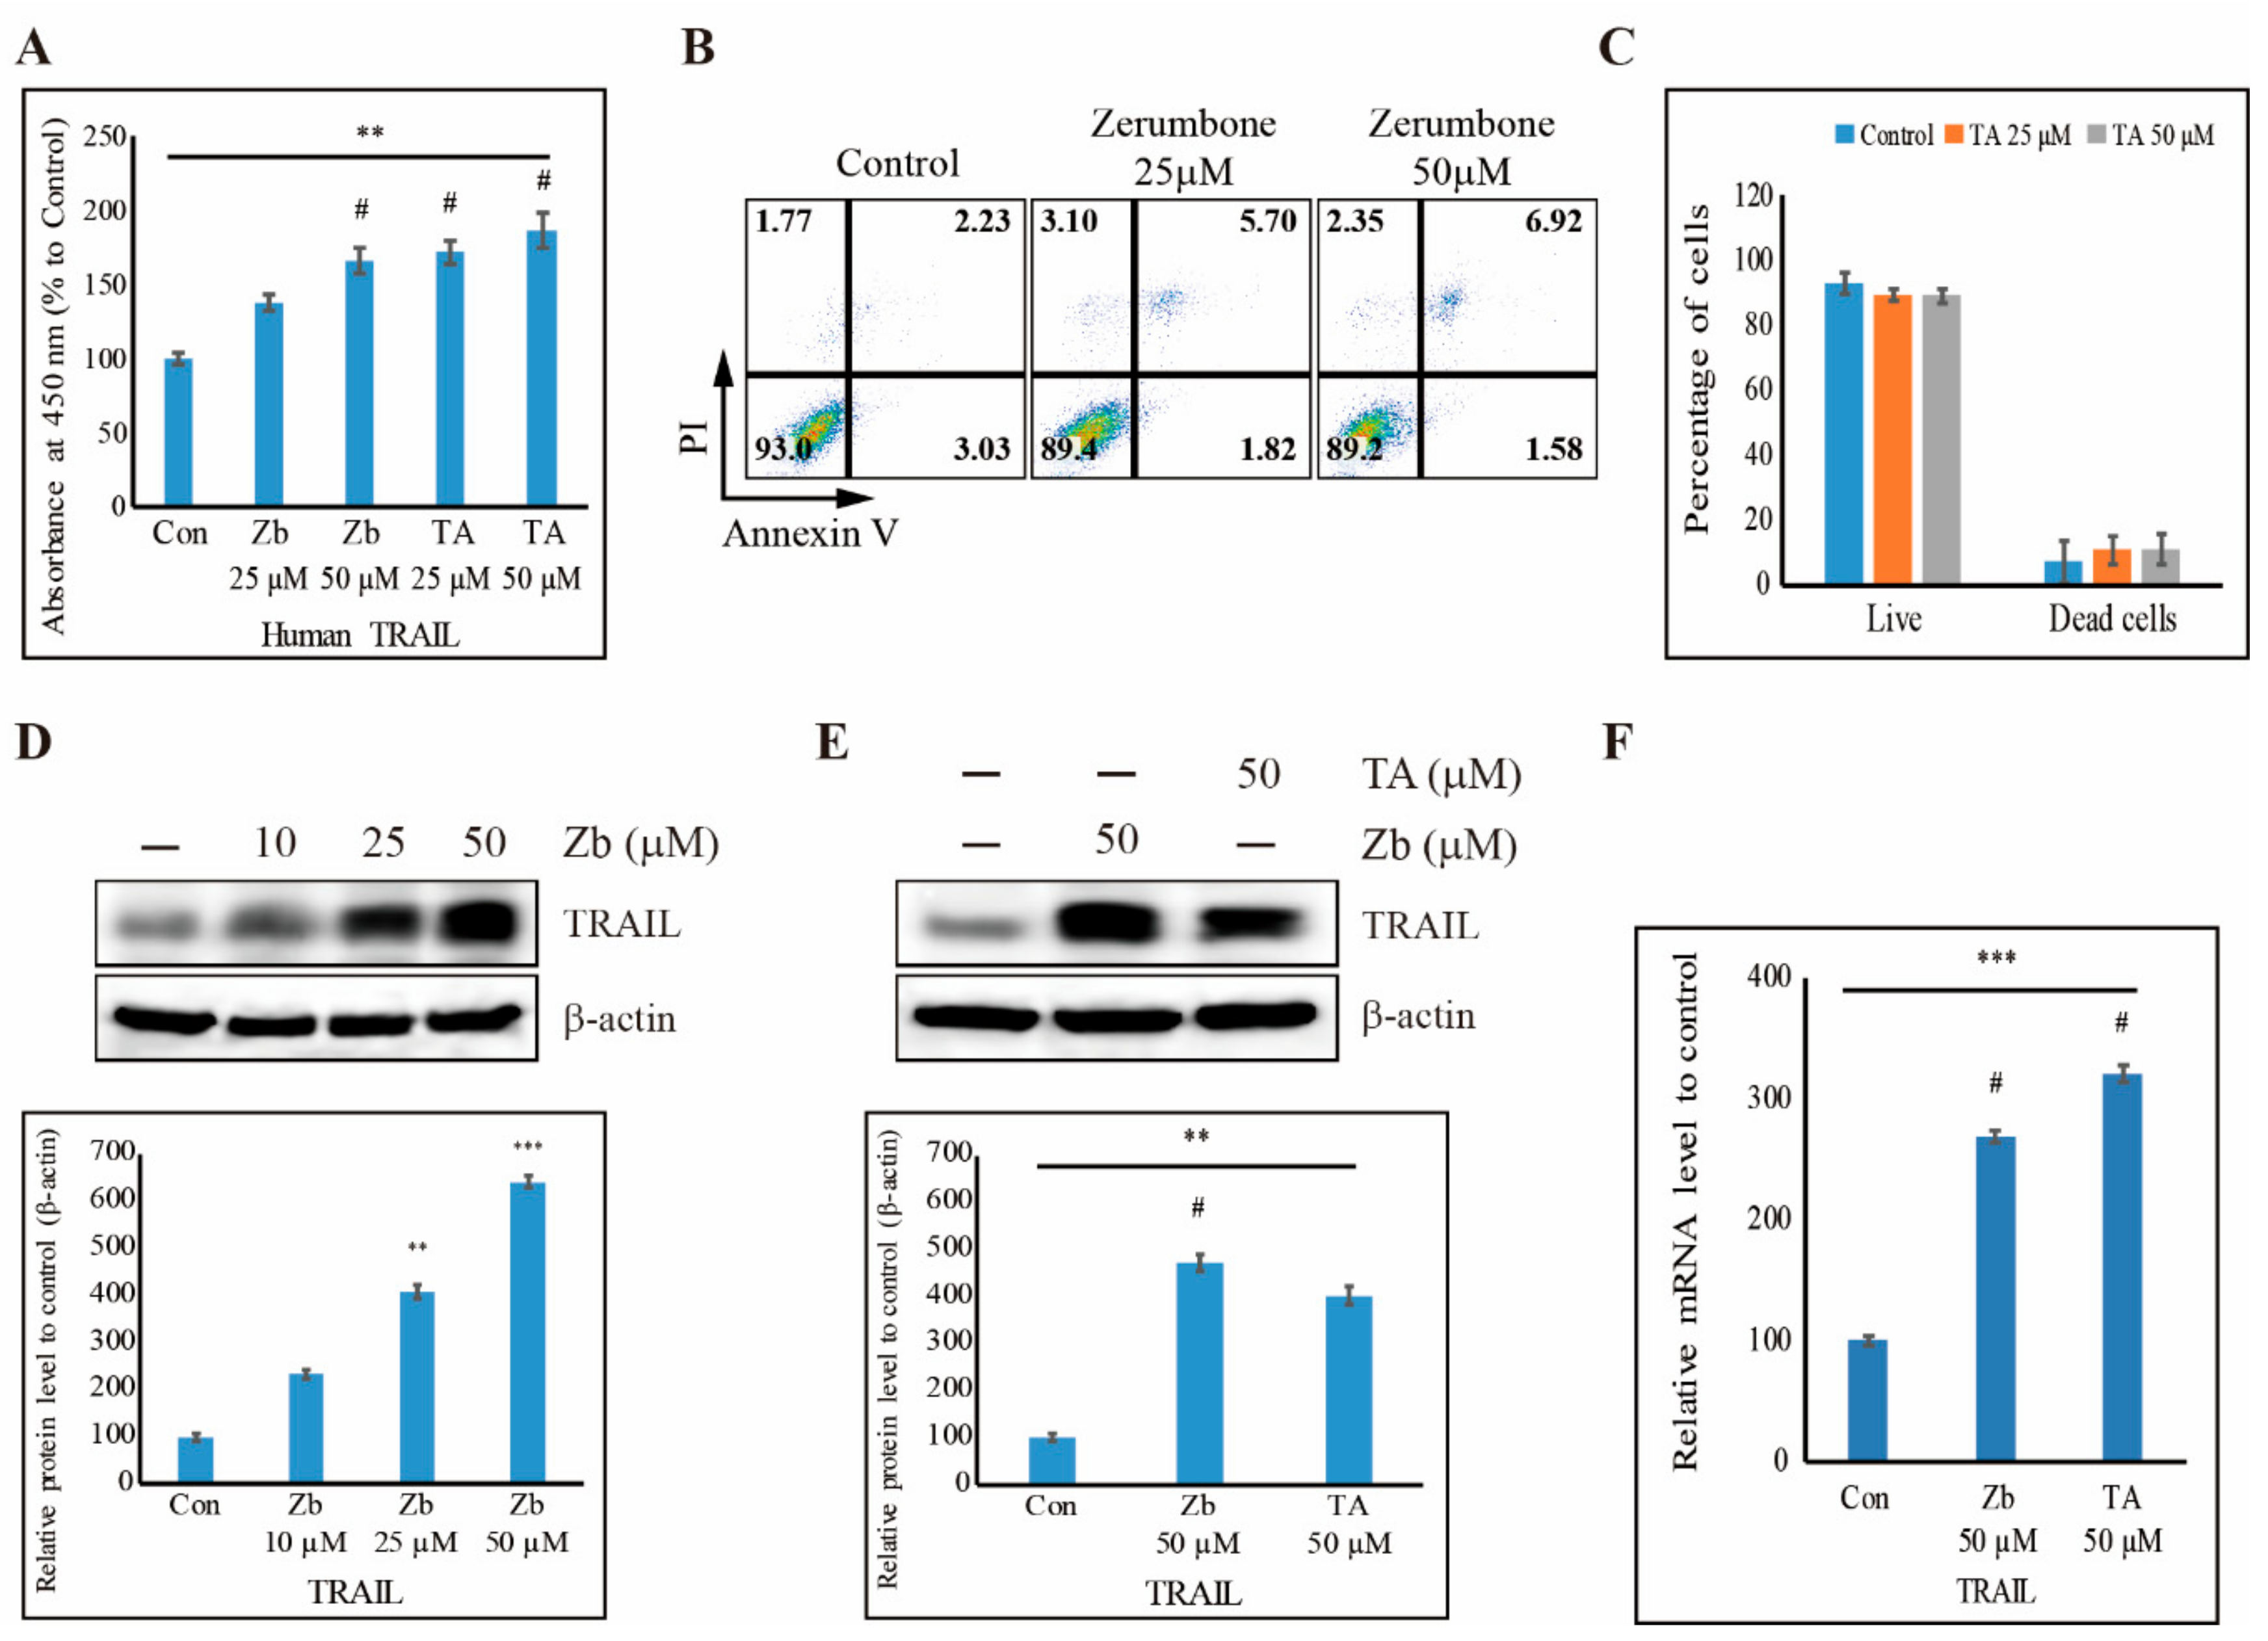
3.7. TA Induces Human TRAIL Expression and TRAIL-Induced Apoptosis in NCCIT Cells
4. Discussion
5. Conclusions
Supplementary Materials
Author Contributions
Funding
Conflicts of Interest
References
- Donovan, P.J.; Gearhart, J. The end of the beginning for pluripotent stem cells. Nature 2001, 414, 92–97. [Google Scholar] [CrossRef] [PubMed]
- Andrews, P.W.; Damjanov, I.; Berends, J.; Kumpf, S.; Zappavigna, V.; Mavilio, F.; Sampath, K. Inhibition of proliferation and induction of differentiation of pluripotent human embryonal carcinoma cells by osteogenic protein-1 (or bone morphogenetic protein-7). Lab. Investig. 1994, 71, 243–251. [Google Scholar] [PubMed]
- Das, N.D.; Park, J.H.; Jung, K.H.; Lee, H.T.; Park, K.S.; Choi, M.R.; Chai, Y.G. Sodium arsenite dependent protein expression analysis on human embryonic carcinoma (NCCIT) cell line. Toxicol. Lett. 2011, 207, 149–158. [Google Scholar] [CrossRef] [PubMed]
- Mansouri, A.; Fukumitsu, H.; Schindehuette, J.; Krieglstein, K. Differentiation of Embryonic Stem Cells. Curr. Protoc. Neurosci. 2009, 47, 3.6.1–3.6.21. [Google Scholar] [CrossRef] [PubMed]
- Rodda, D.J.; Chew, J.L.; Lim, L.H.; Loh, Y.H.; Wang, B.; Ng, H.H.; Robson, P. Transcriptional regulation of nanog by OCT4 and SOX2. J. Biol. Chem. 2005, 280, 24731–24737. [Google Scholar] [CrossRef] [PubMed]
- Sp, N.; Kang, D.Y.; Kim, D.H.; Park, J.H.; Lee, H.G.; Kim, H.J.; Darvin, P.; Park, Y.M.; Yang, Y.M. Nobiletin inhibits CD36-dependent tumor angiogenesis, migration, invasion, and sphere formation through the Cd36/Stat3/Nf-Kappab signaling axis. Nutrients 2018, 10, 772. [Google Scholar] [CrossRef] [PubMed]
- Zhang, Y.; Eades, G.; Yao, Y.; Li, Q.; Zhou, Q. Estrogen receptor alpha signaling regulates breast tumor-initiating cells by down-regulating miR-140 which targets the transcription factor SOX2. J. Biol. Chem. 2012, 287, 41514–41522. [Google Scholar] [CrossRef]
- Eini, R.; Stoop, H.; Gillis, A.J.; Biermann, K.; Dorssers, L.C.; Looijenga, L.H. Role of SOX2 in the etiology of embryonal carcinoma, based on analysis of the NCCIT and NT2 cell lines. PLoS ONE 2014, 9, e83585. [Google Scholar] [CrossRef]
- Leis, O.; Eguiara, A.; Lopez-Arribillaga, E.; Alberdi, M.J.; Hernandez-Garcia, S.; Elorriaga, K.; Pandiella, A.; Rezola, R.; Martin, A.G. Sox2 expression in breast tumours and activation in breast cancer stem cells. Oncogene 2012, 31, 1354–1365. [Google Scholar] [CrossRef]
- Lengerke, C.; Fehm, T.; Kurth, R.; Neubauer, H.; Scheble, V.; Muller, F.; Schneider, F.; Petersen, K.; Wallwiener, D.; Kanz, L.; et al. Expression of the embryonic stem cell marker SOX2 in early-stage breast carcinoma. BMC Cancer 2011, 11, 42. [Google Scholar] [CrossRef]
- Chen, Y.; Shi, L.; Zhang, L.; Li, R.; Liang, J.; Yu, W.; Sun, L.; Yang, X.; Wang, Y.; Zhang, Y.; et al. The molecular mechanism governing the oncogenic potential of SOX2 in breast cancer. J. Biol. Chem. 2008, 283, 17969–17978. [Google Scholar] [CrossRef] [PubMed]
- Surh, Y.J. Cancer chemoprevention with dietary phytochemicals. Nat. Rev. Cancer 2003, 3, 768–780. [Google Scholar] [CrossRef] [PubMed]
- Wattenberg, L.W. Chemoprevention of cancer. Cancer Res. 1985, 45, 1–8. [Google Scholar] [CrossRef]
- S, P.N.; Darvin, P.; Yoo, Y.B.; Joung, Y.H.; Kang, D.Y.; Kim, D.N.; Hwang, T.S.; Kim, S.Y.; Kim, W.S.; Lee, H.K.; et al. The combination of methylsulfonylmethane and tamoxifen inhibits the Jak2/STAT5b pathway and synergistically inhibits tumor growth and metastasis in ER-positive breast cancer xenografts. BMC Cancer 2015, 15, 474. [Google Scholar] [CrossRef]
- Yun, J.H.; Park, Y.G.; Lee, K.M.; Kim, J.; Nho, C.W. Curcumin induces apoptotic cell death via Oct4 inhibition and GSK-3beta activation in NCCIT cells. Mol. Nutr. Food Res. 2015, 59, 1053–1062. [Google Scholar] [CrossRef] [PubMed]
- Nagesh, P.K.B.; Hatami, E.; Chowdhury, P.; Kashyap, V.K.; Khan, S.; Hafeez, B.B.; Chauhan, S.C.; Jaggi, M.; Yallapu, M.M. Tannic acid induces endoplasmic reticulum stress-mediated apoptosis in prostate cancer. Cancers (Basel) 2018, 10, 68. [Google Scholar] [CrossRef]
- Gali, H.U.; Perchellet, E.M.; Perchellet, J.P. Inhibition of tumor promoter-induced ornithine decarboxylase activity by tannic acid and other polyphenols in mouse epidermis in vivo. Cancer Res. 1991, 51, 2820–2825. [Google Scholar]
- Gali-Muhtasib, H.U.; Yamout, S.Z.; Sidani, M.M. Tannins protect against skin tumor promotion induced by ultraviolet-B radiation in hairless mice. Nutr. Cancer 2000, 37, 73–77. [Google Scholar] [CrossRef]
- Naus, P.J.; Henson, R.; Bleeker, G.; Wehbe, H.; Meng, F.; Patel, T. Tannic acid synergizes the cytotoxicity of chemotherapeutic drugs in human cholangiocarcinoma by modulating drug efflux pathways. J. Hepatol. 2007, 46, 222–229. [Google Scholar] [CrossRef]
- Nepka, C.; Sivridis, E.; Antonoglou, O.; Kortsaris, A.; Georgellis, A.; Taitzoglou, I.; Hytiroglou, P.; Papadimitriou, C.; Zintzaras, I.; Kouretas, D. Chemopreventive activity of very low dose dietary tannic acid administration in hepatoma bearing C3H male mice. Cancer Lett. 1999, 141, 57–62. [Google Scholar] [CrossRef]
- Kim, D.A.; Choi, H.S.; Ryu, E.S.; Ko, J.; Shin, H.S.; Lee, J.M.; Chung, H.; Jun, E.; Oh, E.S.; Kang, D.H. Tannic acid attenuates the formation of cancer stem cells by inhibiting NF-kappaB-mediated phenotype transition of breast cancer cells. Am. J. Cancer Res. 2019, 9, 1664–1681. [Google Scholar] [PubMed]
- MacDonald, B.T.; Tamai, K.; He, X. Wnt/beta-catenin signaling: Components, mechanisms, and diseases. Dev. Cell 2009, 17, 9–26. [Google Scholar] [CrossRef] [PubMed]
- Metcalfe, C.; Bienz, M. Inhibition of GSK3 by Wnt signalling--two contrasting models. J. Cell Sci. 2011, 124, 3537–3544. [Google Scholar] [CrossRef] [PubMed]
- Aberle, H.; Bauer, A.; Stappert, J.; Kispert, A.; Kemler, R. beta-catenin is a target for the ubiquitin-proteasome pathway. EMBO J. 1997, 16, 3797–3804. [Google Scholar] [CrossRef] [PubMed]
- Gangrade, A.; Pathak, V.; Augelli-Szafran, C.E.; Wei, H.X.; Oliver, P.; Suto, M.; Buchsbaum, D.J. Preferential inhibition of Wnt/beta-Catenin Signaling by novel benzimidazole compounds in triple-negative breast cancer. Int. J. Mol. Sci. 2018, 19, 1524. [Google Scholar] [CrossRef]
- Pohl, S.G.; Brook, N.; Agostino, M.; Arfuso, F.; Kumar, A.P.; Dharmarajan, A. Wnt signaling in triple-negative breast cancer. Oncogenesis 2017, 6, e310. [Google Scholar] [CrossRef]
- Jang, G.B.; Kim, J.Y.; Cho, S.D.; Park, K.S.; Jung, J.Y.; Lee, H.Y.; Hong, I.S.; Nam, J.S. Blockade of Wnt/β-catenin signaling suppresses breast cancer metastasis by inhibiting CSC-like phenotype. Sci. Rep. 2015, 5, 12465. [Google Scholar] [CrossRef]
- Kischkel, F.C.; Lawrence, D.A.; Chuntharapai, A.; Schow, P.; Kim, K.J.; Ashkenazi, A. Apo2L/TRAIL-dependent recruitment of endogenous FADD and caspase-8 to death receptors 4 and 5. Immunity 2000, 12, 611–620. [Google Scholar] [CrossRef]
- LeBlanc, H.N.; Ashkenazi, A. Apo2L/TRAIL and its death and decoy receptors. Cell Death Differ. 2003, 10, 66–75. [Google Scholar] [CrossRef]
- Johnstone, R.W.; Frew, A.J.; Smyth, M.J. The TRAIL apoptotic pathway in cancer onset, progression and therapy. Nat. Rev. Cancer 2008, 8, 782–798. [Google Scholar] [CrossRef]
- Beaudouin, J.; Liesche, C.; Aschenbrenner, S.; Horner, M.; Eils, R. Caspase-8 cleaves its substrates from the plasma membrane upon CD95-induced apoptosis. Cell Death Differ. 2013, 20, 599–610. [Google Scholar] [CrossRef] [PubMed]
- Rahman, M.; Davis, S.R.; Pumphrey, J.G.; Bao, J.; Nau, M.M.; Meltzer, P.S.; Lipkowitz, S. TRAIL induces apoptosis in triple-negative breast cancer cells with a mesenchymal phenotype. Breast Cancer Res. Treat. 2009, 113, 217–230. [Google Scholar] [CrossRef] [PubMed]
- Rahman, M.; Pumphrey, J.G.; Lipkowitz, S. The TRAIL to targeted therapy of breast cancer. Adv. Cancer Res. 2009, 103, 43–73. [Google Scholar] [CrossRef] [PubMed]
- Liou, G.Y.; Storz, P. Reactive oxygen species in cancer. Free Radic. Res. 2010, 44, 479–496. [Google Scholar] [CrossRef]
- Circu, M.L.; Aw, T.Y. Reactive oxygen species, cellular redox systems, and apoptosis. Free Radic. Biol. Med. 2010, 48, 749–762. [Google Scholar] [CrossRef]
- Thannickal, V.J.; Fanburg, B.L. Reactive oxygen species in cell signaling. Am. J. Physiol. Lung Cell Mol. Physiol. 2000, 279, L1005–L1028. [Google Scholar] [CrossRef] [PubMed]
- Kim, B.M.; Rode, A.B.; Han, E.J.; Hong, I.S.; Hong, S.H. 5-Phenylselenyl- and 5-methylselenyl-methyl-2’-deoxyuridine induce oxidative stress, DNA damage, and caspase-2-dependent apoptosis in cancer cells. Apoptosis 2012, 17, 200–216. [Google Scholar] [CrossRef]
- Park, K.J.; Lee, C.H.; Kim, A.; Jeong, K.J.; Kim, C.H.; Kim, Y.S. Death receptors 4 and 5 activate Nox1 NADPH oxidase through riboflavin kinase to induce reactive oxygen species-mediated apoptotic cell death. J. Biol. Chem. 2012, 287, 3313–3325. [Google Scholar] [CrossRef]
- Yi, L.; Zongyuan, Y.; Cheng, G.; Lingyun, Z.; Guilian, Y.; Wei, G. Quercetin enhances apoptotic effect of tumor necrosis factor-related apoptosis-inducing ligand (TRAIL) in ovarian cancer cells through reactive oxygen species (ROS) mediated CCAAT enhancer-binding protein homologous protein (CHOP)-death receptor 5 pathway. Cancer Sci. 2014, 105, 520–527. [Google Scholar] [CrossRef]
- Suzuki-Karasaki, M.; Ochiai, T.; Suzuki-Karasaki, Y. Crosstalk between mitochondrial ROS and depolarization in the potentiation of TRAIL-induced apoptosis in human tumor cells. Int. J. Oncol. 2014, 44, 616–628. [Google Scholar] [CrossRef]
- Zhang, M.; Harashima, N.; Moritani, T.; Huang, W.; Harada, M. The roles of ROS and caspases in TRAIL-induced apoptosis and necroptosis in human pancreatic cancer cells. PLoS ONE 2015, 10, e0127386. [Google Scholar] [CrossRef] [PubMed]
- Serrano, J.; Puupponen-Pimiä, R.; Dauer, A.; Aura, A.M.; Saura-Calixto, F. Tannins: Current knowledge of food sources, intake, bioavailability and biological effects. Mol. Nutr. Food Res. 2009, 53, S310–S329. [Google Scholar] [CrossRef] [PubMed]
- Choi, H.S.; Kim, D.A.; Chung, H.; Park, I.H.; Kim, B.H.; Oh, E.S.; Kang, D.H. Screening of breast cancer stem cell inhibitors using a protein kinase inhibitor library. Cancer Cell Int. 2017, 17, 25. [Google Scholar] [CrossRef] [PubMed]
- Mori, T.; Rezai-Zadeh, K.; Koyama, N.; Arendash, G.W.; Yamaguchi, H.; Kakuda, N.; Horikoshi-Sakuraba, Y.; Tan, J.; Town, T. Tannic acid is a natural β-secretase inhibitor that prevents cognitive impairment and mitigates Alzheimer-like pathology in transgenic mice. J. Biol. Chem. 2012, 287, 6912–6927. [Google Scholar] [CrossRef] [PubMed]
- Wang, M.; Huang, H.; Liu, S.; Zhuang, Y.; Yang, H.; Li, Y.; Chen, S.; Wang, L.; Yin, L.; Yao, Y.; et al. Tannic acid modulates intestinal barrier functions associated with intestinal morphology, antioxidative activity, and intestinal tight junction in a diquat-induced mouse model. RSC Adv. 2019, 9, 31988. [Google Scholar] [CrossRef]
- Yang, S.; Lin, G.; Deng, L.; Lu, G.X. Tumourigenic characteristics of embryonal carcinoma cells as a model for studying tumour progression of human embryonic stem cells. Cell Prolif. 2012, 45, 299–310. [Google Scholar] [CrossRef] [PubMed]
- Gearhart, J. New potential for human embryonic stem cells. Science 1998, 282, 1061–1062. [Google Scholar] [CrossRef]
- Chen, K.S.; Hsiao, Y.C.; Kuo, D.Y.; Chou, M.C.; Chu, S.C.; Hsieh, Y.S.; Lin, T.H. Tannic acid-induced apoptosis and -enhanced sensitivity to arsenic trioxide in human leukemia HL-60 cells. Leuk Res. 2009, 33, 297–307. [Google Scholar] [CrossRef]
- Pandit, H.; Li, Y.; Li, X.; Zhang, W.; Li, S.; Martin, R.C.G. Enrichment of cancer stem cells via beta-catenin contributing to the tumorigenesis of hepatocellular carcinoma. BMC Cancer 2018, 18, 783. [Google Scholar] [CrossRef]
- Li, W.; Yang, C.J.; Wang, L.Q.; Wu, J.; Dai, C.; Yuan, Y.M.; Li, G.Q.; Yao, M.C. A tannin compound from Sanguisorba officinalis blocks Wnt/beta-catenin signaling pathway and induces apoptosis of colorectal cancer cells. Chin. Med. 2019, 14, 22. [Google Scholar] [CrossRef]
- Koval, A.; Pieme, C.A.; Queiroz, E.F.; Ragusa, S.; Ahmed, K.; Blagodatski, A.; Wolfender, J.L.; Petrova, T.V.; Katanaev, V.L. Tannins from Syzygium guineense suppress Wnt signaling and proliferation of Wnt-dependent tumors through a direct effect on secreted Wnts. Cancer Lett 2018, 435, 110–120. [Google Scholar] [CrossRef] [PubMed]
- Soner, B.C.; Aktug, H.; Acikgoz, E.; Duzagac, F.; Guven, U.; Ayla, S.; Cal, C.; Oktem, G. Induced growth inhibition, cell cycle arrest and apoptosis in CD133+/CD44+ prostate cancer stem cells by flavopiridol. Int. J. Mol. Med. 2014, 34, 1249–1256. [Google Scholar] [CrossRef] [PubMed]
- Gulappa, T.; Reddy, R.S.; Suman, S.; Nyakeriga, A.M.; Damodaran, C. Molecular interplay between cdk4 and p21 dictates G0/G1 cell cycle arrest in prostate cancer cells. Cancer Lett. 2013, 337, 177–183. [Google Scholar] [CrossRef] [PubMed]
- Zhang, X.; Qin, Y.; Pan, Z.; Li, M.; Liu, X.; Chen, X.; Qu, G.; Zhou, L.; Xu, M.; Zheng, Q.; et al. Cannabidiol Induces Cell Cycle Arrest and Cell Apoptosis in Human Gastric Cancer SGC-7901 Cells. Biomolecules 2019, 9, 302. [Google Scholar] [CrossRef] [PubMed]
- Ly, J.D.; Grubb, D.R.; Lawen, A. The mitochondrial membrane potential (deltapsi(m)) in apoptosis; an update. Apoptosis 2003, 8, 115–128. [Google Scholar] [CrossRef]
- Tatsumi, T.; Shiraishi, J.; Keira, N.; Akashi, K.; Mano, A.; Yamanaka, S.; Matoba, S.; Fushiki, S.; Fliss, H.; Nakagawa, M. Intracellular ATP is required for mitochondrial apoptotic pathways in isolated hypoxic rat cardiac myocytes. Cardiovasc. Res. 2003, 59, 428–440. [Google Scholar] [CrossRef][Green Version]
- Khodapasand, E.; Jafarzadeh, N.; Farrokhi, F.; Kamalidehghan, B.; Houshmand, M. Is Bax/Bcl-2 ratio considered as a prognostic marker with age and tumor location in colorectal cancer? Iran. Biomed. J. 2015, 19, 69–75. [Google Scholar] [CrossRef]
- Guicciardi, M.E.; Gores, G.J. Life and death by death receptors. FASEB J. 2009, 23, 1625–1637. [Google Scholar] [CrossRef]
- Suzuki-Karasaki, Y.; Fujiwara, K.; Saito, K.; Suzuki-Karasaki, M.; Ochiai, T.; Soma, M. Distinct effects of TRAIL on the mitochondrial network in human cancer cells and normal cells: Role of plasma membrane depolarization. Oncotarget 2015, 6, 21572–21588. [Google Scholar] [CrossRef]
- Elmore, S. Apoptosis: A review of programmed cell death. Toxicol. Pathol. 2007, 35, 495–516. [Google Scholar] [CrossRef]


© 2020 by the authors. Licensee MDPI, Basel, Switzerland. This article is an open access article distributed under the terms and conditions of the Creative Commons Attribution (CC BY) license (http://creativecommons.org/licenses/by/4.0/).
Share and Cite
Sp, N.; Kang, D.Y.; Jo, E.S.; Rugamba, A.; Kim, W.S.; Park, Y.-M.; Hwang, D.-Y.; Yoo, J.-S.; Liu, Q.; Jang, K.-J.; et al. Tannic Acid Promotes TRAIL-Induced Extrinsic Apoptosis by Regulating Mitochondrial ROS in Human Embryonic Carcinoma Cells. Cells 2020, 9, 282. https://doi.org/10.3390/cells9020282
Sp N, Kang DY, Jo ES, Rugamba A, Kim WS, Park Y-M, Hwang D-Y, Yoo J-S, Liu Q, Jang K-J, et al. Tannic Acid Promotes TRAIL-Induced Extrinsic Apoptosis by Regulating Mitochondrial ROS in Human Embryonic Carcinoma Cells. Cells. 2020; 9(2):282. https://doi.org/10.3390/cells9020282
Chicago/Turabian StyleSp, Nipin, Dong Young Kang, Eun Seong Jo, Alexis Rugamba, Wan Seop Kim, Yeong-Min Park, Dae-Yong Hwang, Ji-Seung Yoo, Qing Liu, Kyoung-Jin Jang, and et al. 2020. "Tannic Acid Promotes TRAIL-Induced Extrinsic Apoptosis by Regulating Mitochondrial ROS in Human Embryonic Carcinoma Cells" Cells 9, no. 2: 282. https://doi.org/10.3390/cells9020282
APA StyleSp, N., Kang, D. Y., Jo, E. S., Rugamba, A., Kim, W. S., Park, Y.-M., Hwang, D.-Y., Yoo, J.-S., Liu, Q., Jang, K.-J., & Yang, Y. M. (2020). Tannic Acid Promotes TRAIL-Induced Extrinsic Apoptosis by Regulating Mitochondrial ROS in Human Embryonic Carcinoma Cells. Cells, 9(2), 282. https://doi.org/10.3390/cells9020282