Article

Long-Term Cd Exposure Alters the Metabolite Profile in Stem Tissue of Medicago sativa

1
GreenTech Innovation Center, Environmental Research and Innovation Department, Luxembourg Institute of Science and Technology, 5, Avenue des Hauts-Fourneaux, 4362 Esch-sur-Alzette, Luxembourg
2
Centre for Environmental Sciences, Campus Diepenbeek, Hasselt University, Agoralaan Building D, 3590 Diepenbeek, Belgium
3
Institute of Crop Science and Resource Conservation (INRES), University of Bonn, Friedrich-Ebert-Allee 144, 53113 Bonn, Germany
4
Groupe de Recherche en Physiologie Végétale, Earth and Life Institute—Agronomy, Université Catholique de Louvain, 5, Place Croix du Sud, 1348 Louvain-la-Neuve, Belgium
5
Max-Planck-Institute of Plant Molecular Physiology, Am Mühlenberg 1, 14476 Potsdam, Germany
6
Centre of Plant Systems Biology and Biotechnology, 4000 Plovdiv, Bulgaria
*
Author to whom correspondence should be addressed.
Current Affiliation: Laboratoire de Physiologie et de Génétique Moléculare des Plantes, Université libre de Bruxelles, 1050 Brussels, Belgium.
Cells 2020, 9(12), 2707; https://doi.org/10.3390/cells9122707
Submission received: 18 November 2020 / Revised: 14 December 2020 / Accepted: 14 December 2020 / Published: 17 December 2020
(This article belongs to the Special Issue Metabolomics in Plant Research)

Abstract

:
As a common pollutant, cadmium (Cd) is one of the most toxic heavy metals accumulating in agricultural soils through anthropogenic activities. The uptake of Cd by plants is the main entry route into the human food chain, whilst in plants it elicits oxidative stress by unbalancing the cellular redox status. Medicago sativa was subjected to chronic Cd stress for five months. Targeted and untargeted metabolic analyses were performed. Long-term Cd exposure altered the amino acid composition with levels of asparagine, histidine and proline decreasing in stems but increasing in leaves. This suggests tissue-specific metabolic stress responses, which are often not considered in environmental studies focused on leaves. In stem tissue, profiles of secondary metabolites were clearly separated between control and Cd-exposed plants. Fifty-one secondary metabolites were identified that changed significantly upon Cd exposure, of which the majority are (iso)flavonoid conjugates. Cadmium exposure stimulated the phenylpropanoid pathway that led to the accumulation of secondary metabolites in stems rather than cell wall lignification. Those metabolites are antioxidants mitigating oxidative stress and preventing cellular damage. By an adequate adjustment of its metabolic composition, M. sativa reaches a new steady state, which enables the plant to acclimate under chronic Cd stress.

1. Introduction

Heavy metal pollution, being a stressor for plants, is a great concern of the industrial time. Therefore, cadmium (Cd) is a common pollutant found in the soil of industrial sites, which can be taken up by the plant root system and enter the human food chain [1]. Cadmium toxicity in plants causes reduced growth, leaf chlorosis, imbalanced water household and impaired photosynthesis. Cadmium elicits oxidative stress in plant cells by interfering with the activity of various enzymes involved in antioxidative defense [2], misbalancing production of antioxidants such as glutathione (GSH) [3] and disrupting neutralization of reactive oxygen species (ROS) [4,5,6,7]. Enhanced ROS levels lead to DNA damage, lipid peroxidation and protein modification, which interferes with their activity [8,9,10]. Plants have developed several endogenous mechanisms to counteract toxic effects such as the synthesis of metabolites [11].
Metabolites are the biological active compounds in plant cells and a result of the integration of gene expression and protein activity [12]. As such, metabolites reflect the molecular phenotype better than genes or proteins alone and are important to characterize biological processes [13,14]. It is estimated that the number of different metabolites in the plant kingdom ranges between 200,000 and 1,000,000, but it can also just be a few thousands for a single species (approximately 5000 metabolites in Arabidopsis thaliana) [15]. Plant metabolites are commonly classified into primary metabolites, secondary metabolites and plant hormones. While primary metabolites such as amino acids (AAs) and polyamines (PAs) are ubiquitous and required for growth and development, the abundance of secondary metabolites is regulated by plant development and environmental factors [16,17]. The latter are classified according to their chemical structure in major groups such as terpenes, alkaloids and phenolics [18]. Phenolic compounds are a remarkably diverse group of secondary metabolites and include lignins, lignans and tannins but also flavones and isoflavones [19]. The distinction into primary metabolites, secondary metabolites and plant hormones became common definitions in plant biology. However, recent studied blur this strict functional separation as secondary metabolites can have regulatory functions like primary metabolites and furthermore reintegrate into primary plant metabolism [20].
One attempt to study primary and secondary metabolites in plants is that of metabolomics, a fast-developing high-throughput approach, which utilizes targeted metabolite quantification or untargeted metabolite profiling [21,22]. Gas chromatography–mass spectrometry, capillary electrophoresis, nuclear magnetic resonance spectroscopy (NMR) and liquid chromatography (LC–MS) are commonly used techniques [23,24]. But the immense variability in chemical structure and properties of metabolites makes it nearly impossible to identify them all. However, recent advances in ultra-high-performance liquid chromatography (UHPLC–MS) have expended the sensitivity, resolution and throughput of this technique for metabolite analysis [25,26]. Metabolomics is frequently used to study plant stress responses to biotic and abiotic stress in order to decipher which molecules are important during stress responses and tolerance acquisition [27,28,29]. The profile of primary metabolites such as AAs was analyzed by 1H NMR and GC–MS in response to different heavy metals and revealed a specific metabolic profile in response to the applied stress, which implied a vital role of AAs during stress adaptation [30,31,32]. HPLC and LC–MS measurements were utilized to investigate changes in the profile of phenolic compounds in response to heavy metal stress [33,34,35]. It was demonstrated that heavy metal stress increases the total content of phenols and the application of different heavy metals alters the phenolic profile [36]. Phenolic compounds can act as potential antioxidants by scavenging free radicals and/or act as metal chelators [37,38,39]. The capacity of flavones to bind metals was recently demonstrated in plant extracts [40] and metal chelating properties of flavones were reported with regard to the resistance to aluminium toxicity in maize [41].
The globally important forage crop Medicago sativa was and is mainly used for feeding livestock [42]. It is an excellent source of protein and dietary fibers, providing a variety of micronutrients and carbohydrates [43]. The plant leaves have a high protein content, which fits the needs of the feed market. Its less digestible stems represent more than 50% of the produced biomass and are rich in cell wall material. Therefore, M. sativa stem tissue is often used in research to study fundamental processes taking place at the cell wall [44,45]. It can be used for industrial purposes such as bioethanol production [46,47] increasing the economic value of the plant. As a rich source of secondary metabolites, M. sativa is studied for its bioactive compounds and their application in industry and agriculture [37,48].
In previous studies, the response of M. sativa to an environmentally realistic Cd concentration (10 mg kg−1 soil) [49] has been investigated focusing on the cell wall [50,51] with a specific emphasis on the stems. Despite representing 50% of the harvestable biomass of M. sativa, few studies have specifically focused on the impact of environmental constraints on stems. Long-term Cd exposure induced changes in the gene expression of enzymes in the phenylpropanoid pathway as well as ethylene biosynthesis in stem tissue [52]. Ethylene induces the phenylpropanoid pathway, which provides the precursor molecules for monolignol biosynthesis and lignin formation. Lignin deposition in the cell wall is commonly found in response to Cd exposure [9,53,54]. However, the lignin content did not increase in the stem cell wall as a consequence of Cd exposure [52], although increased cell-wall-located peroxidase abundance [50] and phenylpropanoid pathway induction [52] would have suggested that. Both monolignols and flavonoids derive from the phenylpropanoid pathway (Pawlak-Sprada et al., 2011a, 2011b). Here, targeted and untargeted metabolic approaches were applied using different metabolomics platforms (GC–MS and UPLC–MS) to investigate whether there is a shunt of the shared precursor molecules towards the (iso)flavonoid pathway instead of lignin biosynthesis.

2. Materials and Methods

2.1. Plant Growth and Sampling

Medicago sativa L. (cultivar Giulia) plants were exposed to 10 mg Cd kg−1 soil (spiked as CdSO4) in a long-term experiment, which represents realistic Cd concentrations found in upper soil [49]. Experimental conditions and sampling were previously described in detail [50]. Metabolite analysis was carried out using the same samples. Briefly, plants were potted in 12 times 12 pots for each condition and grown for 5 months with an intermediate cutting as in agricultural practice. Plants were mainly kept in the greenhouse. Neither temperature nor photoperiod were controlled during the experiment and no fertilizer was applied. Five biological replicates for each condition were taken, with a pool of stem tissue from 24 pots corresponding to one biological replicate. Stems were separated from leaves, the first as well as last two internodes removed and subsequently frozen in liquid nitrogen. Samples were ground in liquid nitrogen and kept at −80 °C till further use. Additionally, the Cd content was determined in all organs: Leaves: 21.54 µg g−1 dry weight; Stems: 40.09 µg g−1 dry weight; Roots: 169.91 µg g−1 dry weight, indicating a significant accumulation of Cd in the different tissues (Cd content in respective control samples: Leaves: 0.31 µg g−1 dry weight; Stems: 0.24 µg g−1 dry weight; Roots: 2.36 µg g−1 dry weight) [50].

2.2. Measurement of Glutathione in Stem Tissue

Glutathione (GSH) analysis was adopted from a previously published protocol [55]. All extraction steps were performed on ice. Five replicates of each condition were used for statistical analysis. Approximately 120 mg fresh weight (FW) of deep-frozen ground stem tissue was extracted with 200 mM HCl using a mortar and pestle. After centrifugation (16,000× g, 10 min, 4 °C), 350 µL of the supernatant was transferred to a new tube and the pH of each extract was adjusted to 4.5 with 200 mM NaOH. The GSH assay relies on the reduction of 5,5-dithiobis(2-nitro-benzoic acid) (DTNB) to trinitrobenzol (TNB) via GSH that is oxidized to GSSG. The latter is recycled via glutathione reductase (GR). Glutathione reductase (Sigma-Aldrich, Darmstadt, Germany) was suspended in 200 mM NaH2PO4-EDTA to a concentration of 20 U mL−1 and kept in aliquots of 500 µL. For each measurement series, a fresh aliquot was used. To measure only the oxidized glutathione disulphide (GSSG) content, each extract was treated with 2-vinylpyridine to complex free GSH. Extracts were incubated at 20 °C for 30 min and centrifuged (16,000× g, 10 min, 4 °C) to eliminate complexed GSH. Total GSH content (GSSG and GSH) was measured in the non-treated extract. Measurements were performed in triplicates in 96-well plates. For the total GSH content, 10 µL of each extract was pipetted into plate wells containing 200 mM NaH2PO4, 10 mM EDTA, 10 mM NADH and 12 mM DTNB. The reaction was started by adding GR and monitored at 412 nm. A GSH standard curve between 0 and 1000 pmol was generated on the same plate. The GSSG was measured in a similar way using 40 µL of the treated extract and with a standard curve ranging between 0 and 400 pmol.

2.3. Quantification of Primary Metabolites

2.3.1. HPLC-FLD Analysis of PAs in Stems

Polyamines (PAs) were extracted from 200 mg ground stem tissues with 500 μL HClO4 4% (v/v) under vigorous vortexing, then kept at 4 °C for 1 h and subsequently centrifuged at 13,000× g at 4 °C for 20 min. The obtained pellet was re-extracted with 500 µL HClO4 4% (v/v). 1,7-diaminoheptane (5 mg L−1) was used as an internal standard. For fluorescence detection, PAs were derivatized by dansylation [56] and the dried extract was dissolved in 1 mL methanol and filtered through 0.45 µm microfilters (Chromafil PES-45/15, Macherey-Nagel, Düren, Germany). A total of 5 µL of the sample was injected on a Nucleodur C18 Pyramid column (125 × 4.6 mm internal diameter; 5 μm particle size) (Macherey-Nagel) at 40 °C. Samples were analyzed by high-performance liquid chromatography coupled with a fluorescence detector (HPLC-FLD) from Shimadzu, equipped with a solvent delivery unit LC-20AT, an SIL-HTc autosampler and an RF-20A Fluorescence Detector (Shimadzu, ‘S Hertogenbosch, The Netherlands). Excitation wavelength was set at 340 nm and the emission wavelength was set at 510 nm. The mobile phase consisted of water (eluent A) and acetonitrile (ACN) (eluent B) with a flow rate of 1.0 mL min−1. The gradient program was 40% B to 91% B (20 min), 91% B to 100% B (2 min), 100% B (8 min), 100% B to 40% B (1 min), and column equilibration was at 40% B during 4 min. Six-point calibration curves ranging from 3.125 to 100 µM with custom-made external standard solutions and an internal standard (1,7-diaminoheptane) were used to quantify free PAs. Calibration of the system was confirmed every ten injections by using a check standard solution. Internal standard gave information about the recovery of the extraction and derivatization during the evaluation of PAs content.

2.3.2. UHPLC–DAD Analysis of Amino Acids in Stems

Approximately 50 mg of ground stem tissue were freeze dried prior to extraction. Extraction was done with 400 μL methanol containing 10 mM beta-aminobutyric acid (BABA) as internal standard under vigorous vortexing and subsequent shaking (1400 rpm, 15 min). Two hundred μL of chloroform were added, samples were shaken (1400 rpm, 15 min), 400 μL of H2O were added and samples were vortexed and centrifuged (12,000× g, 5 min). A total of 600 μL of the supernatant was collected. A 50 μL sample aliquot was first dried using a vacuum centrifuge and resuspended in 50 μL H2O prior to analysis. The derivatisation of samples and AA standards was done using the AccQ-Tag Ultra Derivatization Kit (Waters, Milford, MA, USA). In total, 5 μL of samples and 5 μL of the AA standards were mixed separately with 35 μL AccQ-Tag borate buffer. To these mixtures, 10 μL AccQTag reagent (Waters AccQ-Tag Ultra Derivatization Kit) were added, samples were vortexed, spun down and incubated for 10 min at 55 °C. UHPLC–DAD (ultra-high performance liquid chromatography–diode array detector) was performed on an Acquity UPLC system (Waters) equipped with an Acquity tunable UV detector. The used column was Acquity UPLC BEH C18 column (2.1 × 100 mm, 1.7 μm particle size, Waters). The flow rate was 0.7 mL min−1 and the column temperature was kept at 55 °C. The injection volume was 3 µL and the detection wavelength was set at 260 nm. Two eluents were used: (A) AccQ Tag eluent; (B) ACN. The following gradient elution was used: 0–0.54 min, 0.1% B; 6.5 min, 9.1% B; 8.50 min, 21.2% B; 8.90–9.50 min, 59.6% B; 9.60–10.10 min, 0.1% B.

2.3.3. GC–MS Analysis of Primary Metabolites in Leaves

Ground Medicago sativa leaf tissue was extracted as described previously [57]. Briefly, 50 mg of plant tissues was extracted by adding 700 μL 100% methanol. A total of 700 μL from the extraction liquid was taken and transferred into a new reaction tube, followed by adding 375 μL CHCl3 and 750 μL water. After centrifugation, 150 µL of supernatant was vacuum dried, and the residue derivatized for 120 min at 37 °C (40 µL of 20 mg mL−1 methoxyamine hydrochloride in pyridine) followed by a 30 min treatment at 37 °C with 70 µL of N-Methyl-N-(trimethylsilyl)trifluoracetamide. The gas chromatography–mass spectrometry (GC–MS) system used was a gas chromatograph coupled to a time-of-flight mass spectrometer (Pegasus HT TOF–MS, Leco, Saint Joseph, MI, USA). Gas chromatography was performed on a 30 m DB-35 column. The used carrier gas was helium at a constant flow rate of 2 mL s−1. Samples were injected by an auto sampler Gerstel Multi Purpose system at an injection temperature of 230 °C. The transfer line and ion source were set to 250 °C. The initial temperature of the oven (85 °C) increased at a rate of 15 °C min−1 up to a final temperature of 360 °C. Mass spectra were recorded at 20 scans s−1 with m z−1 70–600 scanning range after a solvent delay of 180 s. Chromatograms and mass spectra were evaluated by using Chroma TOF 4.5 (Leco) and TagFinder v4.2 software [57,58].

2.4. Quantification of Secondary Metabolites

2.4.1. Extraction

Ground stem tissue samples (150 mg) from M. sativa were freeze dried and extractions were done with 1790 µL methanol:water (4:1, v/v). A total of 10 µL of 4-methylumbelliferone (500 µg mL−1) was added to the sample as an extraction internal standard. Samples were homogenized using a vortex (30 s) and shaken for 4 h at room temperature to extract the metabolites. Samples were again vortexed (30 s) followed by centrifugation (20,000 × g for 30 min at 4 °C). The supernatant was collected and dried using a vacuum centrifuge. Dried extracts were solubilized in 1460 µL methanol:water (5:95, v/v) and filtered through a syringe filter (0.2 µm, PTFE Millex-LG; Merck KGaA, Darmstadt, Germany).

2.4.2. UHPLC–MS Analysis

Extracts were analyzed with a Waters Acquity UPLC system coupled to a high-resolution time-of-flight mass spectrometer (TripleTOF 5600+; AB Sciex, Foster City, CA, USA). Samples were analyzed in positive and negative ion mode and each 5 µL aliquot was analyzed in two technical replicates. A reverse-phase Acquity UPLC BEH C18 column (2.1 × 100 mm, 1.7 μm particle size, Waters) was utilized with 0.1% formic acid in water (A) and 0.1% formic acid in ACN (B) as eluents at the following gradient: 0 min, 1% B; 4 min, 1% B; 16 min, 5% B; 35 min, 40% B; 45 min, 100% B; 50 min, 100% B; 53 min, 1% B; 60 min, 1% B at a flow of 0.5 mL min−1 and 50 °C as the column temperature. An electrospray ionization (ESI) source was used to ionize compounds with the following parameters for the positive and negative mode: source temperature, 650 °C; ion spray voltage of 4.5 and −4.5 kV, respectively; curtain gas (nitrogen) of 30; nebulizer gas (air) of 55; turbine gas (air) of 50. Precursor charge state selection was set at 1. Survey scans were acquired in 175 ms for information-dependent acquisition (IDA in high sensitivity mode), and product ion scans of the 10 most intense peaks were collected when a threshold of 100 counts per s was reached. The total cycle time was fixed at 2.25 s. Each MS1 scan is the sum of four time bins at a pulser frequency value of 16.4 kHz. A sweeping collision energy setting of 15 eV in positive and −15 eV in negative mode was applied for collision-induced dissociation. The declustering potential was set at 60 and −60 eV in positive and negative mode, respectively. Dynamic exclusion was set for 8 s after 2 occurrences. For MS1, full HR–MS spectra between 100 and 1300 mass-to-charge ratio (m z−1) were recorded. MS2 scans were recorded between 25 and 1300 m z−1.

2.4.3. Data Processing

Data were processed and analyzed using Progenesis QI (v2.3, Nonlinear Dynamics, Newcastle upon Tyne, UK). Each UPLC–MS run was imported as an ion-intensity map and runs were aligned in the retention time direction. A corporate run representing the compounds in all samples was used for peak picking and was compared to all the runs, to ensure that the same ions are detected in every run. Data were normalized according to total ion intensity. Only features with MS2 data, and both fold-change ≥ 1.5 and p-value ≤ 0.05 in two technical replicates were considered for identification. Metabolites were identified by their accurate masses using an in-house database as well as CHEBI 3-star (https://www.ebi.ac.uk/chebi), MassBank, PubChem and the NIST MS/MS database. The output was reviewed with PeakView (v 1.2.0.3, AB SCIEX), Metlin (https://metlin.scripps.edu/index.php) and PubChem databases (https://pubchem.ncbi.nlm.nih.gov) as well as literature data for structure elucidation.

2.5. Gene Expression Analyses

The RNAqueous™ Kit (Life Technologies, Carlsbad, CA, USA) was used according to the manufacturer’s instructions for RNA extraction from five biological replicates. The RNA was purified by precipitation with 3 M sodium acetate and 100% isopropanol, subsequently washed with 70% ethanol and resuspended in RNase-free water. The RNA was quantified with a NanoDrop®® ND-1000 spectrophotometer (Thermo Fischer Scientific, Braunschweig, Germany) (A260/280 and A260/230 ratio between 1.9 and 2.5) and a Bioanalyzer (Agilent Life Science, Heverlee, Belgium). The RNAs displayed an RIN value between 8.7 and 9.0. Reverse transcription was carried out with the ProtoScript II Reverse Transcriptase (NEB, Massachusetts, USA) following the manufacturer’s instruction. Sequences for the genes of interest were obtained by searching the Alfalfa Gene Index and Expression Atlas Database (http://plantgrn.noble.org/AGED/index.jsp). Specific primer pairs were designed with Primer3Plus (www.bioinformatics.nl/cgi-bin/primer3plus/primer3plus.cgi) and validated using OligoAnalyzer 3.1 (https://eu.idtdna.com/calc/analyzer) (Table S1). Real-time quantitative PCR (qPCR) runs were performed with the Takyon SYBR Green low ROX (Eurogentec, Seraing, Belgium) in 384 well plates on a ViiA7 Real-Time PCR system (Applied Biosystems). Minimum information for the publication of qRT-PCR experiments [59] is detailed in Table S2. At the end of each run, a melting curve was generated to check the specificity of the products. Relative gene expression was determined using qBasePLUS software v2.5 (Biogazelle, Zwijnaarde, Belgium). Reference genes were selected according to literature [60], and the two most stable ones were used for data normalization (Table S1).

3. Results

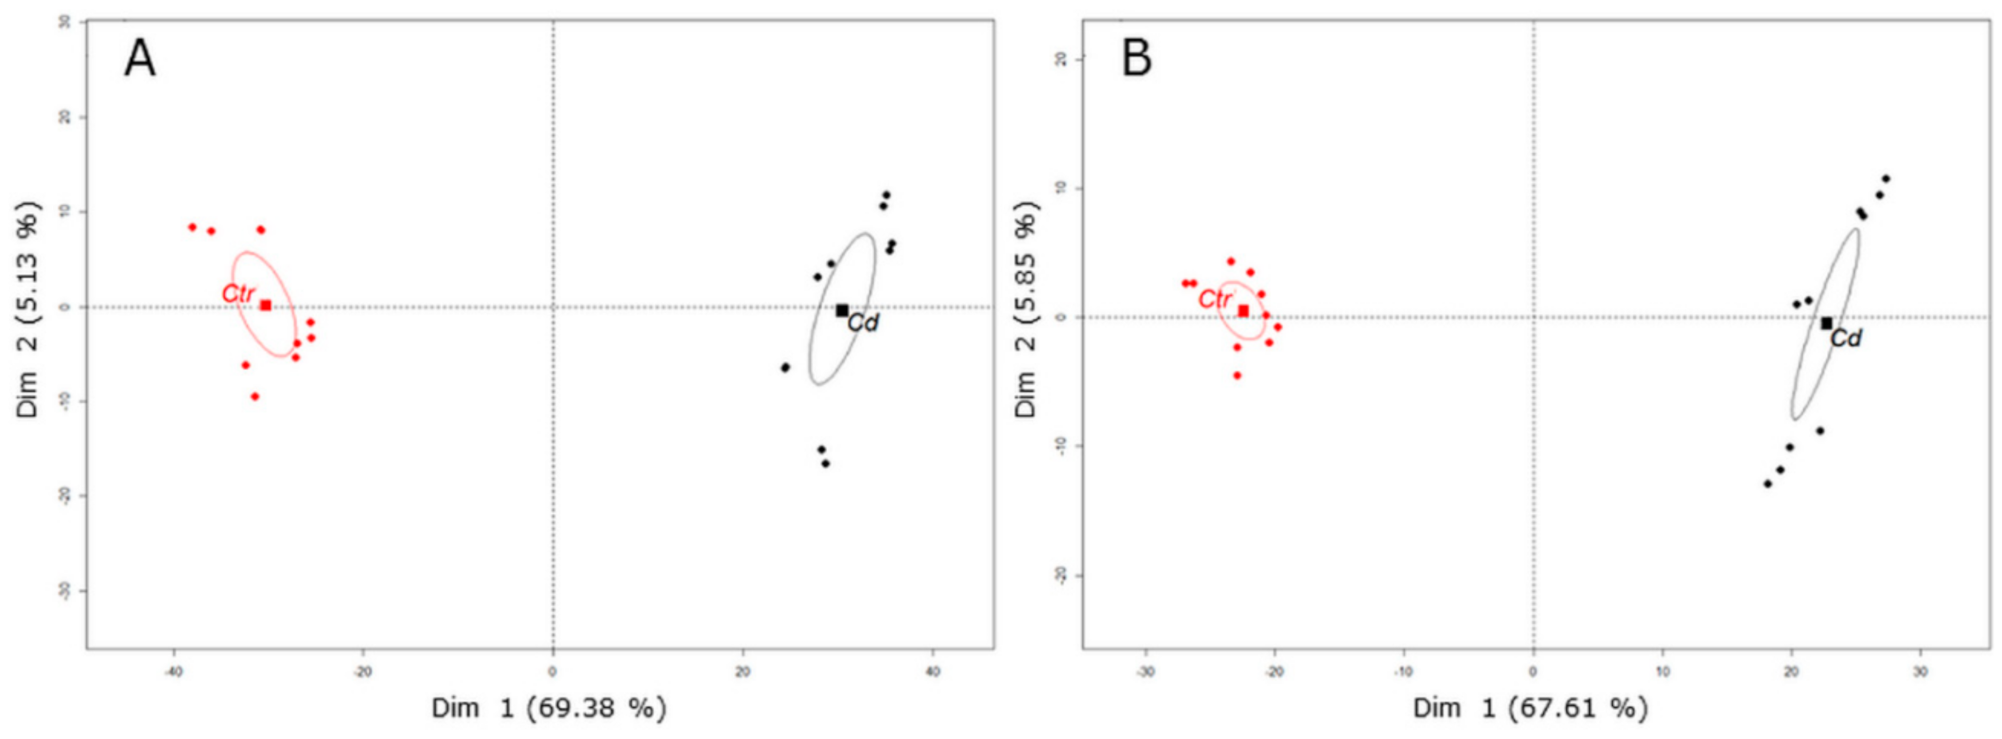
3.1. Cd Stress Provokes the Accumulation of (iso)Flavone Conjugates in Stem Tissue

A recent study of M. sativa stem tissue in response to long-term Cd exposure suggested a Cd-induced induction of the phenylpropanoid pathway [52], which diverges either into the monolignol biosynthetic pathway or flavonoid biosynthetic pathway. Monolignols are the building blocks of lignin and cell wall lignification in response to heavy metal exposure is reported in literature [61,62]. However, the cell wall of alfalfa did not show induced lignification due to Cd exposure [52].
In stem tissue of M. sativa, expression levels of genes involved in flavone synthesis, namely chalcone isomerase, chalcone reductase and isoflavone synthase were significantly higher in response to Cd exposure (Table 1).
To better understand the metabolic changes associated with long-term Cd exposure in M. sativa stems, metabolic profiling was performed using UHPLC–MS in negative and positive mode. Principal component analysis (PCA) clearly separated metabolic profiles between Cd-exposed and control stem samples (Figure 1). When samples were run in negative mode, PCA explained 74.51% of the observed data variability, thereby Dim 1 explained most of the variability (69.38%) and Dim 2 explained 5.13% (Figure 1A). In positive mode, PCA explained 73.46% of the observed data variation and Dim 1 explained most of the variability (67.61%) (Figure 1B). In negative mode, 1362 metabolite features (retention time x m z−1) were detected that significantly changed upon Cd exposure (with p-value ≤ 0.05 and fold-change ≥ 1.5) and in total 25 metabolites were putatively identified (Table 2). In positive mode, 769 metabolite features significantly changed in response to Cd (with p-value ≤ 0.05 and fold-change ≥ 1.5) and a total number of 26 metabolites were putatively identified (Table 3). Most identified secondary metabolites are (iso)flavones conjugated with a hexoside being hydroxylated or dihydroxylated. With only a few exceptions (N-acetyl-hexosamine derivate, tetrahydroxy(iso)flavone-hexoside, trihydroxy(iso)flavone conjugate), identified secondary metabolites accumulate in response to Cd exposure (Table 2 and Table 3). References on which identification was based are given in Table 2 and Table 3.

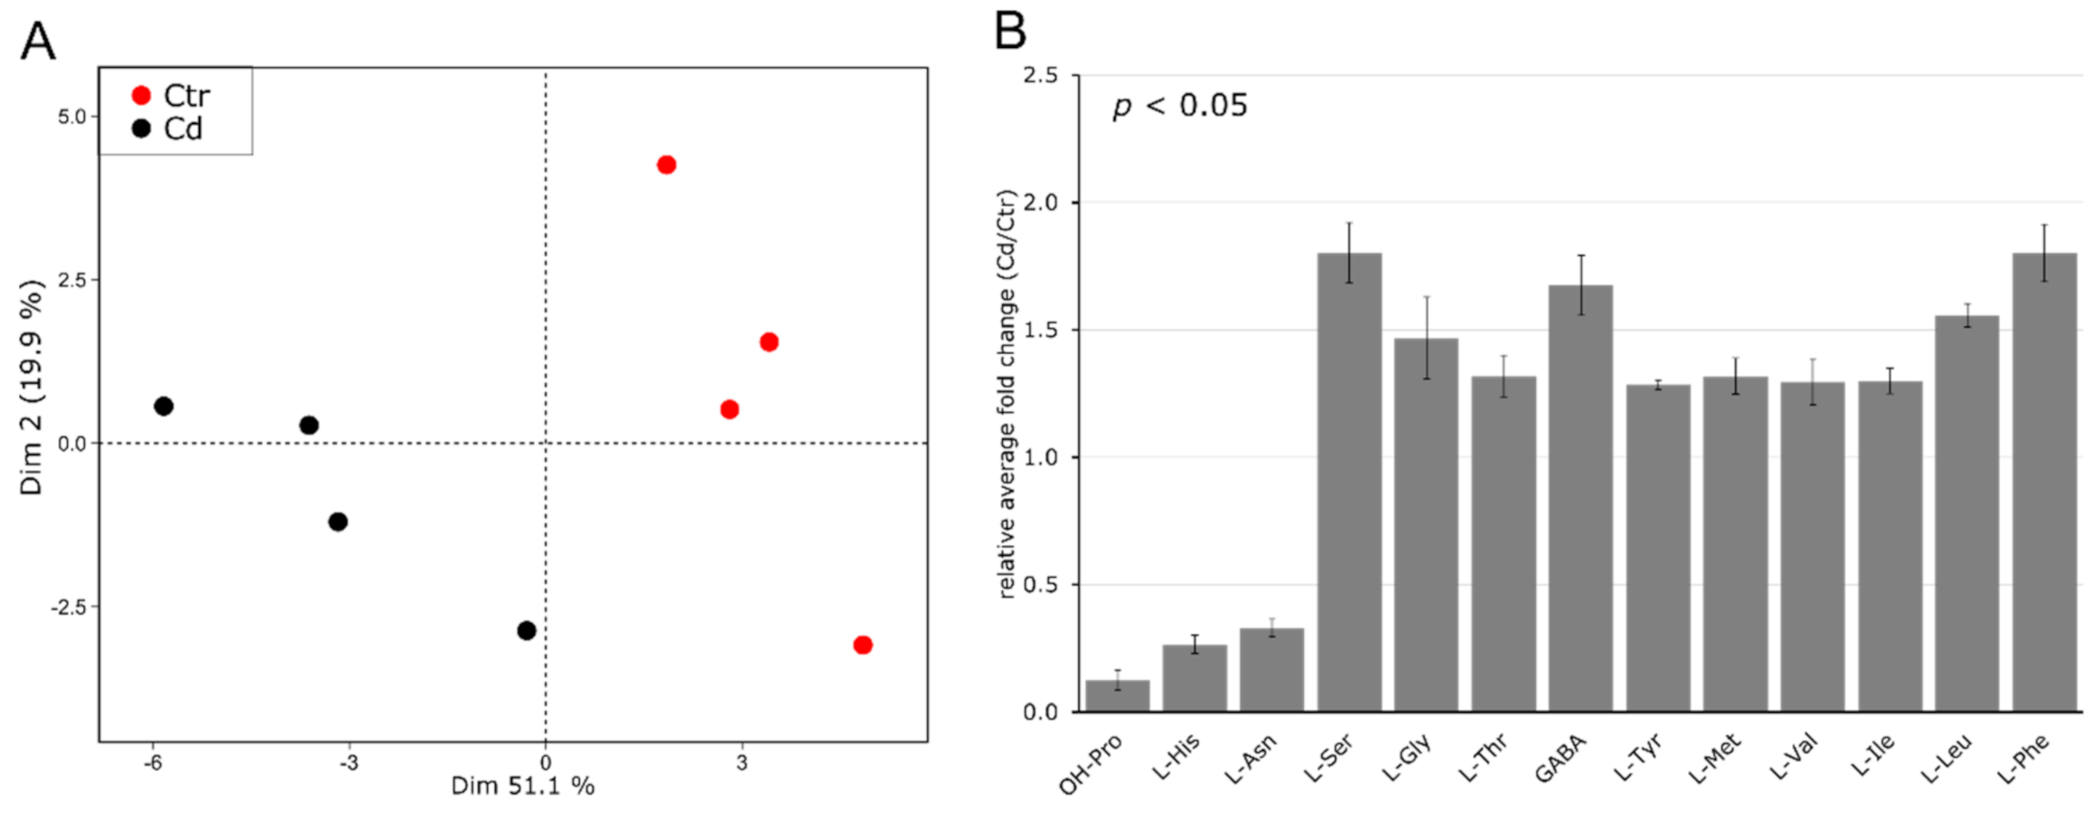
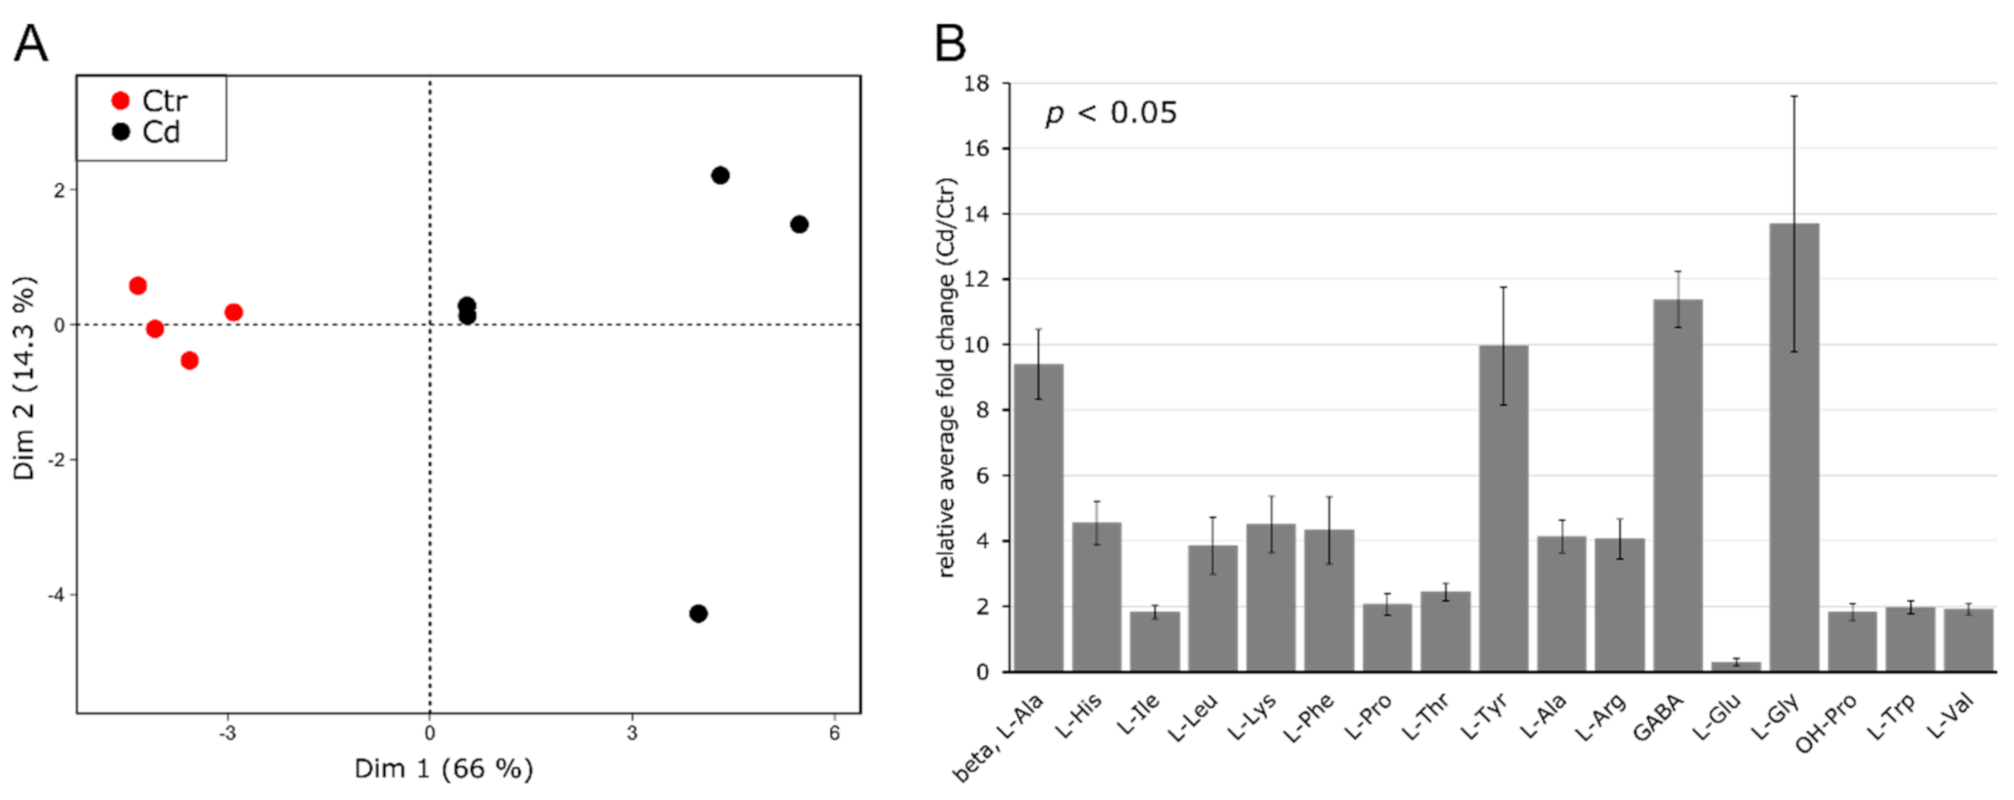
3.2. Cd Exposure Alters the Amino Acid Profile of Stems and Leaves Distinctively

The effect of long-term Cd exposure on the amino acid (AA) content in M. sativa stems was determined using UHPLC–DAD. In order to visualize sample grouping and derived AA differences in four biological replicates of non-exposed control and Cd-exposed plants, a PCA was performed using the data of 31 quantified amino acids (Table S3). The plot shows that both conditions are clearly discriminated from each other along the first and second dimension (Figure 2A). Control plants are separated from the Cd-exposed plants along the first dimension, which explained 51.1% of the total observed variability. Significantly changed AAs in stem tissue (p ≤ 0.05) in response to Cd exposure are given in Figure 2B. The most abundant AA in the control samples was L-Asn (26.793 μmol g−1 DW) and its concentration decreased about three-fold in Cd-exposed M. sativa stems. Moreover, concentrations of OH-Pro (7.9-fold) and His (3.8-fold) decreased upon Cd exposure. The content of L-Ser, L-Gly, L-Thr, GABA, L-Tyr, L-Met, L-Val, L-Ile, L-Leu and L-Phe significantly increased in response to Cd exposure.
The observed AA profile in stems under Cd stress contradicts what can be found in the literature. However, most studies focus on shoots or leaves and studies focusing only on stem tissue are rather limited. Therefore, to evaluate whether this study’s used experimental conditions were comparable with those used in other studies, the AA profile of leaves was determined.
Amino acids in leaves were identified using GC–MS, and the results clearly show a discrimination of Cd-exposed and non-exposed control plants. The first and second principal components accounted for 66.0% and 14.3% of the total variance, respectively (Figure 3A).
Out of 23 identified AAs (Table S4), 17 AAs significantly changed due to the applied stress, whereby all significantly increased in response to Cd exposure except for L-Glu, which significantly decreased (Figure 3B). Contrary to what was observed in stem tissue, L-His and OH-Pro increased 4.6- and 1.8-fold, respectively, relative to control samples. Furthermore, the abundance of L-Pro significantly increased in leaves (2.1-fold), which is in accordance with the current literature [72,73] but was not observed for stem tissue (Figure 2B, Table S3).
Under the here applied conditions, the AA profiles of both tissues are distinct, suggesting tissue-specific alterations in plant primary metabolism following long-term Cd exposure. Principal component analysis could clearly separate the AA profiles of both organs from non-exposed control and Cd-exposed plants, explaining 80.7% of the data variation in the first two dimensions (Figure 4). Stem samples exposed to Cd are only slightly distanced from the control cluster along the second dimension. However, the variance separating the sample set of Cd-exposed leaves from other sample sets is much higher, mainly along the first dimension, which indicates a strong impact of Cd on the AA profile in leaves (Figure 4).
In a separate analysis, the PA content in stem tissue was determined. Long-term Cd exposure increased putrescine (Put), spermidine (Spd) and spermine (Spm) significantly (p = 0.04 for all) in M. sativa stems. Putrescine increased about 1.2-fold, Spd about 1.1-fold and Spm about 1.2-fold (Figure 5). Targeted genes involved in PA synthesis showed an increased expression upon Cd exposure. Among these, the changes in the expression of arginine decarboxylase (ADC) and S-adenosylmethionine decarboxylase (SAM DC) were insignificant. In addition, diamine oxidase (DAO) had a significantly decreased expression in Cd-exposed M. sativa stems (Table 1).

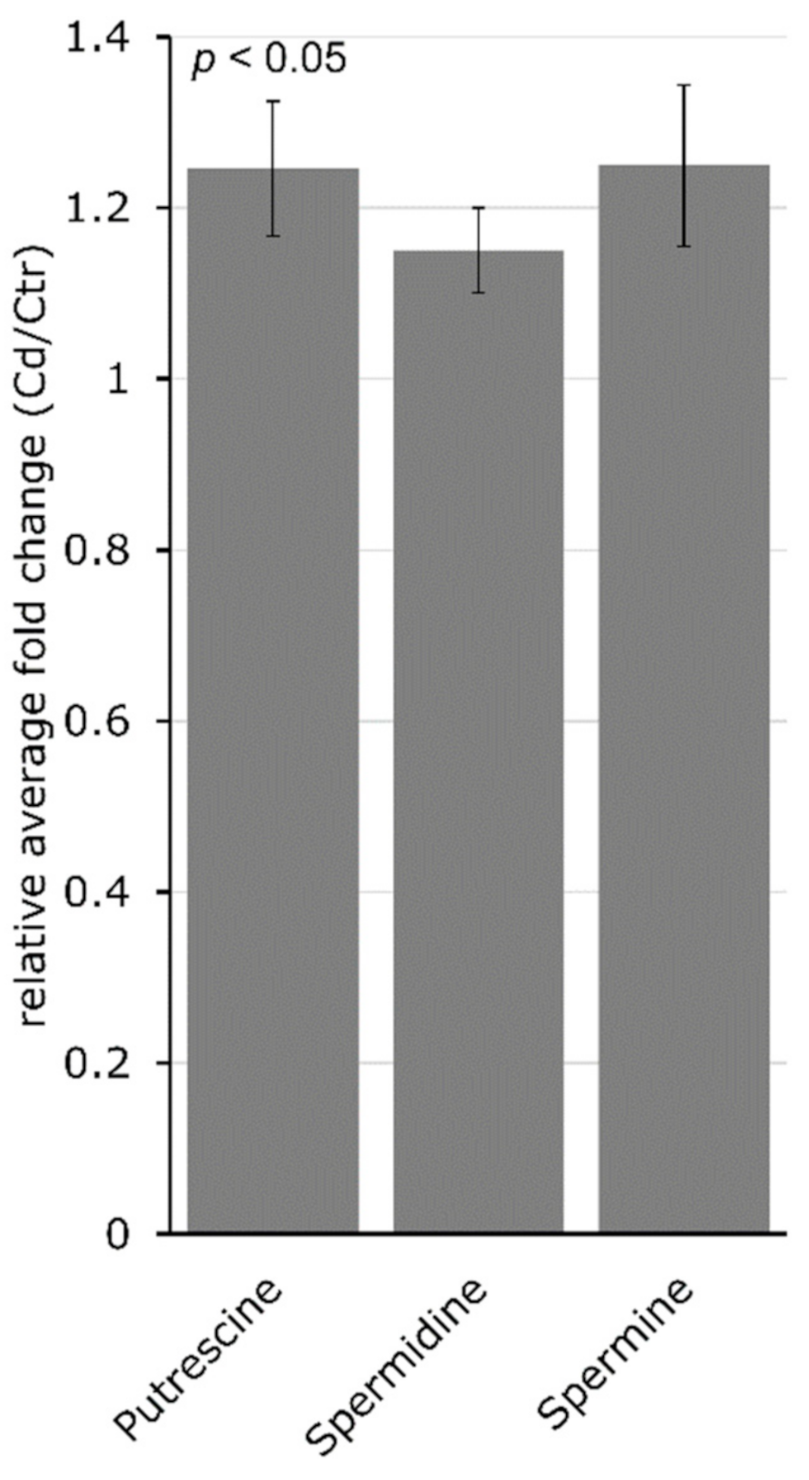
3.3. Glutathione Plays a Minor Role during Long-Term Cd Exposure

In M. sativa stem tissue, long-term Cd exposure stimulated the expression of genes involved in the biosynthesis of GSH, such as homoglutathione synthase and glutathione synthase 2 (Table 1). However, the expression levels of genes involved in the turnover between oxidized and reduced GSH did not show significant changes in response to long-term Cd exposure (glutathione reductase 1 and 2) with the exception of monodehydroascorbate reductase, for which a significant increased expression was determined. No significant changes in total GSH (control: 400.74 nmol g−1 FW; Cd: 389.30 nmol g−1 FW) nor in reduced GSH (control: 284.58 nmol g−1 FW; Cd: 273.52 nmol g−1 FW) were observed in response to Cd exposure. In addition, the measured average concentration of the oxidized form GSSG remained the same in non-exposed control (58.08 nmol g−1 FW) and Cd-exposed M. sativa stems (57.89 nmol g−1 FW).

4. Discussion

The objective of this study was to determine the effects of long-term Cd exposure (10 mg kg−1 soil DW) on the profile of primary and secondary metabolites in M. sativa by focusing on stem tissue. Plant growth was negatively influenced by Cd exposure in the juvenile plant stage but plants phenotypically recovered when they were more mature and consequently no difference in the total biomass produced was observed at the end of the experiment [50]. In agreement with these results, previous studies undertaken in rice, M. sativa and Trifolium repens L. reported a marked impact of heavy metal exposure during germination and early plant growth phases, while minimal effects were observed in later growth stages [74,75,76]. This observation might result from the establishment of a new steady state, which permits acclimation and allows M. sativa to grow under Cd stress. Despite GSH being a key player in the defense against Cd and a crucial antioxidant, it seems to only play a minor role in stem tissue of M. sativa after long-term exposure to Cd. Although the expression of genes related to GSH synthesis was induced due to the applied stress (homoglutathione synthase and glutathione synthase 2 (Table 1)), suggesting that plants produce more GSH, no changes between non-exposed control and Cd-exposed M. sativa stems were observed in the total GSH content, reduced GSH content as well as average concentration of the oxidized form GSSG. Changes in glutathione concentrations and redox state often occur rapidly after the start of Cd exposure and are then restored to control levels [77]. It is likely that changes in GSH metabolism and the redox cycle do occur in Medicago stems but disappear during long-term exposure and it was demonstrated in earlier studies that GSH synthesis often does not correlate with plant stress tolerance [78,79]. Other compounds and/or enzymatic activities might be of higher importance to establishing a new metabolic homeostasis and facilitate acclimation to long-term Cd exposure.
By studying the metabolic profile, further insights can be gained about the key processes and molecules involved in such acclimation.

4.1. Cd Increases the Abundance of (iso)Flavones

Flavonoids and (iso)flavonoids derive from the phenylpropanoid pathway, which is shared with the monolignol biosynthetic pathway and lignin synthesis. Stress stimulates the phenylpropanoid pathway [80] and results in increased lignification of the cell wall [81,82]. However, when the lignin content was analyzed in stems of M. sativa after long-term Cd exposure, neither changes in the content nor in the lignin composition were observed [52]. Nonetheless, the expression of the genes C4H and 4CL significantly increased and an increasing trend in the expression of PAL was detected upon Cd exposure [52], suggesting an induction of the phenylpropanoid pathway in response to Cd. It is, however, noteworthy that the activity of PAL does not necessarily correlate with the accumulation of its RNA transcript. Moreover, the activity is clearly driven by the availability of its substrate Phe [83], and an increased Phe level in the stems of Cd-exposed M. sativa is shown here by two independent methods (Table 2, Figure 2B). Furthermore, ethylene biosynthesis was stimulated by Cd exposure in M. sativa stems [52], which would promote PAL activity [84,85] and enhances the accumulation of phenolic compounds [86].
Secondary metabolites in stem tissue of M. sativa were determined with UPLC–MS. The results showed an accumulation of (iso)flavones in response to Cd. Those (iso)flavones were glyco-conjugated and/or hydroxylated (Table 2 and Table 3), and the results are in accordance with (iso)flavone glycoconjugate accumulation observed upon Cd exposure in roots of yellow lupine (Lupinus luteus) [87]. In nature, flavonoids and (iso)flavonoids are glyco-conjugated [64] as it increases the solubility as well as the stability of (iso)flavones, promotes their uptake into the vacuole, facilitates their transport through membranes [88] and can be crucial for their bioactivities [89]. Cumulative evidence suggests that the chemical structure of (iso)flavones determines their bioactivity and antioxidative efficiency [90,91]. Hydroxylation of flavones increases their antioxidative properties and capacity to complex with metal cations, which is co-ordinated by the hydroxyl group. Therefore, the ability to form such metal complexes strongly depends on the number and position of the hydroxyl group [92,93]. Identified (iso)flavones in M. sativa stems have glycosylations and/or hydroxylations (Table 2 and Table 3), effectively contributing to their function to scavenge ROS, preventing oxidative stress and furthermore facilitating metal chelation. Such metal complexes are stored in the vacuole for detoxification [94] and it is thought that glyco-conjugation might be essential in this process given that it promotes vacuolar uptake.
The observed accumulation of (iso)flavones was accompanied by an increased expression of genes of their biosynthetic pathway (Table 1), suggesting an enhancement of the phenylpropanoid pathway in favor of secondary metabolite synthesis rather than lignin synthesis. This is in accordance with previous observations made in lupine seedlings under Cd stress [34,87].

4.2. Cadmium Induces Changes in the Abundance of Amino Acids and Amino-Acid-Derived Molecules

Changes in the AA profile constitute an important mechanism during plant adaptation to Cd stress [30], and higher tolerance to Cd and elevated Cd accumulation was characterized through an increased accumulation of AAs [95]. Previous studies assigned an important role in Cd stress adaptation to the AAs Met, His and Trp [96] as well as Pro [73,97]. Asparagine, His and Pro can form complexes with metal ions and thus contribute to detoxification [98,99,100] and confer tolerance to the plant. Exogenously applied, Pro alleviates stress symptoms and maintains nutrient uptake [101]. Furthermore, Pro possesses ROS scavenging potential by directly reacting with H2O2 and •OH to form stable radical adducts of proline and hydroxyproline [102], thereby reducing ROS levels [103]. In contradiction with most literature, a significant decrease in L-Asn and L-His of about 3-fold and 3.8-fold, respectively (Figure 2B), was observed in stems of M. sativa after long-term Cd exposure. Yet, Asn was the most abundant AA in M. sativa stems (Ctr: 26.79 μmol g−1 DW; Cd: 8.83 μmol g−1 DW), which is the dominant amino acid in the xylem sap of M. sativa, representing the primary transport form of nitrogen [104]. Its decrease can be a reflection of an interference with nitrogen fixation caused by Cd exposure [105]. A decreasing trend was also observed for Pro (Ctr: 9.46 μmol g−1 DW; Cd: 6.07 μmol g−1 DW; p-value = 0.152; Table S3). Despite being an important AA during plant stress exposure [106,107,108], previous studies reported a decrease in Pro levels over time after long-term Cd exposure [31,109]. Although the observations made are quite surprising considering the importance of those AAs during metal stress, it should be considered that roots are the main organ of Cd accumulation in M. sativa after long-term Cd exposure [50]. Detoxification of Cd is primarily important at the root-cell level rather than in stems and an elevated requirement of complexing molecules such as Asn and His in roots can be assumed.
This study focused on stem tissue of M. sativa but most available data about AA accumulation in response to heavy metal stress were obtained in entire shoots or leaves. Therefore, the AA profile was also determined in leaves of M. sativa in order to compare both data sets in the background of recent literature and to evaluate whether the results of the experimental set-up we used are comparable to those of other studies. The quantification of AAs in M. sativa leaves revealed higher contents of Asn and His upon long-term Cd exposure as well as the accumulation of Pro, which was accompanied by an increased tyramine content (Figure 3B). Tyramine is an aromatic monoamine that is believed to be involved in the regulation of Pro accumulation under stress conditions [110] and was reported to accumulate in response to Cd stress [111].
Leaves and stems of M. sativa showed distinct AA profiles after long-term exposure to Cd, and a PCA could clearly separate AA profiles of samples from the non-exposed control and Cd-exposed plants (Figure 4), whereby leaf samples had the highest variance in their AA profile due to Cd exposure. It is important to mention that leaves are the metabolically most active organ, and the impact of unfavorable conditions such as Cd stress therefore might have much stronger effects, which is illustrated by the PCA (Figure 4). A different AA profile in different organs can play a significant role during adaptation to Cd stress [96]. A study on two related Asteraceae species revealed distinctive AA profiles in roots, stems and leaves. While the total content of free AAs was highest in the stems in the hyperaccumulating species, free AAs strongly accumulated in the leaves of the non-tolerant species exposed to Cd [95], suggesting a different strategy in the defense response to Cd. In this study, the content of OH-Pro, an oxidation product of Pro and indicator for oxidative stress levels, increased in leaves due to Cd exposure (Figure 3B) but decreased about 8-fold in M. sativa stems (Figure 2B), suggesting a reduced oxidative stress level in stems, which is coherent with an unaltered GSH metabolism described in this study. This indicates differently altered oxidative stress levels in leaves and stems in the Cd-exposed plants compared to the control plants. M. sativa plants accumulated Asn, His and Pro in leaves rather than in stems. The leaf tissue consists of many metabolically very active cells, while this is lower in cells from the stems. Asparagine, His and Pro have a high potential for metal chelation and ROS scavenging, and their accumulation in leaves might help to protect and maintain photosynthesis. The protection of stem tissue probably depends on different mechanisms than that of leaves, and long-term Cd exposure significantly increased the content of the Pas Put, Spd and Spm (Figure 5) in M. sativa stems as well as the expression levels of the genes SpdS and SpmS that are involved in their biosynthesis (Table 1). Polyamines are involved in plant responses to multiple biotic and abiotic stresses [112] such as Cd exposure [113], showing a concentration- and time-dependent accumulation [114]. Polyamines alleviate the toxic effects of Cd [115], decrease the production of ROS, prevent lipid peroxidation [116] and permit stress tolerance. Moreover, PAs are important for cell membrane and cell wall stabilization [117], and therefore their accumulation in stems may help to maintain cell integrity during Cd exposure.

4.3. Abscisic Acid Supports Tolerance Acquisition to Cd

Like ethylene, abscisic acid (ABA) is often considered a plant stress hormone functioning as a mediator and major internal signal during abiotic stress [118]. Both hormonal signals are integrated during plant stress responses [119]. Not only did long-term Cd exposure stimulate ethylene biosynthesis in M. sativa stems [52] but it also provoked elevated levels of ABA in the same tissue (Table 2). Abscisic acid stimulates the production of ethylene resulting in the accumulation of phenolic compounds (Table 2 and Table 3) via ethylene-mediated PAL activation [84].
When applied during Cd stress, ABA reduces the plant transpiration rate and increases Cd tolerance [120]. Transpiration is the motor for Cd translocation from roots to shoots [121]. Low transpiration enforces Cd to accumulate in the roots, thereby lowering the concentration in the aerial parts, as was observed in M. sativa upon long-term Cd exposure [50]. This seems to be an important mechanism during tolerance acquisition. Furthermore, ABA accumulation is initiated by elevated ROS levels. ROS homeostasis is modulated by the plant’s flavone content, which in turn is influenced by ethylene [122]. During long-term Cd exposure, M. sativa was only impacted by the stress at its juvenile stage and recovered during plant maturation [50], which implies tolerance acquisition to Cd. Reasonably, it can be assumed that acclimation of M. sativa during long-term Cd exposure must involve a tightly regulated interplay between ROS production, the antioxidant activity of isoflavones as well as ethylene and ABA signaling.

5. Conclusions

A combined approach of targeted and untargeted metabolic analysis was used to determine the effect of long-term Cd exposure on primary and secondary metabolites in M. sativa stems. Control and Cd-exposed plants can be discriminated by their AA pattern, whereby differences in the accumulation of several AA appeared between stems and leaves, suggesting a different strategy in the defense response to Cd in both organs, which in general differ in their metabolic activity. Furthermore, long-term Cd exposure stimulated the phenylpropanoid pathway in favor of flavonoid/isoflavonoid synthesis rather than monolignol biosynthesis and lignin formation. Flavonoids and (iso)flavones have a designated function in ROS scavenging, thereby reducing oxidative stress and cell damage. However, the important antioxidant GSH plays a minor role during long-term Cd exposure. However, the decreased accumulation of 4-hydroxyproline in stems of long-term exposed plants suggests that other mechanisms (synthesis and accumulation of metabolites and/or enzymatic antioxidant activities) are sufficient to restore the redox balance. Our results emphasize the importance of primary and secondary metabolites for acclimation potential during long-term Cd exposure. The establishment of a new metabolic homeostasis enables M. sativa to perform well under inept conditions as no differences in phenotype or biomass production were observed.

Supplementary Materials

The following are available online at https://www.mdpi.com/2073-4409/9/12/2707/s1, Table S1: Forward (Fwd) and reverse (Rev) primers used to determine gene expression levels via quantitative real-time PCR. The Alfalfa Gene Index and Expression Atlas Database was used to obtain the coding sequences for the genes of interest which are given as contig numbers. Table S2: Quantitative real-time PCR parameters according to the Minimum Information for publication of Quantitative real-time PCR Experiments (MIQE) guidelines derived from Bustin et al. (2009) [59]. All procedures were performed according to the manufacturer’s protocols. Table S3: Amino acids in stem tissue of M. sativa after long-term Cd exposure. Table S4: Relative content of primary metabolites in the leaves of M. sativa after long-term Cd exposure.

Author Contributions

A.G., K.S., J.-F.H., J.V. and A.C. designed the experiment. A.G. performed the experimental work, data analysis and interpretation. S.H. contributed to the determination of glutathione content. G.G. contributed to the gene expression analysis. J.R. supplied and managed the technical equipment. S.L. contributed to the determination of polyamines in stems and drafted the method description. A.R.F. and S.A. contributed to the analysis of primary metabolites in leaves and drafted the method description. A.G. wrote the manuscript, which was critically revised and approved by all co-authors. All authors have read and agreed to the published version of the manuscript.

Funding

This work was supported by the FNR and FWO and is part of the bilateral project CadWALL (FNR/FWO project INTER/FWO/13/14).

Acknowledgments

We specially thank Sophie Charton for performing the analysis and identification of primary and secondary metabolites. We also like to thank Christelle Andre for her help during the evaluation of the secondary metabolites. Co-authors A.R.F. and S.A. are supported by the European Union’s Horizon 2020 research and innovation programme, project PlantaSYST (SGA-CSA No. 739582 under FPA No. 664620).

Conflicts of Interest

The authors declare that they have no conflict of interest.

References

  1. Clemens, S.; Ma, J.F. Toxic Heavy Metal and Metalloid Accumulation in Crop Plants and Foods. Annu. Rev. Plant Biol. 2016, 67, 489–512. [Google Scholar] [CrossRef] [PubMed] [Green Version]
  2. Cuypers, A.; Smeets, K.; Ruytinx, J.; Opdenakker, K.; Keunen, E.; Remans, T.; Horemans, N.; Vanhoudt, N.; Van Sanden, S.; Van Belleghem, F.; et al. The cellular redox state as a modulator in cadmium and copper responses in Arabidopsis thaliana seedlings. J. Plant Physiol. 2011, 168, 309–316. [Google Scholar] [CrossRef] [PubMed]
  3. Semane, B.; Cuypers, A.; Smeets, K.; Van Belleghem, F.; Horemans, N.; Schat, H.; Vangronsveld, J. Cadmium responses in Arabidopsis thaliana: Glutathione metabolism and antioxidative defence system. Physiol. Plant. 2007, 129, 519–528. [Google Scholar] [CrossRef]
  4. Schützendübel, A.; Polle, A. Plant responses to abiotic stresses: Heavy metal-induced oxidative stress and protection by mycorrhization. J. Exp. Bot. 2002, 53, 1351–1365. [Google Scholar] [CrossRef]
  5. Perfus-Barbeoch, L.; Leonhardt, N.; Vavasseur, A.; Forestier, C. Heavy metal toxicity: Cadmium permeates through calcium channels and disturbs the plant water status. Plant J. 2002, 32, 539–548. [Google Scholar] [CrossRef]
  6. Sanità Di Toppi, L.; Gabbrielli, R. Response to cadmium in higher plants. Environ. Exp. Bot. 1999, 41, 105–130. [Google Scholar] [CrossRef]
  7. Yang, X.; Baligar, V.C.; Martens, D.C.; Clark, R.B. Cadmium effects on influx and transport of mineral nutrients in plant species. J. Plant Nutr. 1996, 19, 643–656. [Google Scholar] [CrossRef]
  8. Sharma, P.; Jha, A.B.; Dubey, R.S.; Pessarakli, M. Reactive Oxygen Species, Oxidative Damage, and Antioxidative Defense Mechanism in Plants under Stressful Conditions. J. Bot. 2012, 2012, 1–26. [Google Scholar] [CrossRef] [Green Version]
  9. Sandalio, L.M.; Dalurzo, H.C.; Gómez, M.; Romero-Puertas, M.C.; del Río, L.A. Cadmium-induced changes in the growth and oxidative metabolism of pea plants. J. Exp. Bot. 2001, 52, 2115–2126. [Google Scholar] [CrossRef]
  10. Romero-Puertas, M.C.; Palma, J.M.; Gómez, M.; Río, L.A.D.E.L.; Sandalio, L.M. Cadmium causes the oxidative modification of proteins in pea plants. Plant Cell. Environ. 2002, 25, 677–686. [Google Scholar] [CrossRef]
  11. Berni, R.; Luyckx, M.; Xu, X.; Legay, S.; Sergeant, K.; Hausman, J.F.; Lutts, S.; Cai, G.; Guerriero, G. Reactive oxygen species and heavy metal stress in plants: Impact on the cell wall and secondary metabolism. Environ. Exp. Bot. 2019, 161, 98–106. [Google Scholar] [CrossRef]
  12. Fernie, A.R.; Pichersky, E. Focus issue on metabolism: Metabolites, metabolites everywhere. Plant Physiol. 2015, 169, 1421–1423. [Google Scholar] [CrossRef] [PubMed] [Green Version]
  13. Hirai, M.Y.; Yano, M.; Goodenowe, D.B.; Kanaya, S.; Kimura, T.; Awazuhara, M.; Arita, M.; Fujiwara, T.; Saito, K. From the cover: Integration of transcriptomics and metabolomics for understanding of global responses to nutritional stresses in Arabidopsis thaliana. Proc. Natl. Acad. Sci. USA 2004, 101, 10205–10210. [Google Scholar] [CrossRef] [PubMed] [Green Version]
  14. Goossens, A.; Häkkinen, S.T.; Laakso, I.; Seppänen-Laakso, T.; Biondi, S.; De Sutter, V.; Lammertyn, F.; Nuutila, A.M.; Söderlund, H.; Zabeau, M.; et al. A functional genomics approach toward the understanding of secondary metabolism in plant cells. Proc. Natl. Acad. Sci. USA. 2003, 100, 8595–8600. [Google Scholar] [CrossRef] [PubMed] [Green Version]
  15. Obata, T.; Fernie, A.R. The use of metabolomics to dissect plant responses to abiotic stresses. Cell. Mol. Life Sci. 2012, 69, 3225–3243. [Google Scholar] [CrossRef] [PubMed] [Green Version]
  16. Kroymann, J. Natural diversity and adaptation in plant secondary metabolism. Curr. Opin. Plant Biol. 2011, 14, 246–251. [Google Scholar] [CrossRef]
  17. Yang, L.; Wen, K.-S.; Ruan, X.; Zhao, Y.-X.; Wei, F.; Wang, Q. Response of Plant Secondary Metabolites to Environmental Factors. Molecules 2018, 23, 762. [Google Scholar] [CrossRef] [Green Version]
  18. Ahmed, E.; Arshad, M.; Zakriyya Khan, M.; Shoaib Amjad, M.; Mehreen Sadaf, H.; Riaz, I.; Sidra Sabir, P.; Ahmad, N. Sabaoon Secondary metabolites and their multidimensional prospective in plant life. J. Pharmacogn. Phytochem. 2017, 6, 205–214. [Google Scholar]
  19. Winkel-Shirley, B. Flavonoid Biosynthesis. A Colorful Model for Genetics, Biochemistry, Cell Biology, and Biotechnology. Plant Physiol. 2001, 126, 485–493. [Google Scholar] [CrossRef] [Green Version]
  20. Erb, M.; Kliebenstein, D.J. Plant Secondary Metabolites as Defenses, Regulators, and Primary Metabolites: The Blurred Functional Trichotomy. Plant Physiol. 2020, 184, 39–52. [Google Scholar] [CrossRef]
  21. Ghosson, H.; Schwarzenberg, A.; Jamois, F.; Yvin, J.C. Simultaneous untargeted and targeted metabolomics profiling of underivatized primary metabolites in sulfur-deficient barley by ultra-high performance liquid chromatography-quadrupole/time-of-flight mass spectrometry. Plant Methods 2018, 14, 62. [Google Scholar] [CrossRef] [Green Version]
  22. Yang, X.; Wei, S.; Liu, B.; Guo, D.; Zheng, B.; Feng, L.; Liu, Y.; Tomás-Barberán, F.A.; Luo, L.; Huang, D. A novel integrated non-targeted metabolomic analysis reveals significant metabolite variations between different lettuce (Lactuca sativa. L.) varieties. Hortic. Res. 2018, 5, 33. [Google Scholar] [CrossRef] [PubMed] [Green Version]
  23. Fernie, A.R.; Trethewey, R.N.; Krotzky, A.J. Metabolite profiling: From diagnostics to systems biology. Nat. Rev. Mol. Cell Biol. 2004, 5, 763–769. [Google Scholar] [CrossRef] [PubMed]
  24. Jorge, T.F.; Rodrigues, J.A.; Caldana, C.; Schmidt, R.; van Dongen, J.T.; Thomas-Oates, J.; Antonio, C. Mass spectrometry-based plant metabolomics: Metabolite responses to abiotic stress. Mass Spectrom. Rev. 2016, 35, 620–649. [Google Scholar] [CrossRef] [PubMed]
  25. Rogachev, I.; Aharoni, A. UPLC-MS-Based Metabolite Analysis in Tomato. In Plant Metabolomics; Methods in Molecular Biology (Methods and Protocols), Hardy, N., Hall, R., Eds.; Humana Press: Clifton, NJ, USA, 2011; Volume 860, pp. 129–144. [Google Scholar]
  26. Zhang, Y.; Zhang, A.; Zhang, Y.; Sun, H.; Meng, X.; Yan, G.; Wang, X. Application of ultra-performance liquid chromatography with time-of-flight mass spectrometry for the rapid analysis of constituents and metabolites from the extracts of Acanthopanax senticosus Harms leaf. Pharmacogn. Mag. 2016, 12, 145–152. [Google Scholar] [CrossRef] [PubMed] [Green Version]
  27. Nakabayashi, R.; Saito, K. Integrated metabolomics for abiotic stress responses in plants. Curr. Opin. Plant Biol. 2015, 24, 10–16. [Google Scholar] [CrossRef] [PubMed] [Green Version]
  28. Scalabrin, E.; Radaelli, M.; Rizzato, G.; Bogani, P.; Buiatti, M.; Gambaro, A.; Capodaglio, G. Metabolomic analysis of wild and transgenic Nicotiana langsdorffii plants exposed to abiotic stresses: Unraveling metabolic responses. Anal. Bioanal. Chem. 2015, 407, 6357–6368. [Google Scholar] [CrossRef]
  29. Keunen, E.; Florez-Sarasa, I.; Obata, T.; Jozefczak, M.; Remans, T.; Vangronsveld, J.; Fernie, A.R.; Cuypers, A. Metabolic responses of Arabidopsis thaliana roots and leaves to sublethal cadmium exposure are differentially influenced by alternative oxidase 1a. Environ. Exp. Bot. 2016, 124, 64–78. [Google Scholar] [CrossRef]
  30. Pavlíková, D.; Zemanová, V.; Procházková, D.; Pavlík, M.; Száková, J.; Wilhelmová, N. The long-term effect of zinc soil contamination on selected free amino acids playing an important role in plant adaptation to stress and senescence. Ecotoxicol. Environ. Saf. 2014, 100, 166–170. [Google Scholar] [CrossRef]
  31. Hédiji, H.; Djebali, W.; Cabasson, C.; Maucourt, M.; Baldet, P.; Bertrand, A.; Boulila Zoghlami, L.; Deborde, C.; Moing, A.; Brouquisse, R.; et al. Effects of long-term cadmium exposure on growth and metabolomic profile of tomato plants. Ecotoxicol. Environ. Saf. 2010, 73, 1965–1974. [Google Scholar] [CrossRef]
  32. Wang, Y.; Xu, L.; Shen, H.; Wang, J.; Liu, W.; Zhu, X. Metabolomic analysis with GC-MS to reveal potential metabolites and biological pathways involved in Pb & Cd stress response of radish roots. Sci. Rep. 2015, 5, 18296. [Google Scholar] [CrossRef] [PubMed] [Green Version]
  33. Skorzynska-Polit, E.; Drazkiewicz, M.; Wianowska, D.; Maksymiec, W.; Dawidowicz, A.L.; Tukiendorf, A. The influence of heavy metal stress on the level of some flavonols in the primary leaves of Phaseolus coccineus. Acta Physiol. Plant. 2004, 26, 247–254. [Google Scholar] [CrossRef]
  34. Pawlak-Sprada, S.; Arasimowicz-Jelonek, M.; Podgórska, M.; Deckert, J. Activation of phenylpropanoid pathway in legume plants exposed to heavy metals. Part I. Effects of cadmium and lead on phenylalanine ammonia-lyase gene expression, enzyme activity and lignin content. Acta Biochim. Pol. 2011, 58, 211–216. [Google Scholar] [CrossRef] [PubMed] [Green Version]
  35. Bali, S.; Jamwal, V.L.; Kohli, S.K.; Kaur, P.; Tejpal, R.; Bhalla, V.; Ohri, P.; Gandhi, S.G.; Bhardwaj, R.; Al-Huqail, A.A.; et al. Jasmonic acid application triggers detoxification of lead (Pb) toxicity in tomato through the modifications of secondary metabolites and gene expression. Chemosphere 2019, 235, 734–748. [Google Scholar] [CrossRef]
  36. Kısa, D.; Elmastaş, M.; Öztürk, L.; Kayır, Ö. Responses of the phenolic compounds of Zea mays under heavy metal stress. Appl. Biol. Chem. 2016, 59, 813–820. [Google Scholar] [CrossRef]
  37. Karimi, E.; Oskoueian, E.; Oskoueian, A.; Omidvar, V.; Hendra, R.; Nazeran, H. Insight into the functional and medicinal properties of Medicago sativa (Alfalfa) leaves extract. J. Med. Plants Res. 2013, 7, 290–297. [Google Scholar] [CrossRef]
  38. Agati, G.; Azzarello, E.; Pollastri, S.; Tattini, M. Flavonoids as antioxidants in plants: Location and functional significance. Plant Sci. 2012, 196, 67–76. [Google Scholar] [CrossRef]
  39. Karamian, R.; Asadbegy, M. Antioxidant activity, total phenolic and flavonoid contents of three Onobrychis species from Iran. Pharm. Sci. 2016, 22, 112–119. [Google Scholar] [CrossRef] [Green Version]
  40. Olennikov, D.; Kashchenko, N.; Chirikova, N.; Olennikov, D.N.; Kashchenko, N.I.; Chirikova, N.K. A Novel HPLC-Assisted Method for Investigation of the Fe2+-Chelating Activity of Flavonoids and Plant Extracts. Molecules 2014, 19, 18296–18316. [Google Scholar] [CrossRef] [Green Version]
  41. Kidd, P.S.; Llugany, M.; Poschenrieder, C.; Gunsé, B.; Barceló, J. The role of root exudates in aluminium resistance and silicon-induced amelioration of aluminium toxicity in three varieties of maize (Zea mays L.). J. Exp. Bot. 2001, 52, 1339–1352. [Google Scholar] [CrossRef] [Green Version]
  42. Veronesi, F. Fodder Crops and Amenity Grasses; Springer: Heidelberg, Germany, 2010; ISBN 9781441907592. [Google Scholar]
  43. Messina, M.J. Legumes and Soybeans: Overview of their Nutritional Profiles and Health Effects. Am. J Clin. Nutr. 1999, 70, 439s–450s. [Google Scholar] [CrossRef] [PubMed] [Green Version]
  44. Printz, B.; Guerriero, G.; Sergeant, K.; Audinot, J.-N.; Guignard, C.; Renaut, J.; Lutts, S.; Hausman, J.-F. Combining -Omics to Unravel the Impact of Copper Nutrition on Alfalfa (Medicago sativa) Stem Metabolism. Plant Cell Physiol. 2016, 57, 407–422. [Google Scholar] [CrossRef] [PubMed] [Green Version]
  45. Verdonk, J.C.; Hatfield, R.D.; Sullivan, M.L. Proteomic analysis of cell walls of two developmental stages of alfalfa stems. Front. Plant Sci. 2012, 3, 279. [Google Scholar] [CrossRef] [PubMed] [Green Version]
  46. Samac, D.A.; Jung, H.; Lamb, J.F.S. Development of alfalfa (Medicago sativa L.) as a feedstock for production of ethanol and other bioproducts. In Alcoholic Fuels; Minteer, S., Ed.; CRC Press: Boca Raton, FL, USA, 2006; p. 79. ISBN 0737-8025. [Google Scholar]
  47. Sanderson, M.A.; Martin, N.P.; Adler, P. Biomass, Energy, and Industrial Uses of Forages. In Forages: The Science of Grassland Agriculture; Moore, K.J., Barnes, R.F., Nelson, C.J., Collins, M., Eds.; Blackwell: Ames, IA, USA, 2006; pp. 635–647. [Google Scholar]
  48. Rafińska, K.; Pomastowski, P.; Wrona, O.; Górecki, R.; Buszewski, B. Medicago sativa as a source of secondary metabolites for agriculture and pharmaceutical industry. Phytochem. Lett. 2017, 20, 520–539. [Google Scholar] [CrossRef]
  49. Pan, J.; Plant, J.A.; Voulvoulis, N.; Oates, C.J.; Ihlenfeld, C. Cadmium levels in Europe: Implications for human health. Environ. Geochem. Health 2010, 32, 1–12. [Google Scholar] [CrossRef]
  50. Gutsch, A.; Keunen, E.; Guerriero, G.; Renaut, J.; Cuypers, A.; Hausman, J.-F.; Sergeant, K. Long-term cadmium exposure influences the abundance of proteins that impact the cell wall structure in Medicago sativa stems. Plant Biol. J. 2018, 20, 1023–1035. [Google Scholar] [CrossRef] [Green Version]
  51. Gutsch, A.; Zouaghi, S.; Renaut, J.; Cuypers, A.; Hausman, J.-F.; Sergeant, K. Changes in the Proteome of Medicago sativa Leaves in Response to Long-Term Cadmium Exposure Using a Cell-Wall Targeted Approach. Int. J. Mol. Sci. 2018, 19, 2498. [Google Scholar] [CrossRef] [Green Version]
  52. Gutsch, A.; Sergeant, K.; Keunen, E.; Prinsen, E.; Guerriero, G.; Renaut, J.; Hausman, J.F.; Cuypers, A. Does long-term cadmium exposure influence the composition of pectic polysaccharides in the cell wall of Medicago sativa stems? BMC Plant Biol. 2019, 19, 271. [Google Scholar] [CrossRef] [Green Version]
  53. Rodríguez-Serrano, M.; Romero-Puertas, M.C.; Zabalza, A.; Corpas, F.J.; Gómez, M.; Del Río, L.A.; Sandalio, L.M. Cadmium effect on oxidative metabolism of pea (Pisum sativum L.) roots. Imaging of reactive oxygen species and nitric oxide accumulation in vivo. Plant. Cell Environ. 2006, 29, 1532–1544. [Google Scholar] [CrossRef]
  54. Passardi, F.; Penel, C.; Dunand, C. Performing the paradoxical: How plant peroxidases modify the cell wall. Trends Plant Sci. 2004, 9, 534–540. [Google Scholar] [CrossRef]
  55. Queval, G.; Noctor, G. A plate reader method for the measurement of NAD, NADP, glutathione, and ascorbate in tissue extracts: Application to redox profiling during Arabidopsis rosette development. Anal. Biochem. 2007, 363, 58–69. [Google Scholar] [CrossRef] [PubMed]
  56. Lefèvre, I.; Gratia, E.; Lutts, S. Discrimination between the ionic and osmotic components of salt stress in relation to free polyamine level in rice (Oryza sativa). Plant Sci. 2001, 161, 943–952. [Google Scholar] [CrossRef]
  57. Lisec, J.; Schauer, N.; Kopka, J.; Willmitzer, L.; Fernie, A.R. Gas chromatography mass spectrometry-based metabolite profiling in plants. Nat. Protoc. 2006, 1, 387–396. [Google Scholar] [CrossRef]
  58. Schauer, N.; Steinhauser, D.; Strelkov, S.; Schomburg, D.; Allison, G.; Moritz, T.; Lundgren, K.; Roessner-Tunali, U.; Forbes, M.G.; Willmitzer, L.; et al. GC-MS libraries for the rapid identification of metabolites in complex biological samples. FEBS Lett. 2005, 579, 1332–1337. [Google Scholar] [CrossRef] [PubMed]
  59. Bustin, S.A.; Benes, V.; Garson, J.A.; Hellemans, J.; Huggett, J.; Kubista, M.; Mueller, R.; Nolan, T.; Pfaffl, M.W.; Shipley, G.L.; et al. The MIQE Guidelines: Minimum Information for Publication of Quantitative Real-Time PCR Experiments. Clin. Chem. 2009, 55, 611–622. [Google Scholar] [CrossRef] [Green Version]
  60. Guerriero, G.; Legay, S.; Hausman, J.F. Alfalfa cellulose synthase gene expression under abiotic stress: A hitchhiker’s guide to RT-qPCR normalization. PLoS ONE 2014, 9, e103808. [Google Scholar] [CrossRef] [Green Version]
  61. Elobeid, M.; Göbel, C.; Feussner, I.; Polle, A. Cadmium interferes with auxin physiology and lignification in poplar. J. Exp. Bot. 2012, 63, 1413–1421. [Google Scholar] [CrossRef] [Green Version]
  62. Chaoui, A.; El Ferjani, E. Effects of cadmium and copper on antioxidant capacities, lignification and auxin degradation in leaves of pea (Pisum sativum L.) seedlings. C. R. Biol. 2005, 328, 23–31. [Google Scholar] [CrossRef]
  63. Cui, W.; Gao, Z.; Wu, H.; Xie, Y.; Shen, W. Haem oxygenase-1 is involved in salicylic acid-induced methylation and chromatin patterning alleviation of oxidative stress due to cadmium stress in Medicago sativa. J. Exp. Bot. 2012, 63, 5521–5534. [Google Scholar] [CrossRef] [Green Version]
  64. Staszków, A.; Swarcewicz, B.; Banasiak, J.; Muth, D.; Jasiński, M.; Stobiecki, M. LC/MS profiling of flavonoid glycoconjugates isolated from hairy roots, suspension root cell cultures and seedling roots of Medicago truncatula. Metabolomics 2011, 7, 604–613. [Google Scholar] [CrossRef] [Green Version]
  65. De Rijke, E.; Out, P.; Niessen, W.M.A.; Ariese, F.; Gooijer, C.; Brinkman, U.A.T. Analytical separation and detection methods for flavonoids. J. Chromatogr. A 2006, 1112, 31–63. [Google Scholar] [CrossRef] [PubMed]
  66. Lin, L.Z.; He, X.G.; Lindenmaier, M.; Yang, J.; Cleary, M.; Qiu, S.X.; Cordell, G.A. LC-ESI-MS study of the flavonoid glycoside malonates of red clover (Trifolium pratense). J. Agric. Food Chem. 2000, 48, 354–365. [Google Scholar] [CrossRef] [PubMed]
  67. Farag, M.A.; Huhman, D.V.; Dixon, R.A.; Sumner, L.W. Metabolomics Reveals Novel Pathways and Differential Mechanistic and Elicitor-Specific Responses in Phenylpropanoid and Isoflavonoid Biosynthesis in Medicago truncatula Cell Cultures. Plant Physiol. 2008, 146, 387–402. [Google Scholar] [CrossRef] [PubMed] [Green Version]
  68. Wojakowska, A.; Piasecka, A.; García-López, P.M.; Zamora-Natera, F.; Krajewski, P.; Marczak, Ł.; Kachlicki, P.; Stobiecki, M. Structural analysis and profiling of phenolic secondary metabolites of Mexican lupine species using LC-MS techniques. Phytochemistry 2013, 92, 71–86. [Google Scholar] [CrossRef]
  69. Farag, M.A.; Huhman, D.V.; Lei, Z.; Sumner, L.W. Metabolic profiling and systematic identification of flavonoids and isoflavonoids in roots and cell suspension cultures of Medicago truncatula using HPLC-UV-ESI-MS and GC-MS. Phytochemistry 2007, 68, 342–354. [Google Scholar] [CrossRef]
  70. Prasain, J.K.; Jones, K.; Kirk, M.; Wilson, L.; Smith-Johnson, M.; Weaver, C.; Barnes, S. Profiling and quantification of isoflavonoids in kudzu dietary supplements by high-performance liquid chromatography and electrospray ionization tandem mass spectrometry. J. Agric. Food Chem. 2003, 51, 4213–4218. [Google Scholar] [CrossRef]
  71. Sumner, L.W.; Paiva, N.L.; Dixon, R.A.; Geno, P.W. High-performance liquid chromatography/continuous-flow liquid secondary ion mass spectrometry of flavonoid glycosides in leguminous plant extracts. J. Mass Spectrom. 1996, 31, 472–485. [Google Scholar] [CrossRef]
  72. Xu, J.; Yin, H.; Li, X. Protective effects of proline against cadmium toxicity in micropropagated hyperaccumulator, Solanum nigrum L. Plant Cell Rep. 2009, 28, 325–333. [Google Scholar] [CrossRef]
  73. Tian, B.; Qiao, Z.; Zhang, L.; Li, H.; Pei, Y. Hydrogen sulfide and proline cooperate to alleviate cadmium stress in foxtail millet seedlings. Plant Physiol. Biochem. 2016, 109, 293–299. [Google Scholar] [CrossRef]
  74. Chou, T.-S.; Chao, Y.Y.; Huang, W.D.; Kao, C.H. Effect of Magnesium deficiency on antioxidant status and Cadmium toxicity in rice seedlings. J. Plant Physiol. 2011, 168, 1021–1030. [Google Scholar] [CrossRef]
  75. Wang, C.Q.; Song, H. Calcium protects Trifolium repens L. seedlings against cadmium stress. Plant Cell Rep. 2009, 28, 1341–1349. [Google Scholar] [CrossRef] [PubMed]
  76. Peralta-Videa, J.R.; de la Rosa, G.; Gonzalez, J.H.; Gardea-Torresdey, J.L. Effects of the growth stage on the heavy metal tolerance of alfalfa plants. Adv. Environ. Res. 2004, 8, 679–685. [Google Scholar] [CrossRef]
  77. Jozefczak, M.; Keunen, E.; Schat, H.; Bliek, M.; Hernández, L.E.; Carleer, R.; Remans, T.; Bohler, S.; Vangronsveld, J.; Cuypers, A. Differential response of Arabidopsis leaves and roots to cadmium: Glutathione-related chelating capacity vs antioxidant capacity. Plant Physiol. Biochem. 2014, 83, 1–9. [Google Scholar] [CrossRef] [PubMed]
  78. Delhaize, E.; Jackson, P.J.; Lujan, L.D.; Robinson, N.J. Poly(γ-glutamylcysteinyl)glycine Synthesis in Datura innoxia and Binding with Cadmium: Role in Cadmium Tolerance. Plant Physiol. 1989, 89, 700–706. [Google Scholar] [CrossRef] [Green Version]
  79. De Knecht, J.A.; van Dillen, M.; Koevoets, P.; Schat, H.; Verkleij, J.; Ernst, W. Phytochelatins in Cadmium-Sensitive and Cadmium-Tolerant Silene vulgaris. Plant Physiol. 1994, 104, 255–261. [Google Scholar] [CrossRef] [Green Version]
  80. Dixon, R.A.; Paiva, N.L. Stress-Induced Phenylpropanoid Metabolism. Plant Cell 1995, 7, 1085–1097. [Google Scholar] [CrossRef]
  81. Kováčik, J.; Klejdus, B. Dynamics of phenolic acids and lignin accumulation in metal-treated Matricaria chamomilla roots. Plant Cell Rep. 2008, 27, 605–615. [Google Scholar] [CrossRef]
  82. Rahoui, S.; Martinez, Y.; Sakouhi, L.; Ben, C.; Rickauer, M.; El Ferjani, E.; Gentzbittel, L.; Chaoui, A. Cadmium-induced changes in antioxidative systems and differentiation in roots of contrasted Medicago truncatula lines. Protoplasma 2017, 254, 473–489. [Google Scholar] [CrossRef]
  83. Da Cunha, A. The estimation of l-phenylalanine ammonia-lyase shows phenylpropanoid biosynthesis to be regulated by l-phenylalanine supply and availability. Phytochemistry 1987, 26, 2723–2727. [Google Scholar] [CrossRef]
  84. Jiang, Y.; Joyce, D.C. ABA effects on ethylene production, PAL activity, anthocyanin and phenolic contents of strawberry fruit. Plant Growth Regul. 2003, 39, 171–174. [Google Scholar] [CrossRef]
  85. Chalutz, E. Ethylene-induced Phenylalanine Ammonia-Lyase Activity in Carrot Roots. Plant Physiol. 1973, 51, 1033–1036. [Google Scholar] [CrossRef] [PubMed] [Green Version]
  86. Heredia, J.B.; Cisneros-Zevallos, L. The effect of exogenous ethylene and methyl jasmonate on pal activity, phenolic profiles and antioxidant capacity of carrots (Daucus carota) under different wounding intensities. Postharvest Biol. Technol. 2009, 51, 242–249. [Google Scholar] [CrossRef]
  87. Pawlak-Sprada, S.; Stobiecki, M.; Deckert, J. Activation of phenylpropanoid pathway in legume plants exposed to heavy metals. Part II. Profiling of isoflavonoids and their glycoconjugates induced in roots of lupine (Lupinus luteus) seedlings treated with cadmium and lead. Acta Biochim. Pol. 2011, 58, 217–223. [Google Scholar] [CrossRef] [PubMed]
  88. Zhao, J.; Dixon, R.A. The “ins” and “outs” of flavonoid transport. Trends Plant Sci. 2010, 15, 72–80. [Google Scholar] [CrossRef] [PubMed] [Green Version]
  89. Liu, C.-J.; Blount, J.W.; Steele, C.L.; Dixon, R.A. Bottlenecks for metabolic engineering of isoflavone glycoconjugates in Arabidopsis. Proc. Natl. Acad. Sci. USA 2002, 99, 14578–14583. [Google Scholar] [CrossRef] [PubMed] [Green Version]
  90. Montesinos, M.C.; Ubeda, A.; Terencio, M.C.; Payá, M.; Alcaraz, M.J. Antioxidant Profile of Mono- and Dihydroxylated Flavone Derivatives in Free Radical Generating Systems. Zeitschrift Naturforsch. Sect. C J. Biosci. 1995, 50, 552–560. [Google Scholar] [CrossRef] [PubMed]
  91. Tsuchiya, H. Structure-dependent membrane interaction of flavonoids associated with their bioactivity. Food Chem. 2010, 120, 1089–1096. [Google Scholar] [CrossRef]
  92. Samsonowicz, M.; Regulska, E. Spectroscopic study of molecular structure, antioxidant activity and biological effects of metal hydroxyflavonol complexes. Spectrochim. Acta Part A Mol. Biomol. Spectrosc. 2017, 173, 757–771. [Google Scholar] [CrossRef]
  93. Samsonowicz, M.; Regulska, E.; Kalinowska, M. Hydroxyflavone metal complexes—Molecular structure, antioxidant activity and biological effects. Chem. Biol. Interact. 2017, 273, 245–256. [Google Scholar] [CrossRef]
  94. Martinoia, E.; Maeshima, M.; Neuhaus, H.E. Vacuolar transporters and their essential role in plant metabolism. J. Exp. Bot. 2007, 58, 83–102. [Google Scholar] [CrossRef]
  95. Zhu, G.; Xiao, H.; Guo, Q.; Zhang, Z.; Zhao, J.; Yang, D. Effects of cadmium stress on growth and amino acid metabolism in two Compositae plants. Ecotoxicol. Environ. Saf. 2018, 158, 300–308. [Google Scholar] [CrossRef] [PubMed]
  96. Zemanová, V.; Pavlík, M.; Pavlíková, D.; Tlustoš, P. The significance of methionine, histidine and tryptophan in plant responses and adaptation to cadmium stress. Plant Soil Environ. 2014, 60, 426–432. [Google Scholar] [CrossRef]
  97. Verbruggen, N.; Hermans, C. Proline accumulation in plants: A review. Amino Acids 2008, 35, 753–759. [Google Scholar] [CrossRef] [PubMed]
  98. Sharma, S.S.; Schat, H.; Vooijs, R. In vitro alleviation of heavy metal-induced enzyme inhibition by proline. Phytochemistry 1998, 49, 1531–1535. [Google Scholar] [CrossRef]
  99. Bottari, E.; Festa, M.R. Asparagine as a ligand for cadmium (II), lead (II) and zinc (II). Chem. Speciat. Bioavailab. 1996, 8, 75–83. [Google Scholar] [CrossRef] [Green Version]
  100. Krämer, U.; Cotter-Howells, J.D.; Charnock, J.M.; Baker, A.J.M.; Smith, J.A.C. Free histidine as a metal chelator in plants that accumulate nickel. Nature 1996, 379, 635–638. [Google Scholar] [CrossRef]
  101. Ali, Q.; Ashraf, M.; Shahbaz, M.; Humera, H. Ameliorating effect of foliar applied proline on nutrient uptake in water stressed maize (Zea mays L.) plants. Pakistan J. Bot. 2008, 40, 211–219. [Google Scholar]
  102. Liang, X.; Zhang, L.; Natarajan, S.K.; Becker, D.F. Proline Mechanisms of Stress Survival. Antioxid. Redox Signal. 2013, 19, 998–1011. [Google Scholar] [CrossRef] [Green Version]
  103. Rejeb, K.B.; Abdelly, C.; Savouré, A. How reactive oxygen species and proline face stress together. Plant Physiol. Biochem. 2014, 80, 278–284. [Google Scholar] [CrossRef]
  104. Kim, T.H.; Bigot, J.; Ourry, A.; Boucaud, J. Amino acid content in xylem sap of regrowing alfalfa (Medicago sativa L.): Relations with N uptake, N2 fixation and N remobilization. Plant Soil 1993, 149, 167–174. [Google Scholar] [CrossRef]
  105. Marino, D.; Damiani, I.; Gucciardo, S.; Mijangos, I.; Pauly, N.; Puppo, A. Inhibition of nitrogen fixation in symbiotic Medicago truncatula upon Cd exposure is a local process involving leghaemoglobin. J. Exp. Bot. 2013, 64, 5651–5660. [Google Scholar] [CrossRef] [PubMed] [Green Version]
  106. Schat, H.; Sharma, S.S.; Vooijs, R. Heavy metal-induced accumulation of free proline in a metal-tolerant and a nontolerant ecotype of Silene vulgaris. Physiol. Plant. 1997, 101, 477–482. [Google Scholar] [CrossRef]
  107. Costa, G.; Spitz, E. Influence of cadmium on soluble carbohydrates, free amino acids, protein content of in vitro cultured Lupinus albus. Plant Sci. 1997, 128, 131–140. [Google Scholar] [CrossRef]
  108. Dobra, J.; Motyka, V.; Dobrev, P.; Malbeck, J.; Prasil, I.T.; Haisel, D.; Gaudinova, A.; Havlova, M.; Gubis, J.; Vankova, R. Comparison of hormonal responses to heat, drought and combined stress in tobacco plants with elevated proline content. J. Plant Physiol. 2010, 167, 1360–1370. [Google Scholar] [CrossRef]
  109. Zemanová, V.; Pavlík, M.; Pavlíková, D.; Tlustoš, P. The changes of contents of selected free amino acids associated with cadmium stress in Noccaea caerulescens and Arabidopsis halleri. Plant Soil Environ. 2013, 59, 417–422. [Google Scholar] [CrossRef] [Green Version]
  110. Aziz, A.; Martin-Tanguy, J.; Larher, F. Stress-induced changes in polyamine and tyramine levels can regulate proline accumulation in tomato leaf discs treated with sodium chloride. Physiol. Plant. 1998, 104, 195–202. [Google Scholar] [CrossRef]
  111. Ghabriche, R.; Ghnaya, T.; Mnasri, M.; Zaier, H.; Baioui, R.; Vromman, D.; Ghabriche, R.; Lutts, S. Polyamine and tyramine involvement in NaCl-induced improvement of Cd resistance in the halophyte Inula chrithmoides L. J. Plant Physiol. 2017, 216, 136–144. [Google Scholar] [CrossRef]
  112. Gupta, K.; Dey, A.; Gupta, B. Plant polyamines in abiotic stress responses. Acta Physiol. Plant. 2013, 35, 2015–2036. [Google Scholar] [CrossRef]
  113. Nahar, K.; Rahman, M.; Hasanuzzaman, M.; Alam, M.M.; Rahman, A.; Suzuki, T.; Fujita, M. Physiological and biochemical mechanisms of spermine-induced cadmium stress tolerance in mung bean (Vigna radiata L.) seedlings. Environ. Sci. Pollut. Res. 2016, 23, 21206–21218. [Google Scholar] [CrossRef]
  114. Groppa, M.D.; Ianuzzo, M.P.; Tomaro, M.L.; Benavides, M.P. Polyamine metabolism in sunflower plants under long-term cadmium or copper stress. Amino Acids 2007, 32, 265–275. [Google Scholar] [CrossRef]
  115. Zhao, H.; Yang, H. Exogenous polyamines alleviate the lipid peroxidation induced by cadmium chloride stress in Malus hupehensis Rehd. Sci. Hortic. 2008, 116, 442–447. [Google Scholar] [CrossRef]
  116. Yang, H.Y.; Shi, G.X.; Li, W.L.; Wu, W.L. Exogenous spermidine enhances Hydrocharis dubia cadmium tolerance. Russ. J. Plant Physiol. 2013, 60, 770–775. [Google Scholar] [CrossRef]
  117. Geuns, J.M.C.; Cuypers, A.J.F.; Michiels, T.; Colpaert, J.V.; Van Laere, A.; Van Den Broeck, K.A.O.; Vandecasteele, C.H.A. Mung bean seedlings as bio-indicators for soil and water contamination by cadmium. Sci. Total Environ. 1997, 203, 183–197. [Google Scholar] [CrossRef]
  118. Vishwakarma, K.; Upadhyay, N.; Kumar, N.; Yadav, G.; Singh, J.; Mishra, R.K.; Kumar, V.; Verma, R.; Upadhyay, R.G.; Pandey, M.; et al. Abscisic Acid Signaling and Abiotic Stress Tolerance in Plants: A Review on Current Knowledge and Future Prospects. Front. Plant Sci. 2017, 8. [Google Scholar] [CrossRef] [Green Version]
  119. Amjad, M.; Akhtar, J.; Anwar-ul-Haq, M.; Yang, A.; Akhtar, S.S.; Jacobsen, S.E. Integrating role of ethylene and ABA in tomato plants adaptation to salt stress. Sci. Hortic. 2014, 172, 109–116. [Google Scholar] [CrossRef]
  120. Hsu, Y.T.; Kao, C.H. Role of abscisic acid in cadmium tolerance of rice (Oryza sativa L.) seedlings. Plant. Cell Environ. 2003, 26, 867–874. [Google Scholar] [CrossRef] [Green Version]
  121. Salt, D.E.; Prince, R.C.; Pickering, I.J.; Raskin, I. Mechanisms of Cadmium Mobility and Accumulation in Indian Mustard. Plant Physiol. 1995, 109, 1427–1433. [Google Scholar] [CrossRef] [Green Version]
  122. Watkins, J.; Chapman, J.M.; Muday, G.K. Abscisic acid-induced reactive oxygen species are modulated by flavonols to control stomata aperture. Plant Physiol. 2017, 175. [Google Scholar] [CrossRef] [Green Version]
Figure 1. Plots of PCA revealed differences of the secondary metabolite profiles in M. sativa stems after long-term Cd exposure (10 mg kg−1 soil dry weight). Results show two distinct clusters of Cd-exposed (Cd) stem samples and control (Ctr) stem samples. Metabolites were measured by UPLC–MS in two technical replicates from five biological replicates. When samples were analyzed in (A) negative mode, Dim 1 and Dim 2 represent together 74.51% of the observed variance in the sample set. (B) In positive mode, Dim 1 and Dim 2 represent together 73.46% of the observed variance in the sample set. The barycenter of samples from control and Cd-exposed plants is indicated with a square.
Cells 09 02707 g001
Figure 2. Amino acid profile in M. sativa stems after long-term exposure to Cd (10 mg kg−1 soil dry weight). Amino acids were measured using UHPLC–DAD (n = 4). (A) Principal component analysis. Dim 1 and 2 represent together 71% of the observed variance (B) relative fold change of significantly changed AA (±SEM). Significance was determined with a t-test at p ≤ 0.05. Absolute values for all AAs are provided in Table S3.
Cells 09 02707 g002
Figure 3. Amino acid profile in M. sativa leaves after long-term exposure to Cd (10 mg kg−1 soil dry weight). Amino acids were measured using GC–MS (n = 4 to 5). (A) Principal component analysis. Dim 1 and 2 represent together 80.3% of the observed variance (B) relative fold change of significantly changed AA (±SEM). Significance was determined with a t-test at p ≤ 0.05. Absolute values for all AAs are provided in Table S4.
Cells 09 02707 g003
Figure 4. Principal component analysis demonstrates differentiation between the leaves and stems of M. sativa after long-term Cd exposure based on their AA profile, based on values normalized to the average of the non-exposed control for each organ separately. Dim 1 captures 67% of the variance, and Dim 2 captures 13.7% of the variance.
Cells 09 02707 g004
Figure 5. Long-term Cd exposure significantly changes the polyamine content in M. sativa stems. Relative average fold-change ± SEM (n = 5). Polyamine content was measured using HPLC-FLD. Significance of fold change was determined with a Student’s t-test at p < 0.05.
Cells 09 02707 g005
Table 1. Changes of normalized relative gene expression quantities in M. sativa stems upon cadmium (Cd) exposure. Normalized expression values are given relative to the control set at 1.00. Values are given as an average of 5 replicates. A t-test was performed to determine the significance (p ≤ 0.05). Green significantly up-regulated; red significantly down-regulated.
Gene AnnotationContig ID M. sativaRel. Norm. Gene Expressionp-Value
Polyamine synthesis
arginine decarboxylase46,7451.1230.548
diamine oxidase14,7690.8000.042
glutamate decarboxylase103,3591.6850.019
SAM decarboxylase91521.1410.459
spermidine synthase53411.2130.042
spermine synthase92,5261.3410.032
Flavone synthesis
chalcone isomerase60,8091.8090.019
chalcone reductase59,7962.7530.019
chalcone synthase99,4631.2470.371
isoflavone synthase10,2522.6990.019
Glutathione synthesis and redox cycle
homoglutathione synthetase[63]1.3550.01
γ-glutamylcysteine synthetase[63]0.9590.361
glutathione reductase 1[63]1.1050.071
glutathione reductase 2[63]1.0430.681
monodehydroascorbate reductase[63]1.1770.048
glutathione synthetase 210,4441.3840.004
Table 2. List of differentially abundant compounds in M. sativa stems after long-term Cd exposure. Data were obtained by UHPLC–MS in negative mode, with MS/MS experiments. The relative abundance of each peak in stems of control and Cd-exposed plants is based on the selected ion current and is presented as the average normalized value of two technical replicates from five biological replicates. Rt, retention time; nd, not detected.
Rt (min)Relative AbundanceFold[M − H]Error (ppm)Molecular FormulaMSMS [M − H]Putative IdentityReference
Cadmium-ExposedControl
2.234462811.59164.07191.22C9H11NO2147.0434 103.0539- 164.0693 72.0108L-Phe *
2.5018989.00274.0932
[M − H2O − H]
−0.11C11H19NO889.0280 274.0929 100.0413 159.8914 232.0821N-acetyl-hexosamine derivative
15.3721139.40669.1687
[M + FA − H]
2.18C28H32O16299.0537 284.0294 461.1077Trihydroxy-methoxy (iso)flavone di-hexoside[64,65,66]
18.18284309.36299.0768−1.47C13H16O8137.0227 109.0266 135.0047 153.0146 91.0181Hydroxybenzoyl-hexoside[67]
19.07464696.69605.11632.50C27H26O16113.0234 253.0478 351.0579 85.0294 193.0316Dihydroxy(iso)flavone di-hexuronide[64,65]
19.4121124.86299.07730.20C13H16O8137.0198 135.0049 100.9291Hydroxybenzoyl-hexoside[65,67]
19.491711511.37605.11642.63C27H26O16113.0211 253.0500 85.0285 351.0572 193.0314Dihydroxy(iso)flavone di-hexuronide[64,65]
19.6463610.26461.10930.78C22H22O11284.0273 299.0545 255.0303 135.0046Trihydroxy methoxy-(iso)flavone hexoside[64,65,66]
20.06228504.58429.0824−0.75C21H18O10253.0489 85.0297 113.0224 135.0058 117.0322Dihydroxy(iso)flavone-hexuronide[64,65]
20.415076.88429.0823−0.98C21H18O10253.0481 117.0344 135.0079 85.0281 280.7946Dihydroxy(iso)flavone-hexuronide[64,65]
21.83521232.35447.0931−0.42C21H20O11284.0327 447.1017Tetrahydroxy(iso)flavone-hexoside[64,68]
23.2226ndtreated only283.0610−0.71C16H12O5268.0387 147.9081 211.0346 283.0632Dihydroxy- methoxy(iso)flavone[64,66,69]
23.8059233.23283.0608−1.41C16H12O5268.0340 211.0382 239.0319 195.0406Dihydroxy-methoxy(iso)flavone[65,70]
23.9668106.59253.0504−0.91C15H10O4253.0470 117.0329 135.0080 91.0203 133.0290Dihydroxy(iso)flavone[65]
24.0328119.01313.0712−1.79C17H14O6255.0286 298.0491 283.0201 227.0312 171.0404Dihydroxy- dimethoxy-(iso)flavone[65]
25.11151682.22263.1285−1.44C15H20O4153.0898 219.1360 204.1122 136.0514Abscisic acid*
26.2229218.56267.06630.07C16H12O4252.0402 223.0395 195.0422 267.0628 251.0305Hydroxy-methoxy(iso)flavone[64,70]
26.8588886.69267.06640.45C16H12O4252.0406 223.0371 195.0419Hydroxy-methoxy(iso)flavone
27.7339ndtreated only299.0920−1.62C17H16O5135.0072 91.0170 299.0911 284.0303 269.0444 256.0339Unknown compound
28.34129177.65473.1464
[M + FA H]
2.28C24H26O10254.0571 209.0582 211.0394 225.0548 269.0838Hydroxy-methoxy-pterocarpan malonate hexoside derivative[71]
30.1912110.12297.0763−1.85C17H14O5239.0363 282.0544 183.0049 195.0418 254.0552 211.0394Dimethoxy-hydroxy(iso)flavone[64]
34.7638314.57313.0715−0.83C17H14O6255.0277 298.0473 227.0329 270.0526 183.0420Dihydroxy- dimethoxy(iso)flavone[64,65]
36.4971322.64509.12440.41C30H22O8237.0909 263.0704 135.0058 373.1054 399.0872Hydroxylated chalcone dimer[65]
* Identity of the compound was confirmed with an authentic standard.
Table 3. List of differentially abundant compounds in M. sativa stems after long-term Cd exposure. Data were obtained by UHPLC–MS in positive mode, with MS/MS experiments. The relative abundance of each peak in stems of control and Cd-exposed plants is based on the selected ion current and is presented as the average normalized value of two technical replicates from five biological replicates. Abbreviations: Rt, retention time; nd, not detected.
Rt (min)Relative AbundanceFold[M + H]Error (ppm)Molecular FormulaMSMS [M + H]Putative IdentityReference
Cadmium-ExposedControl
2.51114113.29276.107−2.82C11H19NO8138.0521 96.0424 144.0625 126.0524 84.0413N-acetyl-hexosamine derivative
16.62823123.92271.0593−2.95C15H10O5215.0675 149.0229 57.0700 43.0562Trihydroxy(iso)flavone conjugated[64,65]
18.172881617.84241.0853−2.57C15H12O3107.0438 131.0451 147.0454 123.0414 77.0363Unknown compound
19.04380655.83607.1284−1.58C27H26O16255.0602Dihydroxy(iso)flavone-di-hexuronide[64,65]
19.46139159.17607.01278−2.57C27H26O16255.0560Dihydroxy(iso)flavone di-hexuronide[64,65]
19.6536312.82463.1224−2.35C22H22O11301.0698 241.0524 269.0445 213.0523 145.0240Trihydroxy-methoxy-(iso)flavone hexoside[64,65,66]
20.07281703.99431.0957−3.64C21H18O10255.0646 137.0214 145.0236 119.0462Dihydroxy(iso)flavone hexuronide[64,65]
20.3758106.03431.0959−3.18C21H18O10255.0629 137.0224 145.0267 119.0485Dihydroxy(iso)flavone hexuronide[64,65]
21.1376ndtreated only489.1382−1.9C24H26O12241.0828 131.0497 147.0428 213.0866 107.0483Unknown compound[65]
21.8224532.22449.1063−3.43C21H20O11287.0529 153.0133 269.0445 259.0586Tetrahydroxy(iso)flavone-hexoside[64,68]
23.07104423.42563.1382−2.36C26H26O14315.0839 299.0534 254.0531Dihydroxy- dimethoxy-(iso)flavone malonate-hexoside derivative[64,65]
23.2270161.76533.1279−2.01C25H24O13285.0756 270.0515 253.0510 225.0545 242.0553Dihydroxy methoxy-(iso)flavone malonate-hexoside derivative[64,65]
23.9461173.51255.0640−4.67C15H10O4255.0638 137.0209 145.0263 119.0462 93.0307Dihydroxy(iso)flavone[65]
24.0286237.18563.1376−3.43C26H26O14315.0834 300.0593 283.0562 255.0645Dihydroxy- dimethoxy-(iso)flavone malonate-hexoside derivative[64,65]
24.7870190.39563.1376−3.43C26H26O14315.0868 207.0628 175.0371 300.0625 147.0419Dihydroxy- dimethoxy-(iso)flavone malonate-hexoside derivative[64,65]
25.193293.75299.0907−2.34C17H14O5299.0955 284.0663 93.0674 256.0754 166.0265Dimethoxy-hydroxy(iso)flavone[64]
26.187479.93517.1324−3.19C25H24O12269.0809 254.0608 237.0551 213.0890 107.0488Hydroxy-methoxy(iso)flavone malonyl hexose[64,69,71]
26.7919992876.97517.1324−3.19C25H24O12269.0804 254.0569 213.0902 237.0544 226.0615Hydroxy-methoxy-(iso)flavone malonate-hexoside derivative[64,71]
26.905935011.85547.1433−2.41C26H26O13299.0914 284.0680 256.0706 239.0703Dimethoxy-hydroxy(iso)flavone malonate-hexoside derivative[64]
27.5546ndtreated only533.1272−3.26C25H24O13151.0376 123.0401 285.0806Unknown compound
28.356111006.10519.1478−3.70C25H26O12137.0575 271.0961 161.0581 123.0421 201.1603Hydroxy methoxy-pterocarpan malonate-hexoside derivative[64,69,71]
28.5032ndtreated only329.1011−2.70C18H16O6329.1008 313.0722 285.0746 295.0591 267.0649Unknown compound
30.183871053.69299.0904−3.34C17H14O5299.0915 284.0663 256.0721 132.0539 227.0699Dimethoxy-hydroxy(iso)flavone[64,65]
31.1373193.86271.0954−4.02C16H14O4137.0573 109.0621 79.0524 123.0413 161.0578Pterocarpan[64,69]
36.4823ndtreated-only511.1372−3.01C30H22O8137.0214 375.1088 439.2446 265.0972Hydroxylated chalcone dimer[65]
Publisher’s Note: MDPI stays neutral with regard to jurisdictional claims in published maps and institutional affiliations.

