Common Factors in Neurodegeneration: A Meta-Study Revealing Shared Patterns on a Multi-Omics Scale


Abstract

1. Introduction
2. Materials and Methods
2.1. Data Acquisition/Literature Research
2.1.1. Genome
2.1.2. Transcriptome
2.1.3. Proteome
2.2. Data Management
2.3. Data Analysis
2.3.1. Intersection
2.3.2. Common Regulation between NDDs on a Transcriptomic Level
2.3.3. GO-Term- and Pathway Analyses
- enrichDatabase = c(“pathway_KEGG”, “geneontology_Biological_Process”, “geneontology_Cellular_Component”, “geneontology_Molecular_Function”)
- interestGeneType = “genesymbol”
- referenceSet = “genome”
- topThr = 10000
- reportNum = 10000
3. Results
3.1. Intersection
3.2. Common Regulation of NDDs on the Transcriptomic Level
3.3. GO-Term- and Pathway-Analyses
3.3.1. Transcriptomic Intersection of AD, PD, ALS and HD
3.3.2. Proteomic Intersection of AD, PD, ALS and HD
4. Discussion
4.1. Intersections
4.2. GO-Term and Pathway Analyses
4.2.1. KEGG Pathway Analysis
4.2.2. Response to Heat
4.2.3. RNA Catabolic Process
4.2.4. Positive Regulation of Cytokine Production and Angiogenesis
4.2.5. Response to Hypoxia
4.2.6. Extracellular Matrix Organization
4.2.7. Nucleotide-Binding Oligomerization Domain Containing 2 Signaling Pathway
4.2.8. Negative Regulation of Apoptotic Signaling Pathway
4.2.9. Protein Stabilization and Regulation of Protein Stability
4.2.10. Humoral Immune Response
4.2.11. Common Regulation on the Transcriptomic Level
5. Conclusions
Supplementary Materials
Author Contributions
Funding
Conflicts of Interest
References
- Serrano-Pozo, A.; Frosch, M.P.; Masliah, E.; Hyman, B.T. Neuropathological Alterations in Alzheimer Disease. Cold Spring Harb. Perspect. Med. 2011, 1, a006189. [Google Scholar] [CrossRef] [PubMed]
- Rubinsztein, D.C. The roles of intracellular protein-degradation pathways in neurodegeneration. Nat. Cell Biol. 2006, 443, 780–786. [Google Scholar] [CrossRef] [PubMed]
- Esteves, A.R.; Cardoso, S.M. Differential protein expression in diverse brain areas of Parkinson’s and Alzheimer’s disease patients. Sci. Rep. 2020, 10, 1–22. [Google Scholar] [CrossRef] [PubMed]
- Hussain, R.; Zubair, H.; Pursell, S.; Shahab, M. Neurodegenerative Diseases: Regenerative Mechanisms and Novel Therapeutic Approaches. Brain Sci. 2018, 8, 177. [Google Scholar] [CrossRef]
- Xie, T.; Deng, L.; Mei, P.; Zhou, Y.; Wang, B.; Zhang, J.; Lin, J.; Wei, Y.; Zhang, X.; Xu, R. A genome-wide association study combining pathway analysis for typical sporadic amyotrophic lateral sclerosis in Chinese Han populations. Neurobiol. Aging 2014, 35, 1778.e9–1778.e23. [Google Scholar] [CrossRef]
- Dugger, B.N.; Dickson, D.W. Pathology of neurodegenerative diseases. Cold Spring Harb. Perspect. Biol. 2017, 9, a028035. [Google Scholar] [CrossRef]
- Gan, L.; Cookson, M.R.; Petrucelli, L.; La Spada, A.R. Converging pathways in neurodegeneration, from genetics to mechanisms. Nat. Neurosci. 2018, 21, 1300–1309. [Google Scholar] [CrossRef]
- Hinz, F.I.; Geschwind, D.H. Molecular Genetics of Neurodegenerative Dementias. Cold Spring Harb. Perspect. Biol. 2016, 9, a023705. [Google Scholar] [CrossRef]
- Bellenguez, C.; Grenier-Boley, B.; Lambert, J.-C. Genetics of Alzheimer’s disease: Where we are, and where we are going. Curr. Opin. Neurobiol. 2020, 61, 40–48. [Google Scholar] [CrossRef]
- Reed, X.; Bandrés-Ciga, S.; Blauwendraat, C.; Cookson, M.R. The role of monogenic genes in idiopathic Parkinson’s disease. Neurobiol. Dis. 2019, 124, 230–239. [Google Scholar] [CrossRef]
- Mahalingam, S.; Levy, L.M. Genetics of Huntington Disease. Am. J. Neuroradiol. 2013, 35, 1070–1072. [Google Scholar] [CrossRef] [PubMed]
- Ghasemi, M.; Brown, R.H. Genetics of Amyotrophic Lateral Sclerosis. Cold Spring Harb. Perspect. Med. 2018, 8, a024125. [Google Scholar] [CrossRef] [PubMed]
- Sys, S.J.; Fournier, D.; Horenko, I.; Endres, K.; Gerber, S. Dynamics of Associations Between Single Nucleotide Polymorphisms in Relation to Alzheimer’s Disease Captured with a New Measure of Linkage Disequilibrium. Genom. Comput. Biol. 2018, 4, e100045. [Google Scholar] [CrossRef][Green Version]
- Hewel, C.; Kaiser, J.; Wierczeiko, A.; Linke, J.; Reinhardt, C.; Endres, K.; Gerber, S. Common miRNA Patterns of Alzheimer’s Disease and Parkinson’s Disease and Their Putative Impact on Commensal Gut Microbiota. Front. Neurosci. 2019, 13, 113. [Google Scholar] [CrossRef]
- Ramanan, V.K.; Saykin, A.J. Pathways to neurodegeneration: Mechanistic insights from GWAS in Alzheimer’s disease, Parkinson’s disease, and related disorders. Am. J. Neurodegener. Dis. 2013, 2, 145–175. [Google Scholar]
- Bredesen, D.E.; Rao, R.V.; Mehlen, P. Cell death in the nervous system. Nat. Cell Biol. 2006, 443, 796–802. [Google Scholar] [CrossRef]
- Guo, F.; Liu, X.; Cai, H.; Le, W. Autophagy in neurodegenerative diseases: Pathogenesis and therapy. Brain Pathol. 2017, 28, 3–13. [Google Scholar] [CrossRef]
- Silva, D.F.; Esteves, A.R.; Oliveira, C.R.; Cardoso, S.M. Mitochondrial Metabolism Power SIRT2-Dependent Deficient Traffic Causing Alzheimer’s-Disease Related Pathology. Mol. Neurobiol. 2017, 54, 4021–4040. [Google Scholar] [CrossRef]
- Esteves, A.R.; Arduíno, D.M.; Silva, D.F.; Viana, S.D.; Pereira, F.C.; Cardoso, S.M. Mitochondrial Metabolism Regulates Microtubule Acetylome and Autophagy Trough Sirtuin-2: Impact for Parkinson’s Disease. Mol. Neurobiol. 2017, 55, 1440–1462. [Google Scholar] [CrossRef]
- Briston, T.; Hicks, A.R. Mitochondrial dysfunction and neurodegenerative proteinopathies: Mechanisms and prospects for therapeutic intervention. Biochem. Soc. Trans. 2018, 46, 829–842. [Google Scholar] [CrossRef]
- Jomova, K.; Vondrakova, D.; Lawson, M.; Valko, M. Metals, oxidative stress and neurodegenerative disorders. Mol. Cell. Biochem. 2010, 345, 91–104. [Google Scholar] [CrossRef]
- Cabral-Miranda, F.; Hetz, C. ER Stress and Neurodegenerative Disease: A Cause or Effect Relationship? In Current Topics in Microbiology and Immunology; Springer Science and Business Media LLC: Cham, Switzerland, 2017; Volume 414, pp. 131–157. [Google Scholar]
- Cairns, N.J.; Lee, V.M.-Y.; Trojanowski, J.Q. The cytoskeleton in neurodegenerative diseases. J. Pathol. 2004, 204, 438–449. [Google Scholar] [CrossRef] [PubMed]
- Eira, J.; Silva, C.S.; Sousa, M.M.; Liz, M.A. The cytoskeleton as a novel therapeutic target for old neurodegenerative disorders. Prog. Neurobiol. 2016, 141, 61–82. [Google Scholar] [CrossRef] [PubMed]
- Smith, D.M. Could a Common Mechanism of Protein Degradation Impairment Underlie Many Neurodegenerative Diseases? J. Exp. Neurosci. 2018, 12, 12. [Google Scholar] [CrossRef] [PubMed]
- Thibaudeau, T.A.; Anderson, R.T.; Smith, D.M. A common mechanism of proteasome impairment by neurodegenerative disease-associated oligomers. Nat. Commun. 2018, 9, 1–14. [Google Scholar] [CrossRef] [PubMed]
- Wielgat, P.; Braszko, J.J. Significance of the cell adhesion molecules and sialic acid in neurodegeneration. Adv. Med. Sci. 2012, 57, 23–30. [Google Scholar] [CrossRef]
- Rentzos, M.; Michalopoulou, M.; Nikolaou, C.; Cambouri, C.; Rombos, A.; Dimitrakopoulos, A.; Vassilopoulos, D. The role of soluble intercellular adhesion molecules in neurodegenerative disorders. J. Neurol. Sci. 2005, 228, 129–135. [Google Scholar] [CrossRef] [PubMed]
- Chapman, M.A. Interactions between cell adhesion and the synaptic vesicle cycle in Parkinson’s disease. Med. Hypotheses 2014, 83, 203–207. [Google Scholar] [CrossRef]
- Heneka, M.T.; Kummer, M.P.; Latz, E. Innate immune activation in neurodegenerative disease. Nat. Rev. Immunol. 2014, 14, 463–477. [Google Scholar] [CrossRef]
- Kim, S.; Seo, J.H.; Suh, Y.H. α-Synuclein, Parkinson’s disease, and Alzheimer’s disease. Parkinsonism Relat Disord. 2004, 10, S9–S13. [Google Scholar] [CrossRef]
- Heckmann, B.L.; Tummers, B.; Green, D.R. Crashing the computer: Apoptosis vs. necroptosis in neuroinflammation. Cell Death Differ. 2018, 26, 41–52. [Google Scholar] [CrossRef] [PubMed]
- Doty, K.R.; Guillot-Sestier, M.-V.; Town, T. The role of the immune system in neurodegenerative disorders: Adaptive or maladaptive? Brain Res. 2015, 1617, 155–173. [Google Scholar] [CrossRef] [PubMed]
- Shamim, A.; Mahmood, T.; Ahsan, F.; Kumar, A.; Bagga, P. Lipids: An insight into the neurodegenerative disorders. Clin. Nutr. Exp. 2018, 20, 1–19. [Google Scholar] [CrossRef]
- Chen, Y.-A.; Lemire, M.; Choufani, S.; Butcher, D.T.; Grafodatskaya, D.; Zanke, B.W.; Gallinger, S.; Hudson, T.J.; Weksberg, R. Discovery of cross-reactive probes and polymorphic CpGs in the Illumina Infinium HumanMethylation450 microarray. Epigenetics 2013, 8, 203–209. [Google Scholar] [CrossRef]
- Johnson, E.C.B.; Dammer, E.B.; Duong, D.M.; Ping, L.; Zhou, M.; Yin, L.; Higginbotham, L.A.; Guajardo, A.; White, B.; Troncoso, J.C.; et al. Large-scale proteomic analysis of Alzheimer’s disease brain and cerebrospinal fluid reveals early changes in energy metabolism associated with microglia and astrocyte activation. Nat. Med. 2020, 26, 769–780. [Google Scholar] [CrossRef]
- Joe, E.; Ringman, J.M. Cognitive symptoms of Alzheimer’s disease: Clinical management and prevention. BMJ 2019, 367, l6217. [Google Scholar] [CrossRef]
- Scheltens, P.; Blennow, K.; Breteler, M.M.B.; de Strooper, B.; Frisoni, G.B.; Salloway, S.; Van der Flier, W.M. Alzheimer’s disease. Lancet 2016, 388, 505–517. [Google Scholar] [CrossRef]
- Ballard, C.; Gauthier, S.; Corbett, A.; Brayne, C.; Aarsland, D.; Jones, E. Alzheimer’s disease. Lancet 2011, 377, 1019–1031. [Google Scholar] [CrossRef]
- Braak, H.; Braak, E. Neuropathological stageing of Alzheimer-related changes. Acta Neuropathol. 1991, 82, 239–259. [Google Scholar] [CrossRef]
- Mandelkow, E. Tau in Alzheimer’s disease. Trends Cell Biol. 1998, 8, 425–427. [Google Scholar] [CrossRef]
- Iqbal, K.; Grundke-Iqbal, I. Neurofibrillary pathology leads to synaptic loss and not the other way around in Alzheimer disease. J. Alzheimer’s Dis. 2002, 4, 235–238. [Google Scholar] [CrossRef] [PubMed]
- Guilherme, M.D.S.; Todorov, H.; Osterhof, C.; Möllerke, A.; Cub, K.; Hankeln, T.; Gerber, S.; Endres, K. Impact of Acute and Chronic Amyloid-β Peptide Exposure on Gut Microbial Commensals in the Mouse. Front. Microbiol. 2020, 11, 1008. [Google Scholar] [CrossRef] [PubMed]
- Dauer, W.; Przedborski, S. Parkinson’s disease: Mechanisms and models. Neuron 2003, 39, 889–909. [Google Scholar] [CrossRef]
- Willis, A.W.; Evanoff, B.A.; Lian, M.; Criswell, S.R.; Racette, B.A. Geographic and Ethnic Variation in Parkinson Disease: A Population-Based Study of US Medicare Beneficiaries. Neuroepidemiology 2010, 34, 143–151. [Google Scholar] [CrossRef] [PubMed]
- Jankovic, J. Parkinson’s disease: Clinical features and diagnosis. J. Neurol. Neurosurg. Psychiatry 2008, 79, 368–376. [Google Scholar] [CrossRef] [PubMed]
- Ge, A. Biology of Parkinson’s disease: Pathogenesis and pathophysiology of a multisystem neurodegenerative disorder. Dialog- Clin. Neurosci. 2004, 6, 259–280. [Google Scholar] [CrossRef]
- Berardelli, A.; Rothwell, J.C.; Thompson, P.D.; Hallett, M. Pathophysiology of bradykinesia in Parkinson’s disease. Brain 2001, 124, 2131–2146. [Google Scholar] [CrossRef]
- Damiano, M.; Galvan, L.; Déglon, N.; Brouillet, E. Mitochondria in Huntington’s disease. Biochim. Et Biophys. Acta (Bba)-Mol. Basis Dis. 2010, 1802, 52–61. [Google Scholar] [CrossRef]
- McQuade, L.R.; Balachandran, A.; Scott, H.A.; Khaira, S.; Baker, M.S.; Schmidt, U. Proteomics of Huntington’s Disease-Affected Human Embryonic Stem Cells Reveals an Evolving Pathology Involving Mitochondrial Dysfunction and Metabolic Disturbances. J. Proteome Res. 2014, 13, 5648–5659. [Google Scholar] [CrossRef]
- Ross, C.A.; Tabrizi, S.J. Huntington’s disease: From molecular pathogenesis to clinical treatment. Lancet Neurol. 2011, 10, 83–98. [Google Scholar] [CrossRef]
- Brandt, J. Behavioral Changes in Huntington Disease. Cogn. Behav. Neurol. 2018, 31, 26–35. [Google Scholar] [CrossRef] [PubMed]
- Zhao, T.; Hong, Y.; Li, X.-J.; Li, S. Subcellular Clearance and Accumulation of Huntington Disease Protein: A Mini-Review. Front. Mol. Neurosci. 2016, 9, 27. [Google Scholar] [CrossRef] [PubMed]
- Walker, F.O. Huntington’s disease. Lancet 2007, 369, 218–228. [Google Scholar] [CrossRef]
- Roos, R.A.C. Huntington’s disease: A clinical review. Orphanet J. Rare Dis. 2010, 5, 40. [Google Scholar] [CrossRef] [PubMed]
- Johnson, C.D.; Davidson, B.L. Huntington’s disease: Progress toward effective disease-modifying treatments and a cure. Hum. Mol. Genet. 2010, 19, R98–R102. [Google Scholar] [CrossRef] [PubMed]
- Kiernan, M.C.; Vucic, S.; Cheah, B.C.; Turner, M.R.; Eisen, A.; Hardiman, O.; Burrell, J.R.; Zoing, M.C. Amyotrophic lateral sclerosis. Lancet 2011, 377, 942–955. [Google Scholar] [CrossRef]
- Mitchell, J.; Borasio, G. Amyotrophic lateral sclerosis. Lancet 2007, 369, 2031–2041. [Google Scholar] [CrossRef]
- Wijesekera, L.L.; Leigh, P.N. Amyotrophic lateral sclerosis. Orphanet J. Rare Dis. 2008, 4, 3–22. [Google Scholar] [CrossRef]
- Kang, S.H.; Li, Y.; Fukaya, M.; Lorenzini, I.; Cleveland, D.W.; Ostrow, L.W.; Rothstein, J.D.; Bergles, D.E. Degeneration and impaired regeneration of gray matter oligodendrocytes in amyotrophic lateral sclerosis. Nat. Neurosci. 2013, 16, 571–579. [Google Scholar] [CrossRef]
- Philips, T.; Rothstein, J. Glial cells in amyotrophic lateral sclerosis. Exp. Neurol. 2014, 262, 111–120. [Google Scholar] [CrossRef]
- Novellino, F.; Saccà, V.; Donato, A.; Zaffino, P.; Spadea, M.F.; Vismara, M.F.M.; Arcidiacono, B.; Malara, N.; Presta, I.; Donato, G. Innate Immunity: A Common Denominator between Neurodegenerative and Neuropsychiatric Diseases. Int. J. Mol. Sci. 2020, 21, 1115. [Google Scholar] [CrossRef] [PubMed]
- E Renton, A.; Chiò, A.; Traynor, B.J. State of play in amyotrophic lateral sclerosis genetics. Nat. Neurosci. 2014, 17, 17–23. [Google Scholar] [CrossRef] [PubMed]
- Blokhuis, A.M.; Groen, E.J.N.; Koppers, M.; Berg, L.H.V.D.; Pasterkamp, R.J. Protein aggregation in amyotrophic lateral sclerosis. Acta Neuropathol. 2013, 125, 777–794. [Google Scholar] [CrossRef] [PubMed]
- Li, P.; Nie, Y.; Yu, J. An Effective Method to Identify Shared Pathways and Common Factors among Neurodegenerative Diseases. PLoS ONE 2015, 10, e0143045. [Google Scholar] [CrossRef]
- Arneson, D.; Zhang, Y.; Yang, X.; Narayanan, M. Shared mechanisms among neurodegenerative diseases: From genetic factors to gene networks. J. Genet. 2018, 97, 795–806. [Google Scholar] [CrossRef] [PubMed]
- Nazarian, A.; Yashin, A.I.; Kulminski, A.M. Genome-wide analysis of genetic predisposition to Alzheimer’s disease and related sex disparities. Alzheimer’s Res. Ther. 2019, 11, 1–21. [Google Scholar] [CrossRef]
- Edwards, T.L.; Scott, W.K.; Almonte, C.; Burt, A.; Powell, E.H.; Beecham, G.W.; Wang, L.; Züchner, S.; Konidari, I.; Wang, G.; et al. Genome-Wide Association Study Confirms SNPs inSNCAand theMAPTRegion as Common Risk Factors for Parkinson Disease. Ann. Hum. Genet. 2010, 74, 97–109. [Google Scholar] [CrossRef]
- Sherva, R.; Tripodis, Y.; Bennett, D.A.; Chibnik, L.B.; Crane, P.K.; De Jager, P.L.; Farrer, L.A.; Saykin, A.J.; Shulman, J.M.; Naj, A.; et al. Genome-wide association study of the rate of cognitive decline in Alzheimer’s disease. Alzheimer’s Dement. 2014, 10, 45–52. [Google Scholar] [CrossRef]
- Van Es, M.A.; Van Vught, P.W.; Blauw, H.M.; Franke, L.; Saris, C.G.; Andersen, P.; Bosch, L.V.D.; De Jong, S.; Van’t Slot, R.; Birve, A.; et al. ITPR2 as a susceptibility gene in sporadic amyotrophic lateral sclerosis: A genome-wide association study. Lancet Neurol. 2007, 6, 869–877. [Google Scholar] [CrossRef]
- Laaksovirta, H.; Peuralinna, T.; Schymick, J.C.; Scholz, S.W.; Lai, S.-L.; Myllykangas, L.; Sulkava, R.; Jansson, L.; Hernandez, D.G.; Gibbs, J.R.; et al. Chromosome 9p21 in amyotrophic lateral sclerosis in Finland: A genome-wide association study. Lancet Neurol. 2010, 9, 978–985. [Google Scholar] [CrossRef]
- Kwee, L.C.; Liu, Y.; Haynes, C.; Gibson, J.R.; Stone, A.; Schichman, S.A.; Kamel, F.; Nelson, L.M.; Topol, B.; Van Den Eeden, S.K.; et al. A High-Density Genome-Wide Association Screen of Sporadic ALS in US Veterans. PLoS ONE 2012, 7, e32768. [Google Scholar] [CrossRef]
- A Van Es, M.; Van Vught, P.W.; Blauw, H.M.; Franke, L.; Saris, C.G.; Bosch, L.V.D.; De Jong, S.W.; De Jong, V.; Baas, F.; Slot, R.V.; et al. Genetic variation in DPP6 is associated with susceptibility to amyotrophic lateral sclerosis. Nat. Genet. 2008, 40, 29–31. [Google Scholar] [CrossRef] [PubMed]
- Wei, L.; Tian, Y.; Chen, Y.; Wei, Q.; Chen, F.; Cao, B.; Wu, Y.; Zhao, B.; Chen, X.; Xie, C.; et al. Identification of TYW3/CRYZ and FGD4 as susceptibility genes for amyotrophic lateral sclerosis. Neurol. Genet. 2019, 5, e375. [Google Scholar] [CrossRef] [PubMed]
- Dekker, A.M.; Diekstra, F.P.; Pulit, S.L.; Tazelaar, G.H.P.; Van Der Spek, R.A.; Van Rheenen, W.; Van Eijk, K.R.; Calvo, A.; Brunetti, M.; Van Damme, P.; et al. Exome array analysis of rare and low frequency variants in amyotrophic lateral sclerosis. Sci. Rep. 2019, 9, 5931. [Google Scholar] [CrossRef] [PubMed]
- Shatunov, A.; Mok, K.; Newhouse, S.; E Weale, M.; Smith, B.N.; Vance, C.; Johnson, L.; Veldink, J.H.; Van Es, M.A.; Van Den Berg, L.H.; et al. Chromosome 9p21 in sporadic amyotrophic lateral sclerosis in the UK and seven other countries: A genome-wide association study. Lancet Neurol. 2010, 9, 986–994. [Google Scholar] [CrossRef]
- Van Es, M.A.; Veldink, J.H.; Saris, C.G.J.; Blauw, H.M.; Van Vught, P.W.J.; Birve, A.; Lemmens, R.; Schelhaas, H.J.; Groen, E.J.N.; Huisman, M.H.B.; et al. Genome-wide association study identifies 19p13.3 (UNC13A) and 9p21.2 as susceptibility loci for sporadic amyotrophic lateral sclerosis. Nat. Genet. 2009, 41, 1083–1087. [Google Scholar] [CrossRef]
- The ALSGEN Consortium Age of onset of amyotrophic lateral sclerosis is modulated by a locus on 1p34. Neurobiol. Aging 2012, 34, 357.e7–357.e19. [CrossRef]
- Deng, M.; Wei, L.; Zuo, X.; Tian, Y.; Xie, F.; Hu, P.; Zhu, C.; Yu, F.; Meng, Y.; Wang, H.; et al. Genome-wide association analyses in Han Chinese identify two new susceptibility loci for amyotrophic lateral sclerosis. Nat. Genet. 2013, 45, 697–700. [Google Scholar] [CrossRef]
- Lo, M.-T.; Kauppi, K.; Fan, C.-C.; Sanyal, N.; Reas, E.T.; Sundar, V.; Lee, W.-C.; Desikan, R.S.; McEvoy, L.K.; Chen, C.-H. Identification of genetic heterogeneity of Alzheimer’s disease across age. Neurobiol. Aging 2019, 84, 243.e1–243.e9. [Google Scholar] [CrossRef]
- Goris, A.; Van Setten, J.; Diekstra, F.; Ripke, S.; Patsopoulos, N.A.; Sawcer, S.J.; International Multiple Sclerosis Genetics Consortium; Van Es, M.; Australia and New Zealand MS Genetics Consortium; Andersen, P.M.; et al. No evidence for shared genetic basis of common variants in multiple sclerosis and amyotrophic lateral sclerosis. Hum. Mol. Genet. 2013, 23, 1916–1922. [Google Scholar] [CrossRef]
- Diekstra, F.P.; Van Deerlin, V.M.; Van Swieten, J.C.; Al-Chalabi, A.; Ludolph, A.C.; Weishaupt, J.H.; Hardiman, O.; Landers, J.E.; Brown, R.H.; Van Es, M.A.; et al. C9orf72andUNC13Aare shared risk loci for amyotrophic lateral sclerosis and frontotemporal dementia: A genome-wide meta-analysis. Ann. Neurol. 2014, 76, 120–133. [Google Scholar] [CrossRef] [PubMed]
- Landers, J.E.; Melki, J.; Meininger, V.; Glass, J.D.; Van Den Berg, L.H.; Van Es, M.A.; Sapp, P.C.; Van Vught, P.W.J.; McKenna-Yasek, D.M.; Blauw, H.M.; et al. Reduced expression of the Kinesin-Associated Protein 3 (KIFAP3) gene increases survival in sporadic amyotrophic lateral sclerosis. Proc. Natl. Acad. Sci. USA 2009, 106, 9004–9009. [Google Scholar] [CrossRef] [PubMed]
- Van Rheenen, W.; Registry, P.; Shatunov, A.; Dekker, A.M.; McLaughlin, R.L.; Diekstra, F.P.; Pulit, S.L.; Van Der Spek, R.A.A.; Võsa, U.; De Jong, S.; et al. Genome-wide association analyses identify new risk variants and the genetic architecture of amyotrophic lateral sclerosis. Nat. Genet. 2016, 48, 1043–1048. [Google Scholar] [CrossRef] [PubMed]
- Nicolas, A.; Kenna, K.P.; Renton, A.E.; Ticozzi, N.; Faghri, F.; Chia, R.; Dominov, J.A.; Kenna, B.J.; Nalls, M.A.; Keagle, P.; et al. Genome-wide Analyses Identify KIF5A as a Novel ALS Gene. Neuron 2018, 97, 1268–1283.e6. [Google Scholar] [CrossRef]
- Latourelle, J.C.; Pankratz, N.; Dumitriu, A.; Wilk, J.B.; Goldwurm, S.; Pezzoli, G.; Mariani, C.B.; DeStefano, A.L.; Halter, C.; Gusella, J.F.; et al. Genomewide association study for onset age in Parkinson disease. Bmc Med Genet. 2009, 10, 98. [Google Scholar] [CrossRef]
- Zhu, Z.; Lin, Y.; Li, X.; Driver, J.A.; Liang, L. Shared genetic architecture between metabolic traits and Alzheimer’s disease: A large-scale genome-wide cross-trait analysis. Qual. Life Res. 2019, 138, 271–285. [Google Scholar] [CrossRef]
- Feulner, T.M.; Laws, S.M.; Friedrich, P.; Wagenpfeil, S.; Wurst, S.H.R.; Riehle, C.; A Kuhn, K.; Krawczak, M.; Schreiber, S.; Nikolaus, S.; et al. Examination of the current top candidate genes for AD in a genome-wide association study. Mol. Psychiatry 2009, 15, 756–766. [Google Scholar] [CrossRef]
- Kramer, P.L.; Xu, H.; Woltjer, R.L.; Westaway, S.K.; Clark, D.; Erten-Lyons, D.; Kaye, J.; Welsh-Bohmer, K.A.; Troncoso, J.C.; Markesbery, W.R.; et al. Alzheimer disease pathology in cognitively healthy elderly: A genome-wide study. Neurobiol. Aging 2011, 32, 2113–2122. [Google Scholar] [CrossRef]
- Meda, S.A.; Narayanan, B.; Liu, J.; Perrone-Bizzozero, N.I.; Stevens, M.C.; Calhoun, V.D.; Glahn, D.C.; Shen, L.; Risacher, S.L.; Saykin, A.J.; et al. A large scale multivariate parallel ICA method reveals novel imaging–genetic relationships for Alzheimer’s disease in the ADNI cohort. NeuroImage 2012, 60, 1608–1621. [Google Scholar] [CrossRef]
- Kamboh, M.I.; The Alzheimer’s Disease Neuroimaging Initiative; Barmada, M.M.; Demirci, F.Y.; Minster, R.L.; Carrasquillo, M.M.; Pankratz, V.S.; Younkin, S.G.; Saykin, A.J.; Sweet, R.A.; et al. Genome-wide association analysis of age-at-onset in Alzheimer’s disease. Mol. Psychiatry 2012, 17, 1340–1346. [Google Scholar] [CrossRef]
- Chung, J.; Wang, X.; Maruyama, T.; Ma, Y.; Zhang, X.; Mez, J.; Sherva, R.; Takeyama, H.; Lunetta, K.L.; Farrer, L.A.; et al. Genome-wide association study of Alzheimer’s disease endophenotypes at prediagnosis stages. Alzheimer’s Dement. 2018, 14, 623–633. [Google Scholar] [CrossRef] [PubMed]
- Herold, C.; Hooli, B.V.; Mullin, K.; Liu, T.; Roehr, J.T.; Mattheisen, M.; Parrado, A.R.; Bertram, L.; Lange, C.; Tanzi, R.E. Family-based association analyses of imputed genotypes reveal genome-wide significant association of Alzheimer’s disease with OSBPL6, PTPRG, and PDCL. Mol. Psychiatry 2016, 21, 1608–1612. [Google Scholar] [CrossRef]
- Cummings, A.C.; Jiang, L.; Edwards, D.R.V.; McCauley, J.L.; Laux, R.; McFarland, L.L.; Fuzzell, D.; Knebusch, C.; Caywood, L.; Reinhart-Mercer, L.; et al. Genome-wide association and linkage study in the Amish detects a novel candidate late-onset Alzheimer disease gene. Ann. Hum. Genet. 2012, 76, 342–351. [Google Scholar] [CrossRef] [PubMed]
- Carrasquillo, M.M.; Zou, F.; Pankratz, V.S.; Wilcox, S.L.; Ma, L.; Walker, L.P.; Younkin, S.G.; Younkin, C.S.; Younkin, L.H.; Bisceglio, G.D.; et al. Genetic variation in PCDH11X is associated with susceptibility to late-onset Alzheimer’s disease. Nat. Genet. 2009, 41, 192–198. [Google Scholar] [CrossRef] [PubMed]
- Tosto, G.; Fu, H.; Vardarajan, B.N.; Lee, J.H.; Cheng, R.; Reyes-Dumeyer, D.; Lantigua, R.; Medrano, M.; Jimenez-Velazquez, I.Z.; Elkind, M.S.V.; et al. F-box/LRR -repeat protein 7 is genetically associated with Alzheimer’s disease. Ann. Clin. Transl. Neurol. 2015, 2, 810–820. [Google Scholar] [CrossRef]
- Pérez-Palma, E.; Bustos, B.I.; Villamán, C.F.; Alarcón, M.; Avila, M.E.; Ugarte, G.D.; Reyes, A.E.; Opazo, C.M.; De Ferrari, G.V.; The Alzheimer’s Disease Neuroimaging Initiative; et al. Overrepresentation of Glutamate Signaling in Alzheimer’s Disease: Network-Based Pathway Enrichment Using Meta-Analysis of Genome-Wide Association Studies. PLoS ONE 2014, 9, e95413. [Google Scholar] [CrossRef]
- Wang, X.; Lopez, O.; Sweet, R.A.; Becker, J.T.; DeKosky, S.T.; Barmada, M.M.; Feingold, E.C.; Demirci, F.Y.; Kamboh, M.I. Genetic Determinants of Survival in Patients with Alzheimer’s Disease. J. Alzheimer’s Dis. 2015, 45, 651–658. [Google Scholar] [CrossRef]
- Yashin, A.I.; Fang, F.; Kovtun, M.; Wu, D.; Duan, M.; Arbeev, K.; Akushevich, I.; Kulminski, A.; Culminskaya, I.; Zhbannikov, I.; et al. Hidden heterogeneity in Alzheimer’s disease: Insights from genetic association studies and other analyses. Exp. Gerontol. 2018, 107, 148–160. [Google Scholar] [CrossRef]
- Reiman, E.M.; Webster, J.A.; Myers, A.J.; Hardy, J.; Dunckley, T.; Zismann, V.L.; Joshipura, K.D.; Pearson, J.V.; Hu-Lince, D.; Huentelman, M.J.; et al. GAB2 Alleles Modify Alzheimer’s Risk in APOE ε4 Carriers. Neuron 2007, 54, 713–720. [Google Scholar] [CrossRef]
- Kim, S.; Swaminathan, S.; Shen, L.; Risacher, S.L.; Nho, K.; Foroud, T.; Shaw, L.M.; Trojanowski, J.Q.; Potkin, S.G.; Huentelman, M.J.; et al. Genome-wide association study of CSF biomarkers Abeta1-42, t-tau, and p-tau181p in the ADNI cohort. Neurol. 2010, 76, 69–79. [Google Scholar] [CrossRef]
- Kamboh, M.I.; for the Alzheimer’s Disease Neuroimaging Initiative; Demirci, F.Y.; Wang, X.; Minster, R.L.; Carrasquillo, M.M.; Pankratz, V.S.; Younkin, S.G.; Saykin, A.J.; Jun, G.; et al. Genome-wide association study of Alzheimer’s disease. Transl. Psychiatry 2012, 2, e117. [Google Scholar] [CrossRef] [PubMed]
- Stein, J.L.; Hua, X.; Morra, J.H.; Lee, S.; Hibar, D.P.; Ho, A.J.; Leow, A.D.; Toga, A.W.; Sul, J.H.; Kang, H.M.; et al. Genome-wide analysis reveals novel genes influencing temporal lobe structure with relevance to neurodegeneration in Alzheimer’s disease. NeuroImage 2010, 51, 542–554. [Google Scholar] [CrossRef] [PubMed]
- Martinelli-Boneschi, F.; Giacalone, G.; Magnani, G.; Biella, G.; Coppi, E.; Santangelo, R.; Brambilla, P.; Esposito, F.; Lupoli, S.; Clerici, F.; et al. Pharmacogenomics in Alzheimer’s disease: A genome-wide association study of response to cholinesterase inhibitors. Neurobiol. Aging 2013, 34, 1711.e7–1711.e13. [Google Scholar] [CrossRef] [PubMed]
- Bertram, L.; Lange, C.; Mullin, K.; Parkinson, M.; Hsiao, M.; Hogan, M.F.; Schjeide, B.M.; Hooli, B.; DiVito, J.; Ionita, I.; et al. Genome-wide Association Analysis Reveals Putative Alzheimer’s Disease Susceptibility Loci in Addition to APOE. Am. J. Hum. Genet. 2008, 83, 623–632. [Google Scholar] [CrossRef] [PubMed]
- Abraham, R.; Moskvina, V.; Sims, R.; Hollingworth, P.; Morgan, A.; Georgieva, L.; Dowzell, K.; Cichon, S.; Hillmer, A.M.; O’Donovan, M.C.; et al. A genome-wide association study for late-onset Alzheimer’s disease using DNA pooling. Bmc Med Genom. 2008, 1, 44. [Google Scholar] [CrossRef] [PubMed]
- Ramanan, V.K.; for the Alzheimer’s Disease Neuroimaging Initiative; Risacher, S.L.; Nho, K.; Kim, S.; Swaminathan, S.; Shen, L.; Foroud, T.M.; Hakonarson, H.; Huentelman, M.J.; et al. APOE and BCHE as modulators of cerebral amyloid deposition: A florbetapir PET genome-wide association study. Mol. Psychiatry 2014, 19, 351–357. [Google Scholar] [CrossRef]
- Jonsson, T.; Stefansson, H.; Steinberg, S.; Jonsdottir, I.; Jonsson, P.V.; Snaedal, J.; Bjornsson, S.; Huttenlocher-Moser, J.; Levey, A.I.; Lah, J.J.; et al. Variant of TREM2 Associated with the Risk of Alzheimer’s Disease. New Engl. J. Med. 2013, 368, 107–116. [Google Scholar] [CrossRef]
- Lee, E.; Giovanello, K.S.; Saykin, A.J.; Xie, F.; Kong, D.; Wang, Y.; Yang, L.; Ibrahim, J.G.; Doraiswamy, P.M.; Zhu, H.; et al. Single-nucleotide polymorphisms are associated with cognitive decline at Alzheimer’s disease conversion within mild cognitive impairment patients. Alzheimer’s Dement. Diagn. Assess. Dis. Monit. 2017, 8, 86–95. [Google Scholar] [CrossRef]
- Marioni, R.E.; Harris, S.E.; Zhang, Q.; McRae, A.F.; Hagenaars, S.P.; Hill, W.D.; Davies, G.; Ritchie, C.W.; Gale, C.R.; Starr, J.M.; et al. GWAS on family history of Alzheimer’s disease. Transl. Psychiatry 2018, 8, 1–7. [Google Scholar] [CrossRef]
- Traylor, M.; Adib-Samii, P.; Harold, D.; Dichgans, M.; Williams, J.; Lewis, C.M.; Dm, H.S.M.; Fornage, M.; Holliday, E.G.; Sharma, P.; et al. Shared genetic contribution to ischemic stroke and Alzheimer’s disease. Ann. Neurol. 2016, 79, 739–747. [Google Scholar] [CrossRef]
- Furney, S.J.; Alzheimer’s Disease Neuroimaging on behalf of the Alzheimer’s Disease Neuroimaging Initiative and the AddNeuroMed Consortium; Simmons, A.N.; Breen, G.; Pedroso, I.; Lunnon, K.; Proitsi, P.; Hodges, A.; Powell, J.; Wahlund, L.-O.; et al. Genome-wide association with MRI atrophy measures as a quantitative trait locus for Alzheimer’s disease. Mol. Psychiatry 2011, 16, 1130–1138. [Google Scholar] [CrossRef] [PubMed]
- Hirano, A.; Ohara, T.; Takahashi, A.; Aoki, M.; Fuyuno, Y.; Ashikawa, K.; Morihara, T.; Takeda, M.; Kamino, K.; Oshima, E.; et al. A genome-wide association study of late-onset Alzheimer’s disease in a Japanese population. Psychiatr. Genet. 2015, 25, 139–146. [Google Scholar] [CrossRef] [PubMed]
- Wijsman, E.M.; Pankratz, N.D.; Choi, Y.; Rothstein, J.H.; Faber, K.M.; Cheng, R.; Lee, J.H.; Bird, T.D.; Bennett, D.A.; Diaz-Arrastia, R.; et al. Genome-Wide Association of Familial Late-Onset Alzheimer’s Disease Replicates BIN1 and CLU and Nominates CUGBP2 in Interaction with APOE. Plos Genet. 2011, 7, e1001308. [Google Scholar] [CrossRef] [PubMed]
- Kauwe, J.S.K.; Bailey, M.H.; Ridge, P.G.; Perry, R.; Wadsworth, M.E.; Hoyt, K.L.; Staley, L.A.; Karch, C.M.; Harari, O.; Cruchaga, C.; et al. Genome-Wide Association Study of CSF Levels of 59 Alzheimer’s Disease Candidate Proteins: Significant Associations with Proteins Involved in Amyloid Processing and Inflammation. Plos Genet. 2014, 10, e1004758. [Google Scholar] [CrossRef]
- Deming, Y.; Xia, J.; Cai, Y.; Lord, J.; Holmans, P.; Bertelsen, S.; Holtzman, D.; Morris, J.C.; Bales, K.; Pickering, E.H.; et al. A potential endophenotype for Alzheimer’s disease: Cerebrospinal fluid clusterin. Neurobiol. Aging 2015, 37, 208.e1–208.e9. [Google Scholar] [CrossRef]
- Webster, J.A.; Myers, A.J.; Pearson, J.V.; Craig, D.W.; Hu-Lince, D.; Coon, K.D.; Zismann, V.L.; Beach, T.; Leung, D.G.; Bryden, L.; et al. Sorl1 as an Alzheimer’s Disease Predisposition Gene? Neurodegener. Dis. 2007, 5, 60–64. [Google Scholar] [CrossRef]
- Mukherjee, S.; EPAD Study Group; Mez, J.; Trittschuh, E.H.; Saykin, A.J.; Gibbons, L.E.; Fardo, D.W.; Wessels, M.; Bauman, J.; Moore, M.; et al. Genetic data and cognitively defined late-onset Alzheimer’s disease subgroups. Mol. Psychiatry 2020, 25, 2942–2951. [Google Scholar] [CrossRef]
- Antúnez, C.; Boada, M.; González-Pérez, A.; Gayán, J.; Ramirez-Lorca, R.; Marin, J.; Hernandez, I.; Moreno-Rey, C.; Morón, F.J.; López-Arrieta, J.; et al. The membrane-spanning 4-domains, subfamily A (MS4A) gene cluster contains a common variant associated with Alzheimer’s disease. Genome Med. 2011, 3, 33. [Google Scholar] [CrossRef]
- Lambert, J.-C.; the European Alzheimer’s Disease Initiative Investigators; Heath, S.; Even, G.; Campion, D.; Sleegers, K.; O Hiltunen, M.; Combarros, O.; Zelenika, D.; Bullido, M.J.; et al. Genome-wide association study identifies variants at CLU and CR1 associated with Alzheimer’s disease. Nat. Genet. 2009, 41, 1094–1099. [Google Scholar] [CrossRef]
- Li, H.; Wetten, S.; Li, L.; Jean, P.L.S.; Upmanyu, R.; Surh, L.; Hosford, D.; Barnes, M.R.; Briley, J.D.; Borrie, M.; et al. Candidate Single-Nucleotide Polymorphisms From a Genomewide Association Study of Alzheimer Disease. Arch. Neurol. 2008, 65, 45–53. [Google Scholar] [CrossRef]
- Miyashita, A.; Koike, A.; Jun, G.R.; Wang, L.-S.; Takahashi, S.; Matsubara, E.; Kawarabayashi, T.; Shoji, M.; Tomita, N.; Arai, H.; et al. SORL1 Is Genetically Associated with Late-Onset Alzheimer’s Disease in Japanese, Koreans and Caucasians. PLoS ONE 2013, 8, e58618. [Google Scholar] [CrossRef]
- Cruchaga, C.; Kauwe, J.S.; Harari, O.; Jin, S.C.; Cai, Y.; Karch, C.M.; Benitez, B.A.; Jeng, A.T.; Skorupa, T.; Carrell, D.; et al. GWAS of Cerebrospinal Fluid Tau Levels Identifies Risk Variants for Alzheimer’s Disease. Neuron 2013, 78, 256–268. [Google Scholar] [CrossRef] [PubMed]
- Reitz, C.; Jun, G.; Naj, A.; Rajbhandary, R.; Vardarajan, B.N.; Wang, L.-S.; Valladares, O.; Lin, C.-F.; Larson, E.B.; Graff-Radford, N.R.; et al. Variants in the ATP-Binding Cassette Transporter (ABCA7), Apolipoprotein E ϵ4, and the Risk of Late-Onset Alzheimer Disease in African Americans. JAMA 2013, 309, 1483–1492. [Google Scholar] [CrossRef] [PubMed]
- Hollingworth, P.; the GERAD Consortium; Sweet, R.A.; Sims, R.; Harold, D.; Russo, G.; Abraham, R.T.; Stretton, A.; Jones, N.; Gerrish, A.; et al. Genome-wide association study of Alzheimer’s disease with psychotic symptoms. Mol. Psychiatry 2012, 17, 1316–1327. [Google Scholar] [CrossRef]
- Seshadri, S.; Fitzpatrick, A.L.; Ikram, M.A.; DeStefano, A.L.; Gudnason, V.; Boada, M.; Bis, J.C.; Smith, A.V.; Carassquillo, M.M.; Lambert, J.C.; et al. Genome-wide Analysis of Genetic Loci Associated With Alzheimer Disease. JAMA 2010, 303, 1832–1840. [Google Scholar] [CrossRef]
- Gusareva, E.S.; Twizere, J.-C.; Sleegers, K.; Dourlen, P.; Abisambra, J.F.; Meier, S.; Cloyd, R.; Weiss, B.; Dermaut, B.; Bessonov, K.; et al. Male-specific epistasis between WWC1 and TLN2 genes is associated with Alzheimer’s disease. Neurobiol. Aging 2018, 72, 188.e3–188.e12. [Google Scholar] [CrossRef]
- Coon, K.D.; Myers, A.J.; Craig, D.W.; Webster, J.A.; Pearson, J.V.; Lince, D.H.; Zismann, V.L.; Beach, T.G.; Leung, D.; Bryden, L.; et al. A High-Density Whole-Genome Association Study Reveals That APOE Is the Major Susceptibility Gene for Sporadic Late-Onset Alzheimer’s Disease. J. Clin. Psychiatry 2007, 68, 613–618. [Google Scholar] [CrossRef]
- Nelson, P.T.; Alzheimer’ Disease Genetic Consortium; Estus, S.; Abner, E.L.; Parikh, I.; Malik, M.; Neltner, J.H.; Ighodaro, E.; Wang, W.-X.; Wilfred, B.R.; et al. ABCC9 gene polymorphism is associated with hippocampal sclerosis of aging pathology. Acta Neuropathol. 2014, 127, 825–843. [Google Scholar] [CrossRef]
- Jansen, I.E.; Savage, J.E.; Watanabe, K.; Bryois, J.; Williams, D.M.; Steinberg, S.; Sealock, J.; Karlsson, I.K.; Hagg, S.; Athanasiu, L.; et al. Genome-wide meta-analysis identifies new loci and functional pathways influencing Alzheimer’s disease risk. Nat. Genet. 2019, 51, 404–413. [Google Scholar] [CrossRef]
- Moreno-Grau, S.; De Rojas, I.; Hernández, I.; Quintela, I.; Montrreal, L.; Alegret, M.; Hernández-Olasagarre, B.; Madrid, L.; González-Perez, A.; Maroñas, O.; et al. Genome-wide association analysis of dementia and its clinical endophenotypes reveal novel loci associated with Alzheimer’s disease and three causality networks: The GR@ACE project. Alzheimer’s Dement. 2019, 15, 1333–1347. [Google Scholar] [CrossRef]
- Schott, J.M.; Crutch, S.J.; Carrasquillo, M.M.; Uphill, J.; Shakespeare, T.J.; Ryan, N.S.; Yong, K.X.; Lehmann, M.; Ertekin-Taner, N.; Graff-Radford, N.R.; et al. Genetic risk factors for the posterior cortical atrophy variant of Alzheimer’s disease. Alzheimer’s Dement. 2016, 12, 862–871. [Google Scholar] [CrossRef] [PubMed]
- Ramirez, A.; Van Der Flier, W.M.; Herold, C.; Ramonet, D.; Heilmann-Heimbach, S.; Lewczuk, P.; Popp, J.; Lacour, A.; Drichel, D.; Louwersheimer, E.; et al. SUCLG2 identified as both a determinator of CSF Aβ1-42 levels and an attenuator of cognitive decline in Alzheimer’s disease. Hum. Mol. Genet. 2014, 23, 6644–6658. [Google Scholar] [CrossRef] [PubMed][Green Version]
- Jun, G.R.; Chung, J.; Mez, J.; Barber, R.; Beecham, G.W.; Bennett, D.A.; Buxbaum, J.D.; Byrd, G.S.; Carrasquillo, M.M.; Crane, P.K.; et al. Transethnic genome-wide scan identifies novel Alzheimer’s disease loci. Alzheimer’s Dement. 2017, 13, 727–738. [Google Scholar] [CrossRef] [PubMed]
- Harold, D.; Abraham, R.; Hollingworth, P.; Sims, R.; Gerrish, A.; Hamshere, M.L.; Pahwa, J.S.; Moskvina, V.; Dowzell, K.; Williams, A.; et al. Genome-wide association study identifies variants at CLU and PICALM associated with Alzheimer’s disease. Nat. Genet. 2009, 41, 1088–1093. [Google Scholar] [CrossRef]
- Lambert, J.-C.; Grenier-Boley, B.; Harold, D.; Zelenika, D.; Chouraki, V.; Kamatani, Y.; Sleegers, K.; A Ikram, M.; Hiltunen, M.; Reitz, C.; et al. Genome-wide haplotype association study identifies the FRMD4A gene as a risk locus for Alzheimer’s disease. Mol. Psychiatry 2013, 18, 461–470. [Google Scholar] [CrossRef]
- Jun, G.; IGAP Consortium; Ibrahim-Verbaas, C.A.; Vronskaya, M.; Lambert, J.-C.; Chung, J.; Naj, A.C.; Kunkle, B.W.; Wang, L.-S.; Bisceglio, G.; et al. A novel Alzheimer disease locus located near the gene encoding tau protein. Mol. Psychiatry 2016, 21, 108–117. [Google Scholar] [CrossRef]
- Hollingworth, P.; Harold, D.; Sims, R.; Gerrish, A.; Lambert, J.-C.; Carrasquillo, M.M.; Abraham, R.; Hamshere, M.L.; Pahwa, J.S.; Moskvina, V.; et al. Common variants at ABCA7, MS4A6A/MS4A4E, EPHA1, CD33 and CD2AP are associated with Alzheimer’s disease. Nat. Genet. 2011, 43, 429–435. [Google Scholar] [CrossRef]
- Heinzen, E.L.; Need, A.C.; Hayden, K.M.; Chiba-Falek, O.; Roses, A.D.; Strittmatter, W.J.; Burke, J.R.; Hulette, C.M.; Welsh-Bohmer, K.A.; Goldstein, D.B. Genome-Wide Scan of Copy Number Variation in Late-Onset Alzheimer’s Disease. J. Alzheimer’s Dis. 2010, 19, 69–77. [Google Scholar] [CrossRef]
- Naj, A.C.; Jun, G.; Beecham, G.W.; Wang, L.-S.; Vardarajan, B.N.; Buros, J.; Gallins, P.J.; Buxbaum, J.D.; Jarvik, G.P.; Crane, P.K.; et al. Common variants at MS4A4/MS4A6E, CD2AP, CD33 and EPHA1 are associated with late-onset Alzheimer’s disease. Nat. Genet. 2011, 43, 436–441. [Google Scholar] [CrossRef]
- Lambert, J.-C.; European Alzheimer’s Disease Initiative (EADI); Ibrahim-Verbaas, C.A.; Harold, D.; Naj, A.C.; Sims, R.; Bellenguez, C.; Jun, G.; DeStefano, A.L.; Bis, J.C.; et al. Meta-analysis of 74,046 individuals identifies 11 new susceptibility loci for Alzheimer’s disease. Nat. Genet. 2013, 45, 1452–1458. [Google Scholar] [CrossRef]
- Chung, S.J.; Armasu, S.M.; Biernacka, J.M.; Anderson, K.J.; Lesnick, T.G.; Rider, D.N.; Cunningham, J.M.; Ahlskog, J.E.; Frigerio, R.; Maraganore, D.M. Genomic determinants of motor and cognitive outcomes in Parkinson’s disease. Park. Relat. Disord. 2012, 18, 881–886. [Google Scholar] [CrossRef] [PubMed][Green Version]
- Wallen, Z.D.; Chen, H.; Hill-Burns, E.M.; Factor, S.A.; Zabetian, C.P.; Payami, H. Plasticity-related gene 3 (LPPR1) and age at diagnosis of Parkinson disease. Neurol. Genet. 2018, 4, e271. [Google Scholar] [CrossRef] [PubMed]
- Hu, Y.; Deng, L.; Zhang, J.; Fang, X.; Mei, P.; Cao, X.; Lin, J.; Wei, Y.; Zhang, X.; Xu, R. A Pooling Genome-Wide Association Study Combining a Pathway Analysis for Typical Sporadic Parkinson’s Disease in the Han Population of Chinese Mainland. Mol. Neurobiol. 2016, 53, 4302–4318. [Google Scholar] [CrossRef] [PubMed]
- Pickrell, J.K.; Berisa, T.; Liu, J.Z.; Ségurel, L.; Tung, J.Y.; A Hinds, D. Detection and interpretation of shared genetic influences on 42 human traits. Nat. Genet. 2016, 48, 709–717. [Google Scholar] [CrossRef]
- A Nalls, M.; Plagnol, V.; Hernandez, D.G.; Sharma, M.; Sheerin, U.-M.; Saad, M.H.F.; Simonsanchez, J.; Schulte, C.; Lesage, S.; Sveinbjornsdottir, S.; et al. Imputation of sequence variants for identification of genetic risks for Parkinson’s disease: A meta-analysis of genome-wide association studies. Lancet 2011, 377, 641–649. [Google Scholar] [CrossRef]
- Hamza, T.H.; Zabetian, C.P.; Tenesa, A.; Laederach, A.; Montimurro, J.; Yearout, D.; Kay, D.M.; Doheny, K.F.; Paschall, J.; Pugh, E.; et al. Common genetic variation in the HLA region is associated with late-onset sporadic Parkinson’s disease. Nat. Genet. 2010, 42, 781–785. [Google Scholar] [CrossRef]
- Maraganore, D.M.; De Andrade, M.; Lesnick, T.G.; Strain, K.J.; Farrer, M.J.; Rocca, W.A.; Pant, P.V.K.; Frazer, K.A.; Cox, D.R.; Ballinger, D.G. High-Resolution Whole-Genome Association Study of Parkinson Disease. Am. J. Hum. Genet. 2005, 77, 685–693. [Google Scholar] [CrossRef]
- Fung, H.-C.; Scholz, S.; Matarin, M.; Simón-Sánchez, J.; Hernandez, D.; Britton, A.; Gibbs, J.R.; Langefeld, C.; Stiegert, M.L.; Schymick, J.; et al. Genome-wide genotyping in Parkinson’s disease and neurologically normal controls: First stage analysis and public release of data. Lancet Neurol. 2006, 5, 911–916. [Google Scholar] [CrossRef]
- Naj, A.C.; Beecham, G.W.; Martin, E.R.; Gallins, P.J.; Powell, E.H.; Konidari, I.; Whitehead, P.L.; Cai, G.; Haroutunian, V.; Scott, W.K.; et al. Dementia Revealed: Novel Chromosome 6 Locus for Late-Onset Alzheimer Disease Provides Genetic Evidence for Folate-Pathway Abnormalities. Plos Genet. 2010, 6, e1001130. [Google Scholar] [CrossRef]
- Satake, W.; Nakabayashi, Y.; Mizuta, I.; Hirota, Y.; Ito, C.; Kubo, M.; Kawaguchi, T.; Tsunoda, T.; Watanabe, M.; Takeda, A.; et al. Genome-wide association study identifies common variants at four loci as genetic risk factors for Parkinson’s disease. Nat. Genet. 2009, 41, 1303–1307. [Google Scholar] [CrossRef]
- Pankratz, N.; Wilk, J.B.; Latourelle, J.C.; DeStefano, A.L.; Halter, C.; Pugh, E.W.; Doheny, K.F.; Gusella, J.F.; Nichols, W.C.; Foroud, T.; et al. Genomewide association study for susceptibility genes contributing to familial Parkinson disease. Qual. Life Res. 2009, 124, 593–605. [Google Scholar] [CrossRef]
- Do, C.B.; Tung, J.Y.; Dorfman, E.; Kiefer, A.K.; Drabant, E.M.; Francke, U.; Mountain, J.L.; Goldman, S.M.; Tanner, C.M.; Langston, J.W.; et al. Web-Based Genome-Wide Association Study Identifies Two Novel Loci and a Substantial Genetic Component for Parkinson’s Disease. PLoS Genet. 2011, 7, e1002141. [Google Scholar] [CrossRef]
- Liu, X.; Cheng, R.; Verbitsky, M.; Kisselev, S.; Browne, A.; Mejia-Sanatana, H.; Louis, E.D.; Cote, L.J.; Andrews, H.F.; Waters, C.H.; et al. Genome-Wide association study identifies candidate genes for Parkinson’s disease in an Ashkenazi Jewish population. Bmc Med Genet. 2011, 12, 104. [Google Scholar] [CrossRef] [PubMed]
- Hill-Burns, E.M.; Wissemann, W.T.; Hamza, T.H.; Factor, S.A.; Zabetian, C.P.; Payami, H. Identification of a novel Parkinson’s disease locus via stratified genome-wide association study. Bmc Genom. 2014, 15, 118. [Google Scholar] [CrossRef] [PubMed]
- Davis, M.F.; Cummings, A.C.; D’Aoust, L.N.; Jiang, L.; Edwards, D.R.V.; Laux, R.; Reinhart-Mercer, L.; Fuzzell, D.; Scott, W.K.; Pericak-Vance, M.A.; et al. Parkinson disease loci in the mid-western Amish. Qual. Life Res. 2013, 132, 1213–1221. [Google Scholar] [CrossRef] [PubMed]
- Biernacka, J.M.; Chung, S.J.; Armasu, S.M.; Anderson, K.S.; Lill, C.M.; Bertram, L.; Ahlskog, J.; Brighina, L.; Frigerio, R.; Maraganore, D.M. Genome-wide gene-environment interaction analysis of pesticide exposure and risk of Parkinson’s disease. Park. Relat. Disord. 2016, 32, 25–30. [Google Scholar] [CrossRef] [PubMed]
- Chang, D.; Nalls, M.A.; Hallgrímsdóttir, I.B.; Hunkapiller, J.; Van Der Brug, M.; Cai, F.; Kerchner, G.A.; Ayalon, G.; Bingol, B.; Sheng, M.; et al. A meta-analysis of genome-wide association studies identifies 17 new Parkinson’s disease risk loci. Nat. Genet. 2017, 49, 1511–1516. [Google Scholar] [CrossRef] [PubMed]
- Hill-Burns, E.M.; Ross, O.A.; Wissemann, W.T.; Soto-Ortolaza, A.I.; Zareparsi, S.; Siuda, J.; Lynch, T.; Wszolek, Z.K.; Silburn, P.A.; Mellick, G.D.; et al. Identification of genetic modifiers of age-at-onset for familial Parkinson’s disease. Hum. Mol. Genet. 2016, 25, 3849–3862. [Google Scholar] [CrossRef] [PubMed]
- Saad, M.; Lesage, S.; Saint-Pierre, A.; Corvol, J.-C.; Zelenika, D.; Lambert, J.-C.; Vidailhet, M.; Mellick, G.D.; Lohmann, E.; Durif, F.; et al. Genome-wide association study confirms BST1 and suggests a locus on 12q24 as the risk loci for Parkinson’s disease in the European population. Hum. Mol. Genet. 2010, 20, 615–627. [Google Scholar] [CrossRef]
- Logue, M.W.; Schu, M.; Vardarajan, B.N.; Buros, J.; Green, R.C.; Go, R.C.P.; Griffith, P.; Obisesan, T.O.; Shatz, R.; Borenstein, A.; et al. A Comprehensive Genetic Association Study of Alzheimer Disease in African Americans. Arch. Neurol. 2011, 68, 1569–1579. [Google Scholar] [CrossRef]
- Pankratz, N.; Beecham, G.W.; DeStefano, A.L.; Dawson, T.M.; Doheny, K.F.; Do, S.A.F.; Hamza, T.H.; Hung, A.Y.; Hyman, B.T.; Ivinson, A.J.; et al. Meta-analysis of Parkinson’s Disease: Identification of a novel locus, RIT2. Ann. Neurol. 2012, 71, 370–384. [Google Scholar] [CrossRef] [PubMed]
- Vacic, V.; Ozelius, L.J.; Clark, L.N.; Bar-Shira, A.; Gana-Weisz, M.; Gurevich, T.; Gusev, A.; Kedmi, M.; Kenny, E.E.; Liu, X.; et al. Genome-wide mapping of IBD segments in an Ashkenazi PD cohort identifies associated haplotypes. Hum. Mol. Genet. 2014, 23, 4693–4702. [Google Scholar] [CrossRef] [PubMed]
- Foo, J.N.; Tan, L.C.; Irwan, I.D.; Au, W.-L.; Low, H.Q.; Prakash, K.-M.; Annuar, A.A.; Bei, J.; Chan, A.Y.; Chen, C.-M.; et al. Genome-wide association study of Parkinson’s disease in East Asians. Hum. Mol. Genet. 2016, 26, 226–232. [Google Scholar] [CrossRef] [PubMed]
- Beecham, G.W.; Dickson, D.W.; Scott, W.K.; Martin, E.R.; Schellenberg, G.; Nuytemans, K.; Larson, E.B.; Buxbaum, J.; Trojanowski, J.Q.; Van Deerlin, V.M.; et al. PARK10 is a major locus for sporadic neuropathologically confirmed Parkinson disease. Neurology 2015, 84, 972–980. [Google Scholar] [CrossRef]
- Simón-Sánchez, J.; Schulte, C.; Bras, J.M.; Sharma, M.; Gibbs, J.R.; Berg, D.; Paisan-Ruiz, C.; Lichtner, P.; Scholz, S.W.; Hernandez, D.G.; et al. Genome-wide association study reveals genetic risk underlying Parkinson’s disease. Nat. Genet. 2009, 41, 1308–1312. [Google Scholar] [CrossRef]
- Nalls, M.A.; Blauwendraat, C.; Vallerga, C.L.; Heilbron, K.; Bandres-Ciga, S.; Chang, D.; Tan, M.X.; A Kia, D.; Noyce, A.J.; Xue, A.; et al. Identification of novel risk loci, causal insights, and heritable risk for Parkinson’s disease: A meta-analysis of genome-wide association studies. Lancet Neurol. 2019, 18, 1091–1102. [Google Scholar] [CrossRef]
- Blauwendraat, C.; Reed, X.; Krohn, L.; Heilbron, K.; Bandres-Ciga, S.; Tan, M.; Gibbs, J.R.; Hernandez, D.G.; Kumaran, R.; Langston, R.; et al. Genetic modifiers of risk and age at onset in GBA associated Parkinson’s disease and Lewy body dementia. Brain 2020, 143, 234–248. [Google Scholar] [CrossRef]
- The UK Parkinson’s Disease Consortium and The Wellcome Trust Case Control Consortium, 2; Spencer, C.C.; Plagnol, V.; Strange, A.; Gardner, M.; Paisan-Ruiz, C.; Band, G.; Barker, R.A.; Bellenguez, C.; Bhatia, K.; et al. Dissection of the genetics of Parkinson’s disease identifies an additional association 5′ of SNCA and multiple associated haplotypes at 17q21. Hum. Mol. Genet. 2010, 20, 345–353. [Google Scholar] [CrossRef]
- Lill, C.M.; Roehr, J.T.; McQueen, M.B.; Kavvoura, F.K.; Bagade, S.; Schjeide, B.-M.M.; Schjeide, L.M.; Meissner, E.; Zauft, U.; Allen, N.C.; et al. Comprehensive Research Synopsis and Systematic Meta-Analyses in Parkinson’s Disease Genetics: The PDGene Database. Plos Genet. 2012, 8, e1002548. [Google Scholar] [CrossRef]
- Blauwendraat, C.; Heilbron, K.; Msc, C.L.V.; Bandres-Ciga, S.; Von Coelln, R.; Pihlstrøm, L.; Simón-Sánchez, J.; Schulte, C.; Sharma, M.; Msc, L.K.; et al. Parkinson’s disease age at onset genome-wide association study: Defining heritability, genetic loci, and α-synuclein mechanisms. Mov. Disord. 2019, 34, 866–875. [Google Scholar] [CrossRef]
- Hu, X.; Pickering, E.; Liu, Y.C.; Hall, S.; Fournier, H.; Katz, E.; DeChairo, B.; John, S.; Van Eerdewegh, P.; Soares, H.; et al. Meta-Analysis for Genome-Wide Association Study Identifies Multiple Variants at the BIN1 Locus Associated with Late-Onset Alzheimer’s Disease. PLoS ONE 2011, 6, e16616. [Google Scholar] [CrossRef] [PubMed]
- A Nalls, M.; Pankratz, N.; Lill, C.M.; Do, C.B.; Hernandez, D.G.; Saad, M.; DeStefano, A.L.; Kara, E.; Bras, J.; Sharma, M.; et al. Large-scale meta-analysis of genome-wide association data identifies six new risk loci for Parkinson’s disease. Nat. Genet. 2014, 46, 989–993. [Google Scholar] [CrossRef] [PubMed]
- Ciga, S.B.; Ahmed, S.; Sabir, M.S.; Blauwendraat, C.; Adarmes-Gómez, A.D.; Msc, I.B.; Msc, M.B.; Msc, D.B.; Carrillo, F.; Msc, M.C.; et al. The Genetic Architecture of Parkinson Disease in Spain: Characterizing Population-Specific Risk, Differential Haplotype Structures, and Providing Etiologic Insight. Mov. Disord. 2019, 34, 1851–1863. [Google Scholar] [CrossRef]
- Pottier, C.; Zhou, X.; Perkerson, R.B.; Baker, M.; Jenkins, G.D.; Serie, D.J.; Ghidoni, R.; Benussi, L.; Binetti, G.; De Munain, A.L.; et al. Potential genetic modifiers of disease risk and age at onset in patients with frontotemporal lobar degeneration and GRN mutations: A genome-wide association study. Lancet Neurol. 2018, 17, 548–558. [Google Scholar] [CrossRef]
- Chao, M.J.; Kim, K.-H.; Shin, J.W.; Lucente, D.; Wheeler, V.C.; Li, H.; Roach, J.C.; Hood, L.; Wexler, N.S.; Jardim, L.B.; et al. Population-specific genetic modification of Huntington’s disease in Venezuela. Plos Genet. 2018, 14, e1007274. [Google Scholar] [CrossRef]
- Moss, D.J.H.; Pardiñas, A.F.; Langbehn, D.; Lo, K.; Leavitt, B.R.; Roos, R.A.; Durr, A.; Mead, S.; Holmans, P.; Jones, L.; et al. Identification of genetic variants associated with Huntington’s disease progression: A genome-wide association study. Lancet Neurol. 2017, 16, 701–711. [Google Scholar] [CrossRef]
- Cronin, S.; Tomik, B.; Bradley, D.G.; Slowik, A.; Hardiman, O. Screening for replication of genome-wide SNP associations in sporadic ALS. Eur. J. Hum. Genet. 2008, 17, 213–218. [Google Scholar] [CrossRef]
- Chen, C.-J.; Chen, C.-M.; Pai, T.-W.; Chang, H.-T.; Hwang, C.-S. A genome-wide association study on amyotrophic lateral sclerosis in the Taiwanese Han population. Biomark. Med. 2016, 10, 597–611. [Google Scholar] [CrossRef]
- McLaughlin, R.L.; Kenna, K.P.; Vajda, A.; Bede, P.; Elamin, M.; Cronin, S.; Donaghy, C.G.; Bradley, D.G.; Hardiman, O. A second-generation Irish genome-wide association study for amyotrophic lateral sclerosis. Neurobiol. Aging 2015, 36, 1221.e7–1221.e13. [Google Scholar] [CrossRef]
- Schymick, J.C.; Scholz, S.W.; Fung, H.-C.; Britton, A.; Arepalli, S.; Gibbs, J.R.; Lombardo, F.; Matarin, M.; Kasperaviciute, D.; Hernandez, D.G.; et al. Genome-wide genotyping in amyotrophic lateral sclerosis and neurologically normal controls: First stage analysis and public release of data. Lancet Neurol. 2007, 6, 322–328. [Google Scholar] [CrossRef]
- Cronin, S.; Berger, S.; Ding, J.; Schymick, J.C.; Washecka, N.; Hernandez, D.G.; Greenway, M.J.; Bradley, D.G.; Traynor, B.J.; Hardiman, O. A genome-wide association study of sporadic ALS in a homogenous Irish population. Hum. Mol. Genet. 2007, 17, 768–774. [Google Scholar] [CrossRef]
- Barrett, T.; Wilhite, S.E.; Ledoux, P.; Evangelista, C.; Kim, I.F.; Tomashevsky, M.; Marshall, K.A.; Phillippy, K.H.; Sherman, P.M.; Holko, M.; et al. NCBI GEO: Archive for functional genomics data sets—Update. Nucleic Acids Res. 2013, 41, D991–D995. [Google Scholar] [CrossRef] [PubMed]
- Papatheodorou, I.; Fonseca, N.A.; Keays, M.; Tang, Y.A.; Barrera, E.; Bazant, W.; Burke, M.; Füllgrabe, A.; Fuentes, A.M.-P.; George, N.; et al. Expression Atlas: Gene and protein expression across multiple studies and organisms. Nucleic Acids Res. 2018, 46, D246–D251. [Google Scholar] [CrossRef] [PubMed]
- Berchtold, N.C.; Coleman, P.D.; Cribbs, D.H.; Rogers, J.; Gillen, D.L.; Cotman, C.W. Synaptic genes are extensively downregulated across multiple brain regions in normal human aging and Alzheimer’s disease. Neurobiol. Aging 2013, 34, 1653–1661. [Google Scholar] [CrossRef] [PubMed]
- Hokama, M.; Oka, S.; Leon, J.; Ninomiya, T.; Honda, H.; Sasaki, K.; Iwaki, T.; Ohara, T.; Sasaki, T.; LaFerla, F.M.; et al. Altered Expression of Diabetes-Related Genes in Alzheimer’s Disease Brains: The Hisayama Study. Cereb. Cortex 2014, 24, 2476–2488. [Google Scholar] [CrossRef]
- Stopa, E.G.; Tanis, K.Q.; Miller, M.C.; Nikonova, E.V.; Podtelezhnikov, A.A.; Finney, E.M.; Stone, D.J.; Camargo, L.M.; Parker, L.; Verma, A.; et al. Comparative transcriptomics of choroid plexus in Alzheimer’s disease, frontotemporal dementia and Huntington’s disease: Implications for CSF homeostasis. Fluids Barriers Cns 2018, 15, 1–10. [Google Scholar] [CrossRef]
- Simunovic, F.; Yi, M.; Wang, Y.; Macey, L.; Brown, L.T.; Krichevsky, A.M.; Andersen, S.L.; Stephens, R.M.; Benes, F.M.; Sonntag, K.-C. Gene expression profiling of substantia nigra dopamine neurons: Further insights into Parkinson’s disease pathology. Brain 2009, 132, 1795–1809. [Google Scholar] [CrossRef]
- Elstner, M.; Morris, C.M.; Heim, K.; Bender, A.; Mehta, D.; Jaros, E.; Klopstock, T.; Meitinger, T.; Turnbull, D.M.; Prokisch, H. Expression analysis of dopaminergic neurons in Parkinson’s disease and aging links transcriptional dysregulation of energy metabolism to cell death. Acta Neuropathol. 2011, 122, 75–86. [Google Scholar] [CrossRef]
- Riley, B.E.; Gardai, S.J.; Emig-Agius, D.; Bessarabova, M.; Ivliev, A.E.; Schüle, B.; Alexander, J.; Wallace, W.; Halliday, G.M.; Langston, J.W.; et al. Systems-Based Analyses of Brain Regions Functionally Impacted in Parkinson’s Disease Reveals Underlying Causal Mechanisms. PLoS ONE 2014, 9, e102909. [Google Scholar] [CrossRef]
- Dijkstra, A.A.; Ingrassia, A.; De Menezes, R.X.; Van Kesteren, R.E.; Rozemuller, A.J.M.; Heutink, P.; Van De Berg, W.D.J. Evidence for Immune Response, Axonal Dysfunction and Reduced Endocytosis in the Substantia Nigra in Early Stage Parkinson’s Disease. PLoS ONE 2015, 10, e0128651. [Google Scholar] [CrossRef]
- Dumitriu, A.; Latourelle, J.C.; Hadzi, T.C.; Pankratz, N.; Garza, D.; Miller, J.P.; Vance, J.M.; Foroud, T.; Beach, T.G.; Myers, R.H. Gene Expression Profiles in Parkinson Disease Prefrontal Cortex Implicate FOXO1 and Genes under Its Transcriptional Regulation. PLoS Genet. 2012, 8, e1002794. [Google Scholar] [CrossRef] [PubMed]
- Dumitriu, A.; Golji, J.; Labadorf, A.T.; Gao, B.; Beach, T.G.; Myers, R.H.; Longo, K.A.; Latourelle, J.C. Integrative analyses of proteomics and RNA transcriptomics implicate mitochondrial processes, protein folding pathways and GWAS loci in Parkinson disease. Bmc Med Genom. 2015, 9, 1–17. [Google Scholar] [CrossRef] [PubMed]
- Scherzer, C.R.; Eklund, A.C.; Morse, L.J.; Liao, Z.; Locascio, J.J.; Fefer, D.; Schwarzschild, M.A.; Schlossmacher, M.G.; Hauser, M.A.; Vance, J.M.; et al. Molecular markers of early Parkinson’s disease based on gene expression in blood. Proc. Natl. Acad. Sci. USA 2007, 104, 955–960. [Google Scholar] [CrossRef] [PubMed]
- Lesnick, T.G.; Papapetropoulos, S.; Mash, D.C.; Ffrench-Mullen, J.; Shehadeh, L.; De Andrade, M.; Henley, J.R.; A Rocca, W.; Ahlskog, J.E.; Maraganore, D.M. A Genomic Pathway Approach to a Complex Disease: Axon Guidance and Parkinson Disease. Plos Genet. 2007, 3, e98. [Google Scholar] [CrossRef]
- Zhang, Y.; James, M.; Middleton, F.A.; Davis, R.L. Transcriptional analysis of multiple brain regions in Parkinson’s disease supports the involvement of specific protein processing, energy metabolism, and signaling pathways, and suggests novel disease mechanisms. Am. J. Med Genet. Part B Neuropsychiatr. Genet. 2005, 137B, 5–16. [Google Scholar] [CrossRef] [PubMed]
- Blalock, E.M.; Geddes, J.W.; Chen, K.C.; Porter, N.M.; Markesbery, W.R.; Landfield, P.W. Incipient Alzheimer’s disease: Microarray correlation analyses reveal major transcriptional and tumor suppressor responses. Proc. Natl. Acad. Sci. USA 2004, 101, 2173–2178. [Google Scholar] [CrossRef]
- Calligaris, R.; Banica, M.; Roncaglia, P.; Robotti, E.; Finaurini, S.; Vlachouli, C.; Antonutti, L.; Iorio, F.; Carissimo, A.; Cattaruzza, T.; et al. Blood transcriptomics of drug-naïve sporadic Parkinson’s disease patients. Bmc Genom. 2015, 16, 1–14. [Google Scholar] [CrossRef]
- Ring, K.L.; An, M.C.; Zhang, N.; O’Brien, R.N.; Ramos, E.M.; Gao, F.; Atwood, R.; Bailus, B.J.; Melov, S.; Mooney, S.D.; et al. Genomic Analysis Reveals Disruption of Striatal Neuronal Development and Therapeutic Targets in Human Huntington’s Disease Neural Stem Cells. Stem Cell Rep. 2015, 5, 1023–1038. [Google Scholar] [CrossRef]
- Świtońska, K.; Szlachcic, W.J.; Handschuh, L.; Wojciechowski, P.; Marczak, Ł.; Stelmaszczuk, M.; Figlerowicz, M.; Figiel, M. Identification of Altered Developmental Pathways in Human Juvenile HD iPSC With 71Q and 109Q Using Transcriptome Profiling. Front. Cell. Neurosci. 2019, 12. [Google Scholar] [CrossRef]
- Al-Dalahmah, O.; Sosunov, A.A.; Shaik, A.; Ofori, K.; Liu, Y.; Vonsattel, J.P.; Adorjan, I.; Menon, V.; Goldman, J.E. Single-nucleus RNA-seq identifies Huntington disease astrocyte states. Acta Neuropathol. Commun. 2020, 8, 1–21. [Google Scholar] [CrossRef]
- Labadorf, A.; Hoss, A.G.; Lagomarsino, V.N.; Latourelle, J.C.; Hadzi, T.C.; Bregu, J.; Macdonald, M.E.; Gusella, J.F.; Chen, J.-F.; Akbarian, S.; et al. RNA Sequence Analysis of Human Huntington Disease Brain Reveals an Extensive Increase in Inflammatory and Developmental Gene Expression. PLoS ONE 2015, 10, e0143563. [Google Scholar] [CrossRef] [PubMed]
- Lin, L.; Park, J.W.; Ramachandran, S.; Zhang, Y.; Tseng, Y.-T.; Shen, S.; Waldvogel, H.J.; Curtis, M.A.; Faull, R.L.M.; Troncoso, J.C.; et al. Transcriptome sequencing reveals aberrant alternative splicing in Huntington’s disease. Hum. Mol. Genet. 2016, 25, 3454–3466. [Google Scholar] [CrossRef] [PubMed]
- Feyeux, M.; Bourgois-Rocha, F.; Redfern, A.; Giles, P.; Lefort, N.; Aubert, S.; Bonnefond, C.; Bugi, A.; Ruiz, M.; Deglon, N.; et al. Early transcriptional changes linked to naturally occurring Huntington’s disease mutations in neural derivatives of human embryonic stem cells. Hum. Mol. Genet. 2012, 21, 3883–3895. [Google Scholar] [CrossRef] [PubMed]
- The HD iPSC Consortium. Developmental alterations in Huntington’s disease neural cells and pharmacological rescue in cells and mice. Nat. Neurosci. 2017, 20, 648–660. [Google Scholar] [CrossRef]
- Lim, R.G.; Quan, C.; Reyes-Ortiz, A.M.; Lutz, S.E.; Kedaigle, A.J.; Gipson, T.A.; Wu, J.; Vatine, G.D.; Stocksdale, J.; Casale, M.S.; et al. Huntington’s Disease iPSC-Derived Brain Microvascular Endothelial Cells Reveal WNT-Mediated Angiogenic and Blood-Brain Barrier Deficits. Cell Rep. 2017, 19, 1365–1377. [Google Scholar] [CrossRef]
- Mehta, S.R.; Tom, C.M.; Wang, Y.; Bresee, C.; Rushton, D.; Mathkar, P.P.; Tang, J.; Mattis, V.B. Human Huntington’s Disease iPSC-Derived Cortical Neurons Display Altered Transcriptomics, Morphology, and Maturation. Cell Rep. 2018, 25, 1081–1096.e6. [Google Scholar] [CrossRef]
- Blalock, E.M.; Buechel, H.M.; Popovic, J.; Geddes, J.W.; Landfield, P.W. Microarray analyses of laser-captured hippocampus reveal distinct gray and white matter signatures associated with incipient Alzheimer’s disease. J. Chem. Neuroanat. 2011, 42, 118–126. [Google Scholar] [CrossRef]
- Cox, L.E.; Ferraiuolo, L.; Goodall, E.F.; Heath, P.R.; Higginbottom, A.; Mortiboys, H.; Hollinger, H.C.; Hartley, J.A.; Brockington, A.; Burness, C.E.; et al. Mutations in CHMP2B in Lower Motor Neuron Predominant Amyotrophic Lateral Sclerosis (ALS). PLoS ONE 2010, 5, e9872. [Google Scholar] [CrossRef]
- Otake, K.; Kamiguchi, H.; Hirozane, Y. Identification of biomarkers for amyotrophic lateral sclerosis by comprehensive analysis of exosomal mRNAs in human cerebrospinal fluid. Bmc Med. Genom. 2019, 12, 1–11. [Google Scholar] [CrossRef]
- Gagliardi, S.; Zucca, S.; Pandini, C.; Diamanti, L.; Bordoni, M.; Sproviero, D.; Arigoni, M.; Olivero, M.; Pansarasa, O.; Ceroni, M.; et al. Long non-coding and coding RNAs characterization in Peripheral Blood Mononuclear Cells and Spinal Cord from Amyotrophic Lateral Sclerosis patients. Sci. Rep. 2018, 8, 1–11. [Google Scholar] [CrossRef]
- Swindell, W.R.; Kruse, C.; List, E.O.; Berryman, D.E.; Kopchick, J.J. ALS blood expression profiling identifies new biomarkers, patient subgroups, and evidence for neutrophilia and hypoxia. J. Transl. Med. 2019, 17, 170. [Google Scholar] [CrossRef]
- Prudencio, M.; Belzil, V.V.; Batra, R.; Ross, C.A.; Gendron, T.F.; Pregent, L.J.; Murray, M.E.; Overstreet, K.K.; Piazza-Johnston, A.E.; Desaro, P.; et al. Distinct brain transcriptome profiles in C9orf72-associated and sporadic ALS. Nat. Neurosci. 2015, 18, 1175–1182. [Google Scholar] [CrossRef] [PubMed]
- Raman, R.; Allen, S.P.; Goodall, E.F.; Kramer, S.; Ponger, L.-L.; Heath, P.R.; Milo, M.; Hollinger, H.C.; Walsh, T.; Highley, J.R.; et al. Gene expression signatures in motor neurone disease fibroblasts reveal dysregulation of metabolism, hypoxia-response and RNA processing functions. Neuropathol. Appl. Neurobiol. 2015, 41, 201–226. [Google Scholar] [CrossRef] [PubMed]
- Kapeli, K.; Pratt, G.A.; Vu, A.Q.; Hutt, K.R.; Martinez, F.J.; Sundararaman, B.; Batra, R.; Freese, P.D.; Lambert, N.J.; Huelga, S.C.; et al. Distinct and shared functions of ALS-associated proteins TDP-43, FUS and TAF15 revealed by multisystem analyses. Nat. Commun. 2016, 7, 12143. [Google Scholar] [CrossRef] [PubMed]
- Dols-Icardo, O.; Montal, V.; Sirisi, S.S.; López-Pernas, G.; Cervera-Carles, L.; Querol-Vilaseca, M.; Munoz, L.; Belbin, O.; Alcolea, D.; Molina-Porcel, L.; et al. Characterization of the motor cortex transcriptome supports microgial-related key events in amyotrophic lateral sclerosis. Neurol. Neuroimmunol. Neuroinflamm. 2020, 7, e829. [Google Scholar] [CrossRef] [PubMed]
- Higginbotham, L.; Ping, L.; Dammer, E.B.; Duong, D.M.; Zhou, M.; Gearing, M.; Hurst, C.; Glass, J.D.; Factor, S.A.; Johnson, E.C.B.; et al. Integrated proteomics reveals brain-based cerebrospinal fluid biomarkers in asymptomatic and symptomatic Alzheimer’s disease. Sci. Adv. 2020, 6, eaaz9360. [Google Scholar] [CrossRef]
- Liang, W.S.; Dunckley, T.; Beach, T.G.; Grover, A.; Mastroeni, D.; Walker, D.G.; Caselli, R.J.; Kukull, W.A.; McKeel, D.; Morris, J.C.; et al. Gene expression profiles in anatomically and functionally distinct regions of the normal aged human brain. Physiol. Genom. 2007, 28, 311–322. [Google Scholar] [CrossRef]
- Magistri, M.; Velmeshev, D.; Makhmutova, M.; Faghihi, M.A. Transcriptomics Profiling of Alzheimer’s Disease Reveal Neurovascular Defects, Altered Amyloid-β Homeostasis, and Deregulated Expression of Long Noncoding RNAs. J. Alzheimer’s Dis. 2015, 48, 647–665. [Google Scholar] [CrossRef]
- Dunckley, T.; Beach, T.G.; Ramsey, K.E.; Grover, A.; Mastroeni, D.; Walker, D.G.; LaFleur, B.J.; Coon, K.D.; Brown, K.M.; Caselli, R.; et al. Gene expression correlates of neurofibrillary tangles in Alzheimer’s disease. Neurobiol. Aging 2006, 27, 1359–1371. [Google Scholar] [CrossRef]
- Scheckel, C.; Drapeau, E.; A Frias, M.; Park, C.Y.; Fak, J.; Zucker-Scharff, I.; Kou, Y.; Haroutunian, V.; Ma’Ayan, A.; Buxbaum, J.; et al. Regulatory consequences of neuronal ELAV-like protein binding to coding and non-coding RNAs in human brain. eLife 2016, 5, e10421. [Google Scholar] [CrossRef]
- Meyer, K.; Feldman, H.M.; Lu, T.; Drake, D.; Lim, E.T.; Ling, K.-H.; Bishop, N.A.; Pan, Y.; Seo, J.; Lin, Y.-T.; et al. REST and Neural Gene Network Dysregulation in iPSC Models of Alzheimer’s Disease. Cell Rep. 2019, 26, 1112–1127.e9. [Google Scholar] [CrossRef] [PubMed]
- Mathys, H.; Davila-Velderrain, J.; Peng, Z.; Gao, F.; Mohammadi, S.; Young, J.Z.; Menon, M.; He, L.; Abdurrob, F.; Jiang, X.; et al. Single-cell transcriptomic analysis of Alzheimer’s disease. Nat. Cell Biol. 2019, 570, 332–337. [Google Scholar] [CrossRef] [PubMed]
- Hondius, D.C.; Van Nierop, P.; Li, K.W.; Hoozemans, J.J.; Van Der Schors, R.C.; Van Haastert, E.S.; Van Der Vies, S.M.; Rozemuller, A.J.; Smit, A.B. Profiling the human hippocampal proteome at all pathologic stages of Alzheimer’s disease. Alzheimer’s Dement. 2016, 12, 654–668. [Google Scholar] [CrossRef] [PubMed]
- Rotunno, M.S.; Lane, M.; Zhang, W.; Wolf, P.; Oliva, P.; Viel, C.; Wills, A.-M.; Alcalay, R.N.; Scherzer, C.R.; Shihabuddin, L.S.; et al. Cerebrospinal fluid proteomics implicates the granin family in Parkinson’s disease. Sci. Rep. 2020, 10, 1–11. [Google Scholar] [CrossRef] [PubMed]
- Lachén-Montes, M.; González-Morales, A.; Iloro, I.; Elortza, F.; Ferrer, I.; Gveric, D.; Fernández-Irigoyen, J.; Santamaría, E. Unveiling the olfactory proteostatic disarrangement in Parkinson’s disease by proteome-wide profiling. Neurobiol. Aging 2019, 73, 123–134. [Google Scholar] [CrossRef] [PubMed]
- Van Dijk, K.D.; Berendse, H.W.; Drukarch, B.; Fratantoni, S.A.; Pham, T.V.; Piersma, S.R.; Huisman, E.; Brevé, J.J.P.; Groenewegen, H.J.; Jimenez, C.R.; et al. The Proteome of the Locus Ceruleus in Parkinson’s Disease: Relevance to Pathogenesis. Brain Pathol. 2012, 22, 485–498. [Google Scholar] [CrossRef]
- Umoh, M.E.; Dammer, E.B.; Dai, J.; Duong, D.M.; Lah, J.J.; I Levey, A.; Gearing, M.; Glass, J.D.; Seyfried, N.T. A proteomic network approach across the ALS—FTD disease spectrum resolves clinical phenotypes and genetic vulnerability in human brain. Embo Mol. Med. 2018, 10, 48–62. [Google Scholar] [CrossRef]
- Oeckl, P.; Weydt, P.; Thal, D.R.; Weishaupt, J.H.; Ludolph, A.C.; Otto, M. Proteomics in cerebrospinal fluid and spinal cord suggests UCHL1, MAP2 and GPNMB as biomarkers and underpins importance of transcriptional pathways in amyotrophic lateral sclerosis. Acta Neuropathol. 2019, 139, 119–134. [Google Scholar] [CrossRef]
- Iridoy, M.O.; Zubiri, I.; Zelaya, M.V.; Martinez, L.; Ausin, K.; Lachén-Montes, M.; Santamaría, E.; Fernández-Irigoyen, J.; Pascual, I.J. Neuroanatomical Quantitative Proteomics Reveals Common Pathogenic Biological Routes between Amyotrophic Lateral Sclerosis (ALS) and Frontotemporal Dementia (FTD). Int. J. Mol. Sci. 2018, 20, 4. [Google Scholar] [CrossRef]
- Collins, M.A.; An, J.; Hood, B.L.; Conrads, T.P.; Bowser, R.P. Label-Free LC–MS/MS Proteomic Analysis of Cerebrospinal Fluid Identifies Protein/Pathway Alterations and Candidate Biomarkers for Amyotrophic Lateral Sclerosis. J. Proteome Res. 2015, 14, 4486–4501. [Google Scholar] [CrossRef]
- Varghese, A.M.; Sharma, A.; Mishra, P.-S.; Vijayalakshmi, K.; Gowda, H.; Sathyaprabha, T.N.; Bharath, M.M.S.; Nalini, A.; Alladi, P.A.; Raju, T.R. Chitotriosidase—A putative biomarker for sporadic amyotrophic lateral sclerosis. Clin. Proteom. 2013, 10, 19. [Google Scholar] [CrossRef] [PubMed]
- Ratovitski, T.; Chaerkady, R.; Kammers, K.; Stewart, J.C.; Zavala, A.; Pletnikova, O.; Troncoso, J.C.; Rudnicki, D.D.; Margolis, R.L.; Cole, R.N.; et al. Quantitative Proteomic Analysis Reveals Similarities between Huntington’s Disease (HD) and Huntington’s Disease-Like 2 (HDL2) Human Brains. J. Proteome Res. 2016, 15, 3266–3283. [Google Scholar] [CrossRef] [PubMed]
- Fang, Q.; Strand, A.; Law, W.; Faca, V.M.; FitzGibbon, M.P.; Hamel, N.; Houle, B.; Liu, X.; May, D.H.; Poschmann, G.; et al. Brain-specific Proteins Decline in the Cerebrospinal Fluid of Humans with Huntington Disease. Mol. Cell. Proteom. 2009, 8, 451–466. [Google Scholar] [CrossRef] [PubMed]
- Bader, J.M.; Geyer, P.; Müller, J.B.; Strauss, M.T.; Koch, M.; Leypoldt, F.; Koertvelyessy, P.; Bittner, D.; Schipke, C.G.; Incesoy, E.I.; et al. Proteome profiling in cerebrospinal fluid reveals novel biomarkers of Alzheimer’s disease. Mol. Syst. Biol. 2020, 16, e9356. [Google Scholar] [CrossRef] [PubMed]
- Zhang, Q.; Ma, C.; Gearing, M.; Wang, P.G.; Chin, L.-S.; Li, L. Integrated proteomics and network analysis identifies protein hubs and network alterations in Alzheimer’s disease. Acta Neuropathol. Commun. 2018, 6, 1–19. [Google Scholar] [CrossRef] [PubMed]
- Seyfried, N.T.; Dammer, E.B.; Swarup, V.; Nandakumar, D.; Duong, D.M.; Yin, L.; Deng, Q.; Nguyen, T.; Hales, C.M.; Wingo, T.; et al. A Multi-network Approach Identifies Protein-Specific Co-expression in Asymptomatic and Symptomatic Alzheimer’s Disease. Cell Syst. 2017, 4, 60–72.e4. [Google Scholar] [CrossRef] [PubMed]
- Higginbotham, L.; Dammer, E.B.; Duong, D.M.; Modeste, E.; Montine, T.J.; Lah, J.J.; Levey, A.I.; Seyfried, N.T. Network Analysis of a Membrane-Enriched Brain Proteome across Stages of Alzheimer’s Disease. Proteomes 2019, 7, 30. [Google Scholar] [CrossRef]
- Wingo, A.P.; Fan, W.; Duong, D.M.; Gerasimov, E.S.; Dammer, E.B.; Liu, Y.; Harerimana, N.V.; White, B.; Thambisetty, M.; Troncoso, J.C.; et al. Shared proteomic effects of cerebral atherosclerosis and Alzheimer’s disease on the human brain. Nat. Neurosci. 2020, 23, 696–700. [Google Scholar] [CrossRef]
- Lachén-Montes, M.; González-Morales, A.; Zelaya, M.V.; Pérez-Valderrama, E.; Ausín, K.; Ferrer, I.; Fernández-Irigoyen, J.; Santamaría, E. Olfactory bulb neuroproteomics reveals a chronological perturbation of survival routes and a disruption of prohibitin complex during Alzheimer’s disease progression. Sci. Rep. 2017, 7, 1–15. [Google Scholar] [CrossRef]
- Braschi, B.; Denny, P.; Gray, K.A.; Jones, T.; Seal, R.L.; Tweedie, S.; Yates, B.; Bruford, E. Genenames.org: The HGNC and VGNC resources in 2019. Nucleic Acids Res. 2019, 47, D786–D792. [Google Scholar] [CrossRef]
- Dusa, A. Package “venn”. 2016. Available online: https://stat.ethz.ch/pipermail/r-packages/2016/001461.html (accessed on 16 July 2020).
- Kolde, R.; Package, M.K. Package “pheatmap”. 2015. Available online: https://mran.microsoft.com/snapshot/2017-09-01/web/packages/pheatmap/pheatmap.pdf (accessed on 2 August 2020).
- Kanehisa, M. Novartis Foundation Symposium. The KEGG database. Wiley Online Library. 2002. Available online: https://onlinelibrary.wiley.com/doi/abs/10.1002/0470857897.ch8 (accessed on 24 August 2020).
- The Gene Ontology Consortium. Gene ontology consortium: Going forward. Nucleic Acids Res. 2015, 43, D1049–D1056. [Google Scholar] [CrossRef] [PubMed]
- Liao, Y.; Wang, J.; Jaehnig, E.J.; Shi, Z.; Zhang, B. WebGestalt 2019: Gene set analysis toolkit with revamped UIs and APIs. Nucleic Acids Res. 2019, 47, W199–W205. [Google Scholar] [CrossRef] [PubMed]
- Bodenhofer, U.; Kothmeier, A.; Hochreiter, S. APCluster: An R package for affinity propagation clustering. Bioinform. 2011, 27, 2463–2464. [Google Scholar] [CrossRef] [PubMed]
- Frey, B.J.; Dueck, D. Clustering by Passing Messages between Data Points. Science 2007, 315, 972–976. [Google Scholar] [CrossRef]
- Ghosh, S.; May, M.J.; Kopp, E.B. NF-κB and rel proteins: Evolutionarily conserved mediators of immune responses. Annu. Rev. Immunol. 1998, 16, 225–260. [Google Scholar] [CrossRef]
- Luque, I.; Gélinas, C. Rel/NF-κB and IκB factors in oncogenesis. Semin. Cancer Biol. 1997, 8, 103–111. [Google Scholar] [CrossRef]
- Grilli, M.; Memo, M. Nuclear factor-κB/Rel proteins. Biochem. Pharmacol. 1999, 57, 1–7. [Google Scholar] [CrossRef]
- Foxwell, B.; Browne, K.; Bondeson, J.; Clarke, C.; De Martin, R.; Brennan, F.; Feldmann, M. Efficient adenoviral infection with I B reveals that macrophage tumor necrosis factor production in rheumatoid arthritis is NF- B dependent. Proc. Natl. Acad. Sci. USA 1998, 95, 8211–8215. [Google Scholar] [CrossRef]
- Nordby, Y.; Richardsen, E.; Rakaee, M.; Ness, N.; Donnem, T.; Patel, H.R.H.; Busund, L.-T.; Bremnes, R.M.; Andersen, S. High expression of PDGFR-β in prostate cancer stroma is independently associated with clinical and biochemical prostate cancer recurrence. Sci. Rep. 2017, 7, 43378. [Google Scholar] [CrossRef]
- Ibáñez, K.; Boullosa, C.; Tabarés-Seisdedos, R.; Baudot, A.; Valencia, A. Molecular Evidence for the Inverse Comorbidity between Central Nervous System Disorders and Cancers Detected by Transcriptomic Meta-analyses. Plos Genet. 2014, 10, e1004173. [Google Scholar] [CrossRef]
- Bayraktar, A.; Onal-Suzek, T.; Suzek, B.E.; Baysal, O. Meta-analysis of Gene Expression in Neurodegenerative Diseases Reveals Patterns in GABA Synthesis and Heat Stress Pathways. arXiv 2019, arXiv:1909.07469. [Google Scholar]
- Kampinga, H.H.; Bergink, S. Heat shock proteins as potential targets for protective strategies in neurodegeneration. Lancet Neurol. 2016, 15, 748–759. [Google Scholar] [CrossRef]
- Kaltenbach, L.S.; Romero, E.; Becklin, R.R.; Chettier, R.; Bell, R.; Phansalkar, A.; Strand, A.; Torcassi, C.; Savage, J.; Hurlburt, A.; et al. Huntingtin Interacting Proteins Are Genetic Modifiers of Neurodegeneration. Plos Genet. 2007, 3, e82. [Google Scholar] [CrossRef] [PubMed]
- Weskamp, K.; Barmada, S.J. TDP43 and RNA instability in amyotrophic lateral sclerosis. Brain Res. 2018, 1693, 67–74. [Google Scholar] [CrossRef] [PubMed]
- Kapeli, K.; Martinez, F.J.; Yeo, G.W. Genetic mutations in RNA-binding proteins and their roles in ALS. Qual. Life Res. 2017, 136, 1193–1214. [Google Scholar] [CrossRef] [PubMed]
- Gao, J.; Wang, L.; Huntley, M.L.; Perry, G.; Wang, X. Pathomechanisms of TDP-43 in neurodegeneration. J. Neurochem. 2018, 146, 7–20. [Google Scholar] [CrossRef] [PubMed]
- Desai, B.S.; Schneider, J.A.; Li, J.-L.; Carvey, P.M.; Hendey, B. Evidence of angiogenic vessels in Alzheimer’s disease. J. Neural Transm. 2009, 116, 587–597. [Google Scholar] [CrossRef]
- Streit, W.J.; Mrak, R.E.; Griffin, W.S.T. Microglia and neuroinflammation: A pathological perspective. J. Neuroinflamm. 2004, 1, 14. [Google Scholar] [CrossRef][Green Version]
- Naldini, A. Role of Inflammatory Mediators in Angiogenesis. Curr. Drug Target -Inflamm. Allergy 2005, 4, 3–8. [Google Scholar] [CrossRef]
- Grammas, P.; Sanchez, A.; Tripathy, D.; Luo, E.; Martinez, J. Vascular signaling abnormalities in Alzheimer disease. Clevel. Clin. J. Med. 2011, 78, S50–S53. [Google Scholar] [CrossRef][Green Version]
- Vallon, M.; Chang, J.; Zhang, H.; Kuo, C.J. Developmental and pathological angiogenesis in the central nervous system. Cell. Mol. Life Sci. 2014, 71, 3489–3506. [Google Scholar] [CrossRef] [PubMed]
- Schultheiss, C.; Blechert, B.; Gaertner, F.C.; Drecoll, E.; Mueller, J.; Weber, G.F.; Drzezga, A.; Essler, M. In vivo characterization of endothelial cell activation in a transgenic mouse model of Alzheimer’s disease. Angiogenesis 2006, 9, 59–65. [Google Scholar] [CrossRef] [PubMed]
- Sagi, S.S.; Himadri, P.; Ruma, D.; Sharma, S.; Pauline, T. Mrinalini Selenium protects the hypoxia induced apoptosis in neuroblastoma cells through upregulation of Bcl-2. Brain Res. 2008, 1209, 29–39. [Google Scholar] [CrossRef]
- Bhatia, D.; Ardekani, M.S.; Shi, Q.; Movafagh, S. Hypoxia and its Emerging Therapeutics in Neurodegenerative, Inflammatory and Renal Diseases. In Hypoxia and Human Diseases; IntechOpen: London, UK, 2017. [Google Scholar]
- Song, I.; Dityatev, A. Crosstalk between glia, extracellular matrix and neurons. Brain Res. Bull. 2018, 136, 101–108. [Google Scholar] [CrossRef]
- Singh, K.; Han, K.; Tilve, S.; Wu, K.; Geller, H.M.; Sack, M.N. Parkin targets NOD2 to regulate astrocyte endoplasmic reticulum stress and inflammation. Glia 2018, 66, 2427–2437. [Google Scholar] [CrossRef]
- Kurtishi, A.; Rosen, B.; Patil, K.S.; Alves, G.W.; Møller, S.G. Cellular Proteostasis in Neurodegeneration. Mol. Neurobiol. 2019, 56, 3676–3689. [Google Scholar] [CrossRef]
- Iurlaro, R.; Muñoz-Pinedo, C. Cell death induced by endoplasmic reticulum stress. Febs J. 2016, 283, 2640–2652. [Google Scholar] [CrossRef]
- Flores, B.N.; Li, X.; Malik, A.M.; Martinez, J.; Beg, A.A.; Barmada, S.J. An Intramolecular Salt Bridge Linking TDP43 RNA Binding, Protein Stability, and TDP43-Dependent Neurodegeneration. Cell Rep. 2019, 27, 1133–1150.e8. [Google Scholar] [CrossRef]
- Sabatino, J.J., Jr.; Pröbstel, A.-K.; Zamvil, S. B cells in autoimmune and neurodegenerative central nervous system diseases. Nat. Rev. Neurosci. 2019, 20, 728–745. [Google Scholar] [CrossRef]
- Engelhardt, B.; Vajkoczy, P.; Weller, R.O. The movers and shapers in immune privilege of the CNS. Nat. Immunol. 2017, 18, 123–131. [Google Scholar] [CrossRef]
- Louveau, A.; Plog, B.A.; Antila, S.; Alitalo, K.; Smith, N.A.; Kipnis, J. Understanding the functions and relationships of the glymphatic system and meningeal lymphatics. J. Clin. Investig. 2017, 127, 3210–3219. [Google Scholar] [CrossRef] [PubMed]
- Anthony, I.C.; Crawford, D.H.; Bell, J.E. B lymphocytes in the normal brain: Contrasts with HIV-associated lymphoid infiltrates and lymphomas. Brain 2003, 126, 1058–1067. [Google Scholar] [CrossRef] [PubMed]
- Machado-Santos, J.; Saji, E.; Tröscher, A.R.; Paunovic, M.; Liblau, R.; Gabriely, G.; Bien, C.G.; Bauer, J.; Lassmann, H. The compartmentalized inflammatory response in the multiple sclerosis brain is composed of tissue-resident CD8+ T lymphocytes and B cells. Brain 2018, 141, 2066–2082. [Google Scholar] [CrossRef] [PubMed]
- Kowarik, M.C.; Grummel, V.; Wemlinger, S.; Buck, D.; Weber, M.S.; Berthele, A.; Hemmer, B. Immune cell subtyping in the cerebrospinal fluid of patients with neurological diseases. J. Neurol. 2014, 261, 130–143. [Google Scholar] [CrossRef]
- Brochard, V.; Combadière, B.; Prigent, A.; Laouar, Y.; Perrin, A.; Beray-Berthat, V.; Bonduelle, O.; Alvarez-Fischer, D.; Callebert, J.; Launay, J.-M.; et al. Infiltration of CD4+ lymphocytes into the brain contributes to neurodegeneration in a mouse model of Parkinson disease. J. Clin. Investig. 2008, 119, 182–192. [Google Scholar] [CrossRef] [PubMed]
- Orr, C.F.; Rowe, D.B.; Mizuno, Y.; Mori, H.; Halliday, G.M. A possible role for humoral immunity in the pathogenesis of Parkinson’s disease. Brain 2005, 128, 2665–2674. [Google Scholar] [CrossRef]
- Diaz-Ortiz, M.E.; Chen-Plotkin, A.S. Omics in Neurodegenerative Disease: Hope or Hype? Trends Genet. 2020, 36, 152–159. [Google Scholar] [CrossRef]
- De Jager, P.L.; Yang, H.-S.; Bennett, D.A. Deconstructing and targeting the genomic architecture of human neurodegeneration. Nat. Neurosci. 2018, 21, 1310–1317. [Google Scholar] [CrossRef]
- Becker, K.; Bluhm, A.; Casas-Vila, N.; Dinges, N.; DeJung, M.; Sayols, S.; Kreutz, C.; Roignant, J.-Y.; Butter, F.; Legewie, S. Quantifying post-transcriptional regulation in the development of Drosophila melanogaster. Nat. Commun. 2018, 9, 1–14. [Google Scholar] [CrossRef]
- Manzoni, C.; Lewis, P.A.; Ferrari, R. Network Analysis for Complex Neurodegenerative Diseases. Curr. Genet. Med. Rep. 2020, 8, 17–25. [Google Scholar] [CrossRef]
- Yu, X.; Lai, S.; Chen, H.; Chen, M. Protein–protein interaction network with machine learning models and multiomics data reveal potential neurodegenerative disease-related proteins. Hum. Mol. Genet. 2020, 29, 1378–1387. [Google Scholar] [CrossRef] [PubMed]
- Nguyen, N.D.; Wang, D. Multiview learning for understanding functional multiomics. Plos Comput. Biol. 2020, 16, e1007677. [Google Scholar] [CrossRef] [PubMed]


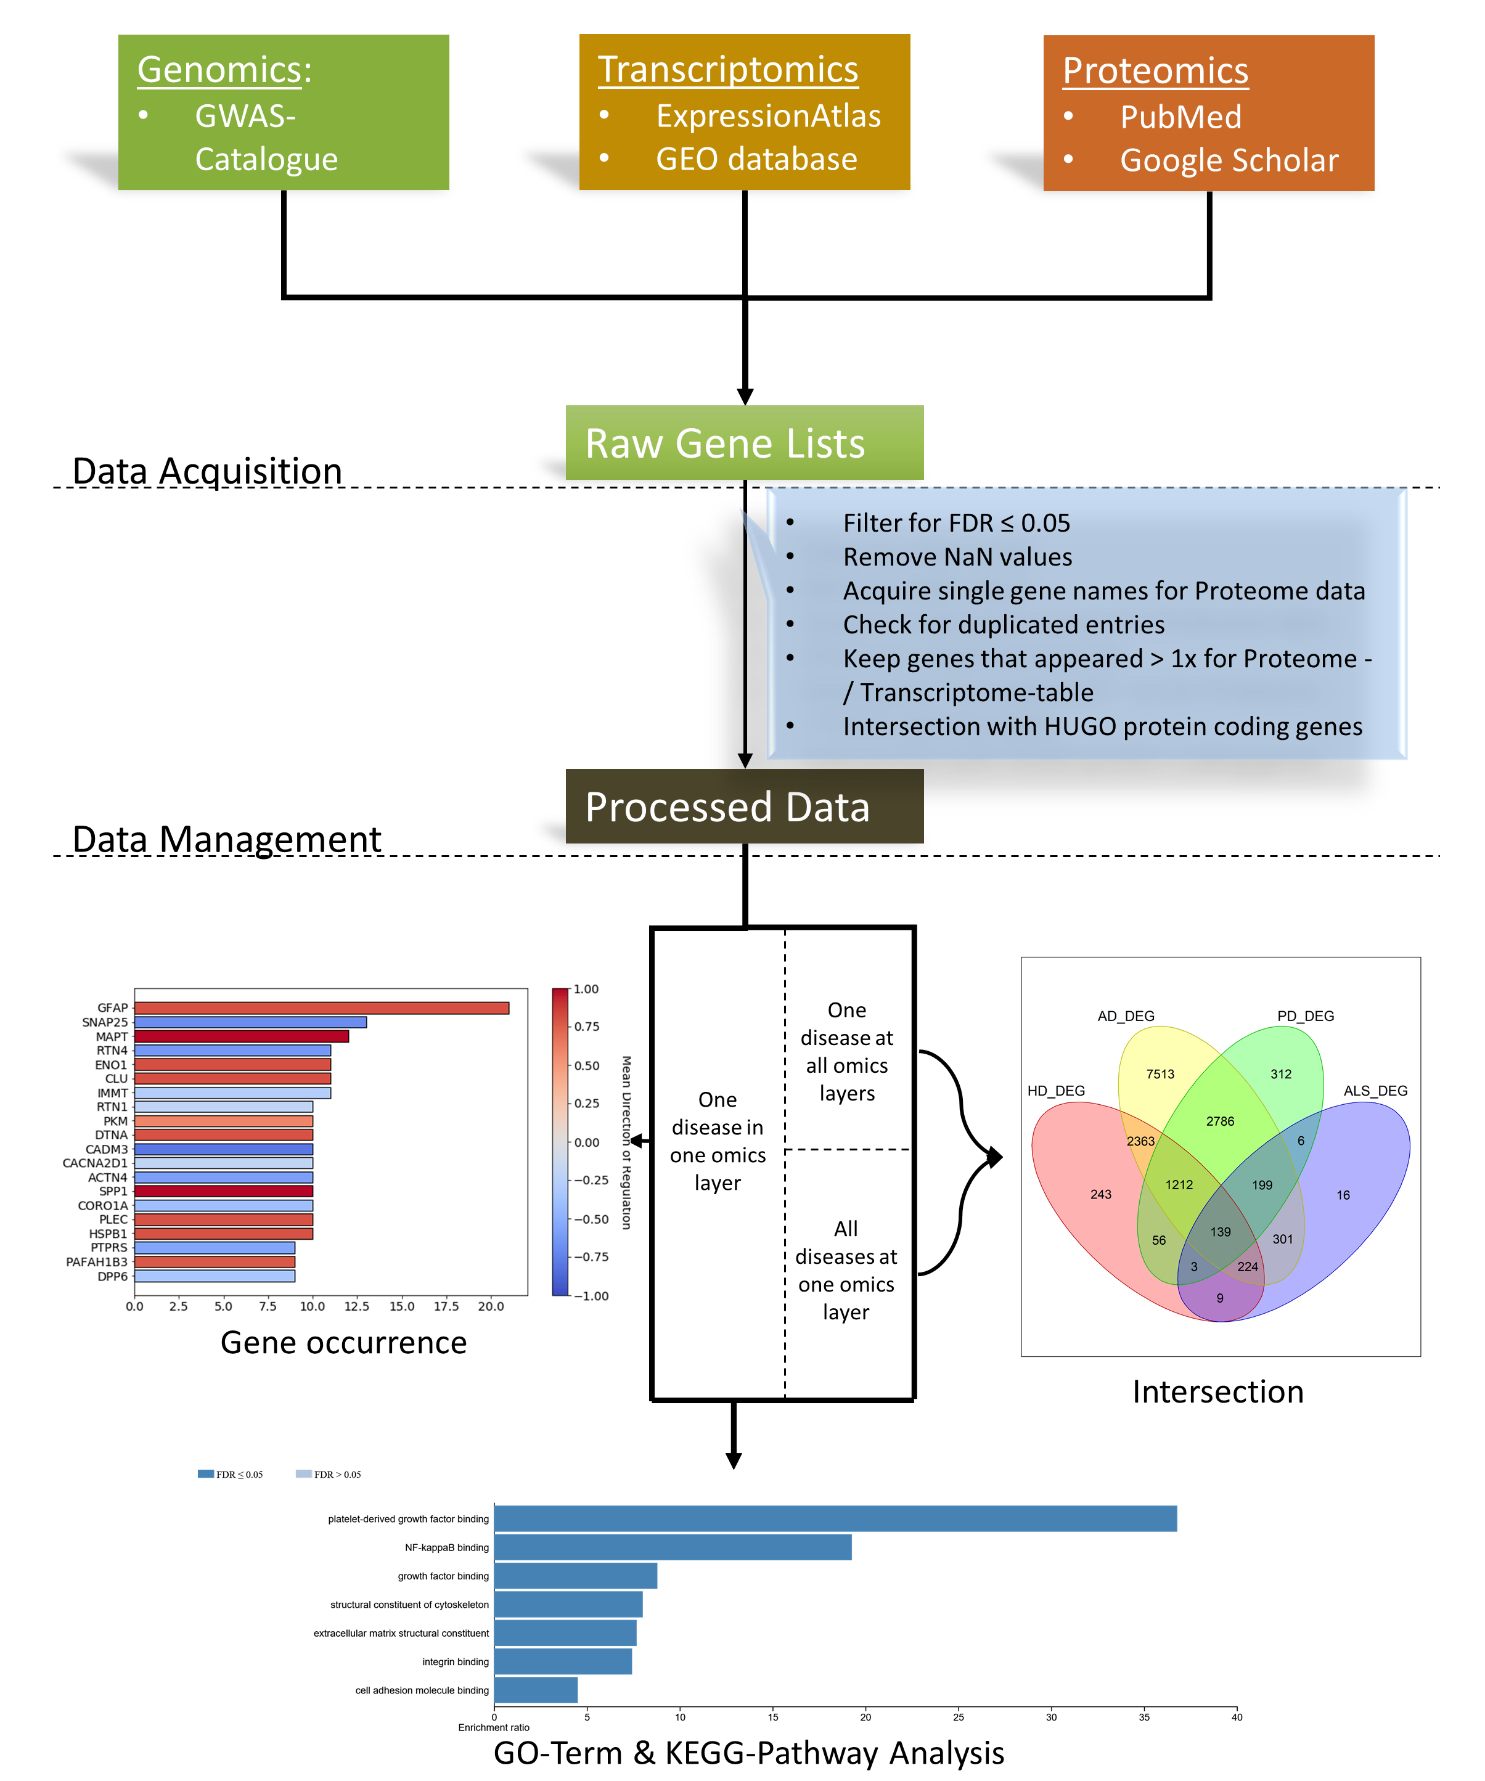
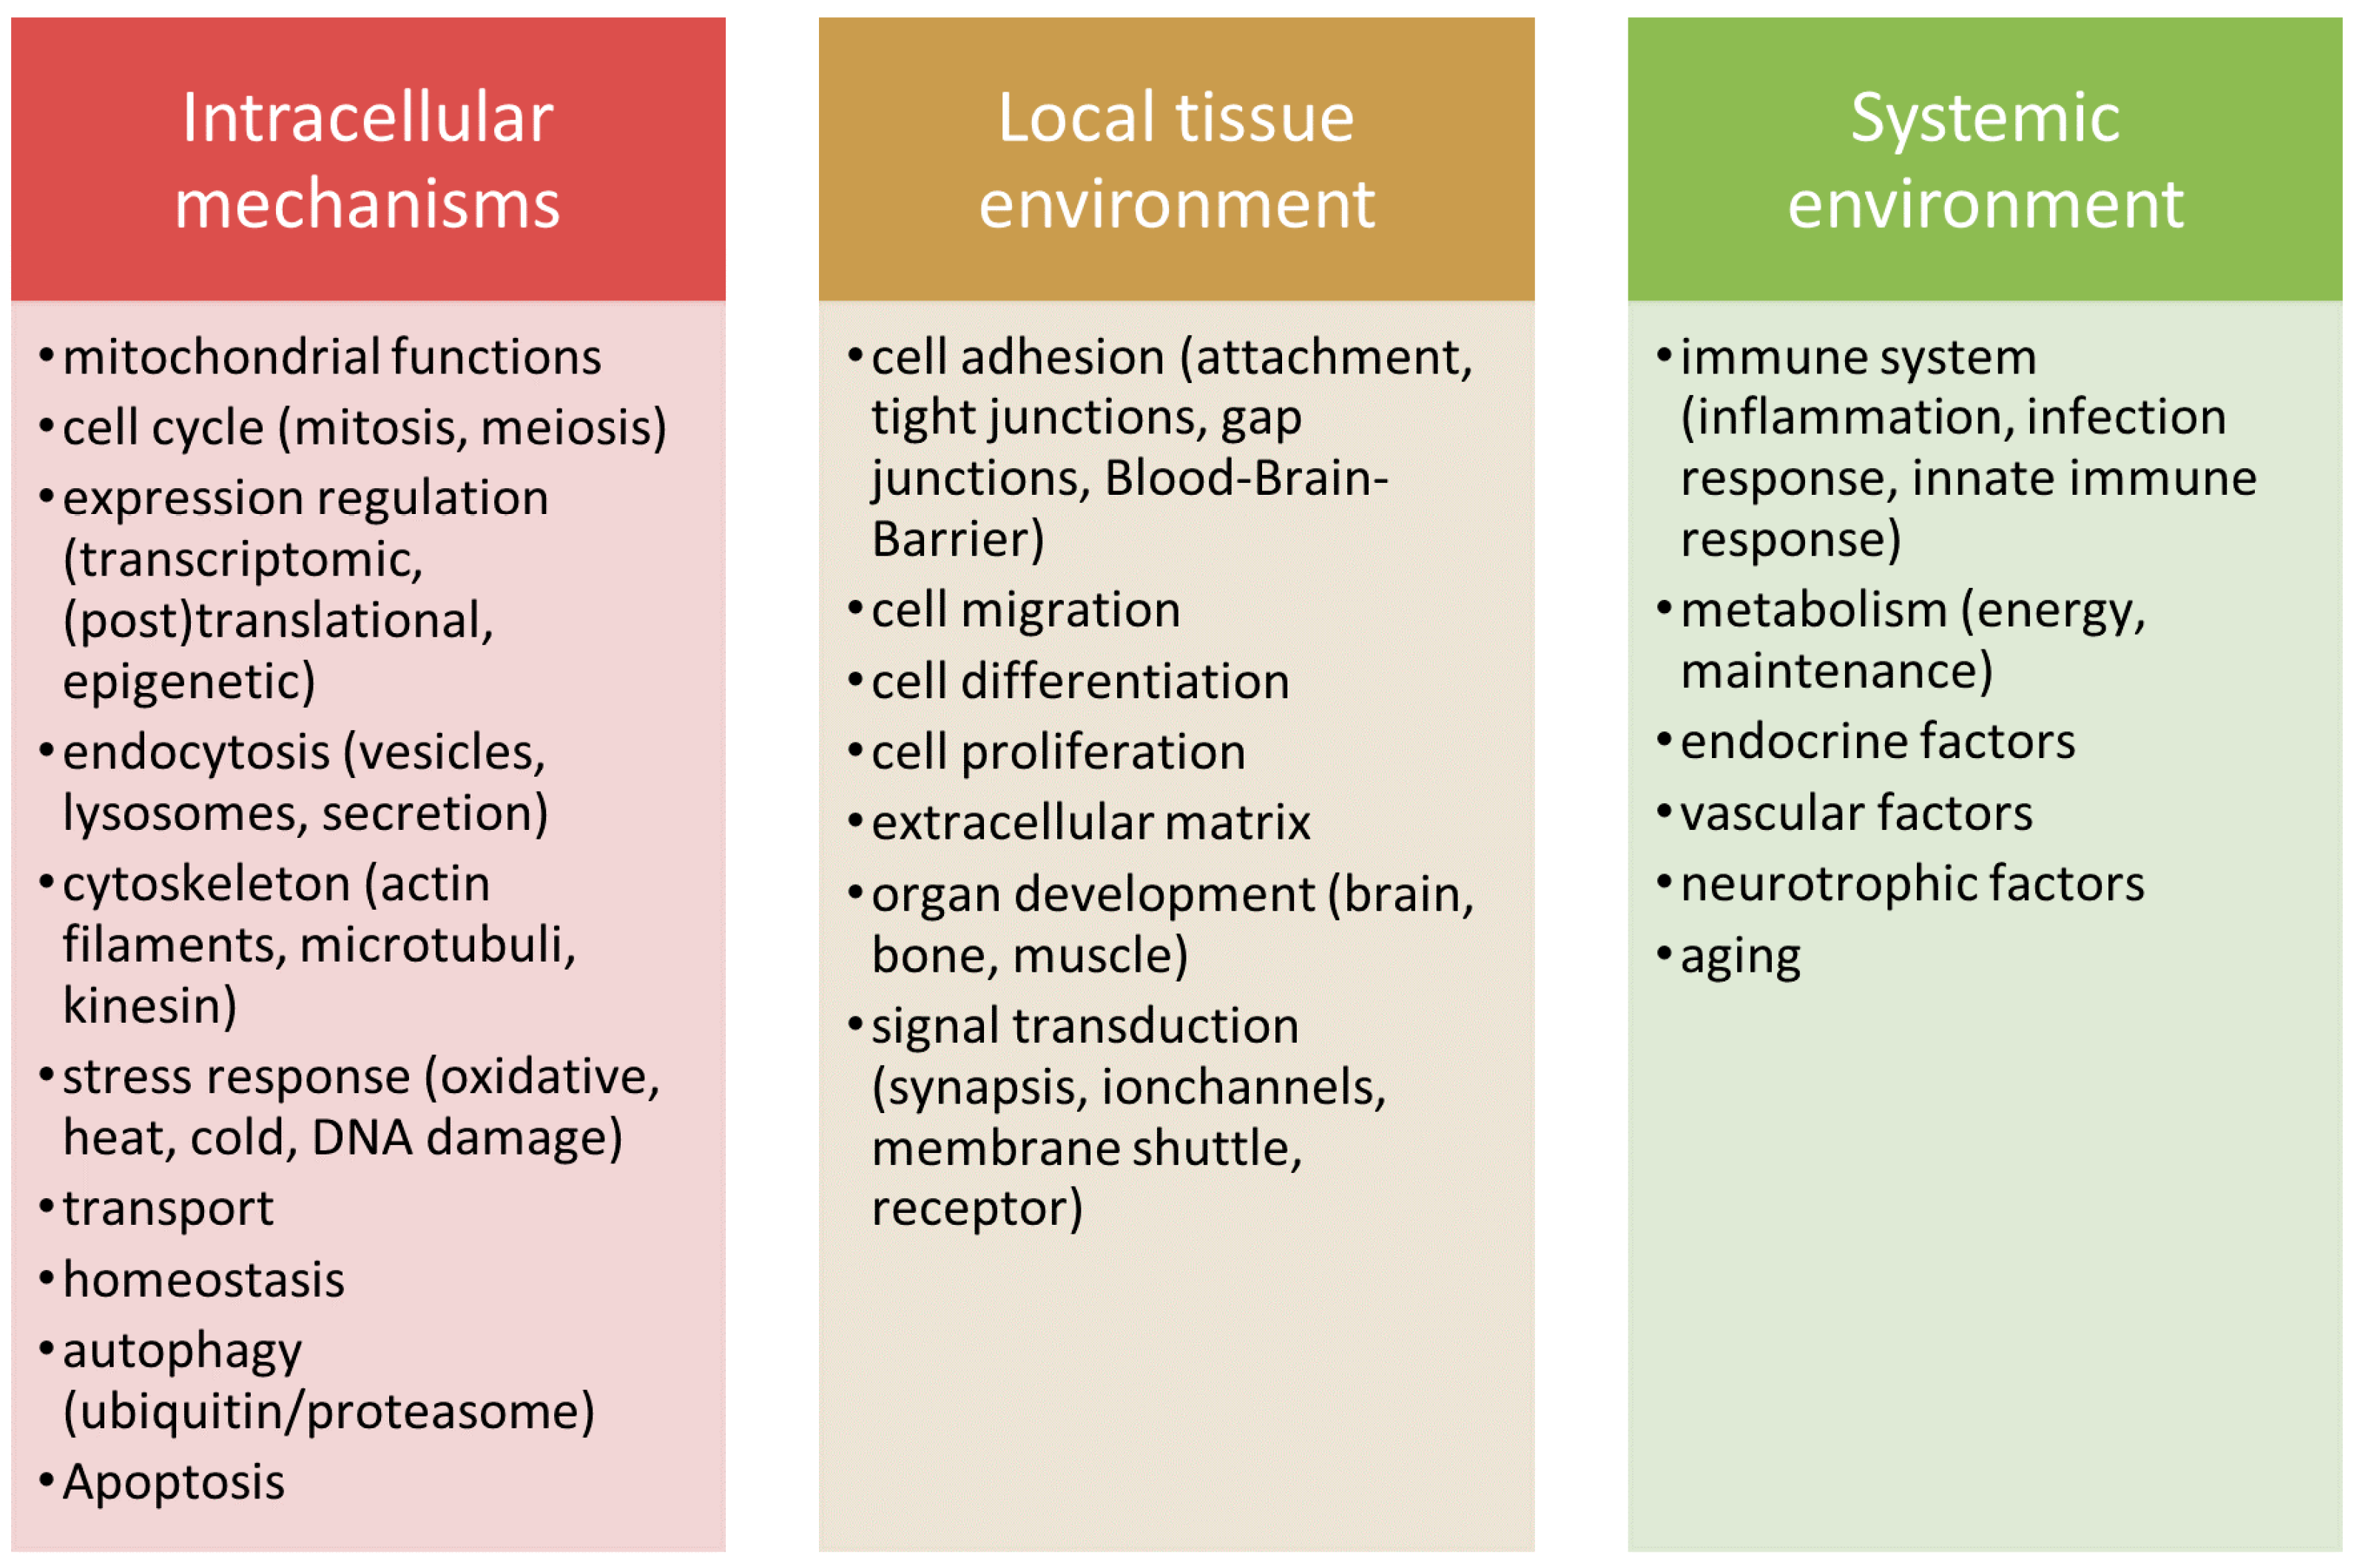
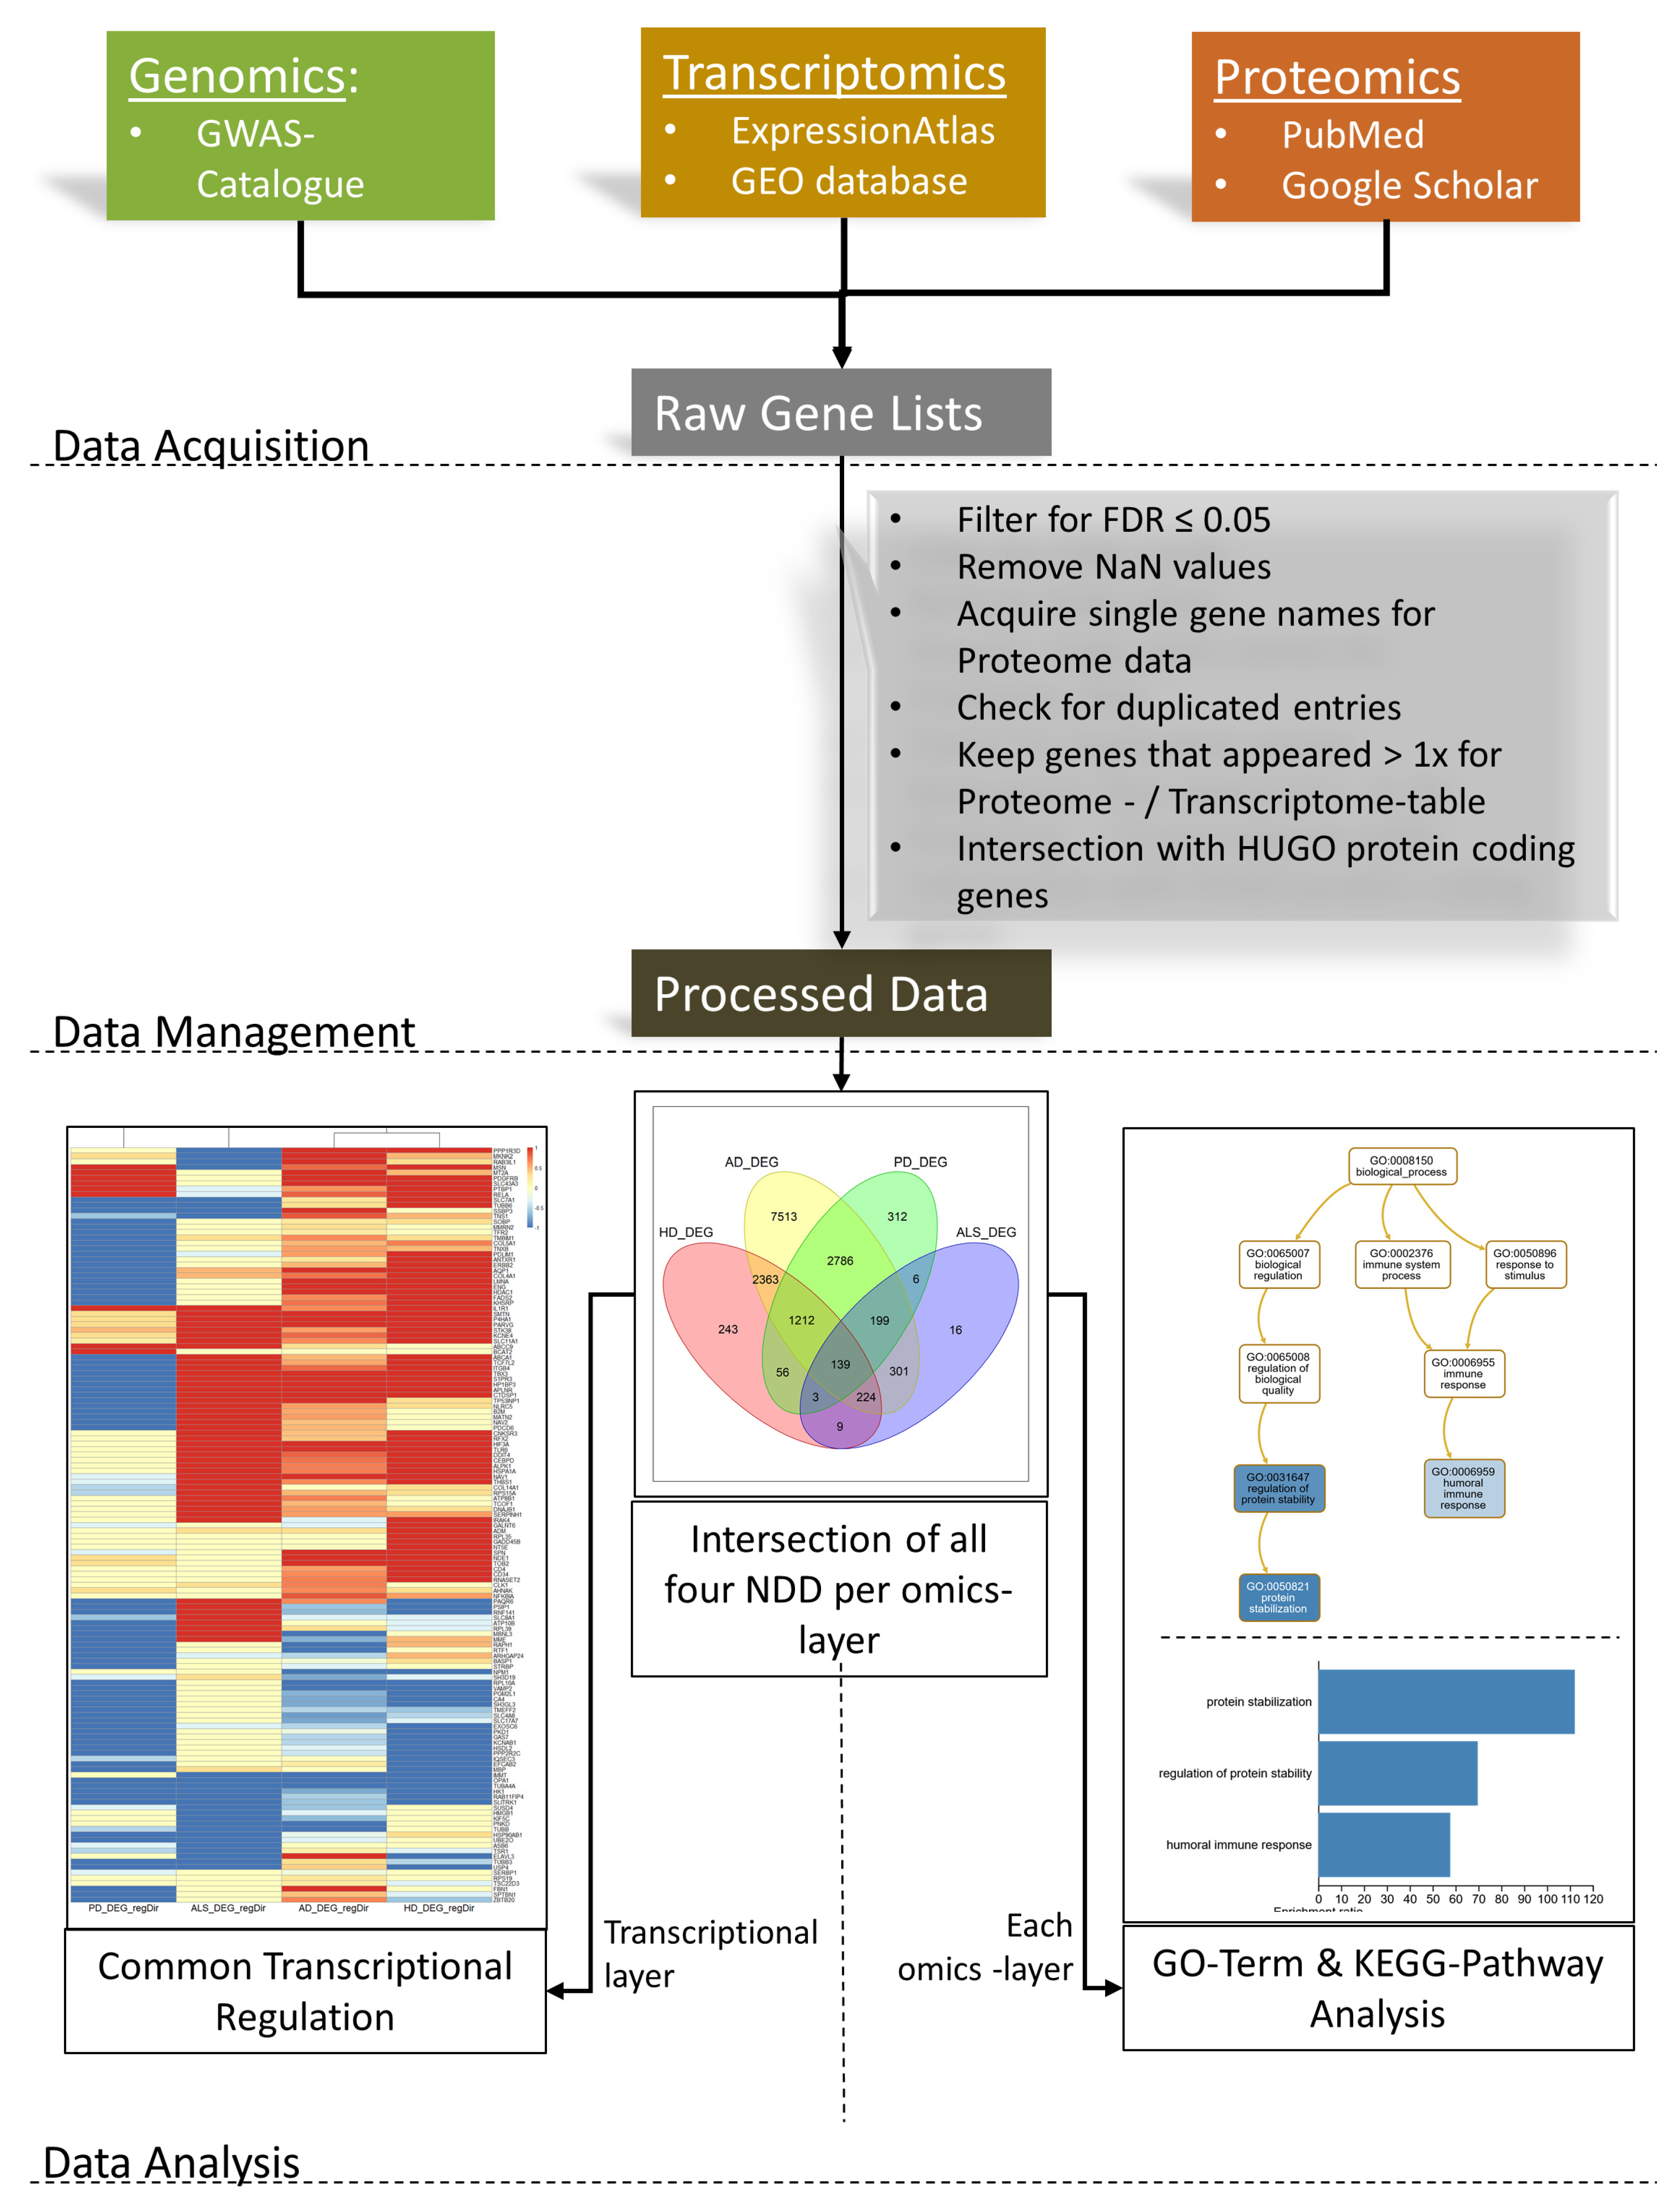
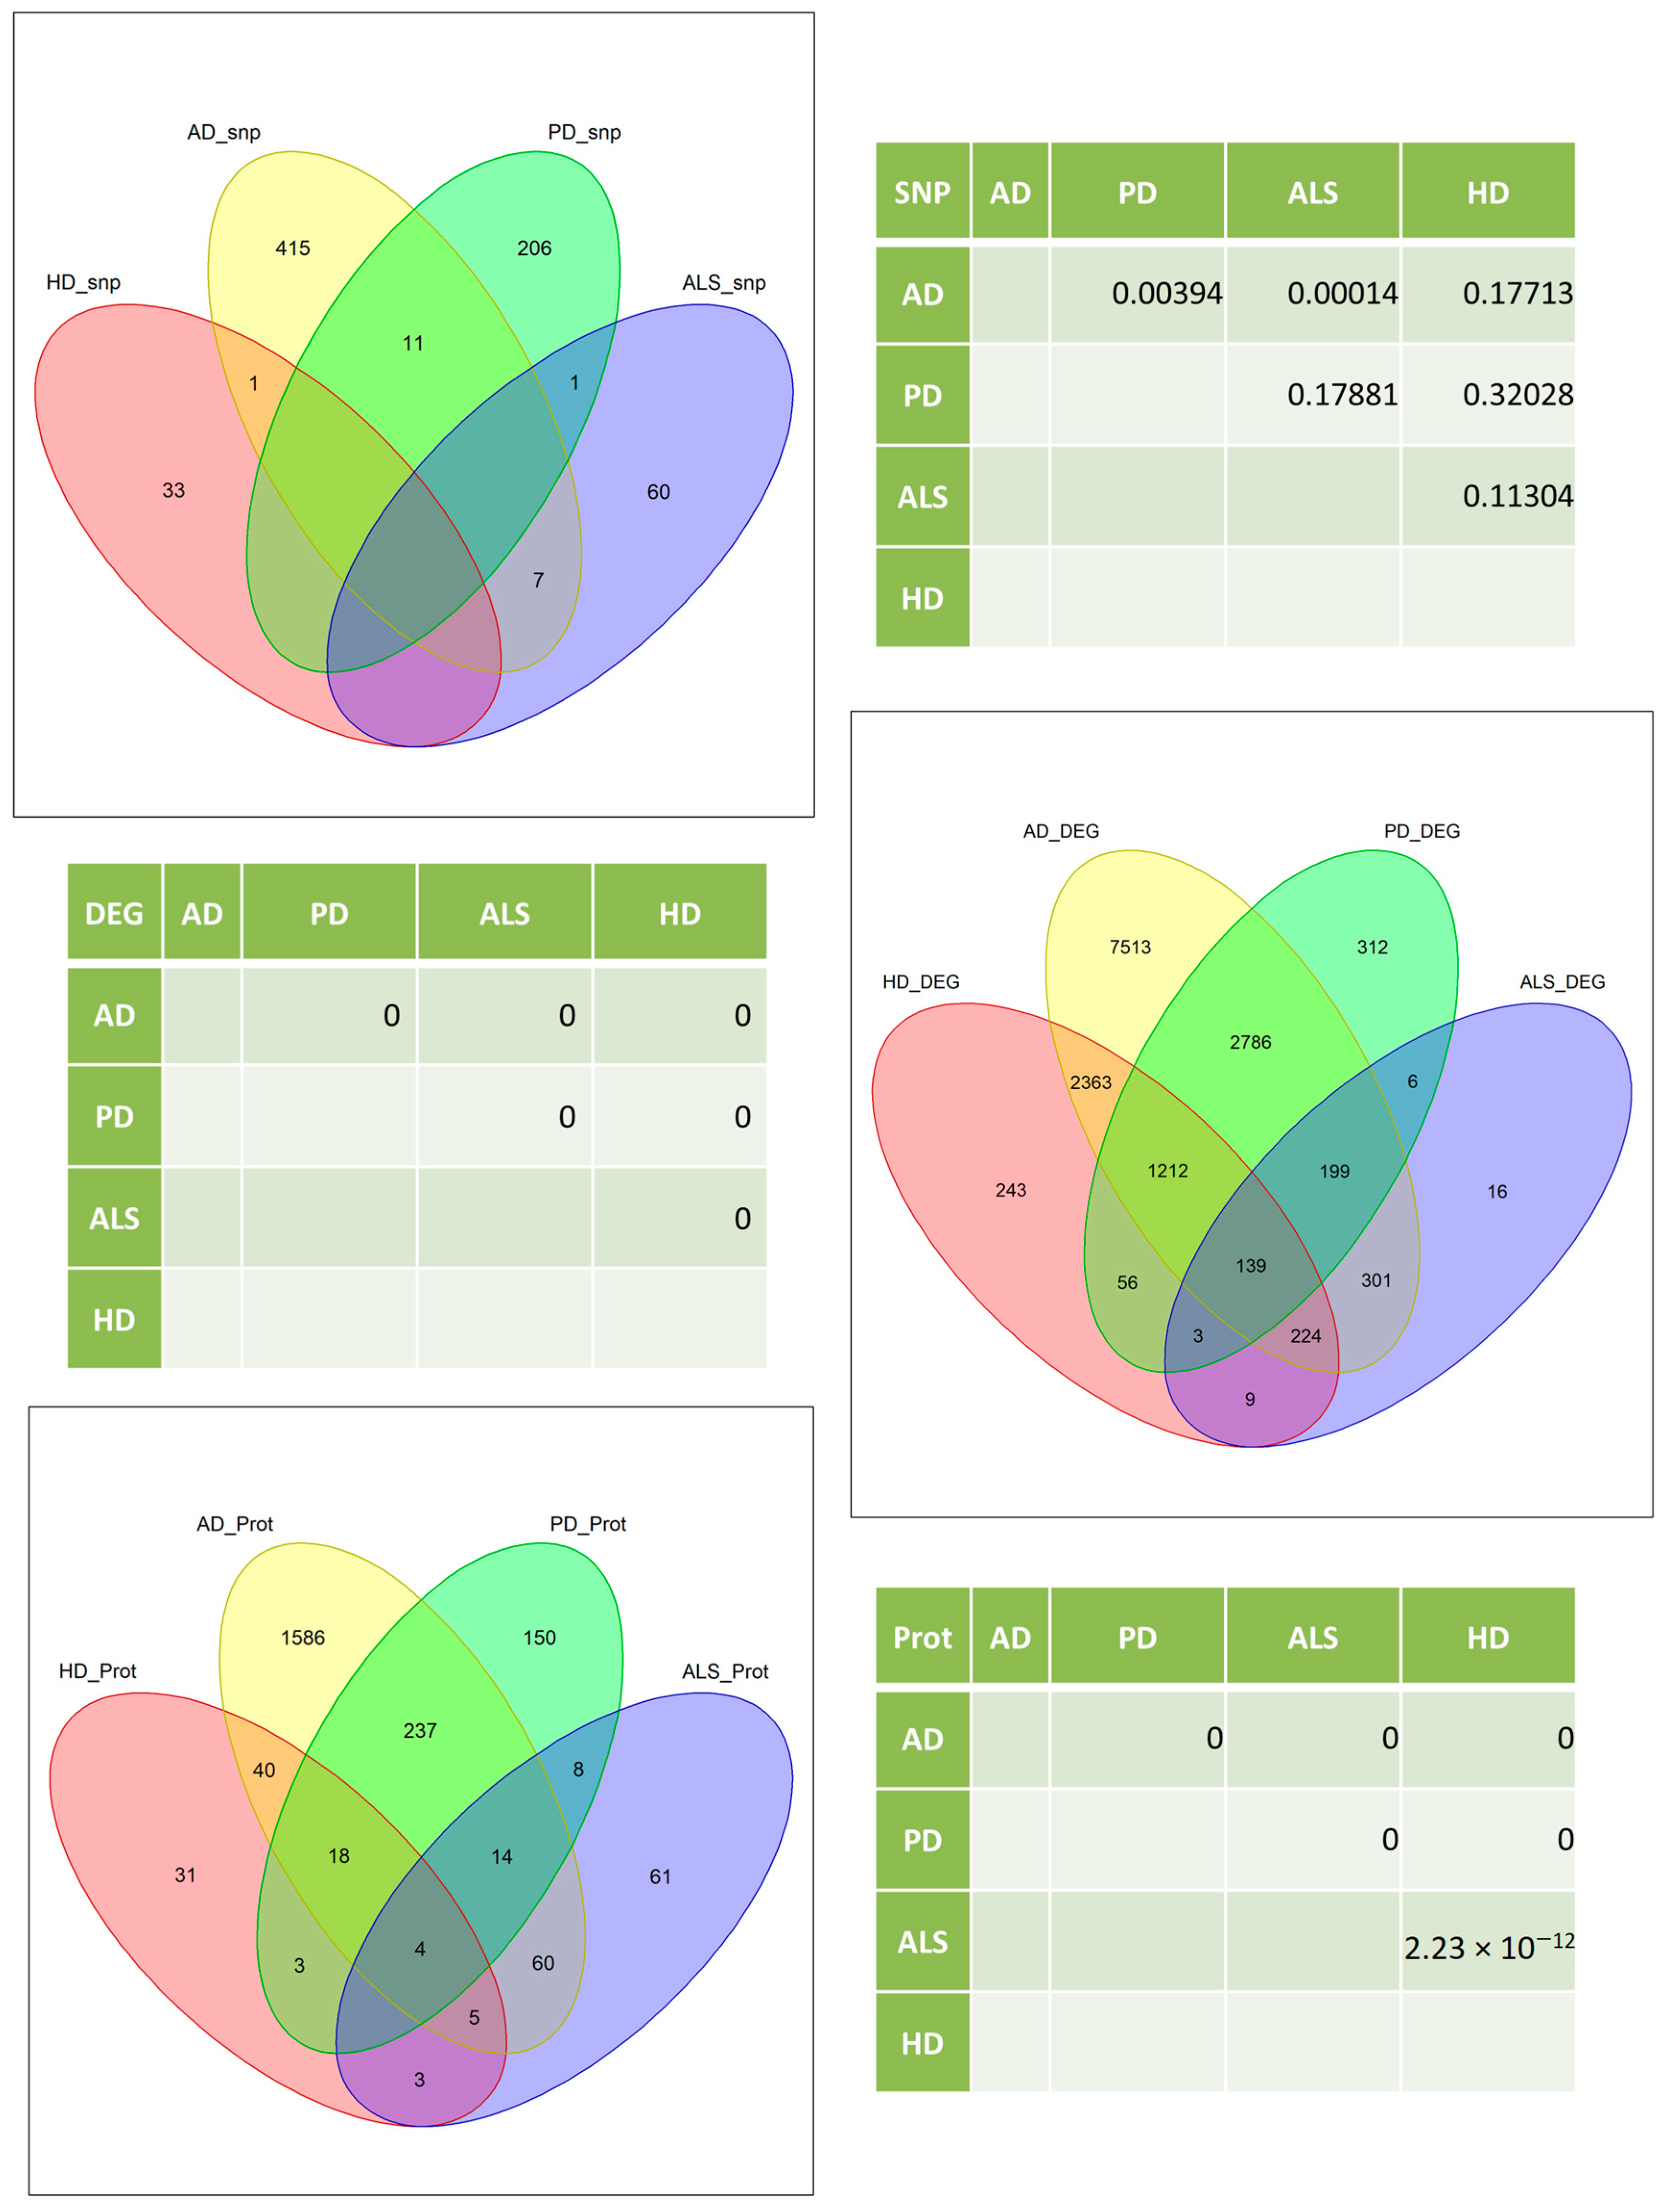
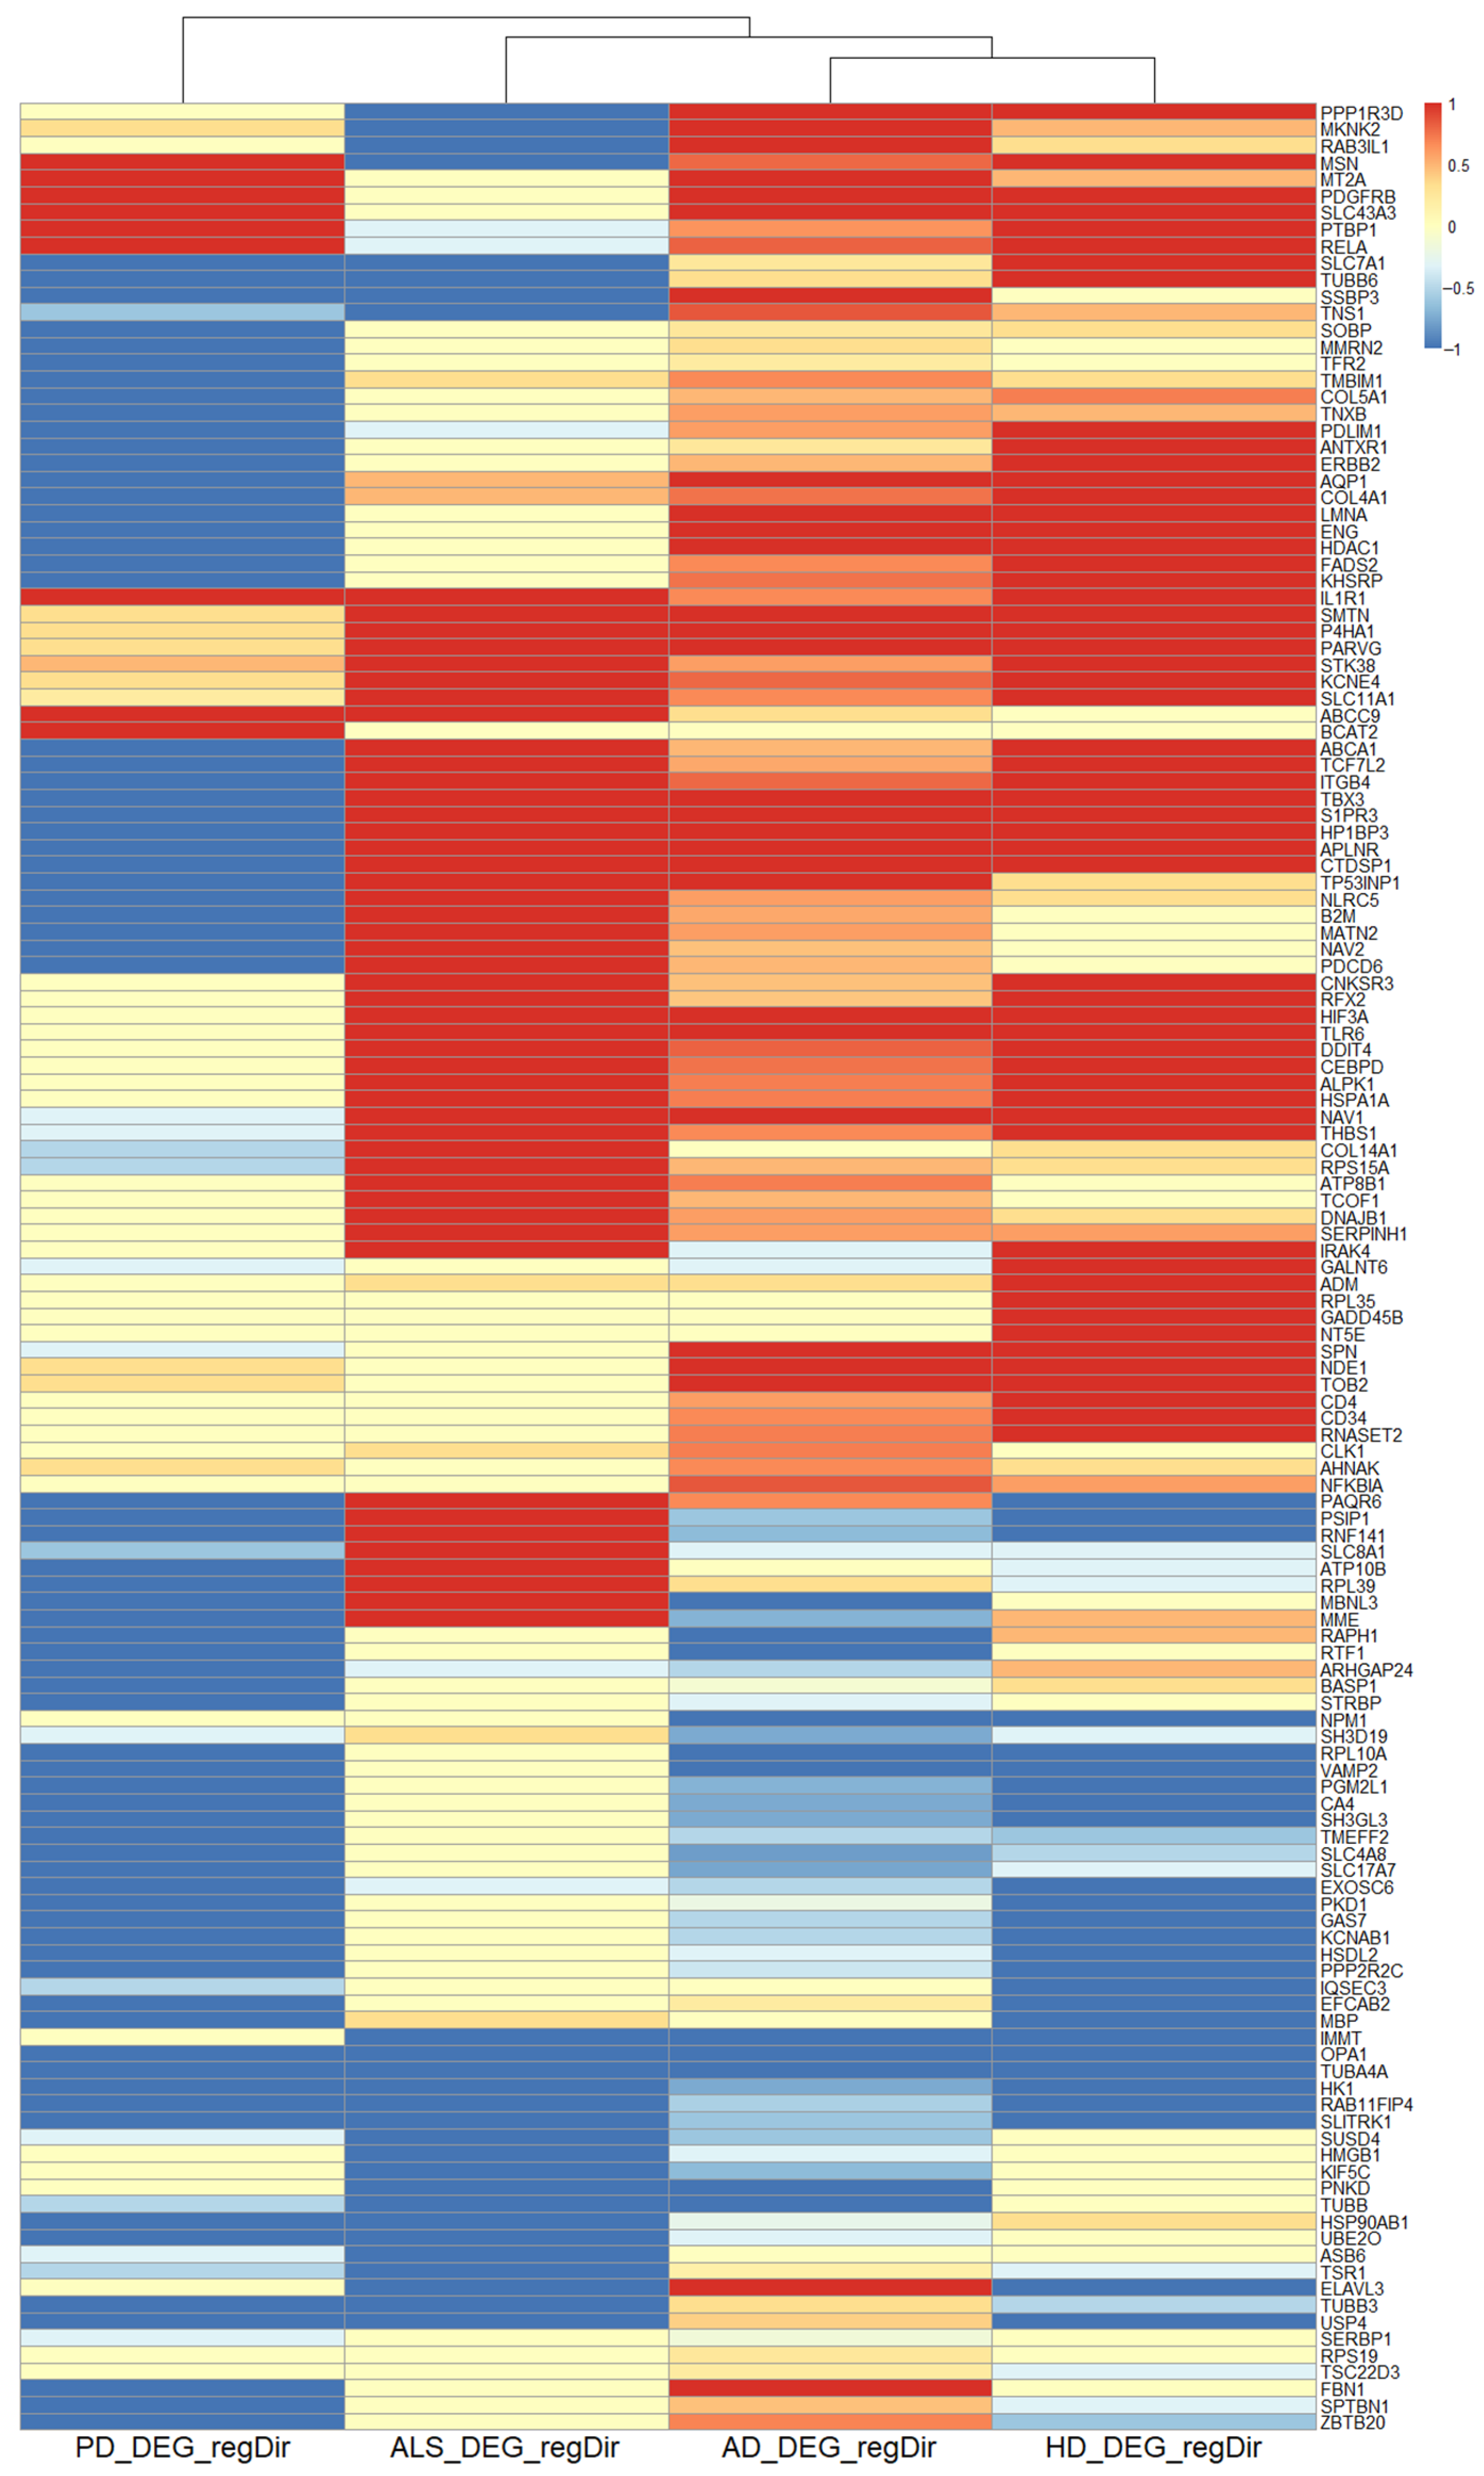
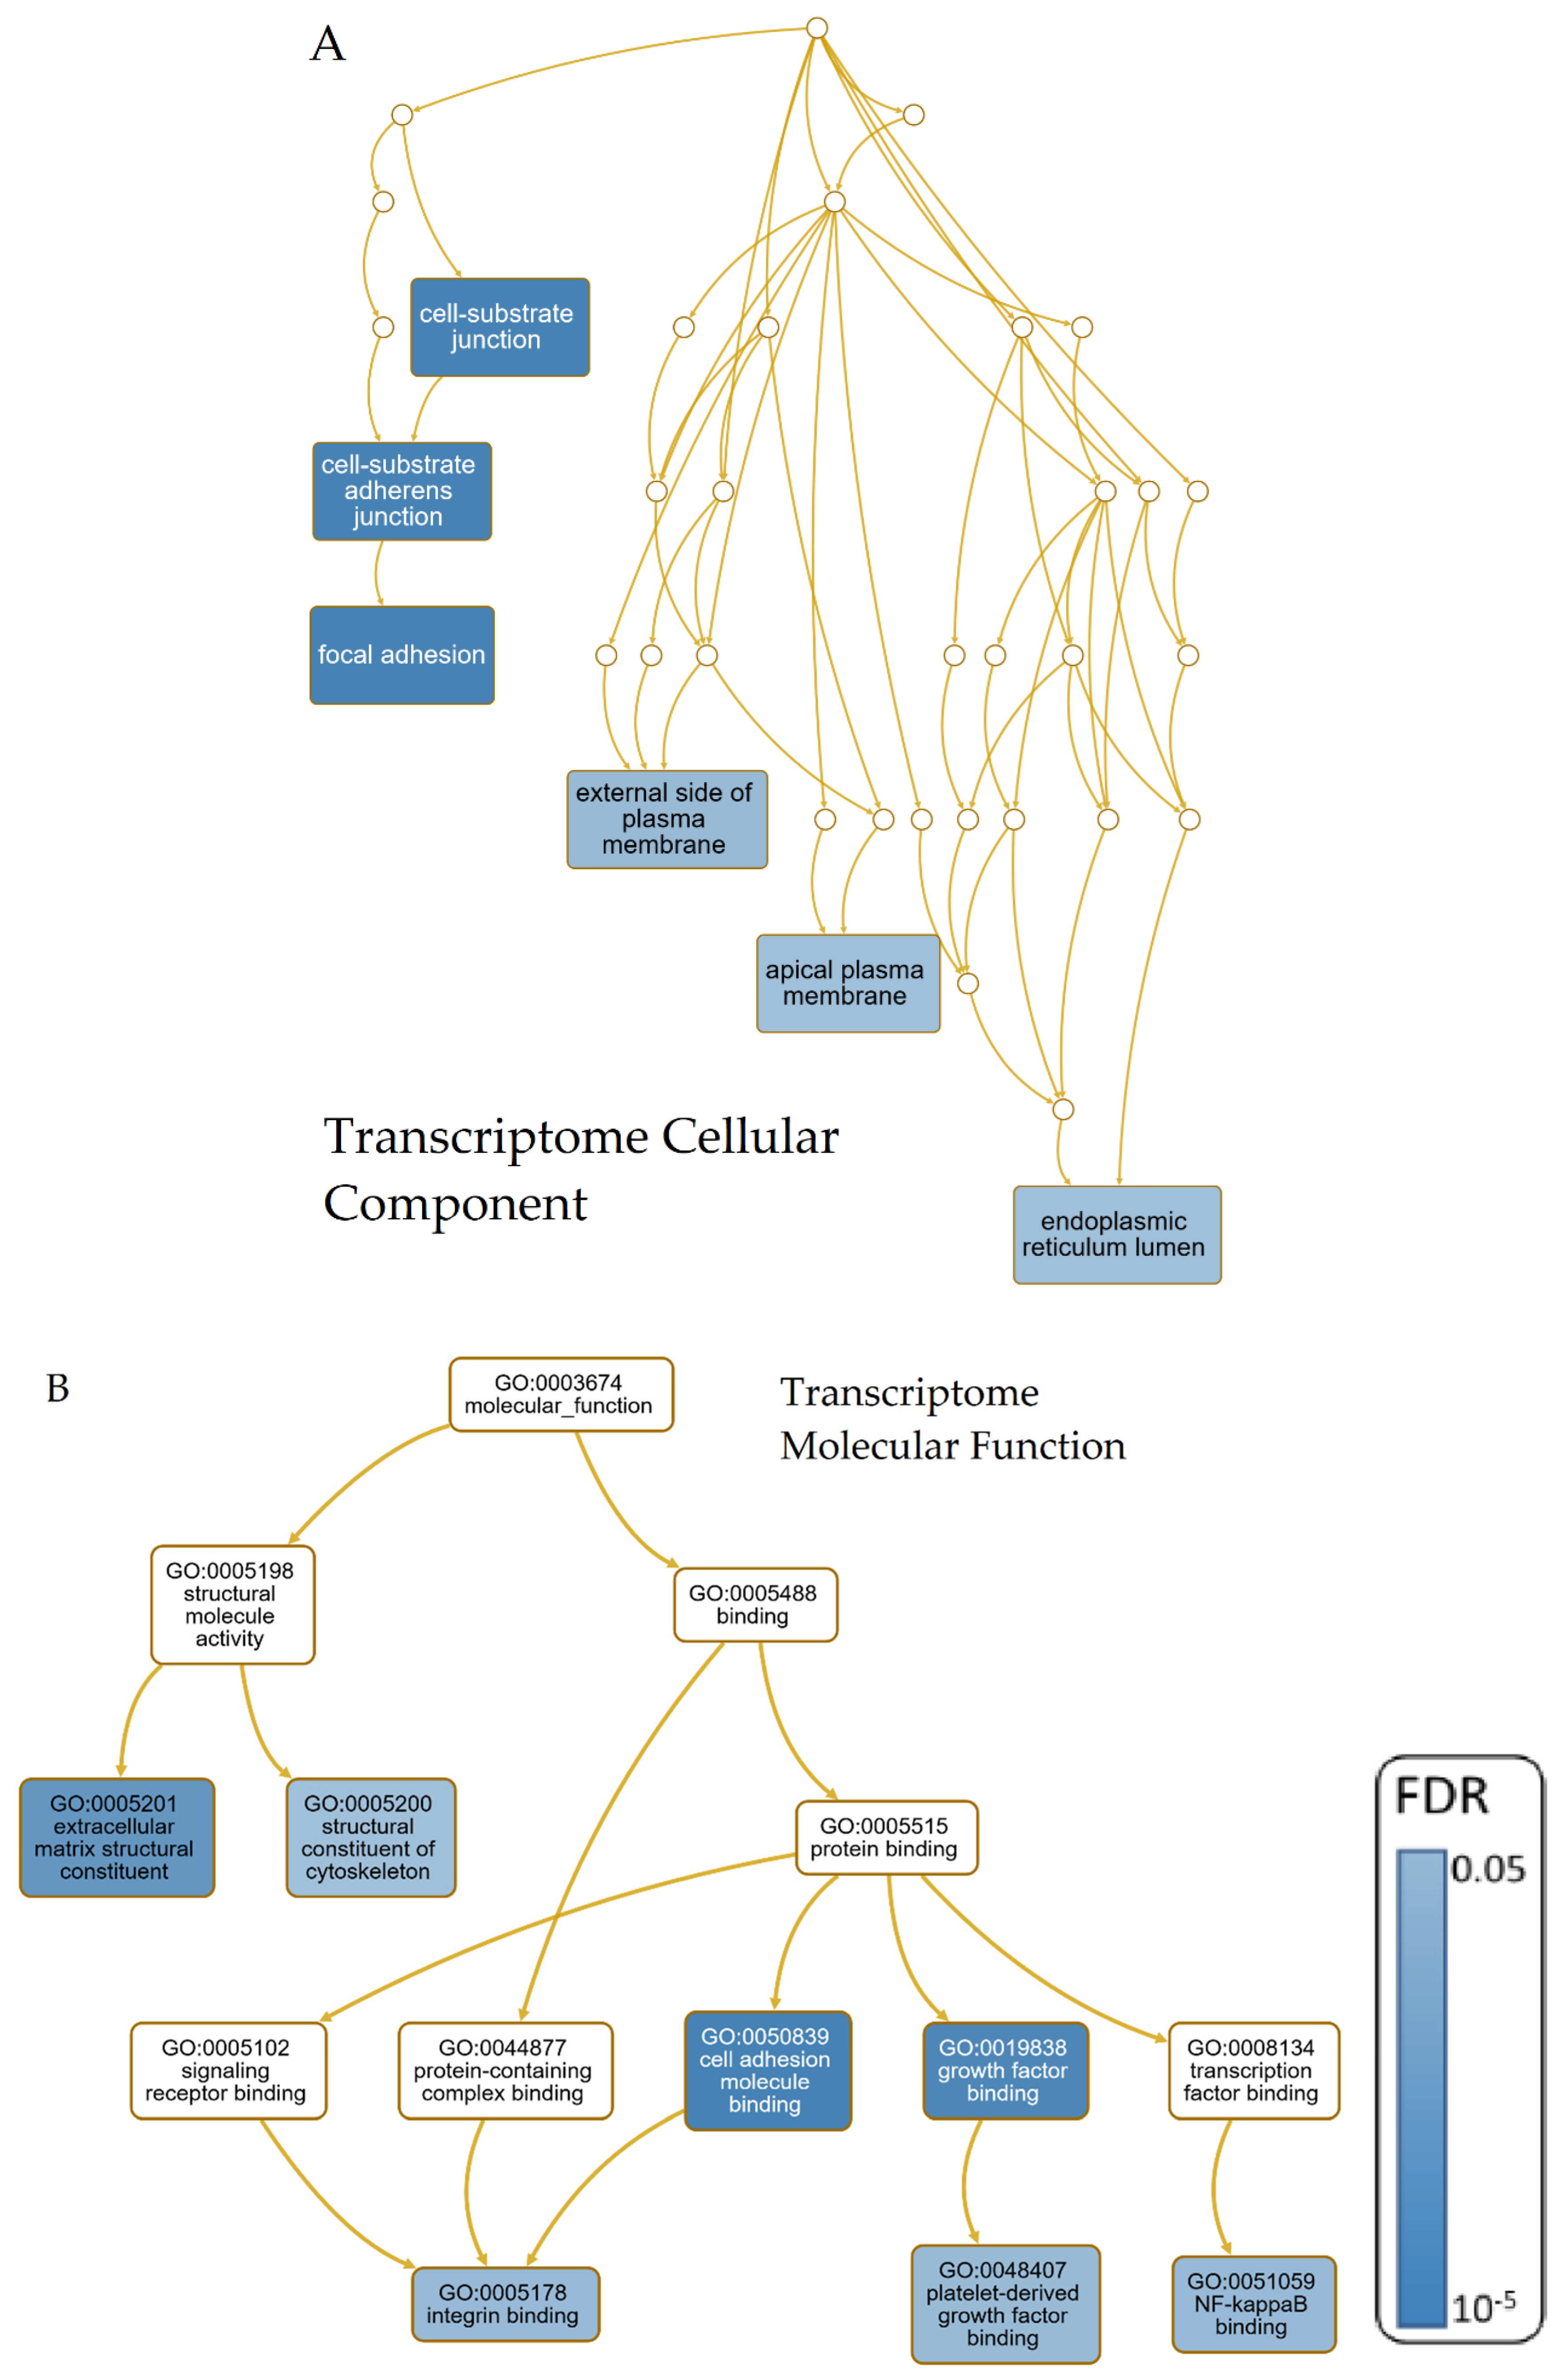
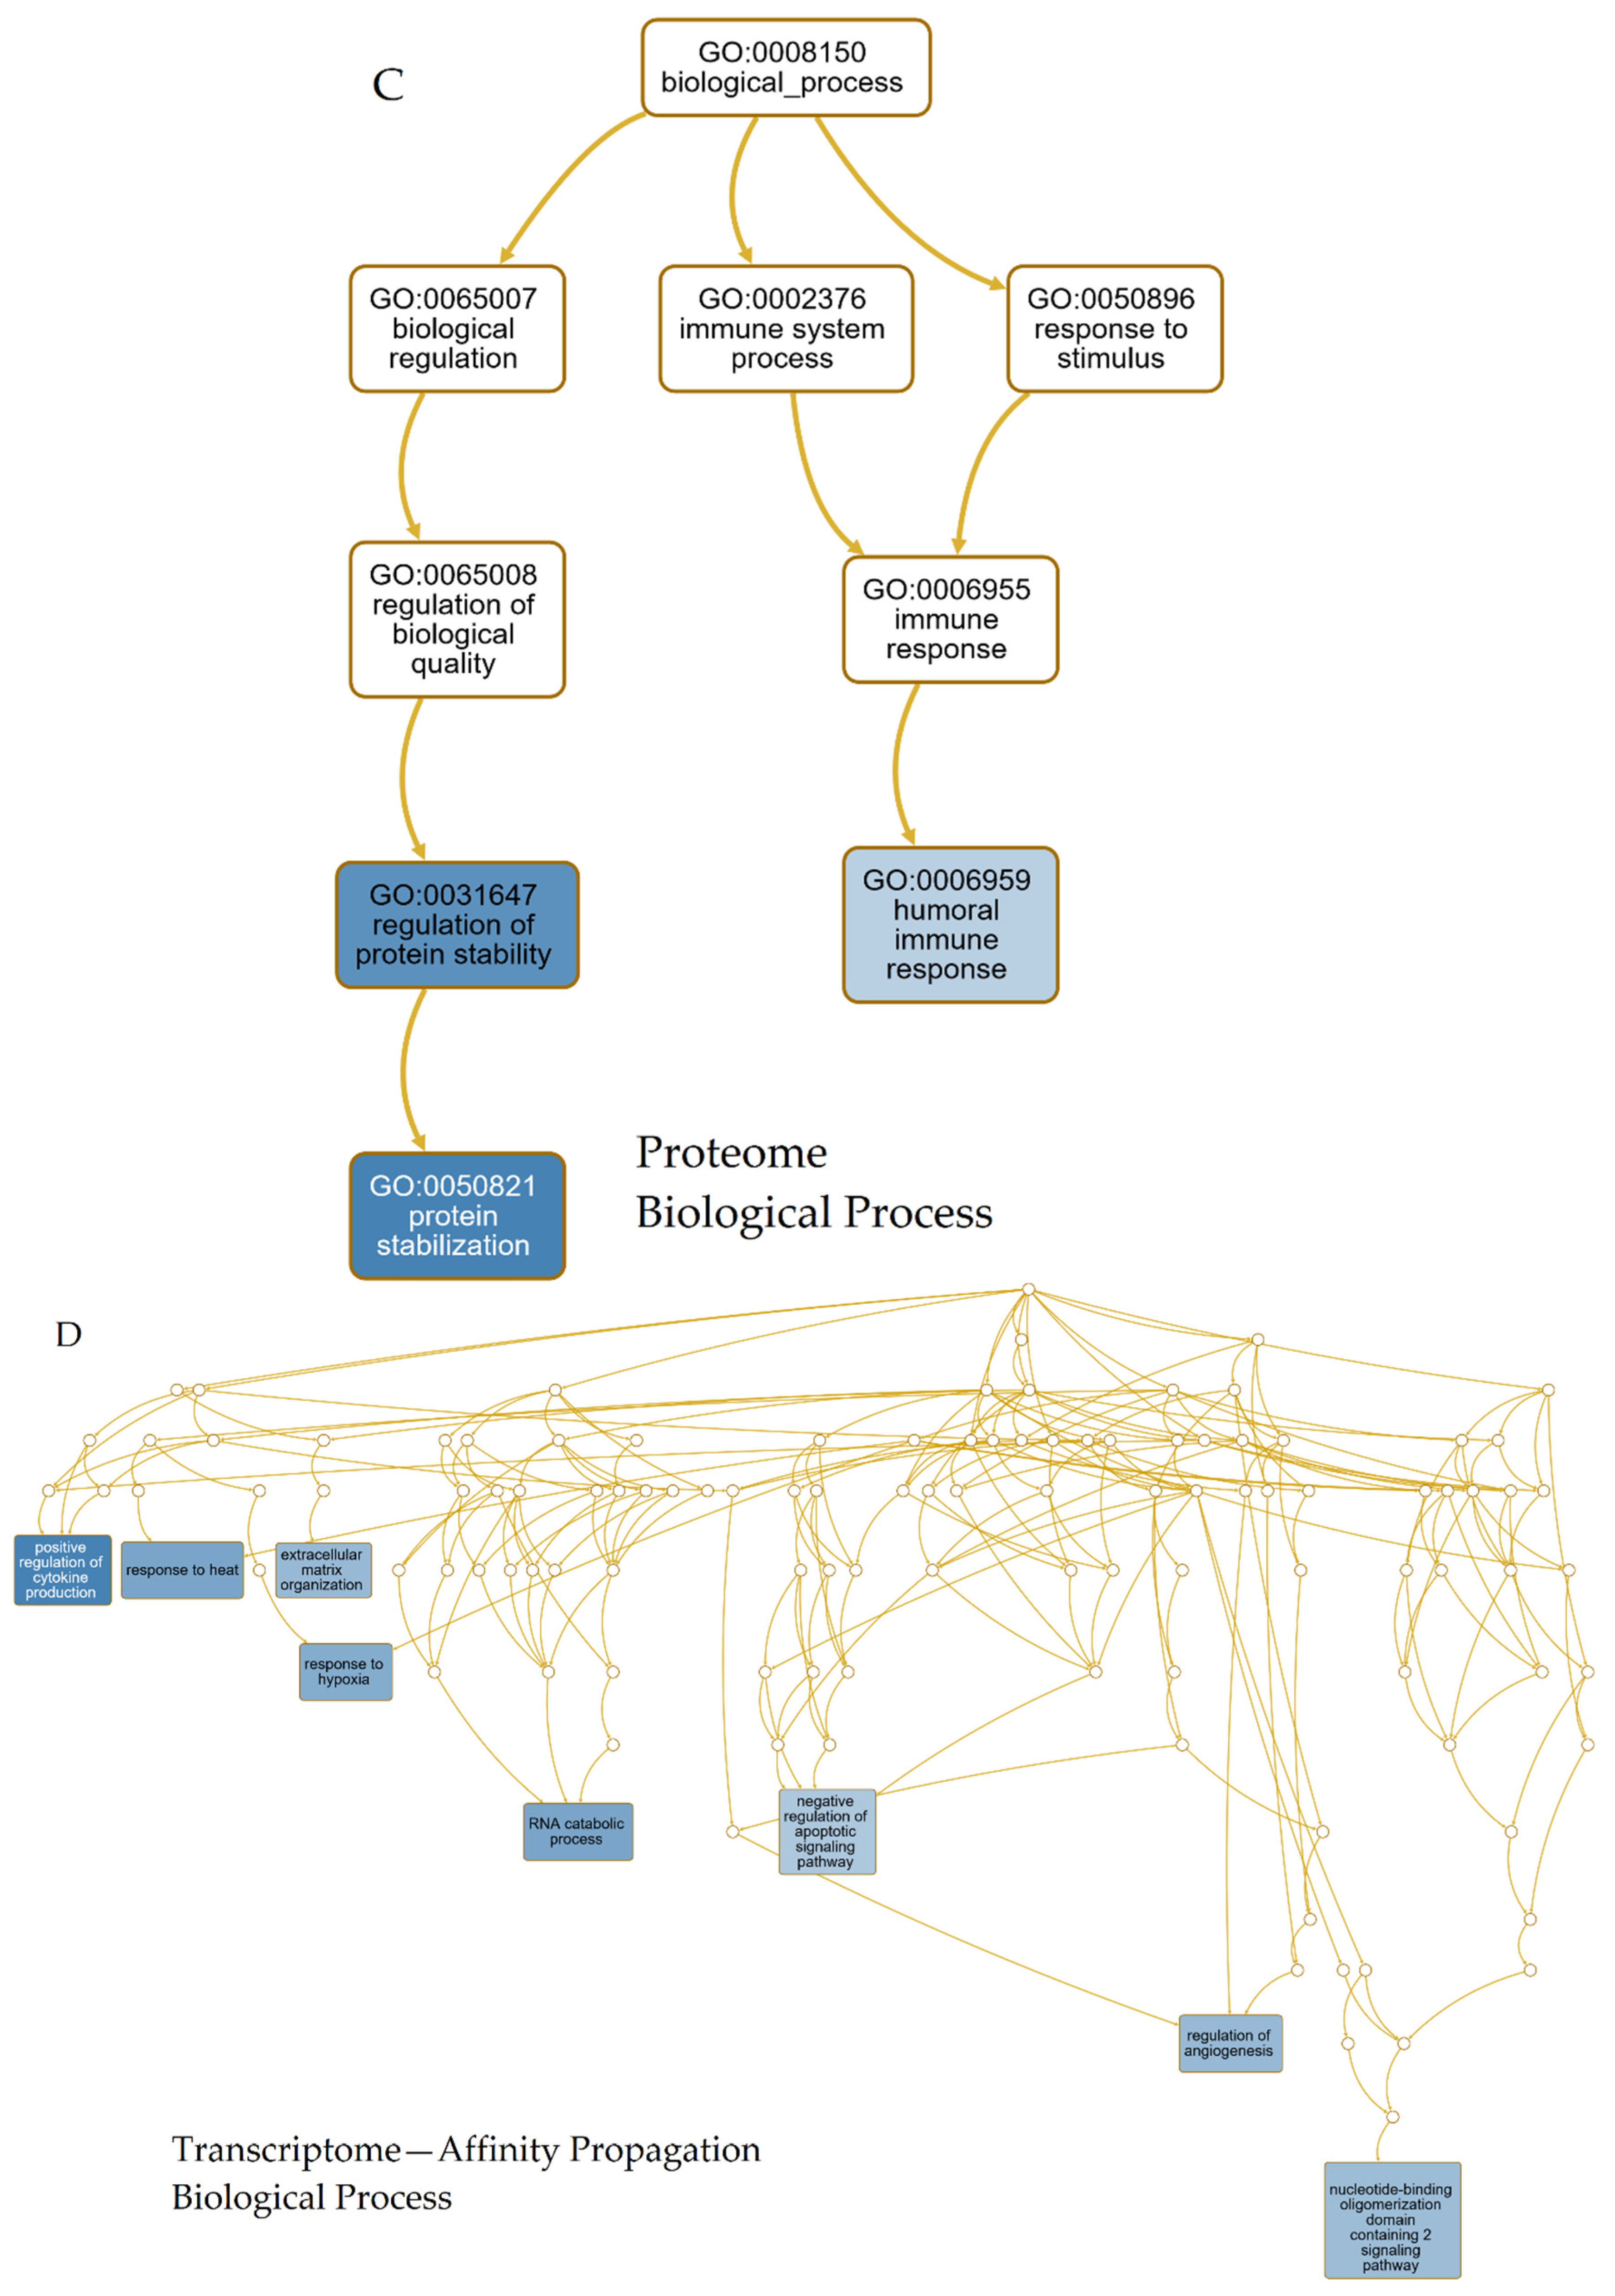
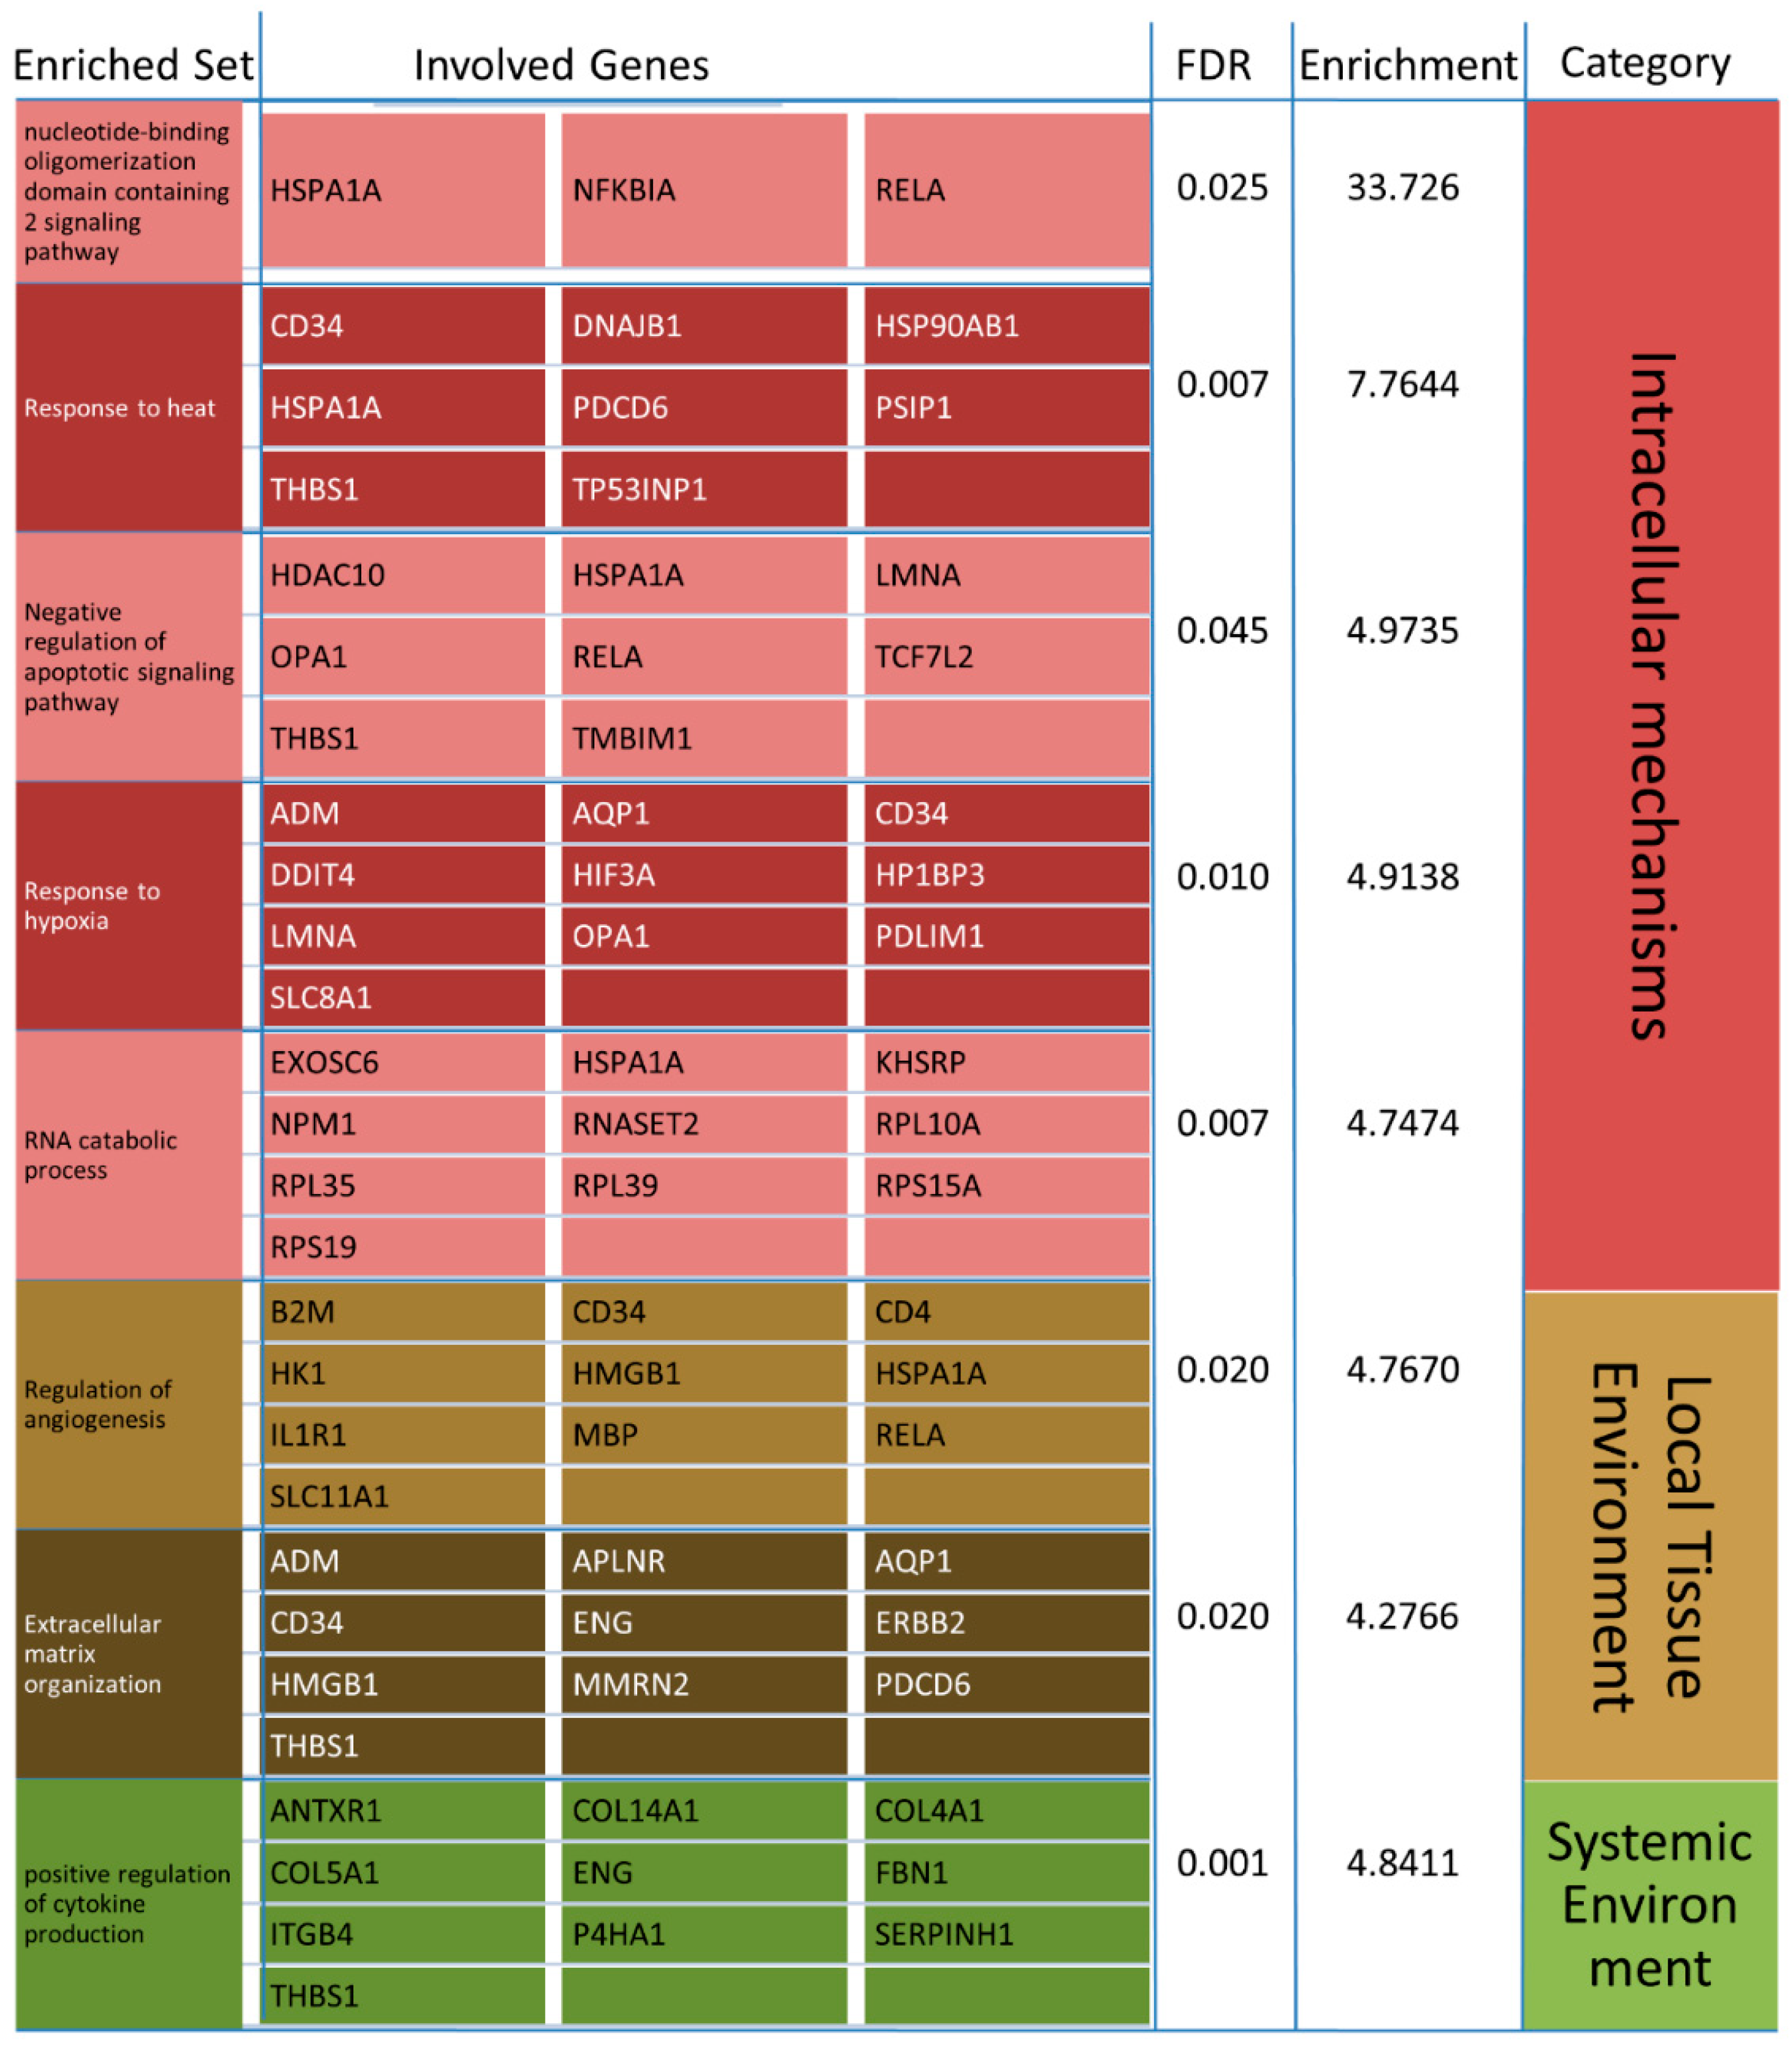
| Transcriptome | Case | Control | Sum of Samples | Studies |
|---|---|---|---|---|
| AD | 187 | 194 | 381 | 11 |
| PD | 252 | 215 | 467 | 11 |
| HD | 73 | 99 | 173 | 10 |
| ALS | 470 | 691 | 1161 | 8 |
| ∑ | 982 | 1199 | 2181 | 40 (39 *) |
| Proteome | Case | Control | Sum of samples | Studies |
|---|---|---|---|---|
| AD | 853 | 444 | 1297 | 9 |
| PD | 146 | 167 | 313 | 7 |
| HD | 39 | 29 | 68 | 5 |
| ALS | 162 | 129 | 291 | 3 |
| ∑ | 1200 | 769 | 1969 | 24 (22 *) |
| NDD | AD-PD | AD-ALS | AD-HD | PD-ALS | PD-HD | ALS-HD |
|---|---|---|---|---|---|---|
| p-value | 0.0001185 | 0.000131 | <2.2 × 10⁻¹⁶ | 0.5887 | 2.422 × 10⁻⁶ | 0.0002744 |
| Correlation | 0.320714 | 0.3187755 | 0.6566416 | 0.04625543 | 0.387635 | 0.3040112 |
Publisher’s Note: MDPI stays neutral with regard to jurisdictional claims in published maps and institutional affiliations. |
© 2020 by the authors. Licensee MDPI, Basel, Switzerland. This article is an open access article distributed under the terms and conditions of the Creative Commons Attribution (CC BY) license (http://creativecommons.org/licenses/by/4.0/).
Share and Cite
Ruffini, N.; Klingenberg, S.; Schweiger, S.; Gerber, S. Common Factors in Neurodegeneration: A Meta-Study Revealing Shared Patterns on a Multi-Omics Scale. Cells 2020, 9, 2642. https://doi.org/10.3390/cells9122642
Ruffini N, Klingenberg S, Schweiger S, Gerber S. Common Factors in Neurodegeneration: A Meta-Study Revealing Shared Patterns on a Multi-Omics Scale. Cells. 2020; 9(12):2642. https://doi.org/10.3390/cells9122642
Chicago/Turabian StyleRuffini, Nicolas, Susanne Klingenberg, Susann Schweiger, and Susanne Gerber. 2020. "Common Factors in Neurodegeneration: A Meta-Study Revealing Shared Patterns on a Multi-Omics Scale" Cells 9, no. 12: 2642. https://doi.org/10.3390/cells9122642
APA StyleRuffini, N., Klingenberg, S., Schweiger, S., & Gerber, S. (2020). Common Factors in Neurodegeneration: A Meta-Study Revealing Shared Patterns on a Multi-Omics Scale. Cells, 9(12), 2642. https://doi.org/10.3390/cells9122642