Predicted Archaic 3D Genome Organization Reveals Genes Related to Head and Spinal Cord Separating Modern from Archaic Humans


Abstract
1. Introduction
2. Materials and Methods
3. Results
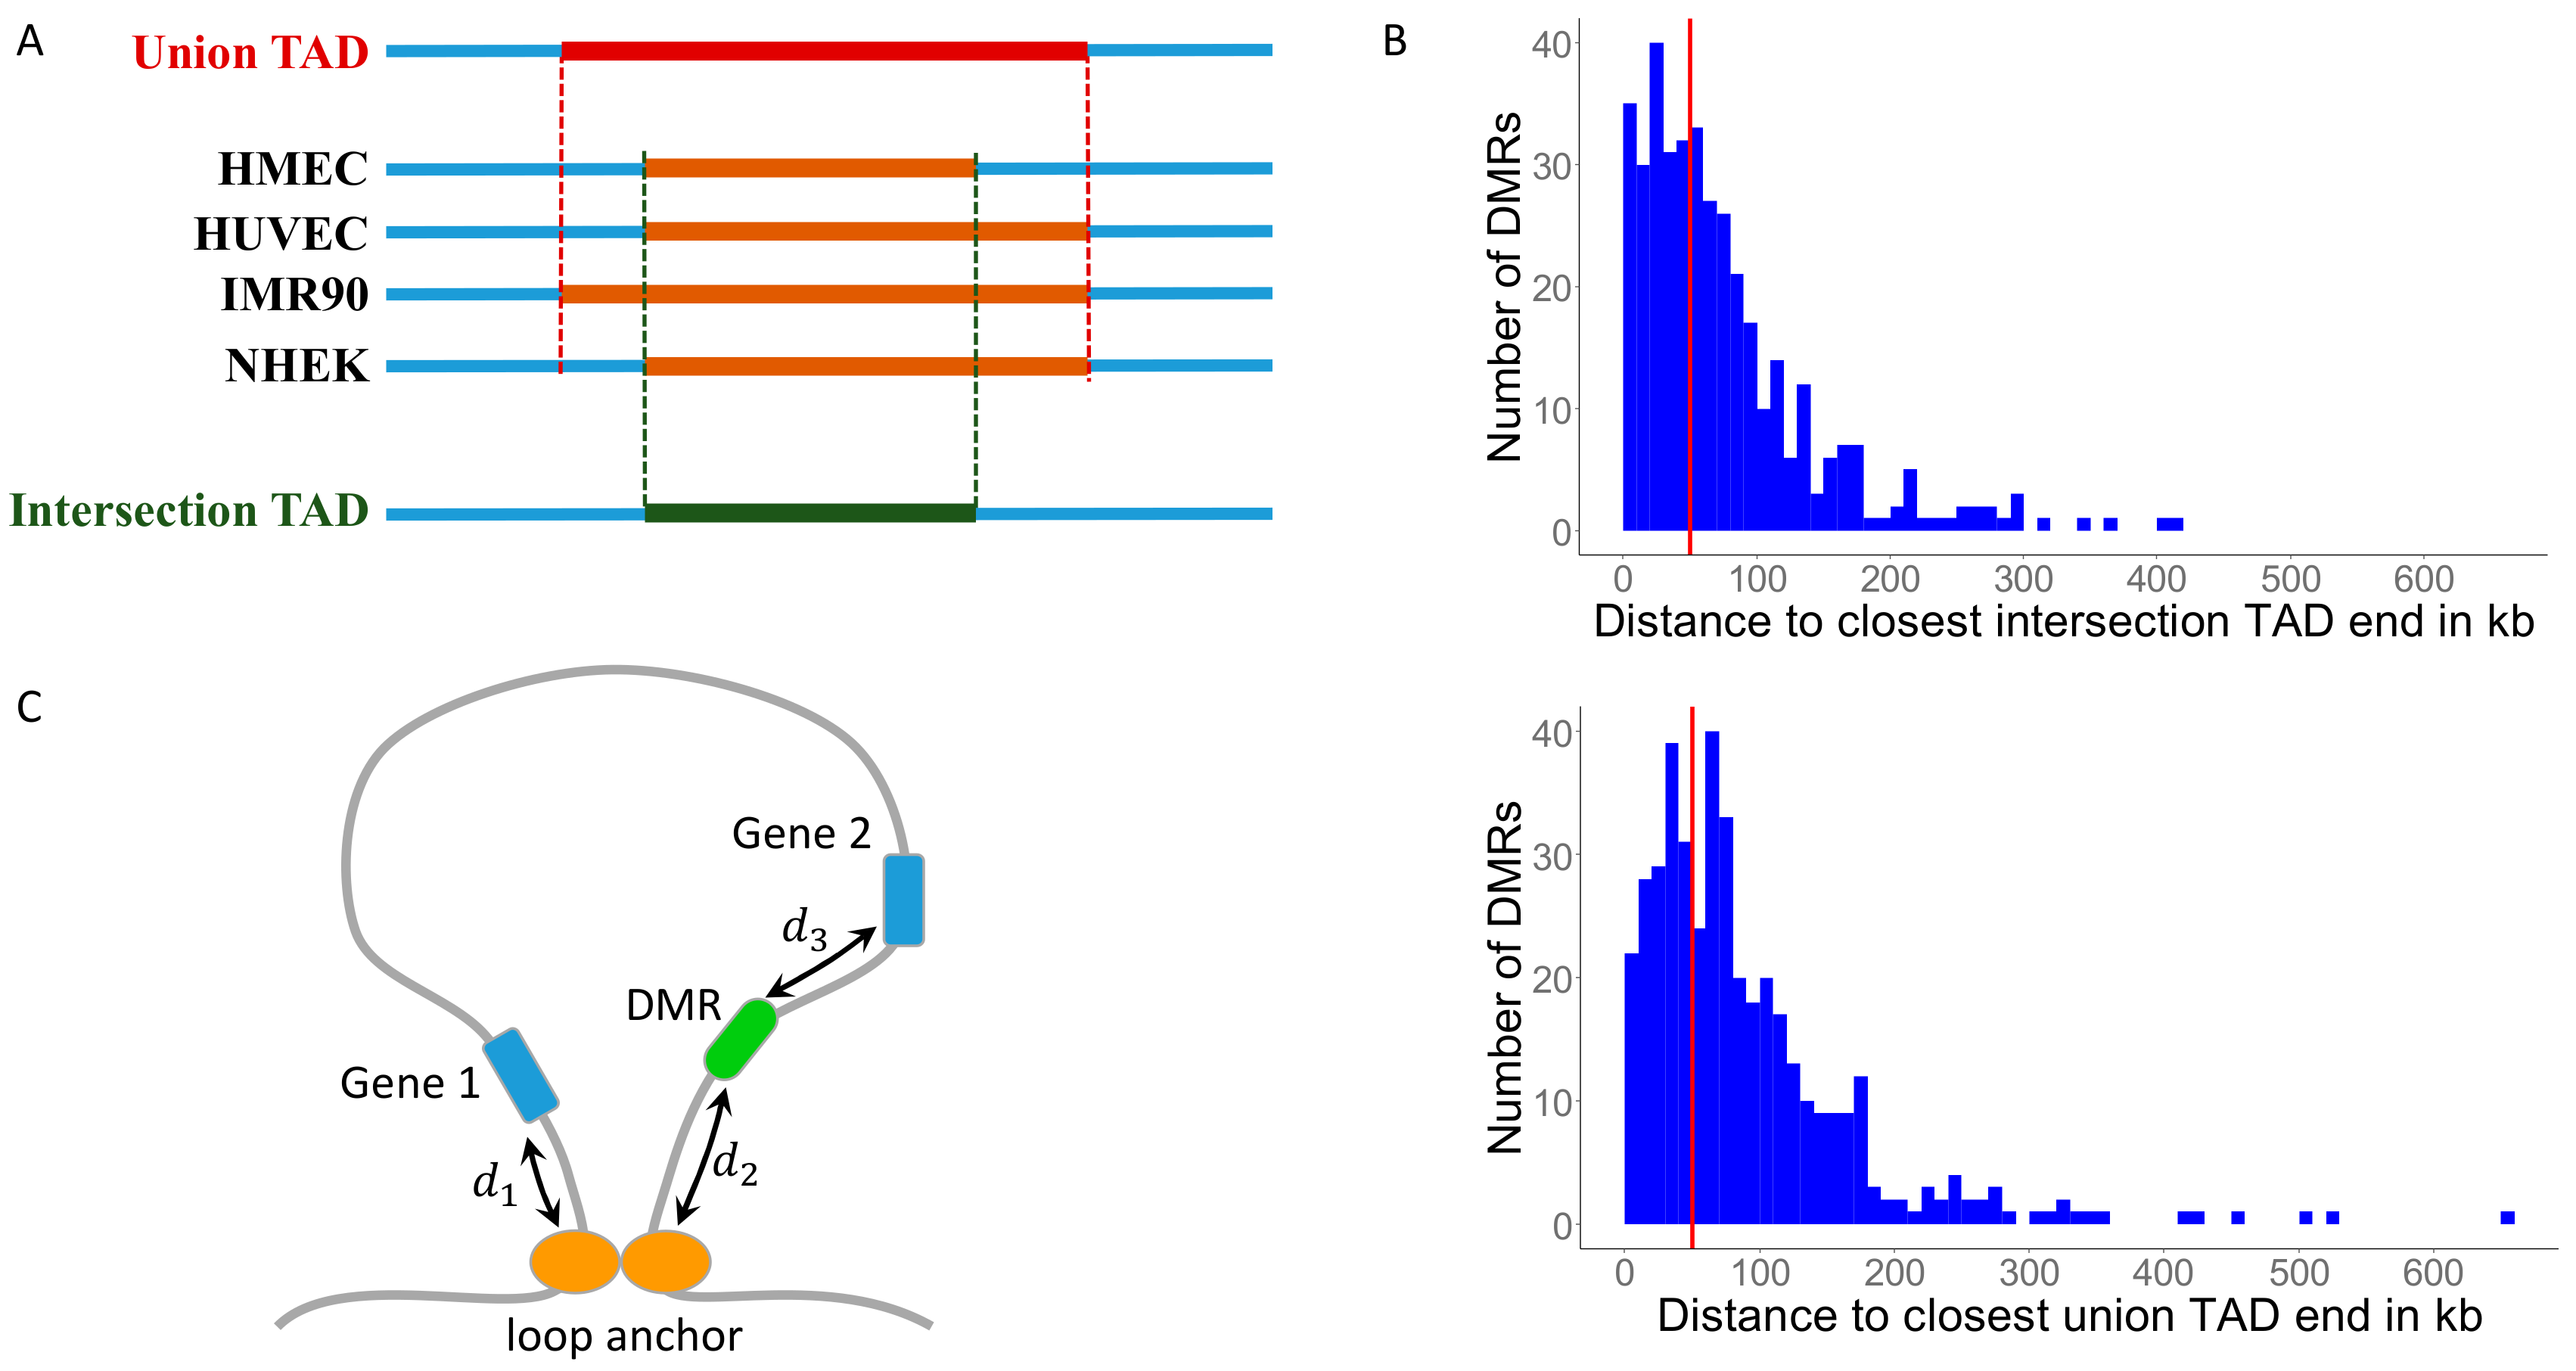
3.1. Identifying Conserved Topologically Associating Domains (TADs)
3.2. MH-Derived DMRs Tend to Reside Inside TADs
3.3. MH-Derived DMRs Inside TADs Tend to Reside Closer to the Conserved TAD Ends
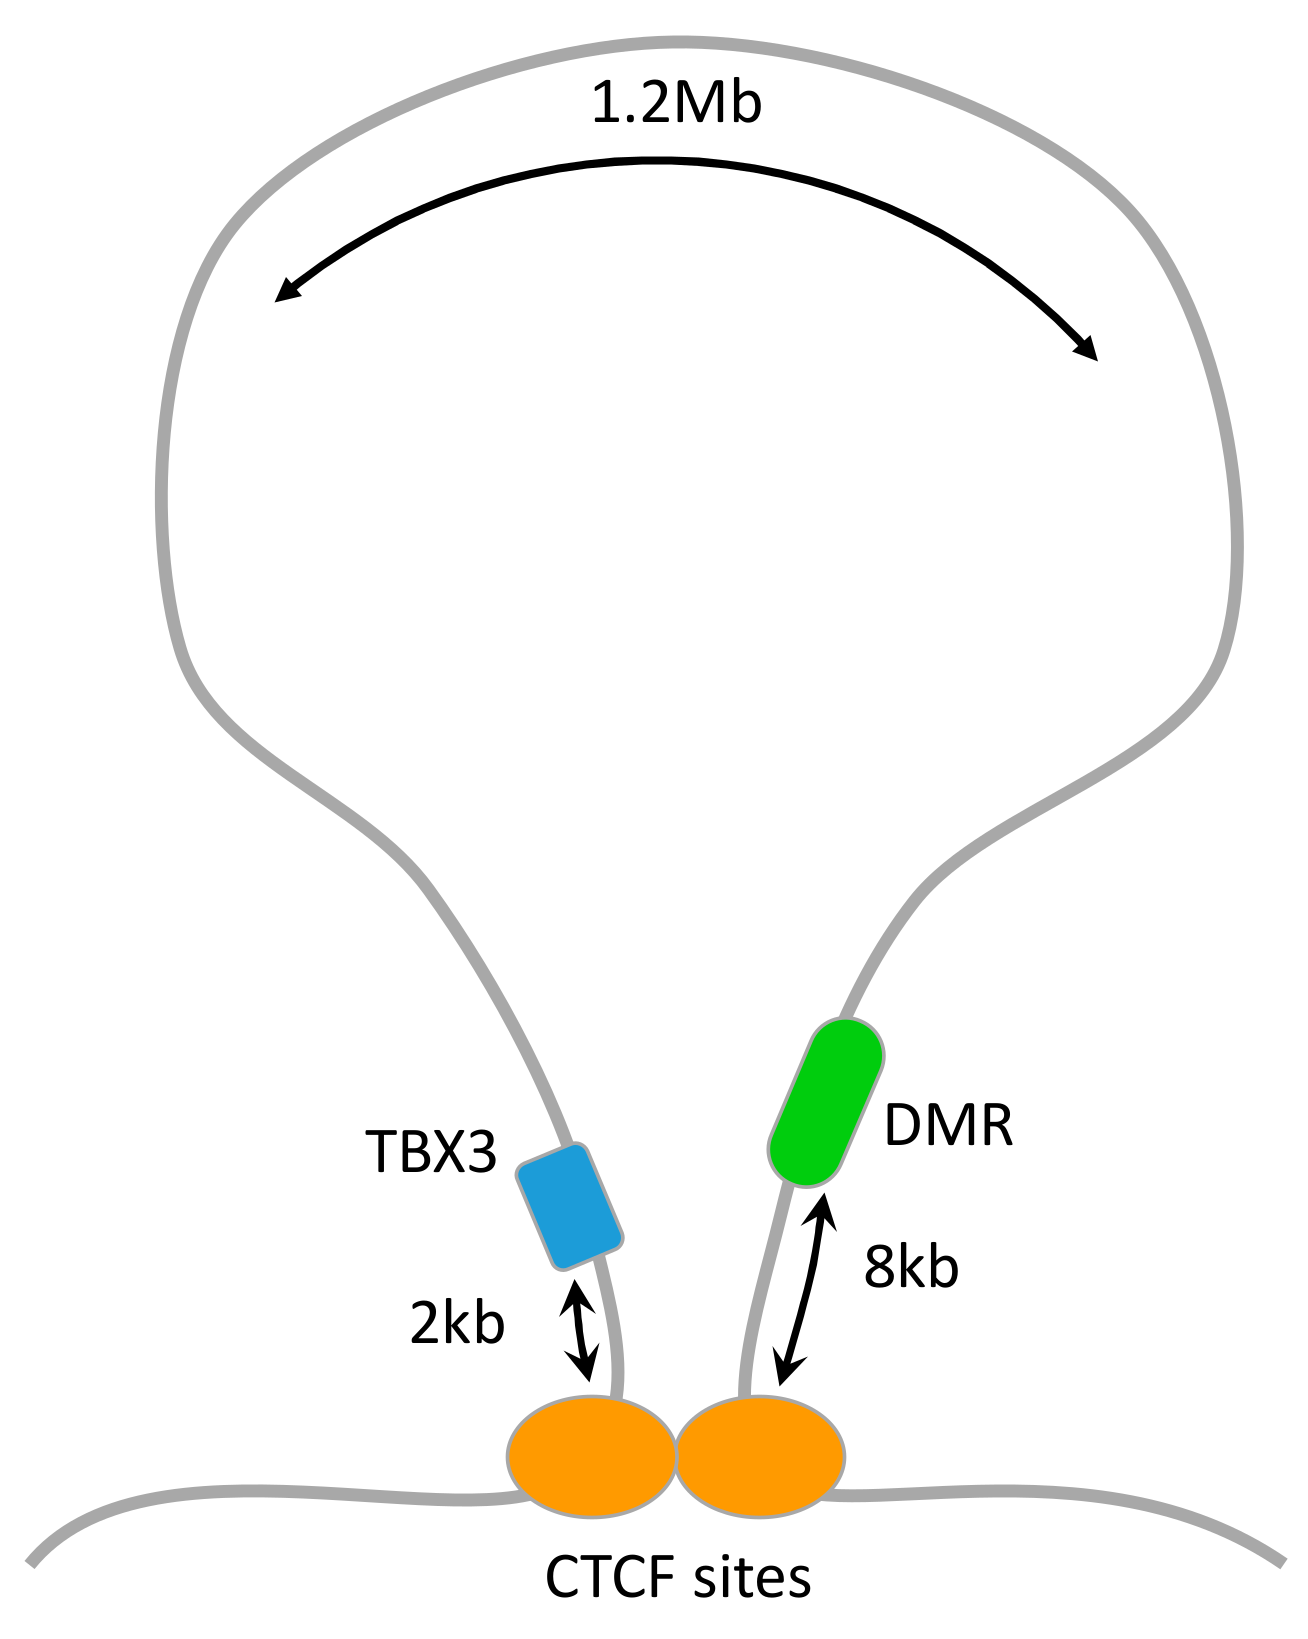
3.4. Mapping DMRs to Genes
4. Discussion
Supplementary Materials
Author Contributions
Funding
Conflicts of Interest
References
- Dor, Y.; Cedar, H. Principles of DNA methylation and their implications for biology and medicine. Lancet 2018, 392, 777–786. [Google Scholar] [CrossRef]
- Aran, D.; Sabato, S.; Hellman, A. DNA methylation of distal regulatory sites characterizes dysregulation of cancer genes. Genome Biol. 2013, 14, R21. [Google Scholar] [CrossRef]
- Jones, P.A. Functions of DNA methylation: Islands, start sites, gene bodies and beyond. Nat. Rev. Genet. 2012, 13, 484–492. [Google Scholar] [CrossRef] [PubMed]
- Razin, A. CpG methylation, chromatin structure and gene silencing - A three-way connection. EMBO J. 1998, 17, 4905–4908. [Google Scholar] [CrossRef] [PubMed]
- Matharu, N.K.; Ahanger, S.H. Chromatin insulators and topological domains: Adding new dimensions to 3D genome architecture. Genes 2015, 6, 790–811. [Google Scholar] [CrossRef]
- Rao, S.S.P.; Huntley, M.H.; Durand, N.C.; Elena, K.; Bochkov, I.D.; Robinson, J.T.; Sanborn, A.; Omer, A.D.; Lander, E.S.; Aiden, E.L.; et al. A 3D map of the human genome at kilobase resolution reveals principles of chromatin looping. Cell 2014, 159, 1665–1680. [Google Scholar] [CrossRef]
- Smith, E.M.; Lajoie, B.R.; Jain, G.; Dekker, J. Invariant TAD boundaries constrain cell-type-specific looping interactions between promoters and distal elements around the CFTR locus. Am. J. Hum. Genet. 2016, 98, 185–201. [Google Scholar] [CrossRef]
- King, M.C.; Wilson, A.C. Evolution at two levels in humans and chimpanzees. Science 1975, 188, 107–116. [Google Scholar] [CrossRef]
- Hernando-Herraez, I.; Garcia-Perez, R.; Sharp, A.J.; Marques-Bonet, T. DNA methylation: Insights into human evolution. PLOS Genet. 2015, 11, e1005661. [Google Scholar] [CrossRef]
- Gokhman, D.; Lavi, E.; Prüfer, K.; Fraga, M.F.; Riancho, J.A.; Kelso, J.; Pääbo, S.; Meshorer, E.; Carmel, L. Reconstructing the DNA methylation maps of the Neandertal and the Denisovan. Science 2014, 344, 523–527. [Google Scholar] [CrossRef]
- Gokhman, D.; Kelman, G.; Amartely, A.; Gershon, G.; Tsur, S.; Carmel, L. Gene ORGANizer: Linking genes to the organs they affect. Nucleic Acids Res. 2017, 45, W138–W145. [Google Scholar] [CrossRef]
- Harrow, J.; Frankish, A.; Gonzalez, J.M.; Tapanari, E.; Diekhans, M.; Kokocinski, F.; Aken, B.L.; Barrell, D.; Zadissa, A.; Searle, S.; et al. GENCODE: The reference human genome annotation for the ENCODE project. Genome Res. 2012, 22, 1760–1774. [Google Scholar] [CrossRef]
- Gokhman, D.; Agranat-Tamir, L.; Housman, G.; Garcia-Perez, R.; Nissim-Rafinia, M.; Mallick, S.; Nieves-Colón, M.; Li, H.; Alpaslan-Roodenberg, S.; Novak, M.; et al. Extensive regulatory changes in genes affecting vocal and facial anatomy separate modern from archaic humans. bioRxiv 2017, 106955. [Google Scholar]
- Gokhman, D.; Mishol, N.; de Manuel, M.; de Juan, D.; Shuqrun, J.; Meshorer, E.; Marques-Bonet, T.; Rak, Y.; Carmel, L. Reconstructing denisovan anatomy using DNA methylation maps. Cell 2019, 179, 180–192. [Google Scholar] [CrossRef]
- Davenport, T.G.; Jerome-Majewska, L.A.; Papaioannou, V.E. Mammary gland, limb and yolk sac defects in mice lacking Tbx3, the gene mutated in human ulnar mammary syndrome. Development 2003, 130, 2263–2273. [Google Scholar] [CrossRef]
- Marshall, S.D.; Low, L.E.; Holton, N.E.; Franciscus, R.G.; Frazier, M.; Qian, F.; Mann, K.; Schneider, G.; Scott, J.E.; Southard, T.E. Chin development as a result of differential jaw growth. Am. J. Orthod. Dentofac. Orthop. 2011, 139, 456–464. [Google Scholar] [CrossRef]
- Schwartz, J.H.; Tattersall, I. The human chin revisited: What is it and who has it? J. Hum. Evol. 2000, 38, 367–409. [Google Scholar] [CrossRef]
- Campeau, P.M.; Lenk, G.M.; Lu, J.T.; Bae, Y.; Burrage, L.; Turnpenny, P.; Román Corona-Rivera, J.; Morandi, L.; Mora, M.; Reutter, H.; et al. Yunis-Varón syndrome is caused by mutations in FIG4, encoding a phosphoinositide phosphatase. Am. J. Hum. Genet. 2013, 92, 781–791. [Google Scholar] [CrossRef]
- Dao, D.Y.; Yang, X.; Flick, L.M.; Chen, D.; Hilton, M.J.; O’Keefe, R.J. Axin2 regulates chondrocyte maturation and axial skeletal development. J. Orthop. Res. 2010, 28, 89–95. [Google Scholar] [CrossRef]
- Türkmen, S.; Spielmann, M.; Güneş, N.; Knaus, A.; Flöttmann, R.; Mundlos, S.; Tüysüz, B. A novel de novo FZD2 mutation in a patient with autosomal dominant omodysplasia. Mol. Syndromol. 2017, 8, 318–324. [Google Scholar] [CrossRef]
- Sánchez, A.I.; Rojas, J.A. A SMARCA2 mutation in the first case report of Nicolaides-Baraitser Syndrome in Latin America: Genotype-phenotype correlation. Case Rep. Genet. 2017, 2017, 1–4. [Google Scholar] [CrossRef] [PubMed]
- Weber, J.; Pusch, C.M. The lumbar spine in Neanderthals shows natural kyphosis. Eur. Spine J. 2008, 17, 327–330. [Google Scholar] [CrossRef] [PubMed]
- Li, G.; Ruan, X.; Auerbach, R.K.; Sandhu, K.S.; Zheng, M.; Wang, P.; Poh, H.M.; Goh, Y.; Lim, J.; Zhang, J.; et al. Extensive promoter-centered chromatin interactions provide a topological basis for transcription regulation. Cell 2012, 148, 84–98. [Google Scholar] [CrossRef] [PubMed]


| Organ Name | Results Reported in Gokhman, et al., (2017) [11] | Intersection-TAD | Union-TAD | ||||||||||||
|---|---|---|---|---|---|---|---|---|---|---|---|---|---|---|---|
| Enrichment Ratio | Observed | Expected | p-Value | FDR | Enrichment Ratio | Observed | Expected | p-Value | FDR | Enrichment Ratio | Observed | Expected | p-Value | FDR | |
| face | 1.291 | 80 | 61.975 | 0 | 0.02 | 1.315 | 89 | 67.656 | 0 | 0.006 | 1.315 | 89 | 67.656 | 0 | 0.006 |
| forehead | 1.568 | 48 | 30.61 | 0 | 0.017 | 1.586 | 53 | 33.416 | 0 | 0.006 | 1.586 | 53 | 33.416 | 0 | 0.006 |
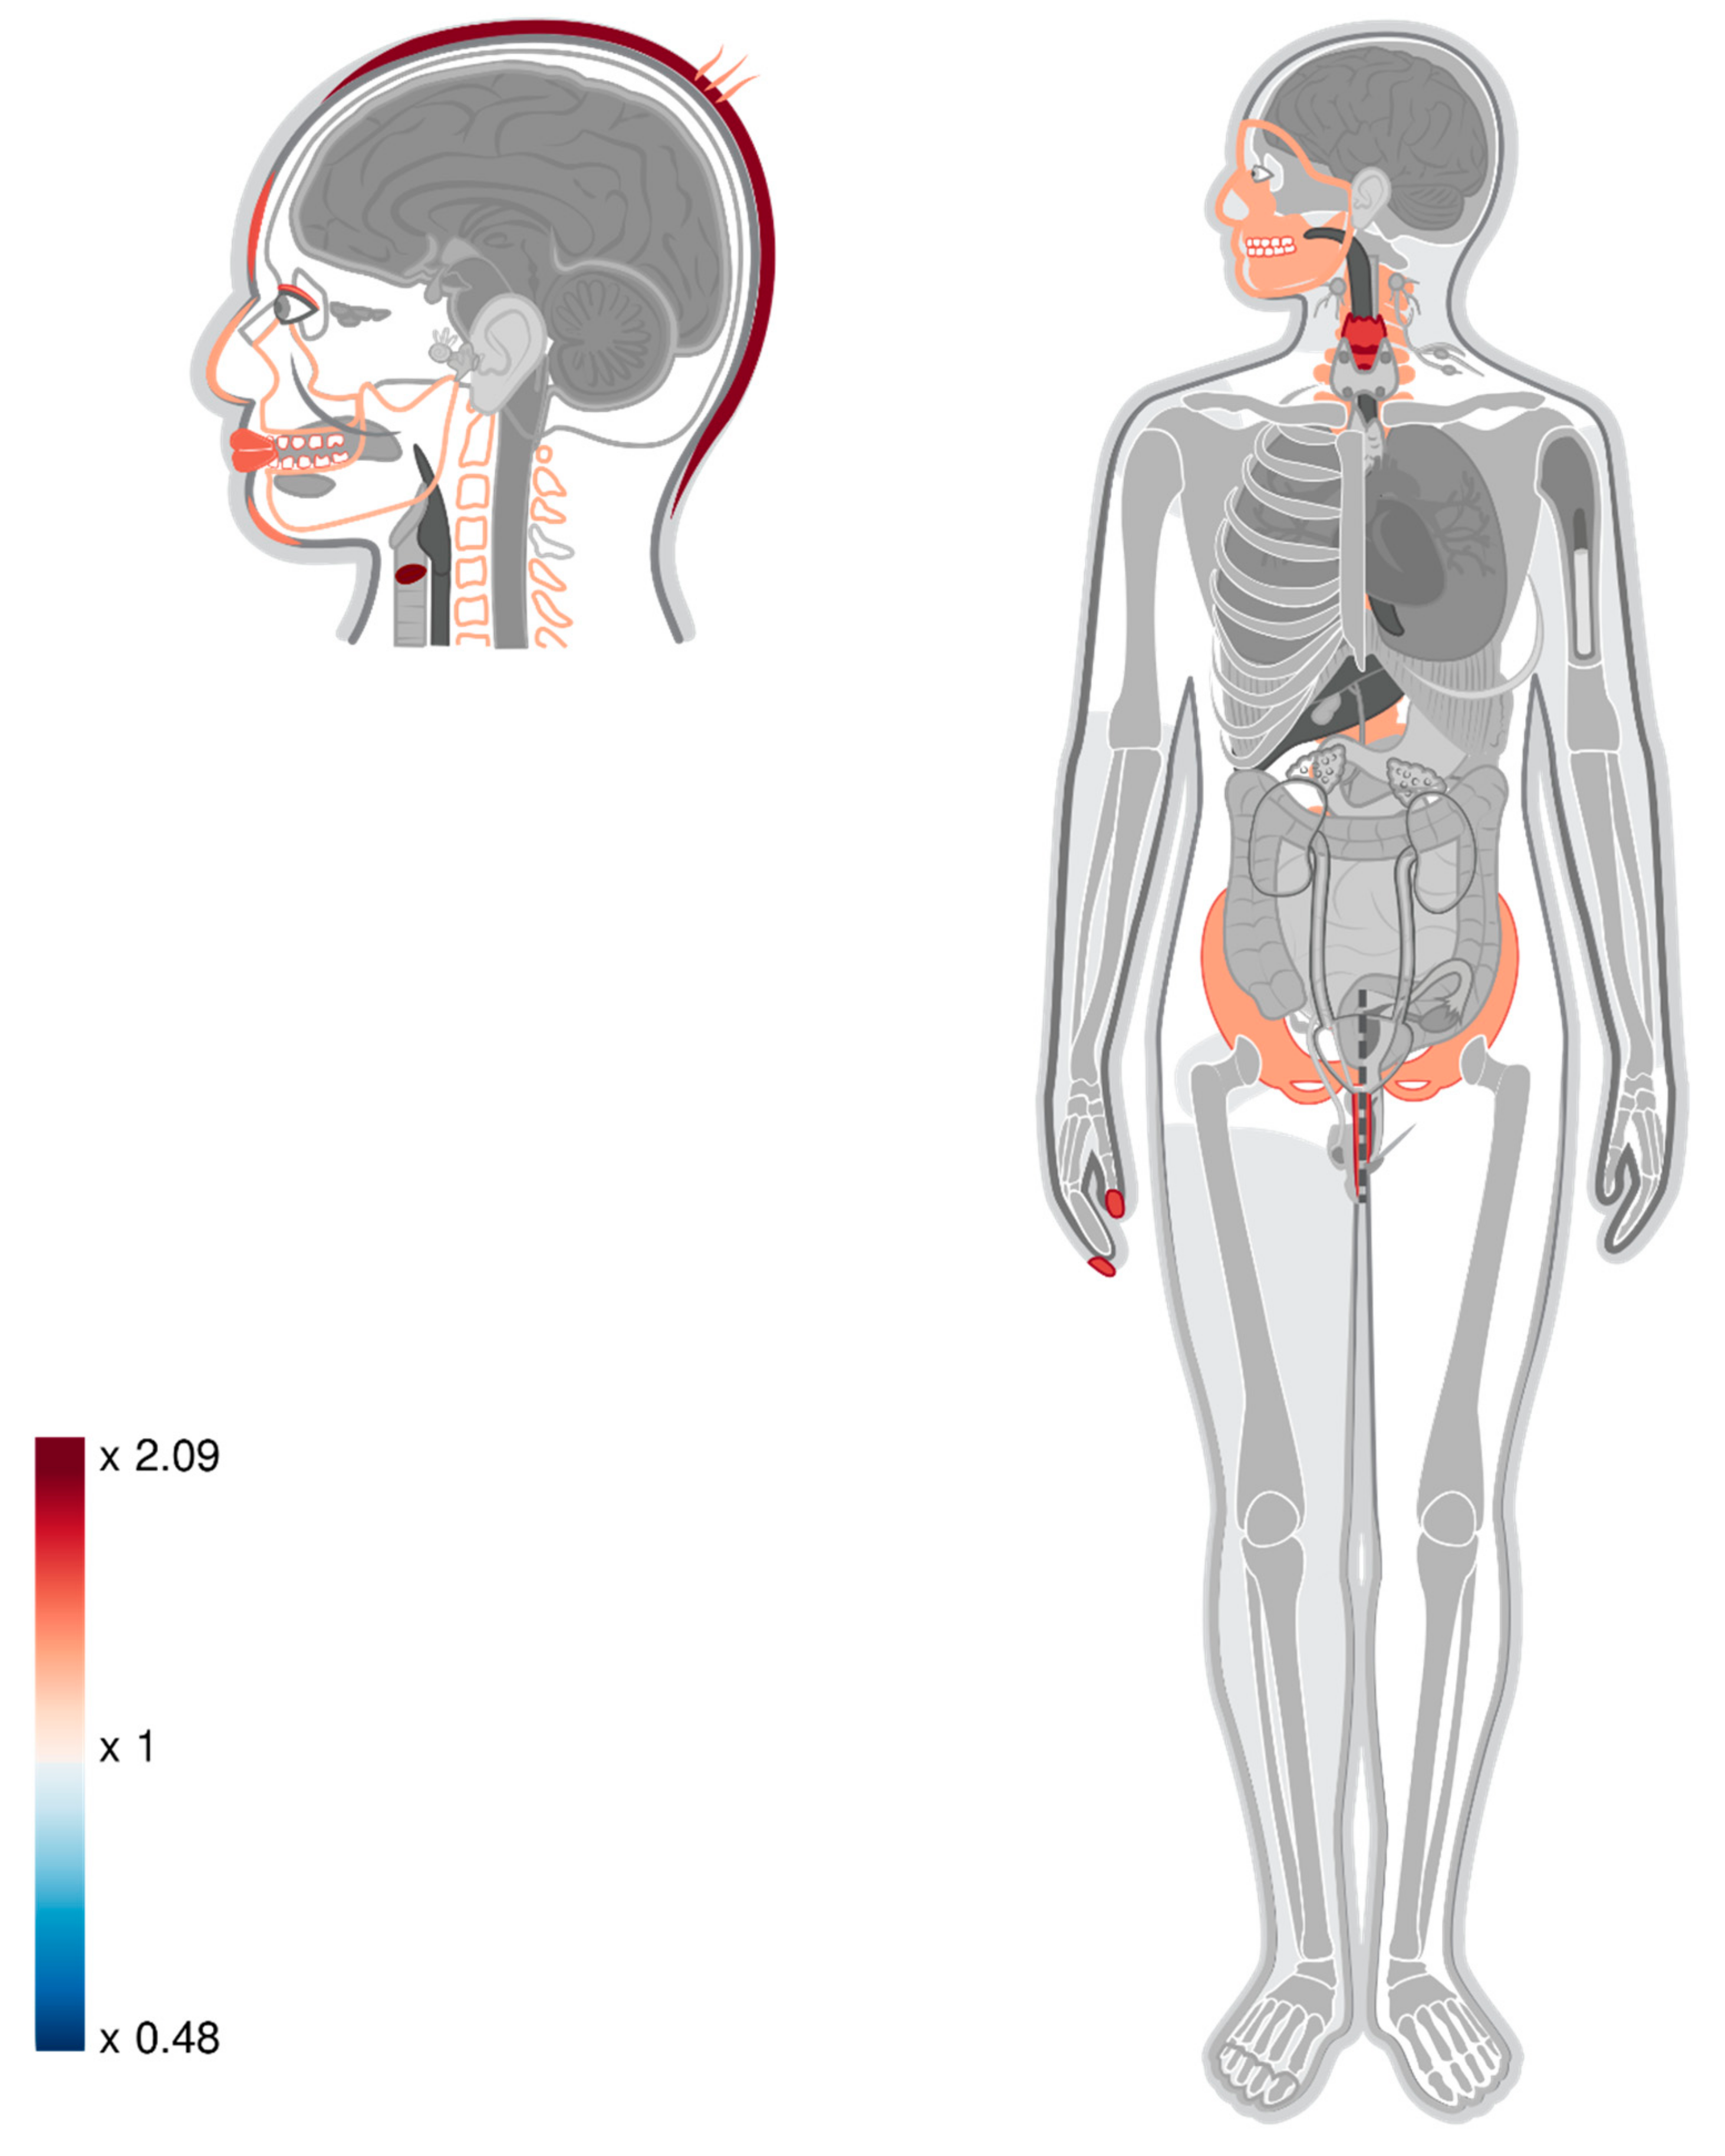
| vocal cords | 2.109 | 25 | 11.852 | 0 | 0.017 | 2.087 | 27 | 12.939 | 0 | 0.006 | 2.009 | 26 | 12.939 | 0 | 0.011 |
| lips | 1.465 | 46 | 31.4 | 0.002 | 0.046 | 1.517 | 52 | 34.278 | 0 | 0.012 | 1.546 | 53 | 34.278 | 0 | 0.008 |
| eyelid | 1.386 | 52 | 37.515 | 0.003 | 0.046 | 1.416 | 58 | 40.954 | 0.001 | 0.021 | 1.416 | 58 | 40.954 | 0.001 | 0.023 |
| teeth | 1.528 | 40 | 26.178 | 0.002 | 0.046 | 1.54 | 44 | 28.578 | 0.001 | 0.021 | 1.505 | 43 | 28.578 | 0.002 | 0.033 |
| hair | 1.316 | 49 | 37.24 | 0.012 | 0.1 | 1.377 | 56 | 40.654 | 0.002 | 0.029 | 1.353 | 55 | 40.654 | 0.004 | 0.04 |
| maxilla | 1.301 | 65 | 49.951 | 0.003 | 0.046 | 1.302 | 71 | 54.53 | 0.002 | 0.029 | 1.284 | 70 | 54.53 | 0.003 | 0.04 |
| jaws | 1.291 | 65 | 50.329 | 0.004 | 0.046 | 1.292 | 71 | 54.943 | 0.002 | 0.029 | 1.274 | 70 | 54.943 | 0.004 | 0.04 |
| nails | 1.602 | 30 | 18.723 | 0.004 | 0.048 | 1.615 | 33 | 20.439 | 0.002 | 0.029 | 1.566 | 32 | 20.439 | 0.005 | 0.04 |
| larynx | 1.682 | 29 | 17.246 | 0.002 | 0.046 | 1.647 | 31 | 18.827 | 0.003 | 0.029 | 1.593 | 30 | 18.827 | 0.005 | 0.04 |
| pelvis | 1.335 | 58 | 43.458 | 0.003 | 0.046 | 1.328 | 63 | 47.442 | 0.003 | 0.029 | 1.349 | 64 | 47.442 | 0.002 | 0.033 |
| spinal column | 1.296 | 57 | 43.974 | 0.008 | 0.069 | 1.312 | 63 | 48.005 | 0.004 | 0.032 | 1.333 | 64 | 48.005 | 0.002 | 0.033 |
| mandible | 1.276 | 64 | 50.157 | 0.006 | 0.055 | 1.278 | 70 | 54.755 | 0.004 | 0.032 | 1.26 | 69 | 54.755 | 0.006 | 0.049 |
| nose | 1.325 | 55 | 41.5 | 0.006 | 0.055 | 1.324 | 60 | 45.304 | 0.004 | 0.032 | 1.346 | 61 | 45.304 | 0.002 | 0.033 |
| scalp | 1.811 | 14 | 7.73 | 0.02 | 0.134 | 2.015 | 17 | 8.438 | 0.004 | 0.032 | 2.015 | 17 | 8.438 | 0.004 | 0.04 |
| urethra | 1.365 | 22 | 16.112 | 0.067 | 0.22 | 1.592 | 28 | 17.589 | 0.007 | 0.049 | 1.535 | 27 | 17.589 | 0.012 | 0.08 |
© 2019 by the authors. Licensee MDPI, Basel, Switzerland. This article is an open access article distributed under the terms and conditions of the Creative Commons Attribution (CC BY) license (http://creativecommons.org/licenses/by/4.0/).
Share and Cite
Batyrev, D.; Lapid, E.; Carmel, L.; Meshorer, E. Predicted Archaic 3D Genome Organization Reveals Genes Related to Head and Spinal Cord Separating Modern from Archaic Humans. Cells 2020, 9, 48. https://doi.org/10.3390/cells9010048
Batyrev D, Lapid E, Carmel L, Meshorer E. Predicted Archaic 3D Genome Organization Reveals Genes Related to Head and Spinal Cord Separating Modern from Archaic Humans. Cells. 2020; 9(1):48. https://doi.org/10.3390/cells9010048
Chicago/Turabian StyleBatyrev, Daniel, Elisheva Lapid, Liran Carmel, and Eran Meshorer. 2020. "Predicted Archaic 3D Genome Organization Reveals Genes Related to Head and Spinal Cord Separating Modern from Archaic Humans" Cells 9, no. 1: 48. https://doi.org/10.3390/cells9010048
APA StyleBatyrev, D., Lapid, E., Carmel, L., & Meshorer, E. (2020). Predicted Archaic 3D Genome Organization Reveals Genes Related to Head and Spinal Cord Separating Modern from Archaic Humans. Cells, 9(1), 48. https://doi.org/10.3390/cells9010048