Distribution of Killer-Cell Immunoglobulin-Like Receptor Genes and Combinations of Their Human Leucocyte Antigen Ligands in 11 Ethnic Populations in China


Abstract
1. Introduction
2. Material and Methods
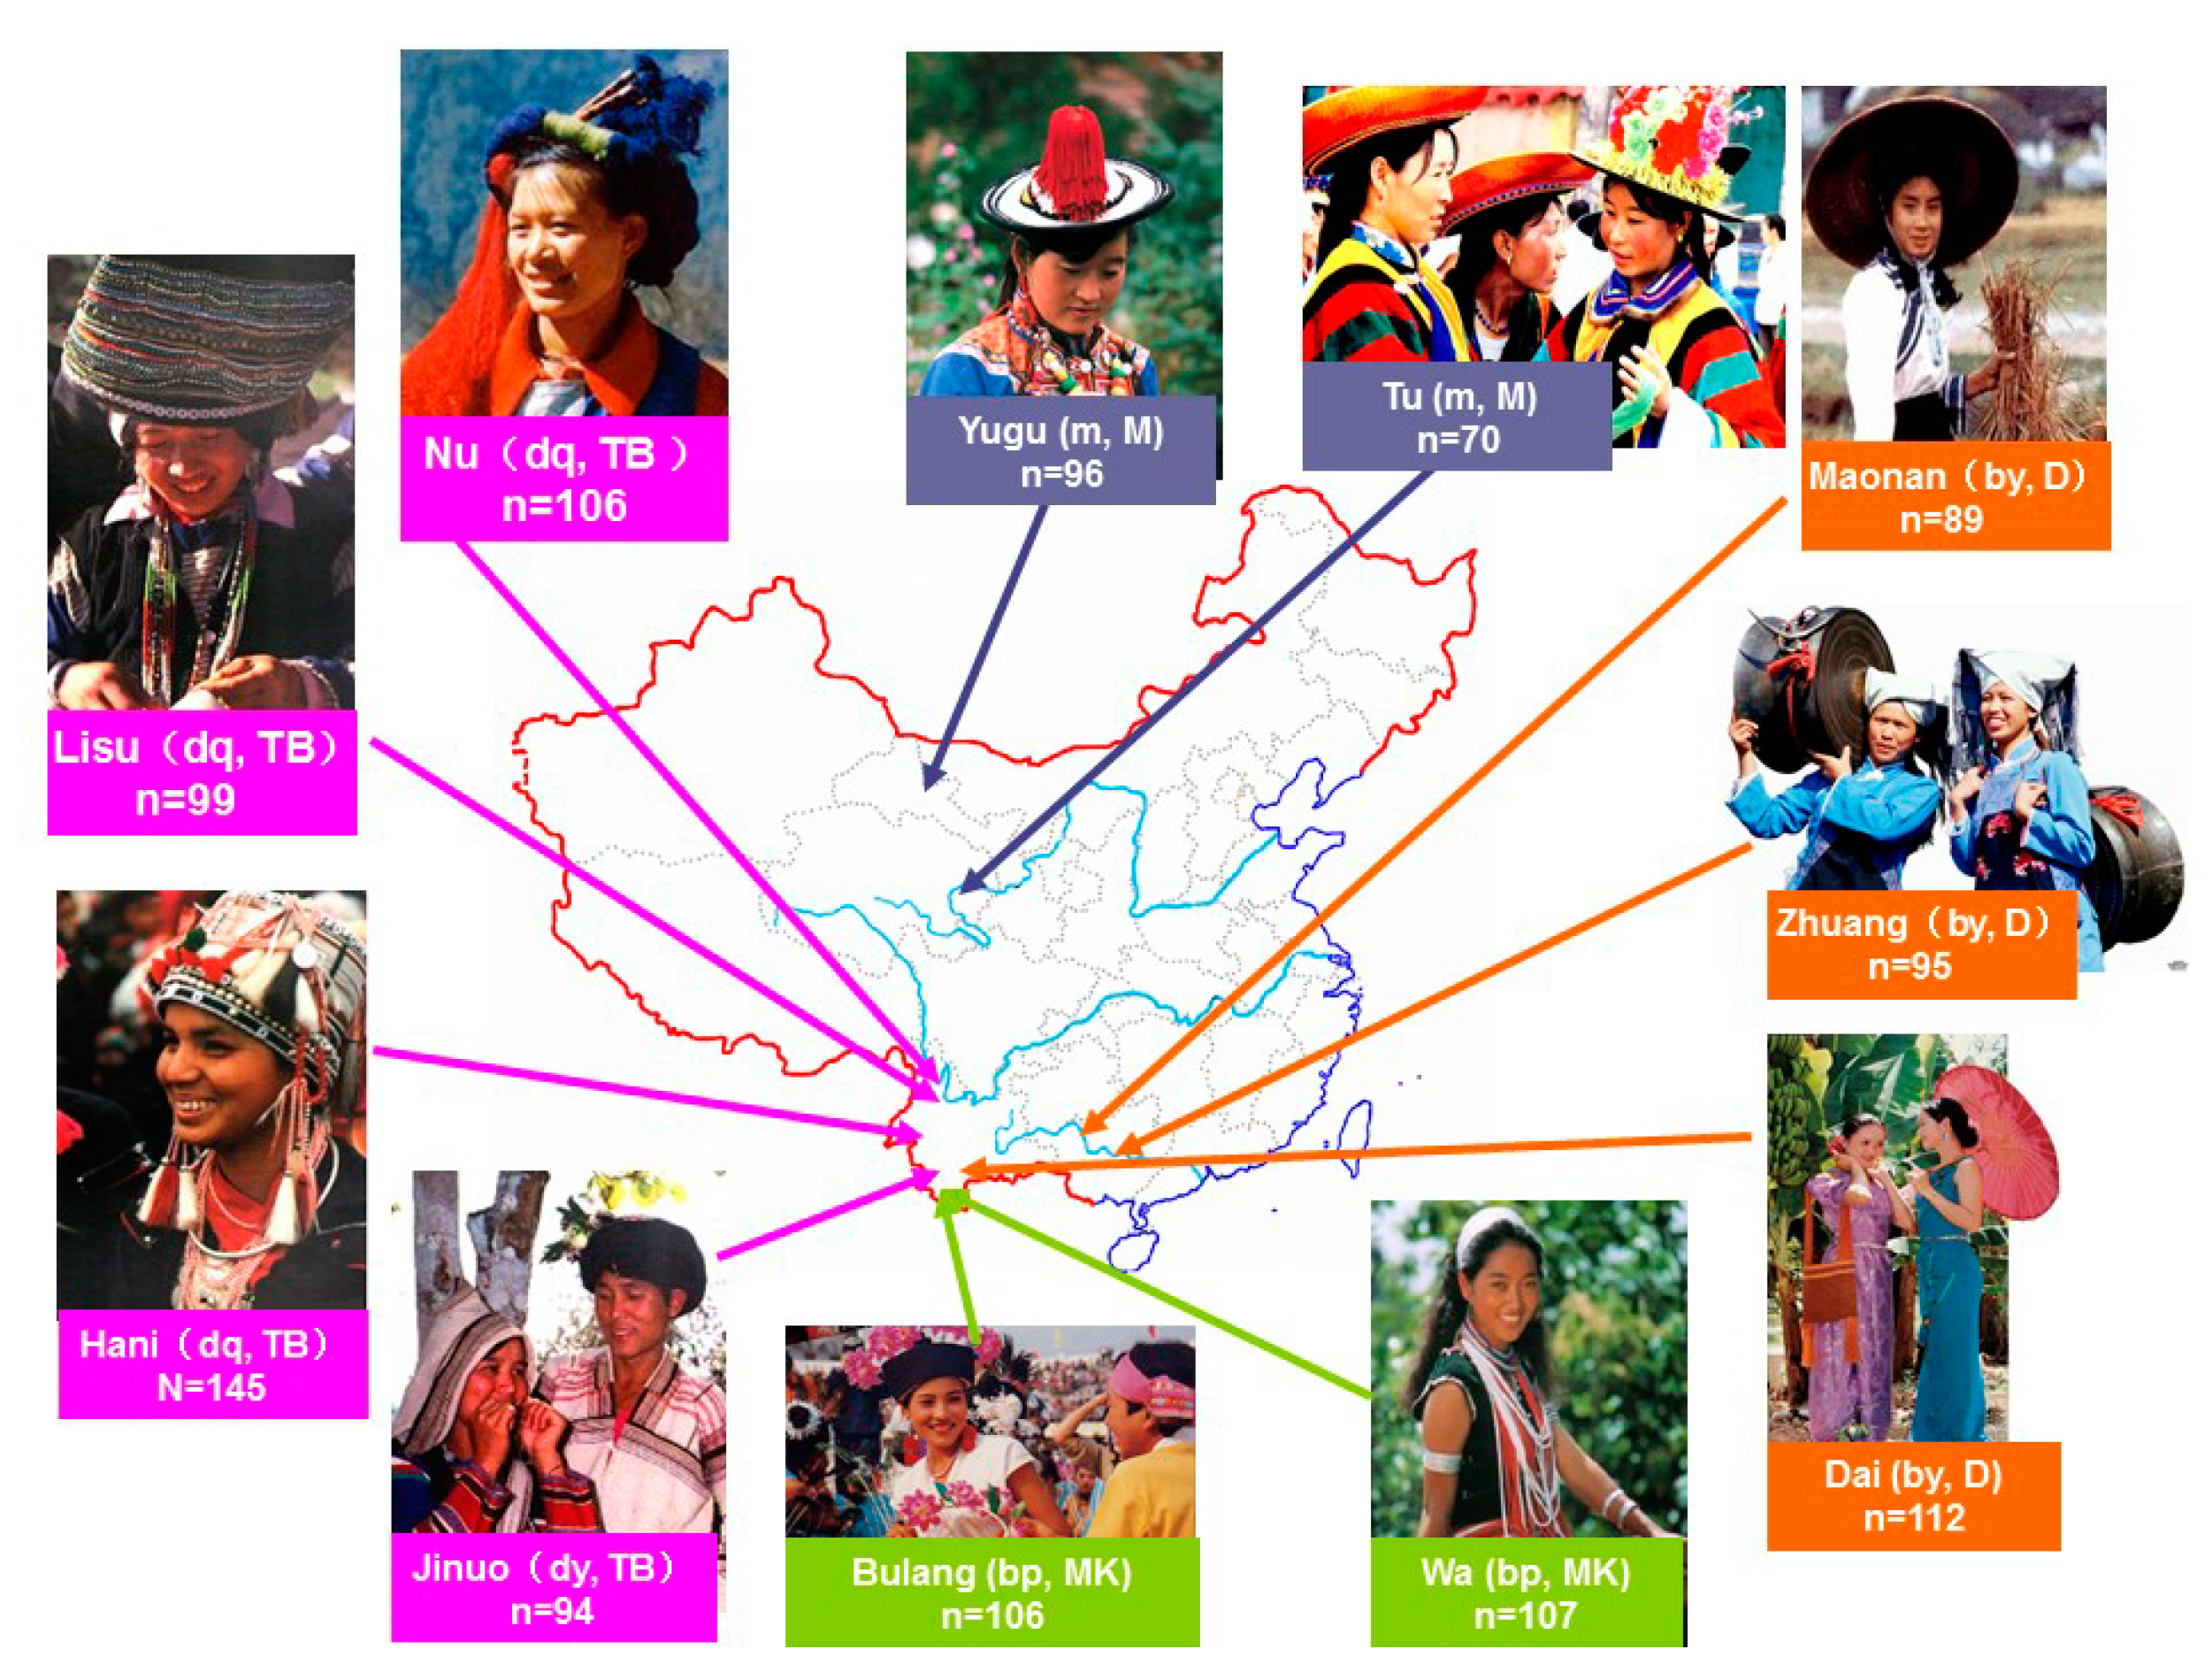
2.1. Subject and Samples
2.2. KIR Genotyping
2.3. Statistical Analysis
3. Results
3.1. KIR Gene, Genotype, and Haplotype Frequencies
3.2. HLA Allotype Frequencies
3.3. KIR–HLA Combination
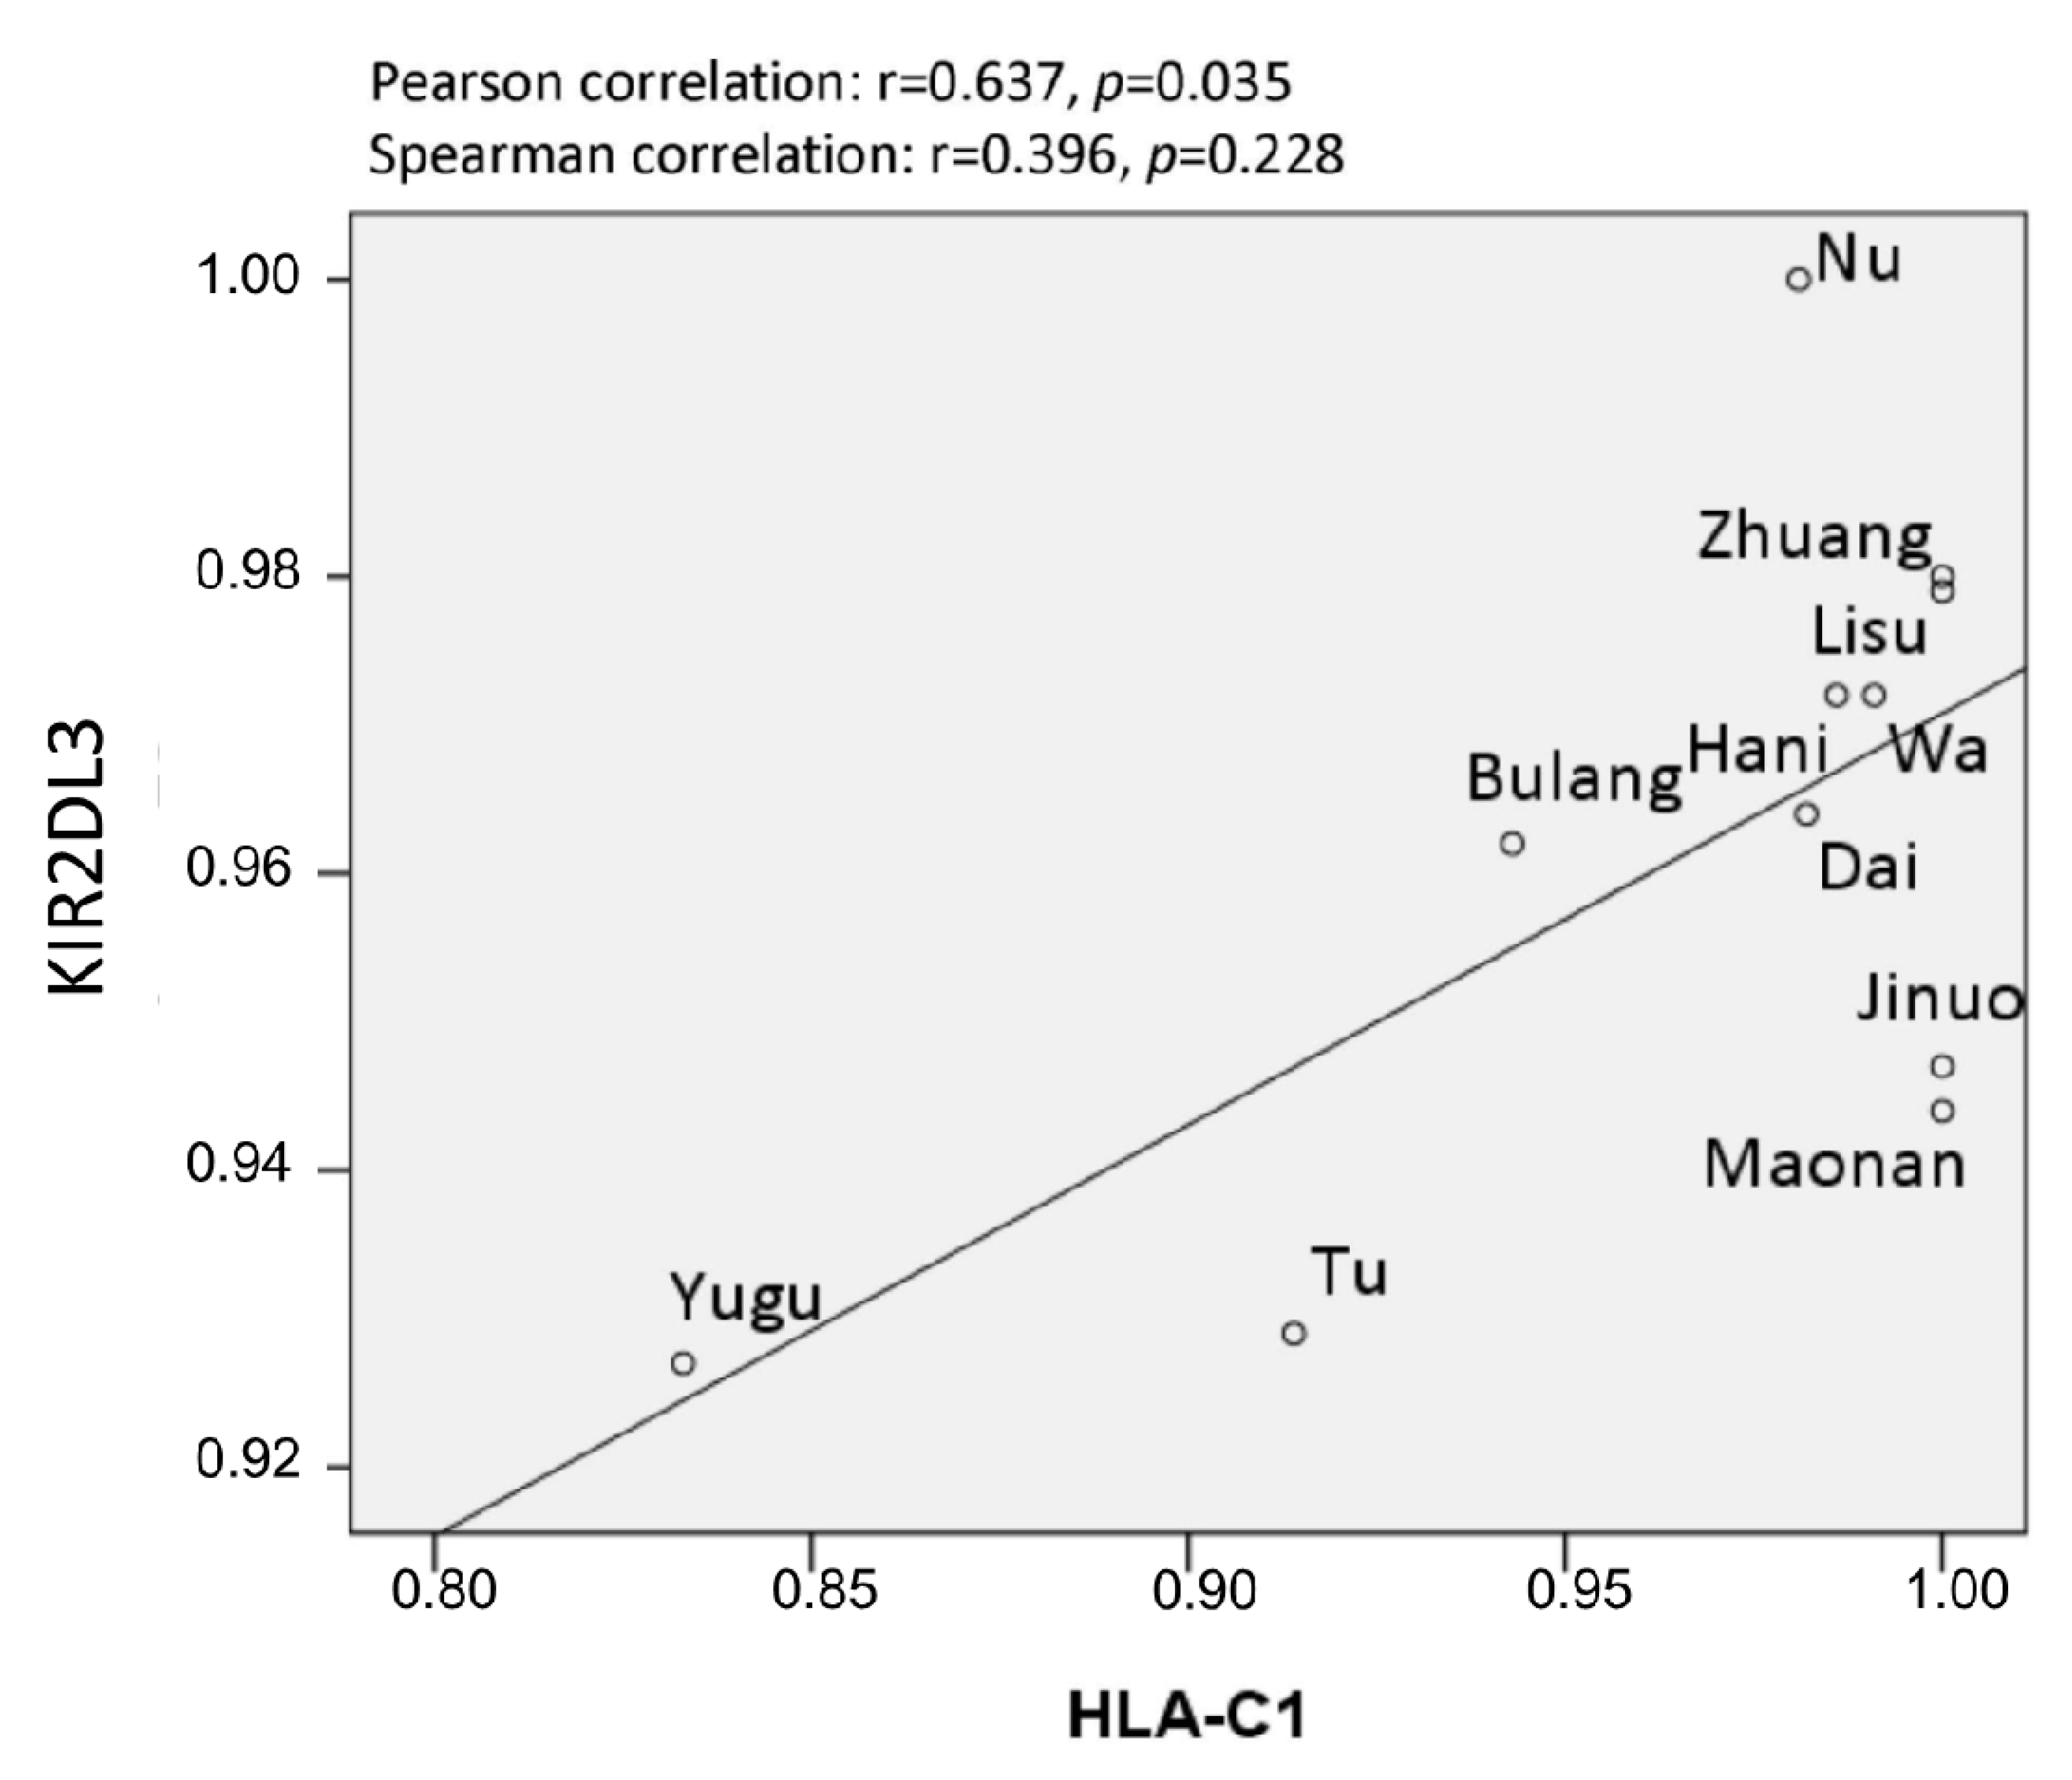
3.4. HLA/KIR Correlation
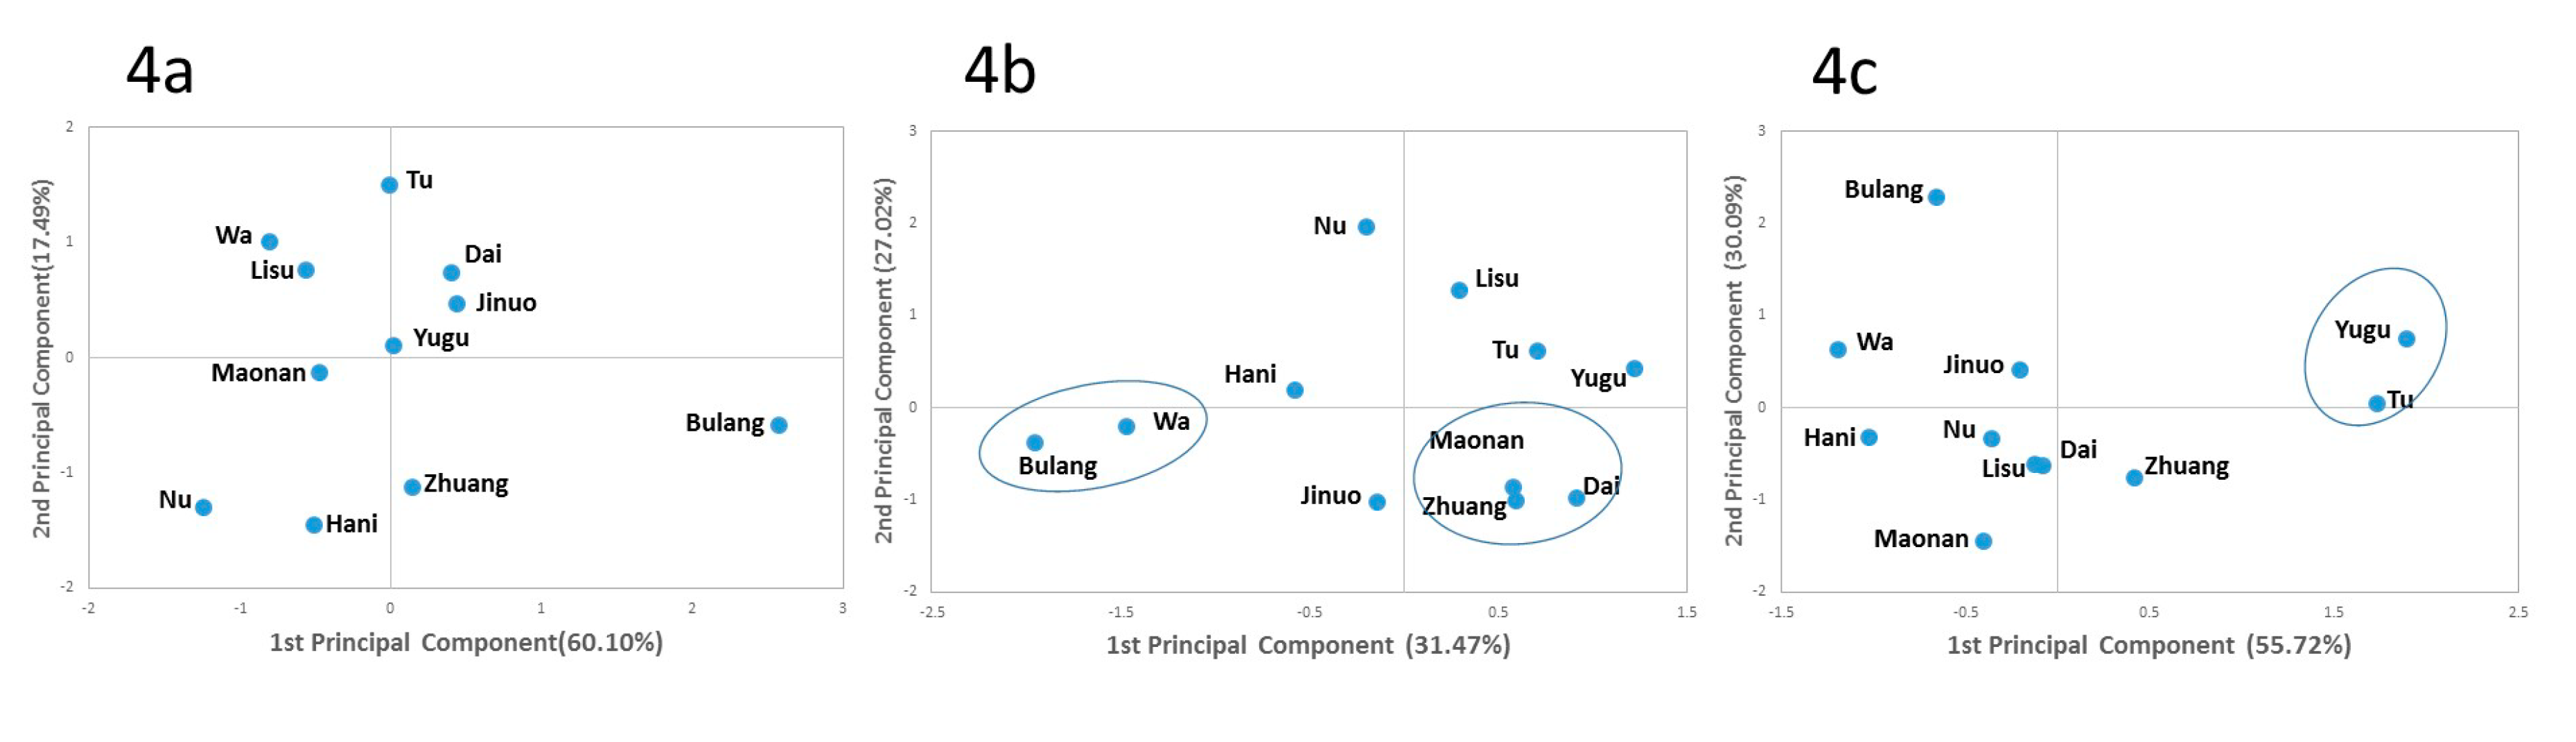
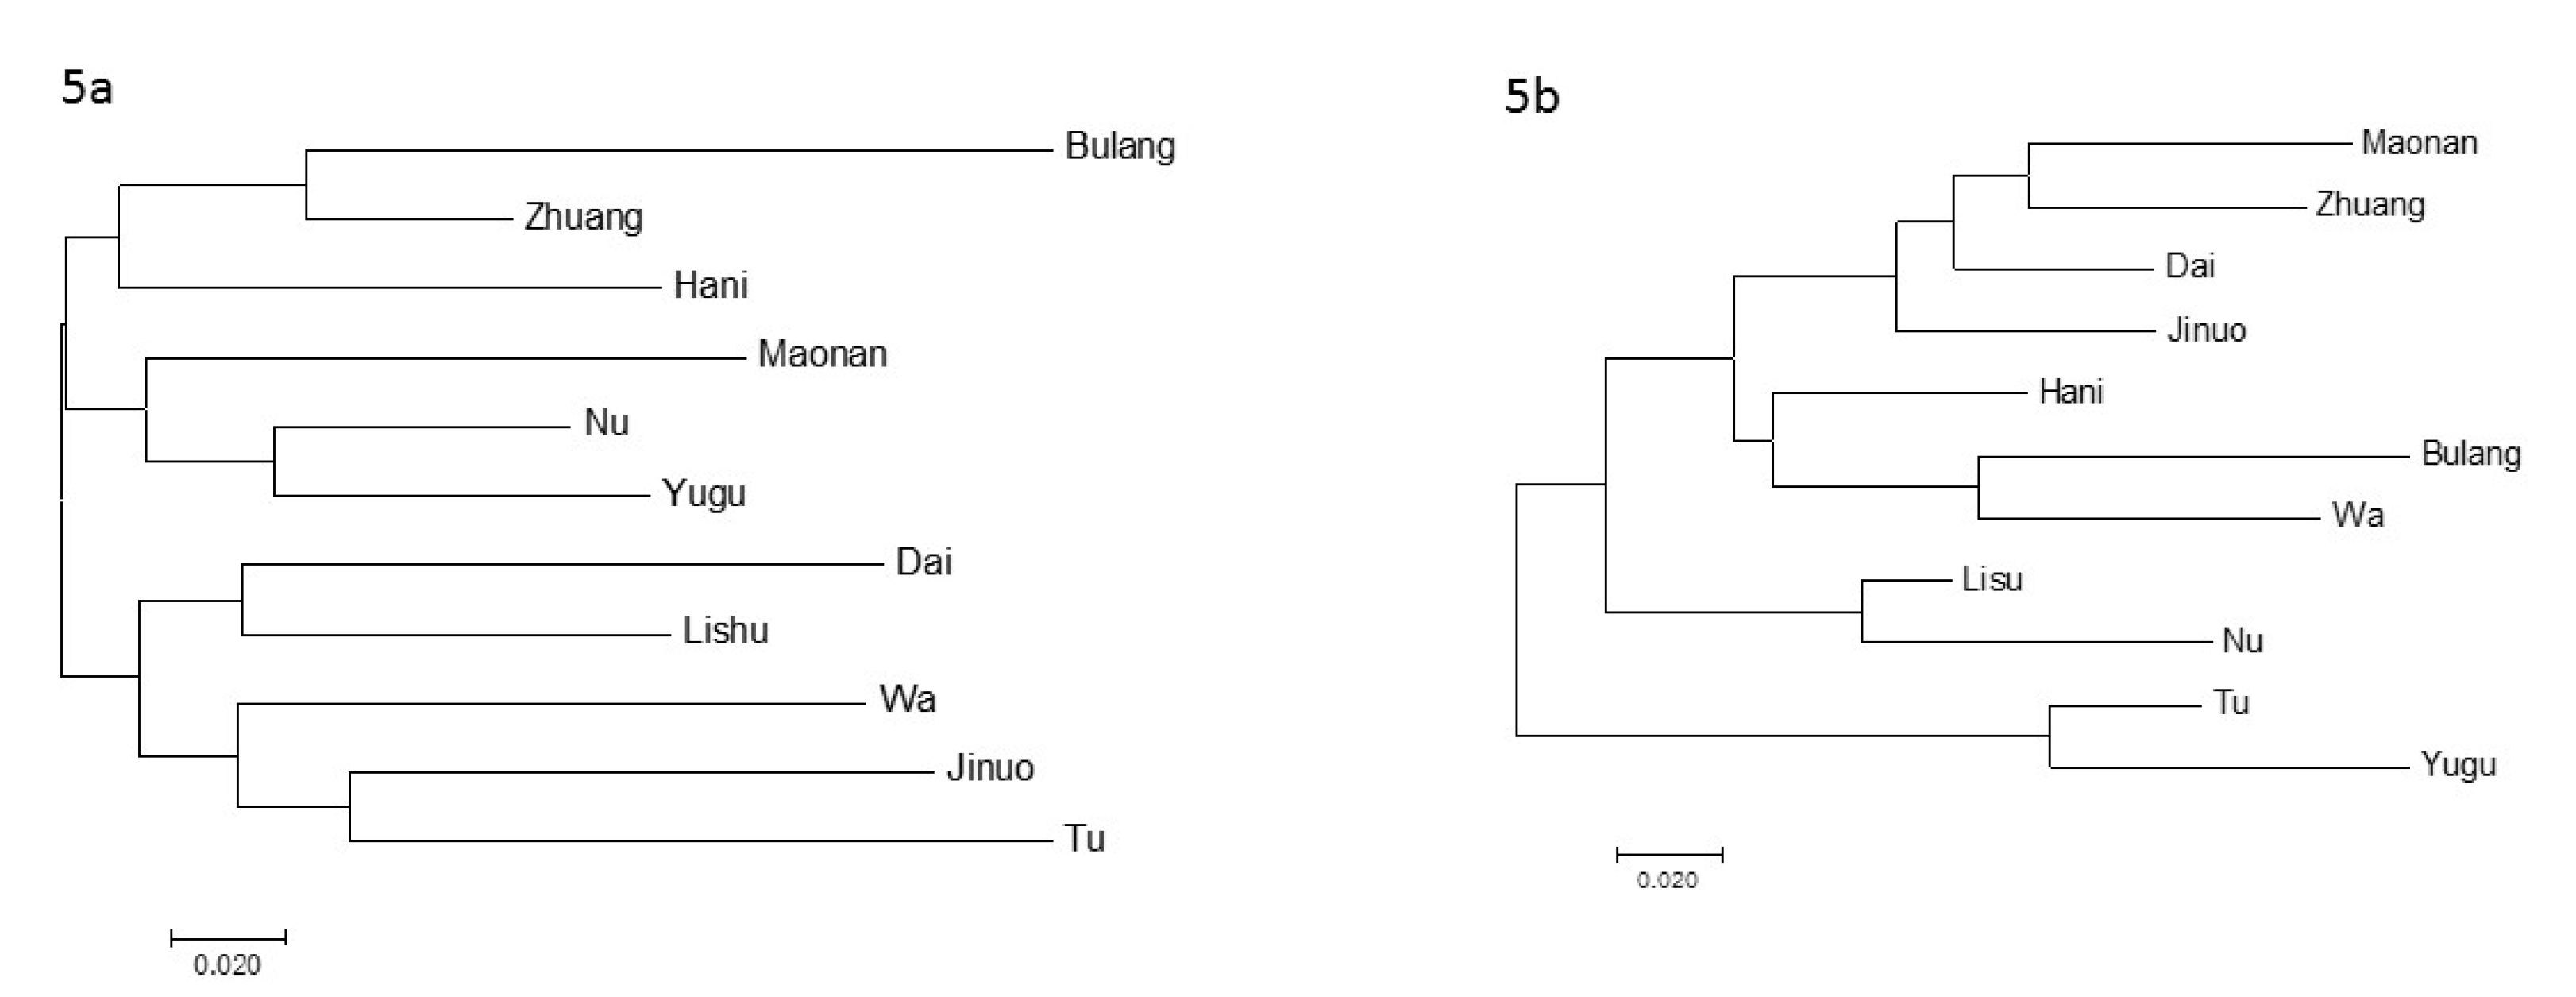
3.5. Phylogenetic Analysis
4. Discussion
Supplementary Materials
Author Contributions
Funding
Conflicts of Interest
References
- Parham, P. MHC class I molecules and KIRs in human history, health and survival. Nat. Rev. Immunol. 2005, 5, 201–214. [Google Scholar] [CrossRef] [PubMed]
- Middleton, D.; Gonzelez, F. The extensive polymorphism of KIR genes. Immunology 2010, 129, 8–19. [Google Scholar] [CrossRef] [PubMed]
- Du, Z.; Gjertson, D.W.; Reed, E.F.; Rajalingam, R. Receptor-ligand analyses define minimal killer cell Ig-like receptor (KIR) in humans. Immunogenetics 2007, 59, 1–15. [Google Scholar] [CrossRef] [PubMed]
- Gendzekhadze, K.; Norman, P.J.; Abi-Rached, L.; Graef, T.; Moesta, A.K.; Layrisse, Z.; Parham, P. Co-evolution of KIR2DL3 with HLA-C in a human population retaining minimal essential diversity of KIR and HLA class I ligands. Proc. Natl. Acad. Sci. USA 2009, 106, 18692–18697. [Google Scholar] [CrossRef] [PubMed]
- Manser, A.R.; Weinhold, S.; Uhrberg, M. Human KIR repertoires: Shaped by genetic diversity and evolution. Immunol. Rev. 2015, 267, 178–196. [Google Scholar] [CrossRef] [PubMed]
- Guinan, K.J.; Cunningham, R.T.; Meenagh, A.; Dring, M.M.; Middleton, D.; Gardiner, C.M. Receptor systems controlling natural killer cell function are genetically stratified in Europe. Genes Immun. 2010, 11, 67–78. [Google Scholar] [CrossRef]
- Tokunaga, K.; Imanishi, T.; Takahashi, K.; Juji, T. On the origin and dispersal of East Asian populations as viewed from HLA haplotypes. In Prehistoric Mongoloid Dispersals; Akazawa, T., Szathmary, E.J., Eds.; Oxford University: Oxford, UK, 1996; pp. 187–197. [Google Scholar]
- Tokunaga, K.; Ishikawa, Y.; Ogawa, A.; Wang, H.; Mitsunaga, S.; Moriyama, S.; Lin, L.; Bannai, M.; Watanabe, Y.; Kashiwase, K.; et al. Sequence-based association analysis of HLA class I and II alleles in Japanese supports conservation of common haplotypes. Immunogenetics 1997, 46, 199–205. [Google Scholar] [CrossRef]
- Marsh, S.G.; Parham, P.; Dupont, B.; Geraghty, D.E.; Trowsdale, J.; Middleton, D.; Vilches, C.; Carrington, M.; Witt, C.; Guethlein, L.A.; et al. Killer-cell immunoglobulin-like receptor (KIR) nomenclature report, 2002. Tissue Antigens 2003, 62, 79–86. [Google Scholar] [CrossRef]
- Wilson, M.J.; Torkar, M.; Haude, A.; Milne, S.; Jones, T.; Sheer, D.; Beck, S.; Trowsdale, J. Plasticity in the organization and sequences of human KIR/ILT gene families. Proc. Natl. Acad. Sci. USA 2000, 97, 4778–4783. [Google Scholar] [CrossRef]
- Rajalingam, R. Diversity of Killer Cell Immunoglobulin-Like Receptors and Disease. Clin. Lab. Med. 2018, 38, 637–653. [Google Scholar] [CrossRef]
- Stewart, C.A.; Laugier-Anfossi, F.; Vely, F.; Saulquin, X.; Riedmuller, J.; Tisserant, A.; Gauthier, L.; Romagne, F.; Ferracci, G.; Arosa, F.A.; et al. Recognition of peptide-MHC class I complexes by activating killer immunoglobulin-like receptors. Proc. Natl. Acad. Sci. USA 2005, 102, 13224–13229. [Google Scholar] [CrossRef] [PubMed]
- Augusto, D.G.; Lobo-Alves, S.C.; Melo, M.F.; Pereira, N.F.; Petzl-Erler, M.L. Activating KIR and HLA Bw4 ligands are associated to decreased susceptibility to pemphigus foliaceus, an autoimmune blistering skin disease. PLoS ONE 2012, 7, e39991. [Google Scholar] [CrossRef] [PubMed]
- Liu, J.; Xiao, Z.; Ko, H.L.; Shen, M.; Ren, E.C. Activating killer cell immunoglobulin-like receptor 2DS2 binds to HLA-A*11. Proc. Natl. Acad. Sci. USA 2014, 111, 2662–2667. [Google Scholar] [CrossRef] [PubMed]
- Guo, D.; Dong, J. Summarization of Chinese Nationalities (Zhonghua mingzu zhishi tonglan); Yunnan Education Press: Kunming, China, 2000. (In Chinese) [Google Scholar]
- You, Z. History of Yunnan Nationalities (Yunnan Mingzu Shi); Yunnan University Press: Kunming, China, 1994. (In Chinese) [Google Scholar]
- Chu, J.; Yu, J.; Huang, X.; Sun, H. China Nationalities. In Genetic Diversity in Chinese Populations; Jin, L., Chu, J., Eds.; Shanghai Science and Technology Press: Shanghai, China, 2006. [Google Scholar]
- Yao, Y.; Shi, L.; Tao, Y.; Lin, K.; Liu, S.; Yu, L.; Yang, Z.; Yi, W.; Huang, X.; Sun, H.; et al. Diversity of killer cell immunoglobulin-like receptor genes in four ethnic groups in China. Immunogenetics 2011, 63, 475–483. [Google Scholar] [CrossRef] [PubMed]
- Guo, S.W.; Thompson, E.A. Performing the exact test of Hardy-Weinberg proportion for multiple alleles. Biometrics 1992, 48, 361–372. [Google Scholar] [CrossRef] [PubMed]
- Rajalingam, R.; Du, Z.; Meenagh, A.; Luo, L.; Kavitha, V.J.; Pavithra-Arulvani, R.; Vidhyalakshmi, A.; Sharma, S.K.; Balazs, I.; Reed, E.F.; et al. Distinct diversity of KIR genes in three southern Indian populations: Comparison with world populations revealed a link between KIR gene content and pre-historic human migrations. Immunogenetics 2008, 60, 207–217. [Google Scholar] [CrossRef] [PubMed]
- Shi, L.; Huang, X.Q.; Shi, L.; Tao, Y.F.; Yao, Y.F.; Yu, L.; Lin, K.Q.; Yi, W.; Sun, H.; Tokunaga, K.; et al. HLA polymorphism of the Zhuang population reflects the common HLA characteristics among Zhuang-Dong language-speaking populations. J. Zhejiang Univ. Sci. B 2011, 12, 428–435. [Google Scholar] [CrossRef] [PubMed]
- Shi, L.; Ogata, S.; Yu, J.K.; Ohashi, J.; Yu, L.; Shi, L.; Sun, H.; Lin, K.; Huang, X.Q.; Matsushita, M.; et al. Distribution of HLA alleles and haplotypes in Jinuo and Wa populations in Southwest China. Hum. Immunol. 2008, 69, 58–65. [Google Scholar] [CrossRef]
- Shi, L.; Shi, L.; Yao, Y.F.; Matsushita, M.; Yu, L.; Huang, X.Q.; Yi, W.; Oka, T.; Tokunaga, K.; Chu, J.Y. Genetic link among Hani, Bulang and other Southeast Asian populations: Evidence from HLA -A, -B, -C, -DRB1 genes and haplotypes distribution. Int. J. Immunogenet. 2010, 37, 467–475. [Google Scholar] [CrossRef]
- Shi, L.; Yao, Y.F.; Shi, L.; Matsushita, M.; Yu, L.; Lin, Q.K.; Tao, Y.F.; Oka, T.; Chu, J.Y.; Tokunaga, K. HLA alleles and haplotypes distribution in Dai population in Yunnan province, Southwest China. Tissue Antigens 2010, 75, 159–165. [Google Scholar] [CrossRef]
- Yao, Y.; Shi, L.; Tao, Y.; Kulski, J.K.; Lin, K.; Huang, X.; Xiang, H.; Chu, J.; Shi, L. Distinct HLA allele and haplotype distributions in four ethnic groups of China. Tissue Antigens 2012, 80, 452–461. [Google Scholar] [CrossRef] [PubMed]
- Lalouel, J. Distance analysis and multidimensional scaling. In Current Developments in Anthropological Genetics, Volume 1: Theory and Methods; Mielke, J., Crawford, M., Eds.; Plenum Press: New York, NY, USA; London, UK, 1980; pp. 209–250. [Google Scholar]
- Tamura, K.; Dudley, J.; Nei, M.; Kumar, S. MEGA4: Molecular Evolutionary Genetics Analysis (MEGA) software version 4.0. Mol. Biol. Evol. 2007, 24, 1596–1599. [Google Scholar] [CrossRef] [PubMed]
- Rzhetsky, A.; Nei, M. A simple method for estimating and testing minimum evolution trees. Mol. Biol. Evol. 1992, 9, 945–967. [Google Scholar]
- Graef, T.; Moesta, A.K.; Norman, P.J.; Abi-Rached, L.; Vago, L.; Older Aguilar, A.M.; Gleimer, M.; Hammond, J.A.; Guethlein, L.A.; Bushnell, D.A.; et al. KIR2DS4 is a product of gene conversion with KIR3DL2 that introduced specificity for HLA-A*11 while diminishing avidity for HLA-C. J. Exp. Med. 2009, 206, 2557–2572. [Google Scholar] [CrossRef] [PubMed]
- Single, R.M.; Martin, M.P.; Gao, X.; Meyer, D.; Yeager, M.; Kidd, J.R.; Kidd, K.K.; Carrington, M. Global diversity and evidence for coevolution of KIR and HLA. Nat. Genet. 2007, 39, 1114–1119. [Google Scholar] [CrossRef] [PubMed]
- Augusto, D.G.; Petzl-Erler, M.L. KIR and HLA under pressure: Evidences of coevolution across worldwide populations. Hum. Genet. 2015, 134, 929–940. [Google Scholar] [CrossRef] [PubMed]
- Hao, L.; Nei, M. Rapid expansion of killer cell immunoglobulin-like receptor genes in primates and their coevolution with MHC Class I genes. Gene 2005, 347, 149–159. [Google Scholar] [CrossRef] [PubMed]
- Norman, P.J.; Hollenbach, J.A.; Nemat-Gorgani, N.; Guethlein, L.A.; Hilton, H.G.; Pando, M.J.; Koram, K.A.; Riley, E.M.; Abi-Rached, L.; Parham, P. Co-evolution of human leukocyte antigen (HLA) class I ligands with killer-cell immunoglobulin-like receptors (KIR) in a genetically diverse population of sub-Saharan Africans. PLoS Genet. 2013, 9, e1003938. [Google Scholar] [CrossRef]
- Rajalingam, R.; Krausa, P.; Shilling, H.G.; Stein, J.B.; Balamurugan, A.; McGinnis, M.D.; Cheng, N.W.; Mehra, N.K.; Parham, P. Distinctive KIR and HLA diversity in a panel of north Indian Hindus. Immunogenetics 2002, 53, 1009–1019. [Google Scholar] [CrossRef]
- Yao, Y.; Shi, L.; Shi, L.; Matsushita, M.; Yu, L.; Lin, K.; Tao, Y.; Huang, X.; Yi, W.; Oka, T.; et al. Distribution of HLA-A, -B, -Cw, and -DRB1 alleles and haplotypes in an isolated Han population in Southwest China. Tissue Antigens 2009, 73, 561–568. [Google Scholar] [CrossRef]
- Zhen, J.; Wang, D.; He, L.; Zou, H.; Xu, Y.; Gao, S.; Yang, B.; Deng, Z. Genetic profile of KIR and HLA in southern Chinese Han population. Hum. Immunol. 2014, 75, 59–64. [Google Scholar] [CrossRef] [PubMed]
- Guinan, K.J.; Cunningham, R.T.; Meenagh, A.; Gonzalez, A.; Dring, M.M.; McGuinness, B.W.; Middleton, D.; Gardiner, C.M. Signatures of natural selection and coevolution between killer cell immunoglobulin-like receptors (KIR) and HLA class I genes. Genes Immun. 2010, 11, 467–478. [Google Scholar] [CrossRef] [PubMed]
- Shen, Y.; Cao, D.; Li, Y.; Kulski, J.K.; Shi, L.; Jiang, H.; Ma, Q.; Yu, J.; Zhou, J.; Yao, Y.; et al. Distribution of HLA-A, -B, and -C alleles and HLA/KIR combinations in Han population in China. J. Immunol. Res. 2014, 2014, 565296. [Google Scholar] [CrossRef] [PubMed]
- Hollenbach, J.A.; Augusto, D.G.; Alaez, C.; Bubnova, L.; Fae, I.; Fischer, G.; Gonzalez-Galarza, F.F.; Gorodezky, C.; Karabon, L.; Kusnierczyk, P.; et al. 16(th) IHIW: Population global distribution of killer immunoglobulin-like receptor (KIR) and ligands. Int. J. Immunogenet. 2013, 40, 39–45. [Google Scholar] [CrossRef] [PubMed]
- Fasano, M.E.; Rendine, S.; Pasi, A.; Bontadini, A.; Cosentini, E.; Carcassi, C.; Capittini, C.; Cornacchini, G.; Espadas de Arias, A.; Garbarino, L.; et al. The distribution of KIR-HLA functional blocks is different from north to south of Italy. Tissue Antigens 2014, 83, 168–173. [Google Scholar] [CrossRef] [PubMed]
- Hirayasu, K.; Ohashi, J.; Kashiwase, K.; Hananantachai, H.; Naka, I.; Ogawa, A.; Takanashi, M.; Satake, M.; Nakajima, K.; Parham, P.; et al. Significant association of KIR2DL3-HLA-C1 combination with cerebral malaria and implications for co-evolution of KIR and HLA. PLoS Pathog. 2012, 8, e1002565. [Google Scholar] [CrossRef] [PubMed]
- Khakoo, S.I.; Thio, C.L.; Martin, M.P.; Brooks, C.R.; Gao, X.; Astemborski, J.; Cheng, J.; Goedert, J.J.; Vlahov, D.; Hilgartner, M.; et al. HLA and NK cell inhibitory receptor genes in resolving hepatitis C virus infection. Science 2004, 305, 872–874. [Google Scholar] [CrossRef] [PubMed]
- Shi, L.; Xu, S.B.; Ohashi, J.; Sun, H.; Yu, J.K.; Huang, X.Q.; Tao, Y.F.; Yu, L.; Horai, S.; Chu, J.Y.; et al. HLA-A, HLA-B, and HLA-DRB1 alleles and haplotypes in Naxi and Han populations in southwestern China (Yunnan province). Tissue Antigens 2006, 67, 38–44. [Google Scholar] [CrossRef] [PubMed]
- Zhao, T.M.; Lee, T.D. Gm and Km allotypes in 74 Chinese populations: A hypothesis of the origin of the Chinese nation. Hum. Genet. 1989, 83, 101–110. [Google Scholar] [CrossRef] [PubMed]
- Chu, J.Y.; Huang, W.; Kuang, S.Q.; Wang, J.M.; Xu, J.J.; Chu, Z.T.; Yang, Z.Q.; Lin, K.Q.; Li, P.; Wu, M.; et al. Genetic relationship of populations in China. Proc. Natl. Acad. Sci. USA 1998, 95, 11763–11768. [Google Scholar] [CrossRef] [PubMed]
- Su, B.; Xiao, J.; Underhill, P.; Deka, R.; Zhang, W.; Akey, J.; Huang, W.; Shen, D.; Lu, D.; Luo, J.; et al. Y-Chromosome evidence for a northward migration of modern humans into Eastern Asia during the last Ice Age. Am. J. Hum. Genet. 1999, 65, 1718–1724. [Google Scholar] [CrossRef] [PubMed]
- Diouf, G.; Kpanyen, P.N.; Tokpa, A.F.; Nie, S. Changing landscape of malaria in China: Progress and feasibility of malaria elimination. Asia Pac. J. Public Health 2014, 26, 93–100. [Google Scholar] [CrossRef] [PubMed]
- Cox, F.E. History of the discovery of the malaria parasites and their vectors. Parasites Vectors 2010, 3, 5. [Google Scholar] [CrossRef] [PubMed]
- Bi, Y.; Yu, W.; Hu, W.; Lin, H.; Guo, Y.; Zhou, X.N.; Tong, S. Impact of climate variability on Plasmodium vivax and Plasmodium falciparum malaria in Yunnan Province, China. Parasites Vectors 2013, 6, 357. [Google Scholar] [CrossRef] [PubMed]
- Lu, L.; Yuan, X.; Cheng, C. The History, Current St at us, and Challenges of Infectious Diseases in Yunnan. J. Kunming Med. Univ. 2009, 8, 17–20. (In Chinese) [Google Scholar]
- Hiby, S.E.; Apps, R.; Sharkey, A.M.; Farrell, L.E.; Gardner, L.; Mulder, A.; Claas, F.H.; Walker, J.J.; Redman, C.W.; Morgan, L.; et al. Maternal activating KIRs protect against human reproductive failure mediated by fetal HLA-C2. J. Clin. Investig. 2010, 120, 4102–4110. [Google Scholar] [CrossRef] [PubMed]
- Jamil, K.M.; Khakoo, S.I. KIR/HLA interactions and pathogen immunity. J. Biomed. Biotechnol. 2011, 2011, 298348. [Google Scholar] [CrossRef] [PubMed]
- Middleton, D.; Meenagh, A.; Moscoso, J.; Arnaiz-Villena, A. Killer immunoglobulin receptor gene and allele frequencies in Caucasoid, Oriental and Black populations from different continents. Tissue Antigens 2008, 71, 105–113. [Google Scholar] [CrossRef]


| Hani (n = 145) | Jinuo (n = 94) | Lisu (n = 99) | Nu (n = 106) | Bulang (n = 106) | Wa (n = 107) | Dai (n = 112) | Maonan (n = 89) | Zhuang (n = 95) | Tu (n = 70) | Yugu (n = 96) | ||||||||||||
|---|---|---|---|---|---|---|---|---|---|---|---|---|---|---|---|---|---|---|---|---|---|---|
| OF (%) | GF | OF (%) | GF | OF (%) | GF | OF (%) | GF | OF (%) | GF | OF (%) | GF | OF (%) | GF | OF (%) | GF | OF (%) | GF | OF (%) | GF | OF (%) | GF | |
| 3DL1 | 99 | 0.917 | 88 | 0.658 | 92 | 0.716 | 98 | 0.863 | 81 | 0.566 | 98 | 0.863 | 91 | 0.701 | 99 | 0.894 | 94 | 0.749 | 96 | 0.793 | 94 | 0.750 |
| 2DL1 | 100 | 1.000 | 100 | 1.000 | 99 | 0.899 | 100 | 1.000 | 98 | 0.863 | 100 | 1.000 | 97 | 0.836 | 99 | 0.894 | 100 | 1.000 | 100 | 1.000 | 95 | 0.772 |
| 2DL3 | 97 | 0.834 | 95 | 0.769 | 98 | 0.858 | 100 | 1.000 | 96 | 0.806 | 97 | 0.832 | 96 | 0.811 | 94 | 0.763 | 98 | 0.855 | 93 | 0.733 | 93 | 0.730 |
| 2DS4 | 99 | 0.917 | 88 | 0.658 | 92 | 0.716 | 98 | 0.863 | 79 | 0.544 | 98 | 0.863 | 90 | 0.687 | 99 | 0.894 | 94 | 0.749 | 97 | 0.831 | 92 | 0.711 |
| 2DL2 | 27 | 0.145 | 27 | 0.143 | 33 | 0.184 | 10 | 0.053 | 16 | 0.084 | 32 | 0.176 | 41 | 0.232 | 39 | 0.221 | 29 | 0.160 | 33 | 0.181 | 27 | 0.146 |
| 2DL5 | 30 | 0.165 | 35 | 0.194 | 34 | 0.190 | 26 | 0.142 | 70 | 0.451 | 24 | 0.126 | 53 | 0.312 | 35 | 0.193 | 46 | 0.267 | 33 | 0.181 | 45 | 0.257 |
| 3DS1 | 34 | 0.186 | 50 | 0.293 | 30 | 0.165 | 25 | 0.131 | 73 | 0.477 | 31 | 0.170 | 41 | 0.232 | 35 | 0.193 | 41 | 0.232 | 53 | 0.313 | 35 | 0.196 |
| 2DS1 | 34 | 0.191 | 44 | 0.249 | 38 | 0.215 | 23 | 0.120 | 73 | 0.477 | 34 | 0.187 | 43 | 0.244 | 30 | 0.165 | 37 | 0.205 | 39 | 0.216 | 41 | 0.229 |
| 2DS2 | 27 | 0.145 | 27 | 0.143 | 33 | 0.184 | 10 | 0.053 | 16 | 0.084 | 32 | 0.176 | 41 | 0.232 | 39 | 0.221 | 29 | 0.160 | 33 | 0.181 | 27 | 0.146 |
| 2DS3 | 34 | 0.191 | 29 | 0.156 | 8 | 0.041 | 8 | 0.038 | 48 | 0.280 | 11 | 0.058 | 28 | 0.150 | 31 | 0.172 | 37 | 0.205 | 13 | 0.066 | 21 | 0.110 |
| 2DS5 | 9 | 0.046 | 39 | 0.221 | 29 | 0.159 | 16 | 0.084 | 41 | 0.229 | 37 | 0.205 | 33 | 0.182 | 20 | 0.107 | 15 | 0.077 | 43 | 0.244 | 31 | 0.171 |
| 2DL4 | 100 | 1.000 | 100 | 1.000 | 100 | 1.000 | 100 | 1.000 | 100 | 1.000 | 100 | 1.000 | 100 | 1.000 | 100 | 1.000 | 100 | 1.000 | 100 | 1.000 | 99 | 0.898 |
| 3DL2 | 100 | 1.000 | 100 | 1.000 | 100 | 1.000 | 100 | 1.000 | 100 | 1.000 | 100 | 1.000 | 100 | 1.000 | 100 | 1.000 | 100 | 1.000 | 100 | 1.000 | 100 | 1.000 |
| 3DL3 | 100 | 1.000 | 100 | 1.000 | 100 | 1.000 | 100 | 1.000 | 100 | 1.000 | 100 | 1.000 | 100 | 1.000 | 100 | 1.000 | 100 | 1.000 | 100 | 1.000 | 100 | 1.000 |
| 2DP1 | 100 | 1.000 | 99 | 0.897 | 99 | 0.899 | 100 | 1.000 | 98 | 0.863 | 99 | 0.903 | 100 | 1.000 | 99 | 0.894 | 100 | 1.000 | 100 | 1.000 | 95 | 0.772 |
| 3DP1 | 100 | 1.000 | 100 | 1.000 | 100 | 1.000 | 100 | 1.000 | 100 | 1.000 | 100 | 1.000 | 100 | 1.000 | 100 | 1.000 | 100 | 1.000 | 100 | 1.000 | 99 | 0.898 |
| Hapl Group | Geno Group | Genotype ID | 3DL1 | 2DL1 | 2DL3 | 2DS4 | 2DL2 | 2DL5 | 3DS1 | 2DS1 | 2DS2 | 2DS3 | 2DS5 | 2DL4 | 3DL2 | 3DL3 | 2DP1 | 3DP1 | Hani | Jinuo | Lisu | Nu | Bulang | Wa | Dai | Maonan | Zhuang | Tu | Yugu |
|---|---|---|---|---|---|---|---|---|---|---|---|---|---|---|---|---|---|---|---|---|---|---|---|---|---|---|---|---|---|
| Fre. | Fre. | Fre. | Fre. | Fre. | Fre. | Fre. | Fre. | Fre. | Fre. | Fre. | |||||||||||||||||||
| AA | AA | 1 | 1 | 1 | 1 | 1 | 1 | 1 | 1 | 1 | 1 | 0.510 | 0.287 | 0.465 | 0.679 | 0.208 | 0.425 | 0.286 | 0.393 | 0.432 | 0.271 | 0.469 | |||||||
| AA | AA | 180 | 1 | 1 | 1 | 1 | 1 | 1 | 1 | 1 | 0.007 | 0.021 | 0.010 | 0.014 | |||||||||||||||
| AA | AA | 203 | 1 | 1 | 1 | 1 | 1 | 1 | 1 | 1 | 0.009 | ||||||||||||||||||
| AA | AA | 332 | 1 | 1 | 1 | 1 | 1 | 1 | 1 | 1 | 0.009 | ||||||||||||||||||
| Bx | AB | 2 | 1 | 1 | 1 | 1 | 1 | 1 | 1 | 1 | 1 | 1 | 1 | 1 | 1 | 0.034 | 0.117 | 0.101 | 0.113 | 0.170 | 0.113 | 0.080 | 0.056 | 0.074 | 0.143 | 0.094 | |||
| Bx | AB | 3 | 1 | 1 | 1 | 1 | 1 | 1 | 1 | 1 | 1 | 1 | 1 | 1 | 1 | 1 | 1 | 0.007 | 0.021 | 0.040 | 0.009 | 0.028 | 0.009 | 0.063 | 0.021 | 0.043 | 0.021 | ||
| Bx | AB | 4 | 1 | 1 | 1 | 1 | 1 | 1 | 1 | 1 | 1 | 1 | 1 | 0.069 | 0.074 | 0.091 | 0.057 | 0.028 | 0.085 | 0.107 | 0.135 | 0.095 | 0.143 | 0.052 | |||||
| Bx | AB | 5 | 1 | 1 | 1 | 1 | 1 | 1 | 1 | 1 | 1 | 1 | 1 | 1 | 1 | 0.007 | 0.011 | 0.020 | 0.019 | 0.019 | 0.063 | 0.022 | 0.042 | 0.021 | |||||
| Bx | AB | 6 | 1 | 1 | 1 | 1 | 1 | 1 | 1 | 1 | 1 | 1 | 1 | 1 | 1 | 1 | 1 | 1 | 0.021 | 0.011 | 0.009 | 0.018 | 0.067 | 0.011 | 0.042 | ||||
| Bx | AB | 7 | 1 | 1 | 1 | 1 | 1 | 1 | 1 | 1 | 1 | 1 | 1 | 1 | 1 | 1 | 1 | 0.055 | 0.011 | 0.030 | 0.028 | 0.009 | 0.009 | 0.063 | 0.014 | ||||
| Bx | AB | 8 | 1 | 1 | 1 | 1 | 1 | 1 | 1 | 1 | 1 | 1 | 1 | 1 | 1 | 0.076 | 0.053 | 0.010 | 0.057 | 0.255 | 0.019 | 0.063 | 0.101 | 0.137 | 0.057 | 0.083 | |||
| Bx | AB | 9 | 1 | 1 | 1 | 1 | 1 | 1 | 1 | 1 | 1 | 1 | 1 | 1 | 1 | 1 | 0.007 | 0.030 | 0.009 | 0.038 | 0.009 | 0.011 | 0.042 | ||||||
| Bx | AB | 11 | 1 | 1 | 1 | 1 | 1 | 1 | 1 | 1 | 1 | 1 | 1 | 1 | 1 | 1 | 0.021 | 0.009 | 0.018 | ||||||||||
| Bx | AB | 12 | 1 | 1 | 1 | 1 | 1 | 1 | 1 | 1 | 1 | 1 | 1 | 1 | 1 | 1 | 0.009 | ||||||||||||
| Bx | AB | 13 | 1 | 1 | 1 | 1 | 1 | 1 | 1 | 1 | 1 | 1 | 1 | 1 | 1 | 1 | 0.034 | 0.010 | 0.009 | 0.022 | 0.032 | 0.014 | |||||||
| Bx | AB | 14 | 1 | 1 | 1 | 1 | 1 | 1 | 1 | 1 | 1 | 1 | 0.032 | 0.020 | 0.018 | 0.022 | 0.011 | 0.014 | |||||||||||
| Bx | AB | 15 | 1 | 1 | 1 | 1 | 1 | 1 | 1 | 1 | 1 | 1 | 0.007 | 0.010 | 0.009 | ||||||||||||||
| Bx | AB | 17 | 1 | 1 | 1 | 1 | 1 | 1 | 1 | 1 | 1 | 1 | 1 | 1 | 0.014 | ||||||||||||||
| Bx | AB | 19 | 1 | 1 | 1 | 1 | 1 | 1 | 1 | 1 | 1 | 1 | 0.009 | ||||||||||||||||
| Bx | AB | 23 | 1 | 1 | 1 | 1 | 1 | 1 | 1 | 1 | 1 | 1 | 0.011 | 0.019 | 0.009 | 0.014 | |||||||||||||
| Bx | AB | 25 | 1 | 1 | 1 | 1 | 1 | 1 | 1 | 1 | 1 | 1 | 1 | 1 | 1 | 1 | 0.009 | ||||||||||||
| Bx | AB | 27 | 1 | 1 | 1 | 1 | 1 | 1 | 1 | 1 | 1 | 1 | 1 | 1 | 0.009 | ||||||||||||||
| Bx | AB | 30 | 1 | 1 | 1 | 1 | 1 | 1 | 1 | 1 | 1 | 1 | 1 | 0.009 | 0.009 | 0.011 | 0.010 | ||||||||||||
| Bx | AB | 31 | 1 | 1 | 1 | 1 | 1 | 1 | 1 | 1 | 1 | 1 | 1 | 1 | 0.021 | ||||||||||||||
| Bx | AB | 33 | 1 | 1 | 1 | 1 | 1 | 1 | 1 | 1 | 1 | 1 | 1 | 1 | 0.007 | ||||||||||||||
| Bx | AB | 35 | 1 | 1 | 1 | 1 | 1 | 1 | 1 | 1 | 1 | 1 | 1 | 1 | 0.011 | 0.009 | 0.009 | ||||||||||||
| Bx | AB | 41 | 1 | 1 | 1 | 1 | 1 | 1 | 1 | 1 | 1 | 1 | 1 | 1 | 1 | 0.011 | 0.011 | ||||||||||||
| Bx | AB | 44 | 1 | 1 | 1 | 1 | 1 | 1 | 1 | 1 | 1 | 1 | 1 | 1 | 0.007 | 0.038 | 0.011 | ||||||||||||
| Bx | AB | 57 | 1 | 1 | 1 | 1 | 1 | 1 | 1 | 1 | 1 | 1 | 1 | 1 | 1 | 1 | 0.009 | ||||||||||||
| Bx | AB | 62 | 1 | 1 | 1 | 1 | 1 | 1 | 1 | 1 | 1 | 1 | 1 | 1 | 0.021 | 0.011 | |||||||||||||
| Bx | AB | 63 | 1 | 1 | 1 | 1 | 1 | 1 | 1 | 1 | 1 | 1 | 1 | 1 | 1 | 1 | 0.011 | 0.028 | |||||||||||
| Bx | BB | 68 | 1 | 1 | 1 | 1 | 1 | 1 | 1 | 1 | 1 | 1 | 1 | 1 | 1 | 0.030 | 0.009 | 0.009 | 0.009 | 0.011 | |||||||||
| Bx | BB | 69 | 1 | 1 | 1 | 1 | 1 | 1 | 1 | 1 | 1 | 1 | 1 | 0.011 | 0.020 | 0.009 | 0.038 | 0.009 | 0.027 | 0.031 | |||||||||
| Bx | BB | 70 | 1 | 1 | 1 | 1 | 1 | 1 | 1 | 1 | 1 | 1 | 1 | 1 | 1 | 1 | 0.011 | 0.010 | 0.009 | 0.018 | 0.011 | ||||||||
| Bx | BB | 71 | 1 | 1 | 1 | 1 | 1 | 1 | 1 | 1 | 1 | 1 | 1 | 1 | 0.014 | 0.011 | 0.011 | 0.021 | 0.010 | ||||||||||
| Bx | BB | 72 | 1 | 1 | 1 | 1 | 1 | 1 | 1 | 1 | 0.009 | 0.010 | |||||||||||||||||
| Bx | BB | 73 | 1 | 1 | 1 | 1 | 1 | 1 | 1 | 1 | 1 | 1 | 1 | 1 | 1 | 1 | 1 | 0.018 | |||||||||||
| Bx | BB | 75 | 1 | 1 | 1 | 1 | 1 | 1 | 1 | 1 | 1 | 1 | 1 | 1 | 0.007 | 0.053 | 0.104 | 0.032 | 0.010 | ||||||||||
| Bx | BB | 76 | 1 | 1 | 1 | 1 | 1 | 1 | 1 | 1 | 1 | 1 | 1 | 1 | 0.021 | ||||||||||||||
| Bx | BB | 79 | 1 | 1 | 1 | 1 | 1 | 1 | 1 | 1 | 1 | 1 | 1 | 1 | 0.010 | ||||||||||||||
| Bx | BB | 80 | 1 | 1 | 1 | 1 | 1 | 1 | 1 | 1 | 1 | 1 | 1 | 1 | 1 | 1 | 0.009 | 0.010 | |||||||||||
| Bx | BB | 81 | 1 | 1 | 1 | 1 | 1 | 1 | 1 | 1 | 1 | 1 | 1 | 1 | 1 | 0.010 | |||||||||||||
| Bx | BB | 86 | 1 | 1 | 1 | 1 | 1 | 1 | 1 | 1 | 1 | 1 | 1 | 1 | 1 | 1 | 0.014 | ||||||||||||
| Bx | BB | 89 | 1 | 1 | 1 | 1 | 1 | 1 | 1 | 1 | 1 | 1 | 0.022 | ||||||||||||||||
| Bx | BB | 97 | 1 | 1 | 1 | 1 | 1 | 1 | 1 | 1 | 1 | 1 | 1 | 0.011 | 0.010 | ||||||||||||||
| Bx | BB | 104 | 1 | 1 | 1 | 1 | 1 | 1 | 1 | 1 | 1 | 0.009 | |||||||||||||||||
| Bx | BB | 106 | 1 | 1 | 1 | 1 | 1 | 1 | 1 | 1 | 1 | 1 | 1 | 0.010 | |||||||||||||||
| Bx | BB | 113 | 1 | 1 | 1 | 1 | 1 | 1 | 1 | 1 | 1 | 1 | 1 | 1 | 1 | 0.007 | 0.009 | ||||||||||||
| Bx | BB | 117 | 1 | 1 | 1 | 1 | 1 | 1 | 1 | 1 | 1 | 1 | 1 | 0.011 | 0.019 | 0.009 | 0.021 | ||||||||||||
| Bx | BB | 151 | 1 | 1 | 1 | 1 | 1 | 1 | 1 | 1 | 1 | 1 | 1 | 1 | 1 | 1 | 0.011 | ||||||||||||
| Bx | BB | 154 | 1 | 1 | 1 | 1 | 1 | 1 | 1 | 1 | 1 | 1 | 1 | 1 | 0.009 | ||||||||||||||
| Bx | BB | 164 | 1 | 1 | 1 | 1 | 1 | 1 | 1 | 1 | 1 | 1 | 1 | 1 | 0.010 | ||||||||||||||
| Bx | AB | 188 | 1 | 1 | 1 | 1 | 1 | 1 | 1 | 1 | 1 | 1 | 1 | 1 | 0.009 | ||||||||||||||
| Bx | AB | 192 | 1 | 1 | 1 | 1 | 1 | 1 | 1 | 1 | 1 | 1 | 1 | 1 | 0.030 | 0.019 | |||||||||||||
| Bx | BB | 194 | 1 | 1 | 1 | 1 | 1 | 1 | 1 | 0.010 | |||||||||||||||||||
| Bx | AB | 202 | 1 | 1 | 1 | 1 | 1 | 1 | 1 | 1 | 1 | 1 | 1 | 1 | 0.074 | 0.020 | 0.019 | 0.028 | 0.009 | 0.011 | 0.057 | ||||||||
| Bx | AB | 205 | 1 | 1 | 1 | 1 | 1 | 1 | 1 | 1 | 1 | 1 | 1 | 0.010 | |||||||||||||||
| Bx | AB | 233 | 1 | 1 | 1 | 1 | 1 | 1 | 1 | 1 | 1 | 1 | 1 | 1 | 1 | 1 | 0.014 | 0.009 | 0.014 | ||||||||||
| Bx | BB | 243 | 1 | 1 | 1 | 1 | 1 | 1 | 1 | 1 | 1 | 1 | 1 | 1 | 0.009 | ||||||||||||||
| Bx | BB | 247 | 1 | 1 | 1 | n | 1 | 1 | 1 | 1 | 1 | 1 | n | n | 0.009 | ||||||||||||||
| Bx | AB | 260 | 1 | 1 | 1 | 1 | 1 | 1 | 1 | 1 | 1 | 1 | 0.011 | ||||||||||||||||
| Bx | AB | 264 | 1 | 1 | 1 | 1 | 1 | 1 | 1 | 1 | 1 | 1 | 1 | 0.007 | 0.011 | 0.019 | 0.014 | ||||||||||||
| Bx | AB | 268 | 1 | 1 | 1 | 1 | 1 | 1 | 1 | 1 | 1 | 1 | 1 | 1 | 1 | 0.009 | |||||||||||||
| Bx | BB | 280 | 1 | 1 | 1 | 1 | 1 | 1 | 1 | 1 | 1 | 1 | 1 | 1 | 1 | 0.011 | |||||||||||||
| Bx | BB | 289 | 1 | 1 | 1 | 1 | 1 | 1 | 1 | 1 | 1 | 1 | 1 | 0.009 | |||||||||||||||
| Bx | BB | 293 | 1 | 1 | 1 | 1 | 1 | 1 | 1 | 1 | 1 | 1 | 0.009 | ||||||||||||||||
| Bx | BB | 317 | 1 | 1 | 1 | 1 | 1 | 1 | 1 | 1 | 1 | 1 | 1 | 0.021 | 0.014 | ||||||||||||||
| Bx | AB | 319 | 1 | 1 | 1 | 1 | 1 | 1 | 1 | 1 | 1 | 1 | 1 | 1 | 1 | 1 | 1 | 0.011 | 0.011 | ||||||||||
| Bx | BB | 320 | 1 | 1 | 1 | 1 | 1 | 1 | 1 | 1 | 1 | 1 | 1 | 0.009 | |||||||||||||||
| Bx | BB | 325 | 1 | 1 | 1 | 1 | 1 | 1 | 1 | 1 | 1 | 1 | 1 | 1 | 1 | 1 | 0.009 | ||||||||||||
| Bx | BB | 331 | 1 | 1 | 1 | 1 | 1 | 1 | 1 | 1 | 1 | 1 | 1 | 1 | 0.009 | ||||||||||||||
| Bx | AB | 370 | 1 | 1 | 1 | 1 | 1 | 1 | 1 | 1 | 1 | 1 | 1 | 1 | 1 | 0.010 | 0.009 | 0.014 | |||||||||||
| Bx | AB | 372 | 1 | 1 | 1 | 1 | 1 | 1 | 1 | 1 | 1 | 1 | 1 | 1 | 0.076 | 0.011 | 0.009 | 0.009 | |||||||||||
| Bx | BB | 375 | 1 | 1 | 1 | 1 | 1 | 1 | 1 | 1 | 1 | 0.011 | |||||||||||||||||
| Bx | BB | 379 | 1 | 1 | 1 | 1 | 1 | 1 | 1 | 1 | 1 | 1 | 1 | 1 | 1 | 0.014 | |||||||||||||
| Bx | AB | 381 | 1 | 1 | 1 | 1 | 1 | 1 | 1 | 1 | 1 | 1 | 1 | 1 | 1 | 1 | 0.010 | ||||||||||||
| Bx | AB | 382 | 1 | 1 | 1 | 1 | 1 | 1 | 1 | 1 | 1 | 1 | 1 | 1 | 1 | 1 | 1 | 0.007 | 0.009 | ||||||||||
| Bx | BB | 390 | 1 | 1 | 1 | 1 | 1 | 1 | 1 | 1 | 1 | 1 | 0.010 | 0.009 | |||||||||||||||
| Bx | BB | 394 | 1 | 1 | 1 | 1 | 1 | 1 | 1 | 1 | 1 | 1 | 1 | 1 | 0.014 | ||||||||||||||
| Bx | AB | 400 | 1 | 1 | 1 | 1 | 1 | 1 | 1 | 1 | 1 | 1 | 1 | 1 | 1 | 0.011 | 0.019 | 0.011 | 0.029 | 0.010 | |||||||||
| Bx | BB | 402 | 1 | 1 | 1 | 1 | 1 | 1 | 1 | 1 | 1 | 1 | 0.014 | ||||||||||||||||
| Bx | AB | 433 | 1 | 1 | 1 | 1 | 1 | 1 | 1 | 1 | 1 | 1 | 1 | 0.038 | 0.010 | ||||||||||||||
| Bx | BB | 466 | 1 | 1 | 1 | 1 | 1 | 1 | 1 | 1 | 1 | 1 | 1 | 1 | 0.011 | ||||||||||||||
| Bx | AB | 570 | 1 | 1 | 1 | 1 | 1 | 1 | 1 | 1 | 1 | 1 | 1 | 1 | 1 | 1 | 0.009 | ||||||||||||
| Bx | BB | 578 | 1 | 1 | 1 | 1 | 1 | 1 | 1 | 1 | 1 | 1 | 1 | 0.009 | |||||||||||||||
| Bx | AB | 587 | 1 | 1 | 1 | 1 | 1 | 1 | 1 | 1 | 1 | 1 | 1 | 1 | 1 | 0.009 | |||||||||||||
| Bx | AB | n1* | 1 | 1 | 1 | 1 | 1 | 1 | 1 | 1 | 1 | 1 | 1 | 0.029 | |||||||||||||||
| Bx | AB | n2* | 1 | 1 | 1 | 1 | 1 | 1 | 1 | 1 | 1 | 1 | 1 | 0.011 | |||||||||||||||
| Bx | BB | n3* | 1 | 1 | 1 | 1 | 1 | 1 | 1 | 1 | 1 | 1 | 1 | 1 | 0.014 | ||||||||||||||
| Bx | BB | n4* | 1 | 1 | 1 | 1 | 1 | 1 | 1 | 1 | 1 | 0.014 | |||||||||||||||||
| Bx | BB | n5* | 1 | 1 | 1 | 1 | 1 | 1 | 1 | 1 | 1 | 1 | 0.011 | ||||||||||||||||
| Bx | BB | n6* | 1 | 1 | 1 | 1 | 1 | 1 | 1 | 1 | 1 | 0.009 |
| Title | Hani (n = 145) | Jinuo (n = 94) * | Lisu (n = 99) | Nu (n = 106) | Bulang (n = 106) | Wa (n = 107) | Dai (n = 112) | Maonan (n = 89)* | Zhuang (n = 95) | Tu (n = 70) | Yugu (n = 96) |
|---|---|---|---|---|---|---|---|---|---|---|---|
| A11/A3 | 0.821 | 0.585 | 0.556 | 0.642 | 0.792 | 0.879 | 0.643 | 0.697 | 0.579 | 0.443 | 0.417 |
| Bw4 | 0.462 | 0.394 | 0.505 | 0.472 | 0.283 | 0.393 | 0.607 | 0.596 | 0.653 | 0.700 | 0.688 |
| Bw4-80I | 0.400 | 0.074 | 0.394 | 0.198 | 0.179 | 0.196 | 0.321 | 0.135 | 0.400 | 0.400 | 0.448 |
| Bw4-80T | 0.062 | 0.330 | 0.162 | 0.283 | 0.104 | 0.215 | 0.411 | 0.494 | 0.305 | 0.386 | 0.333 |
| HLA-C1 | 0.986 | 1.000 | 1.000 | 0.981 | 0.943 | 0.991 | 0.982 | 1.000 | 1.000 | 0.914 | 0.833 |
| HLA-C2 | 0.145 | 0.258 | 0.162 | 0.208 | 0.406 | 0.262 | 0.179 | 0.073 | 0.221 | 0.443 | 0.542 |
| C1/C1 | 0.855 | 0.742 | 0.838 | 0.792 | 0.594 | 0.738 | 0.821 | 0.927 | 0.779 | 0.557 | 0.458 |
| C1/C2 | 0.131 | 0.258 | 0.162 | 0.189 | 0.349 | 0.252 | 0.161 | 0.073 | 0.221 | 0.357 | 0.375 |
| C2/C2 | 0.014 | 0.000 | 0.000 | 0.019 | 0.057 | 0.009 | 0.018 | 0.000 | 0.000 | 0.086 | 0.167 |
| Title | 3DL2+A11/A3 | 2DS4+A11/A3 | 2DS2+A11 | |||
|---|---|---|---|---|---|---|
| Counts | Fre. | Counts | Fre. | Counts | Fre. | |
| Hani (n = 145) | 119 | 0.821 | 119 | 0.821 | 31 | 0.214 |
| Jinuo (n = 94) | 55 | 0.585 | 46 | 0.489 | 12 | 0.128 |
| Lisu(n = 99) | 55 | 0.556 | 50 | 0.505 | 21 | 0.212 |
| Nu (n = 106) | 68 | 0.642 | 68 | 0.642 | 4 | 0.038 |
| Bulang (n = 106) | 84 | 0.792 | 65 | 0.613 | 15 | 0.142 |
| Wa (n = 107) | 94 | 0.879 | 92 | 0.860 | 32 | 0.299 |
| Dai (n = 112) | 72 | 0.643 | 66 | 0.589 | 30 | 0.268 |
| Maonan (n = 89) | 62 | 0.697 | 58 | 0.652 | 24 | 0.270 |
| Zhuang (n = 95) | 55 | 0.579 | 49 | 0.516 | 16 | 0.168 |
| Tu (n = 70) | 31 | 0.443 | 30 | 0.429 | 11 | 0.157 |
| Yugu (n = 96) | 40 | 0.417 | 38 | 0.396 | 10 | 0.104 |
| 3DL1+3DS1+Bw4 | 3DL1+Bw4 | 3DS1+Bw4 | 3DL1+3DS1+BW4 80I | 3DL1+BW4 80I | 3DS1+BW4 80I | 3DL1+3DS1+BW4 80T | 3DL1+BW4 80T | 3DS1+BW4 80T | ||||||||||
|---|---|---|---|---|---|---|---|---|---|---|---|---|---|---|---|---|---|---|
| Counts | Fre. | Counts | Fre. | Counts | Fre. | Counts | Fre. | Counts | Fre. | Counts | Fre. | Counts | Fre. | Counts | Fre. | Counts | Fre. | |
| Hani (n = 145) | 23 | 0.159 | 44 | 0.303 | 0 | 0.000 | 21 | 0.145 | 37 | 0.255 | 0 | 0.000 | 2 | 0.014 | 9 | 0.062 | 0 | 0.000 |
| Jinuo (n = 94) | 15 | 0.160 | 17 | 0.181 | 4 | 0.043 | 0 | 0.000 | 6 | 0.064 | 1 | 0.011 | 15 | 0.160 | 13 | 0.138 | 2 | 0.021 |
| Lisu (n = 99) | 13 | 0.131 | 32 | 0.323 | 4 | 0.040 | 12 | 0.121 | 24 | 0.242 | 2 | 0.020 | 2 | 0.020 | 11 | 0.111 | 2 | 0.020 |
| Nu (n = 106) | 11 | 0.104 | 38 | 0.358 | 1 | 0.009 | 7 | 0.066 | 20 | 0.189 | 0 | 0.000 | 4 | 0.038 | 26 | 0.245 | 1 | 0.009 |
| Bulang (n = 106) | 18 | 0.170 | 6 | 0.057 | 6 | 0.057 | 10 | 0.094 | 5 | 0.047 | 3 | 0.028 | 5 | 0.047 | 3 | 0.028 | 3 | 0.028 |
| Wa (n = 107) | 7 | 0.065 | 35 | 0.327 | 0 | 0.000 | 2 | 0.019 | 19 | 0.178 | 0 | 0.000 | 5 | 0.047 | 18 | 0.168 | 0 | 0.000 |
| Dai (n = 112) | 21 | 0.188 | 38 | 0.339 | 8 | 0.071 | 14 | 0.125 | 19 | 0.170 | 2 | 0.018 | 14 | 0.125 | 24 | 0.214 | 8 | 0.071 |
| Maonan (n = 89) | 23 | 0.258 | 29 | 0.326 | 1 | 0.011 | 5 | 0.056 | 7 | 0.079 | 0 | 0.000 | 20 | 0.225 | 23 | 0.258 | 1 | 0.011 |
| Zhuang (n = 95) | 19 | 0.200 | 39 | 0.411 | 4 | 0.042 | 10 | 0.105 | 23 | 0.242 | 3 | 0.032 | 10 | 0.105 | 22 | 0.232 | 2 | 0.021 |
| Tu (n = 70) | 20 | 0.286 | 27 | 0.386 | 2 | 0.029 | 10 | 0.143 | 13 | 0.186 | 2 | 0.029 | 12 | 0.171 | 15 | 0.214 | 0 | 0.000 |
| Yugu (n = 96) | 16 | 0.167 | 46 | 0.479 | 4 | 0.042 | 9 | 0.094 | 32 | 0.333 | 2 | 0.021 | 10 | 0.104 | 20 | 0.208 | 2 | 0.021 |
| 2DL2/3+HLA-C1 | 2DL1+HLA-C2 | 2DS1+HLA-C2 | 2DS2+HLA-C1 | |||||
|---|---|---|---|---|---|---|---|---|
| Counts | Fre. | Counts | Fre. | Counts | Fre. | Counts | Fre. | |
| Hani (n = 145) | 142 | 0.979 | 21 | 0.145 | 10 | 0.069 | 42 | 0.290 |
| Jinuo (n = 89) | 87 | 0.978 | 23 | 0.258 | 9 | 0.101 | 24 | 0.270 |
| Lisu (n = 99) | 98 | 0.990 | 16 | 0.162 | 5 | 0.051 | 33 | 0.333 |
| Nu (n = 106) | 104 | 0.981 | 22 | 0.208 | 4 | 0.038 | 11 | 0.104 |
| Bulang (n = 106) | 99 | 0.934 | 41 | 0.387 | 31 | 0.292 | 17 | 0.160 |
| Wa (n = 107) | 104 | 0.972 | 28 | 0.262 | 10 | 0.093 | 34 | 0.318 |
| Dai (n = 112) | 110 | 0.982 | 20 | 0.179 | 10 | 0.089 | 44 | 0.393 |
| Maonan (n = 82) | 81 | 0.988 | 6 | 0.073 | 2 | 0.024 | 35 | 0.427 |
| Zhuang (n = 95) | 95 | 1.000 | 21 | 0.221 | 11 | 0.116 | 28 | 0.295 |
| Tu (n = 70) | 62 | 0.886 | 31 | 0.443 | 11 | 0.157 | 22 | 0.314 |
| Yugu (n = 96) | 80 | 0.833 | 48 | 0.500 | 23 | 0.240 | 22 | 0.229 |
© 2019 by the authors. Licensee MDPI, Basel, Switzerland. This article is an open access article distributed under the terms and conditions of the Creative Commons Attribution (CC BY) license (http://creativecommons.org/licenses/by/4.0/).
Share and Cite
Yao, Y.; Shi, L.; Yu, J.; Liu, S.; Tao, Y.; Shi, L. Distribution of Killer-Cell Immunoglobulin-Like Receptor Genes and Combinations of Their Human Leucocyte Antigen Ligands in 11 Ethnic Populations in China. Cells 2019, 8, 711. https://doi.org/10.3390/cells8070711
Yao Y, Shi L, Yu J, Liu S, Tao Y, Shi L. Distribution of Killer-Cell Immunoglobulin-Like Receptor Genes and Combinations of Their Human Leucocyte Antigen Ligands in 11 Ethnic Populations in China. Cells. 2019; 8(7):711. https://doi.org/10.3390/cells8070711
Chicago/Turabian StyleYao, Yufeng, Lei Shi, Jiankun Yu, Shuyuan Liu, Yufen Tao, and Li Shi. 2019. "Distribution of Killer-Cell Immunoglobulin-Like Receptor Genes and Combinations of Their Human Leucocyte Antigen Ligands in 11 Ethnic Populations in China" Cells 8, no. 7: 711. https://doi.org/10.3390/cells8070711
APA StyleYao, Y., Shi, L., Yu, J., Liu, S., Tao, Y., & Shi, L. (2019). Distribution of Killer-Cell Immunoglobulin-Like Receptor Genes and Combinations of Their Human Leucocyte Antigen Ligands in 11 Ethnic Populations in China. Cells, 8(7), 711. https://doi.org/10.3390/cells8070711