Article

gga-miRNA-18b-3p Inhibits Intramuscular Adipocytes Differentiation in Chicken by Targeting the ACOT13 Gene

College of Animal Science and Veterinary Medicine, Henan Agricultural University, Zhengzhou 450002, China
*
Author to whom correspondence should be addressed.
These authors contributed equally to this work.
Cells 2019, 8(6), 556; https://doi.org/10.3390/cells8060556
Submission received: 28 March 2019 / Revised: 4 June 2019 / Accepted: 5 June 2019 / Published: 7 June 2019
(This article belongs to the Section Cell Signaling)

Abstract

:
Intramuscular fat (IMF) is the most important evaluating indicator of chicken meat quality, the content of which is positively correlated with tenderness, flavor, and succulence of the meat. Chicken IMF deposition process is regulated by many factors, including genetic, nutrition, and environment. Although large number of omics’ studies focused on the IMF deposition process, the molecular mechanism of chicken IMF deposition is still poorly understood. In order to study the role of miRNAs in chicken intramuscular adipogenesis, the intramuscular adipocyte differentiation model (IMF-preadipocytes and IMF-adipocytes) was established and subject to miRNA-Seq. A total of 117 differentially expressed miRNAs between two groups were obtained. Target genes prediction and functional enrichment analysis revealed that eight pathways involved in lipid metabolism related processes, such as fatty acid metabolism and fatty acid elongation. Meanwhile a putative miRNA, gga-miR-18b-3p, was identified be served a function in the intramuscular adipocyte differentiation. Luciferase assay suggested that the gga-miR-18b-3p targeted to the 3′UTR of ACOT13. Subsequent functional experiments demonstrated that gga-miR-18b-3p acted as an inhibitor of intramuscular adipocyte differentiation by targeting ACOT13. Our findings laid a new theoretical foundation for the study of lipid metabolism, and also provided a potential target to improve the meat quality in the poultry industry.

1. Introduction

Meat products are essential for humans to maintain a balanced diet. Recently, great progress has been achieved in meat quantity by genetic selection for growth rate and meat yield. However, the strong selection led to the decline in the meat quality, which presented as larger fiber diameters, higher proportion of glycolytic fibers, and lower intramuscular fat (IMF) [1,2]. Among them, IMF was considered to be the main factor affecting meat quality. It has been demonstrated that IMF content, the amount of fat within muscles, was positively correlated with flavor, juiciness, and tenderness [3]. Gushi chicken as a Chinese local chicken breed with high meat quality, has been favored by most consumers for its delicious and unique-flavored meat. Numerous studies have shown that intramuscular fat not only correlated with muscle flavor, but also related to many other meat quality traits (such as muscle pH, hydraulics, tenderness, etc.) [2,3,4,5,6]. Our previous studies have found that there were significant differences in the density and size of lipid droplets in the breast muscle between the juvenile and late-laying period of Gushi hens. As expected, significant difference in meat quality was also captured between such groups. That is the higher the meat quality the late-laying period group showed, the more lipid droplets were in their breast muscles [4].
Intramuscular fat mainly consisted of intramuscular adipocytes, which were differentiated by intramuscular preadipocytes. In recent years, many previous studies focused on intramuscular adipocytes in various species, such as cattle and pig [5,6]. Seldom research performed on chicken. This study tried to elucidate the mechanism of chicken IMF deposition by establishing the intramuscular adipocyte differentiation model.
MicroRNA (miRNA) is a class of endogenous noncoding single-stranded RNA, with 18 to 25 nucleotides (nt) in length, which commonly acted as the negative regulators of gene expression at post-transcriptional levels [7]. miRNAs played important roles in regulating a large number of biological and metabolic processes [8], including cell growth, proliferation, differentiation, and cell death. It has been reported that miRNAs regulated the biological functions of adipocyte, such as adipogenic differentiation and white adipocyte browning [9,10]. Several miRNAs have been identified to be responsible for adipocyte differentiation or adipogenesis [11,12]. Furthermore, published data showed that miR-18b could promote food intake, induce the expansion of adipose tissues and modulate fatty acid content, utilization and oxidation [13,14]. Sex hormones were essential for regulating adipocyte metabolism and affecting specific fat store [15,16]. In human, fat distribution was regulated by the concentration of sex hormones [17]. Estrogen almost regulated the transcription of important genes in various processes such as fat synthesis, fat transportation and oxidation hydrolysis [18,19,20]. Lack of estrogen could lead to obesity directly [21]. Cooke et al. have reported that estrogen determined the number of adipocytes by affecting food intake and energy consumption, thereby inhibited the fat deposition in the body [22]. Jinhui-wu et al. found that miR-18b played a negative regulatory role in human retinal endothelial cells (HRECs) proliferation by targeting insulin growth factor-1 (IGF-1). High glucose inhibited the expression of miR-18b and then the inhibitory effect of miR-18b resulted in an increasing expression of IGF-1 gene [23]. IGF-1 receptor was located in the 3T3-L1 preadipocyte and adipocyte, and IGF-1 receptor signaling played a key role in inducing the 3T3-L1 preadipocytes differentiating into adipocytes [24,25]. It has been demonstrated that a high level of insulin or IGF-1 could lead to the initiation of the 3T3-L1 preadipocyte differentiation, which finally induced the cell differentiation and affected fat production [26]. In conclusion, we inferred that miR-18b played an important role in the differentiation of adipocytes.
The aim of this study was to identify the miRNAs affecting IMF deposition between IMF-preadipocytes and IMF-adipocytes by using small RNA deep sequencing. Differential expressing miRNAs and their target genes were identified to elucidate the regulatory patterns of miRNAs and their network. According to the analysis, a candidate miRNA, gga-miR-18b-3p, was revealed to be potentially associated with IMF deposition. Subsequently, further validation for miR-18b-3p has been performed. Our results may contribute to a better understanding of chicken IMF deposition, and also provide a target for subsequent investigation to improve meat quality in the poultry industry.

2. Materials and Methods

2.1. Ethics Statement

All the procedures of animal experimentation in this study strictly followed the protocol approved by the Institutional Animal Care and Use Committee (IACUC) of Henan Agricultural University (Permit Number: 17-0118).

2.2. Cell Isolation, Culture, and Differentiation of Primary Preadipocytes

Primary chicken intramuscular preadipocytes were isolated from breast muscle tissue of two-week-old chickens following the methods as described previously [4]. Then cells were seeded in 6-well plates and maintained with complete medium (DMEM/F12 (1:1), 10% FBS, and 1% penicillin/streptomycin) as described by Ding et al. (2015). Once upon the confluence of cells reaching 90%, the medium would be replaced with differentiation medium (0.5 mM 3-isobutyl-1-methylxanthine, 1 μM dexamethasone, 10 g/l insulin, and 1 μM oleic acid) for inducing the cell differentiation. Undifferentiated cells were named as IMF-preadipocytes, while cells collected at 10 days post-induction were named as IMF-adipocytes.

2.3. Oil Red O Staining and Cellular TG Content Measurement

Cells were fixed for 30 min with 4% paraformaldehyde, incubated for 20 min at room temperature with Oil Red O, and then visualized with light microscopy following the methods published [4]. TG content was measured in a triglyceride content detection kit (APPLYGEN, Beijing, China) according to the manufacturer’s instructions.

2.4. Small RNAs Library Construction and Deep Sequencing

Total RNA of IMF-preadipocytes and IMF-adipocytes were prepared using mirVana™ miRNA Isolation Kit (Austin TX, US). After quality checking, ~2 μg total RNA for each sample was used to construct the small RNA library according to the protocol (Illumina Small RNA Sample Prep Kit). A total of 4 libraries (IMF-preadipocytes and IMF-adipocytes, each with 2 replicates) were sequenced with Illumina Genome Analyzer (Illumina, San Diego, CA, USA). Meanwhile, cDNA was also prepared using PrimeScript™ RT reagent kit with gDNA Eraser (Takara, Dalian, China) and stored at −20 °C for the following wet-lab experiment.

2.5. Identification and Prediction of miRNAs

After a series of quality control, clean reads for each sample were mapped to Gallus gallus 5.0 using Bowtie (http://bowtie.cbcb.umd.edu) (The University of Maryland, Maryland, MD, America) [27], and then aligned with the known miRNAs in miRbase [28] with allowing less than one mismatch to identify known miRNAs. The identified miRNAs were classified into families based on their sequence similarities. Unmatched reads remained were further processed to predict novel miRNAs using miRCat [29]. RegRNA 2.0 was applied to predict the structures of novel miRNAs precursors, hairpins, secondary structures, and minimum free energy [30].

2.6. Prediction of miRNA Target Genes and GO and Pathway Enrichment Analysis

Differentially expressed miRNAs with p value ≤ 0.05 were identified and their target genes were predicted by TargetScan (http://www.targetscan.org/) and miRanda (microRNA.org). Correlation networks was visualized using Cytoscape software [31]. Gene ontology (GO) enrichment and Kyoto Encyclopedia of Genes and Genomes (KEGG) analysis were performed to investigate the underlying functions and some vital pathways involved in lipid metabolism using DAVID (The Database for Annotation, Visualization, and Integrated Discovery) database (https://david.ncifcrf.gov/).

2.7. Functional Assays

2.7.1. Vector Construction

The chicken ACOT13 coding region was cloned using primer ACOT13(CDS), isolated with EcolΙ and HindIII, then inserted into pcDNA3.1-EGFP to obtain the pcDNA3.1-ACOT13. Similarly, a fragment amplified from the GFP gene was also cloned into pcDNA3.1-EGFP as a negative control (NC). The 3′ UTR region of ACOT13 gene fragments containing the predicted target site, including wild type (WT) and mutant type (MUT), were cloned into psiCHECK2 vector (isolated using XhoΙ and NotΙ (Takara, Dalian, China)). The recombinant vectors were named as ACOT13-3′UTR-WT and ACOT13-3′UTR-MUT, respectively. The primers are shown in Table 1.

2.7.2. Luciferase Assays

DF1 cell, a cell line of chicken embryo fibroblasts, was used to validate the miRNA target. Cells were seeded into 24-well plates. Co-transfection with 500 ng ACOT13-3′UTR-WT or ACOT13-3′UTR-MUT and 2 μL of gga-miR-18b-3p mimics or negative control were performed with Lipofectamine 2000 (Invitrogen). Then luciferase activities were measured using the Dual Luciferase Reporter Assay System (Promega, WI, USA) at 48 hours post-transfection. Assays were performed in triplicate.

2.7.3. Overexpression and Knockdown Assay in Preadipocytes

Primary preadipocytes were seeded into 6-well plates and transfected with gga-miR-18b-3p mimics or si-ACOT13 (small interfering RNA of ACOT13 gene, GenePharma, Shanghai, China), meanwhile their non-targeting sequences were used as negative control. Furthermore, a rescue experiment was conducted after ACOT13 gene knockdown in preadipocytes, that was to transfect the pcDNA3.1-ACOT13 into cells. Post-transfected cells were collected for analyzing the transfection efficiency, the cell differentiation, and gene expression at 48 hours post-transfection.

2.7.4. Quantitative PCR

cDNA was obtained as mentioned above in Section 2.4. Specially, the cDNA synthesis and quantitative PCR (qPCR) for miRNAs were performed with Bulge-loopTM miRNA qPCR Starter Kit (Ribobio, Guangzhou, China). β-actin and U6 genes were used as reference genes for genes and miRNAs respectively. qPCR amplification was conducted as described previously [32,33]. All the primers used are listed in Table 1.

2.8. Statistical Analysis

Relative gene expression obtained from q-PCR data was calculated using the 2−ΔΔCt method [34]. All of the data was presented as the mean ±SE (standard error) with at least three independent replicates and visualized using the “ggplot2” package in R (version 3.2.2, the University of Auckland, Auckland, New Zealand) and GraphPad Prism 7 software (San Diego, CA, USA). Significant differences in the data between groups were tested by Student’s t-test at 5% level using SPSS 19.0 software (IBM, Chicago, IL, USA).

3. Results

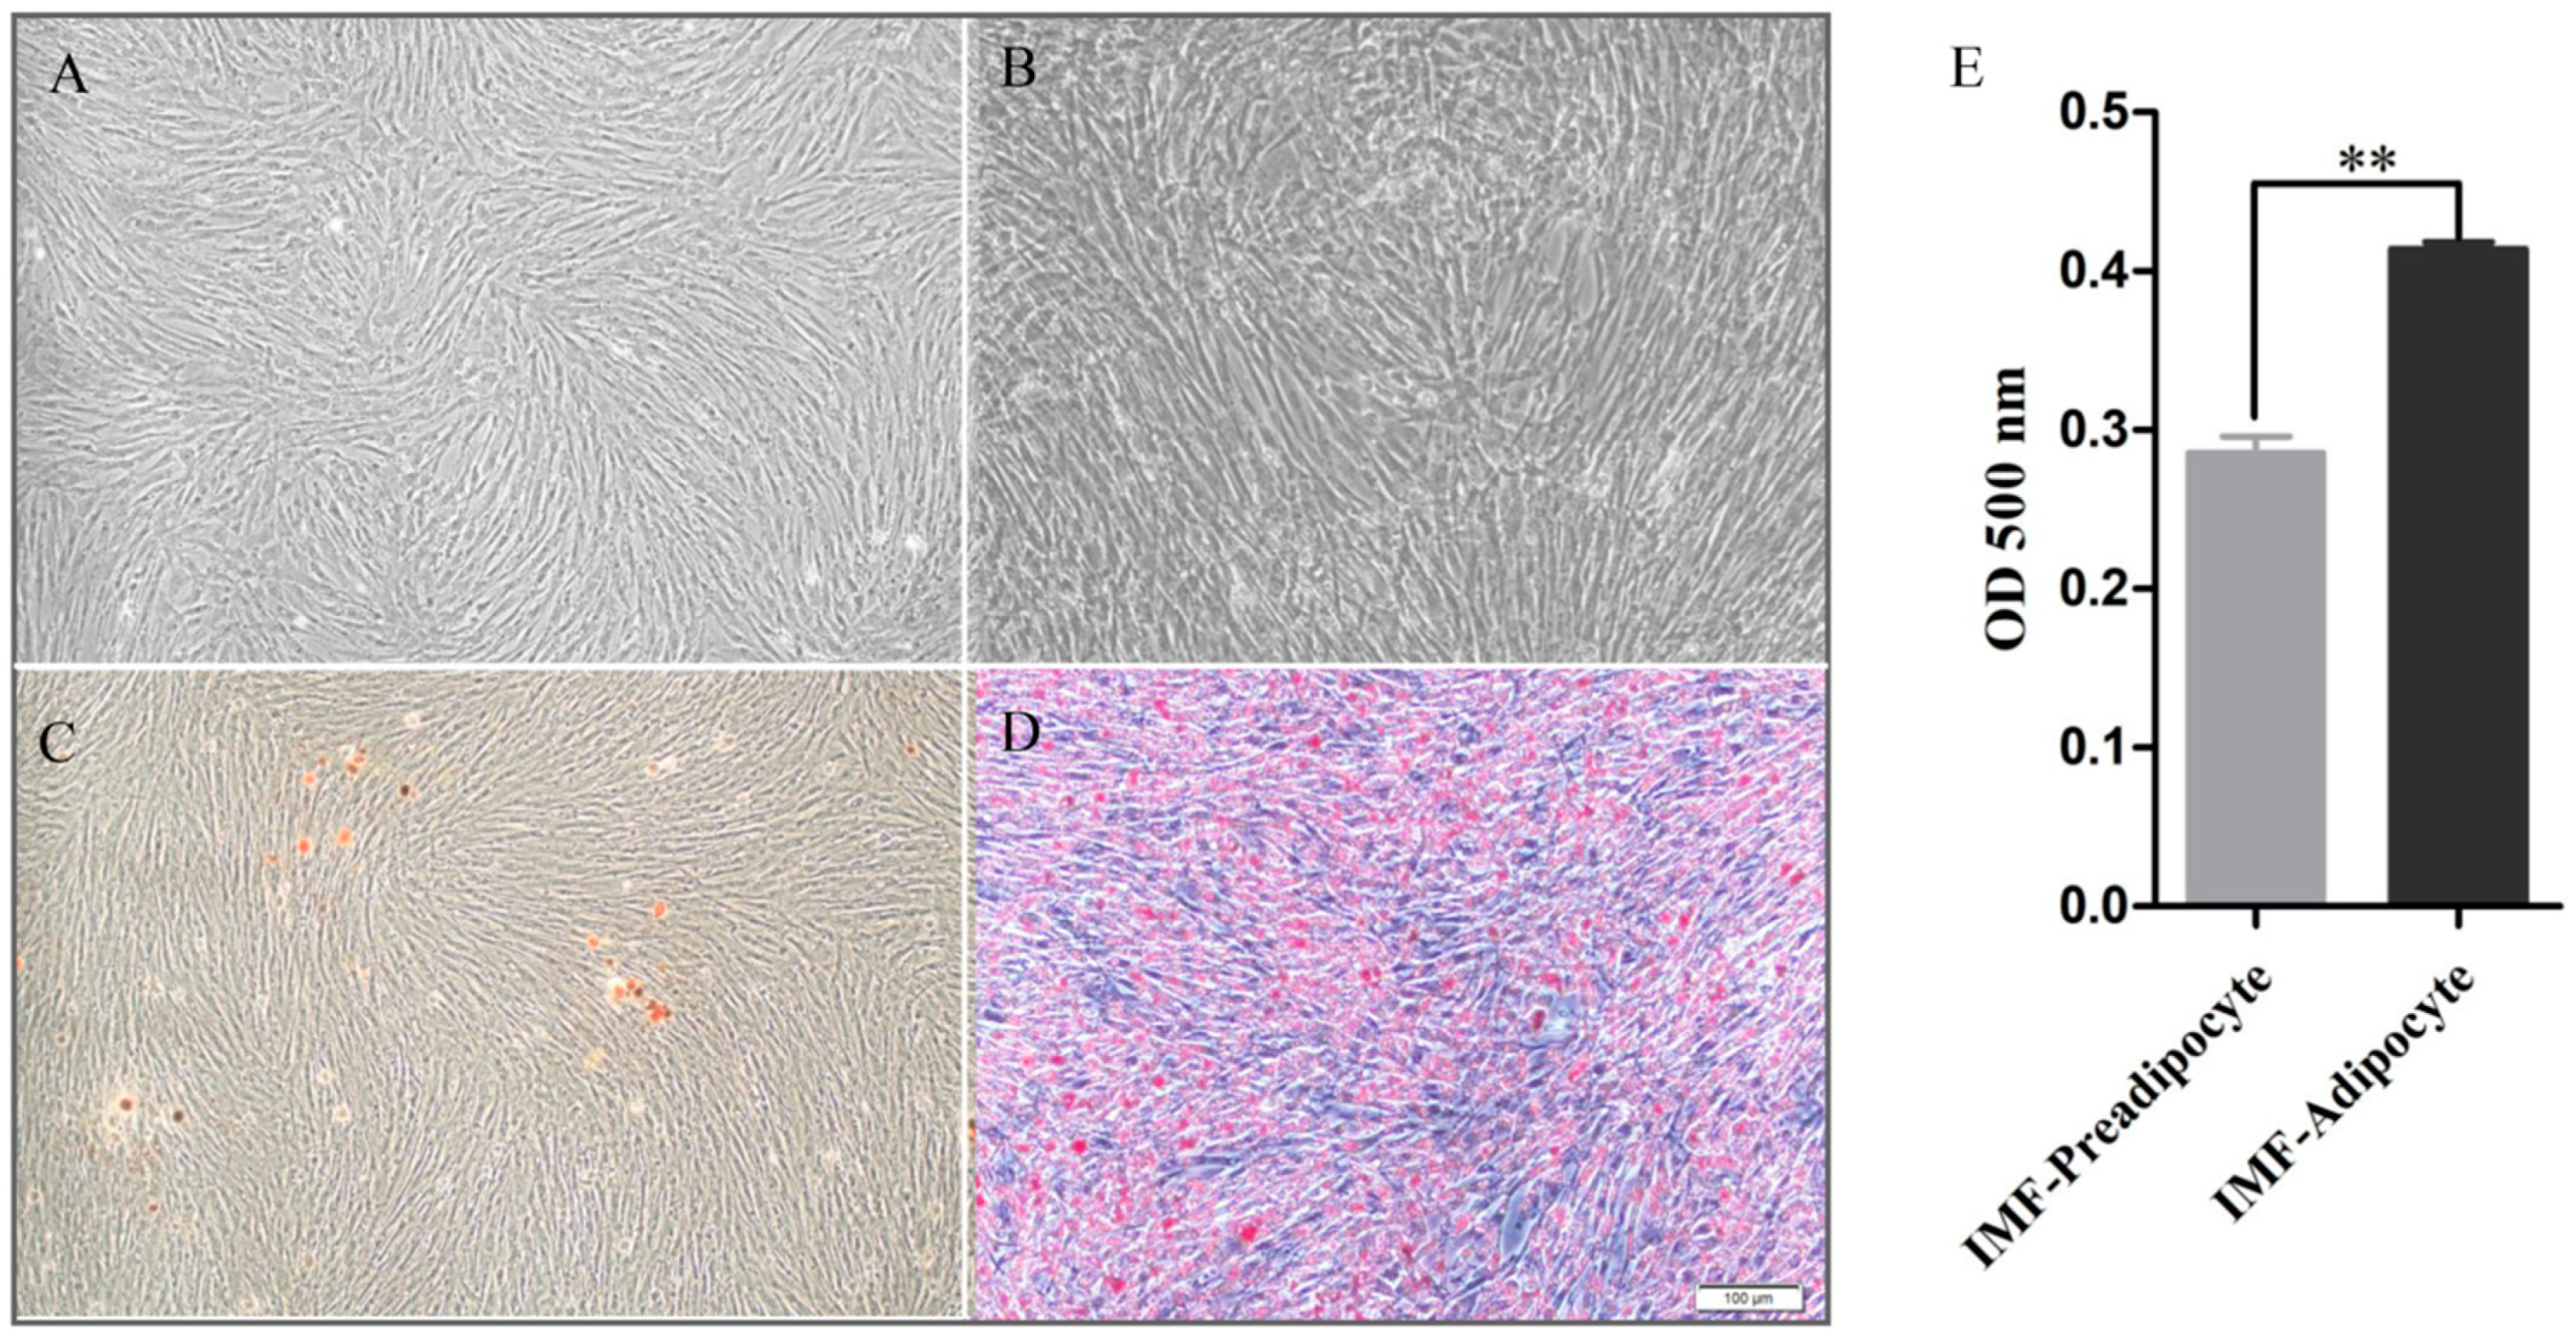
3.1. Phenotypic Variations between IMF-Preadipocytes and IMF-Adipocytes

To visualize the difference of adipogenesis between IMF-preadipocytes and IMF-adipocytes, the morphological characteristics of chicken IMF-preadipocytes and IMF-adipocytes are shown in Figure 1. At 0 day, IMF-preadipocytes we captured were shown in presence (Figure 1A) or absence of Oil Red O staining (Figure 1B). At 10 days after differentiation induction, IMF-preadipocytes were fully differentiated into IMF-adipocytes filled with lots of lipid droplets (Figure 1C,D). Triacylglycerol content in the IMF-adipocytes was significantly higher than that in IMF-preadipocytes (Figure 1E).

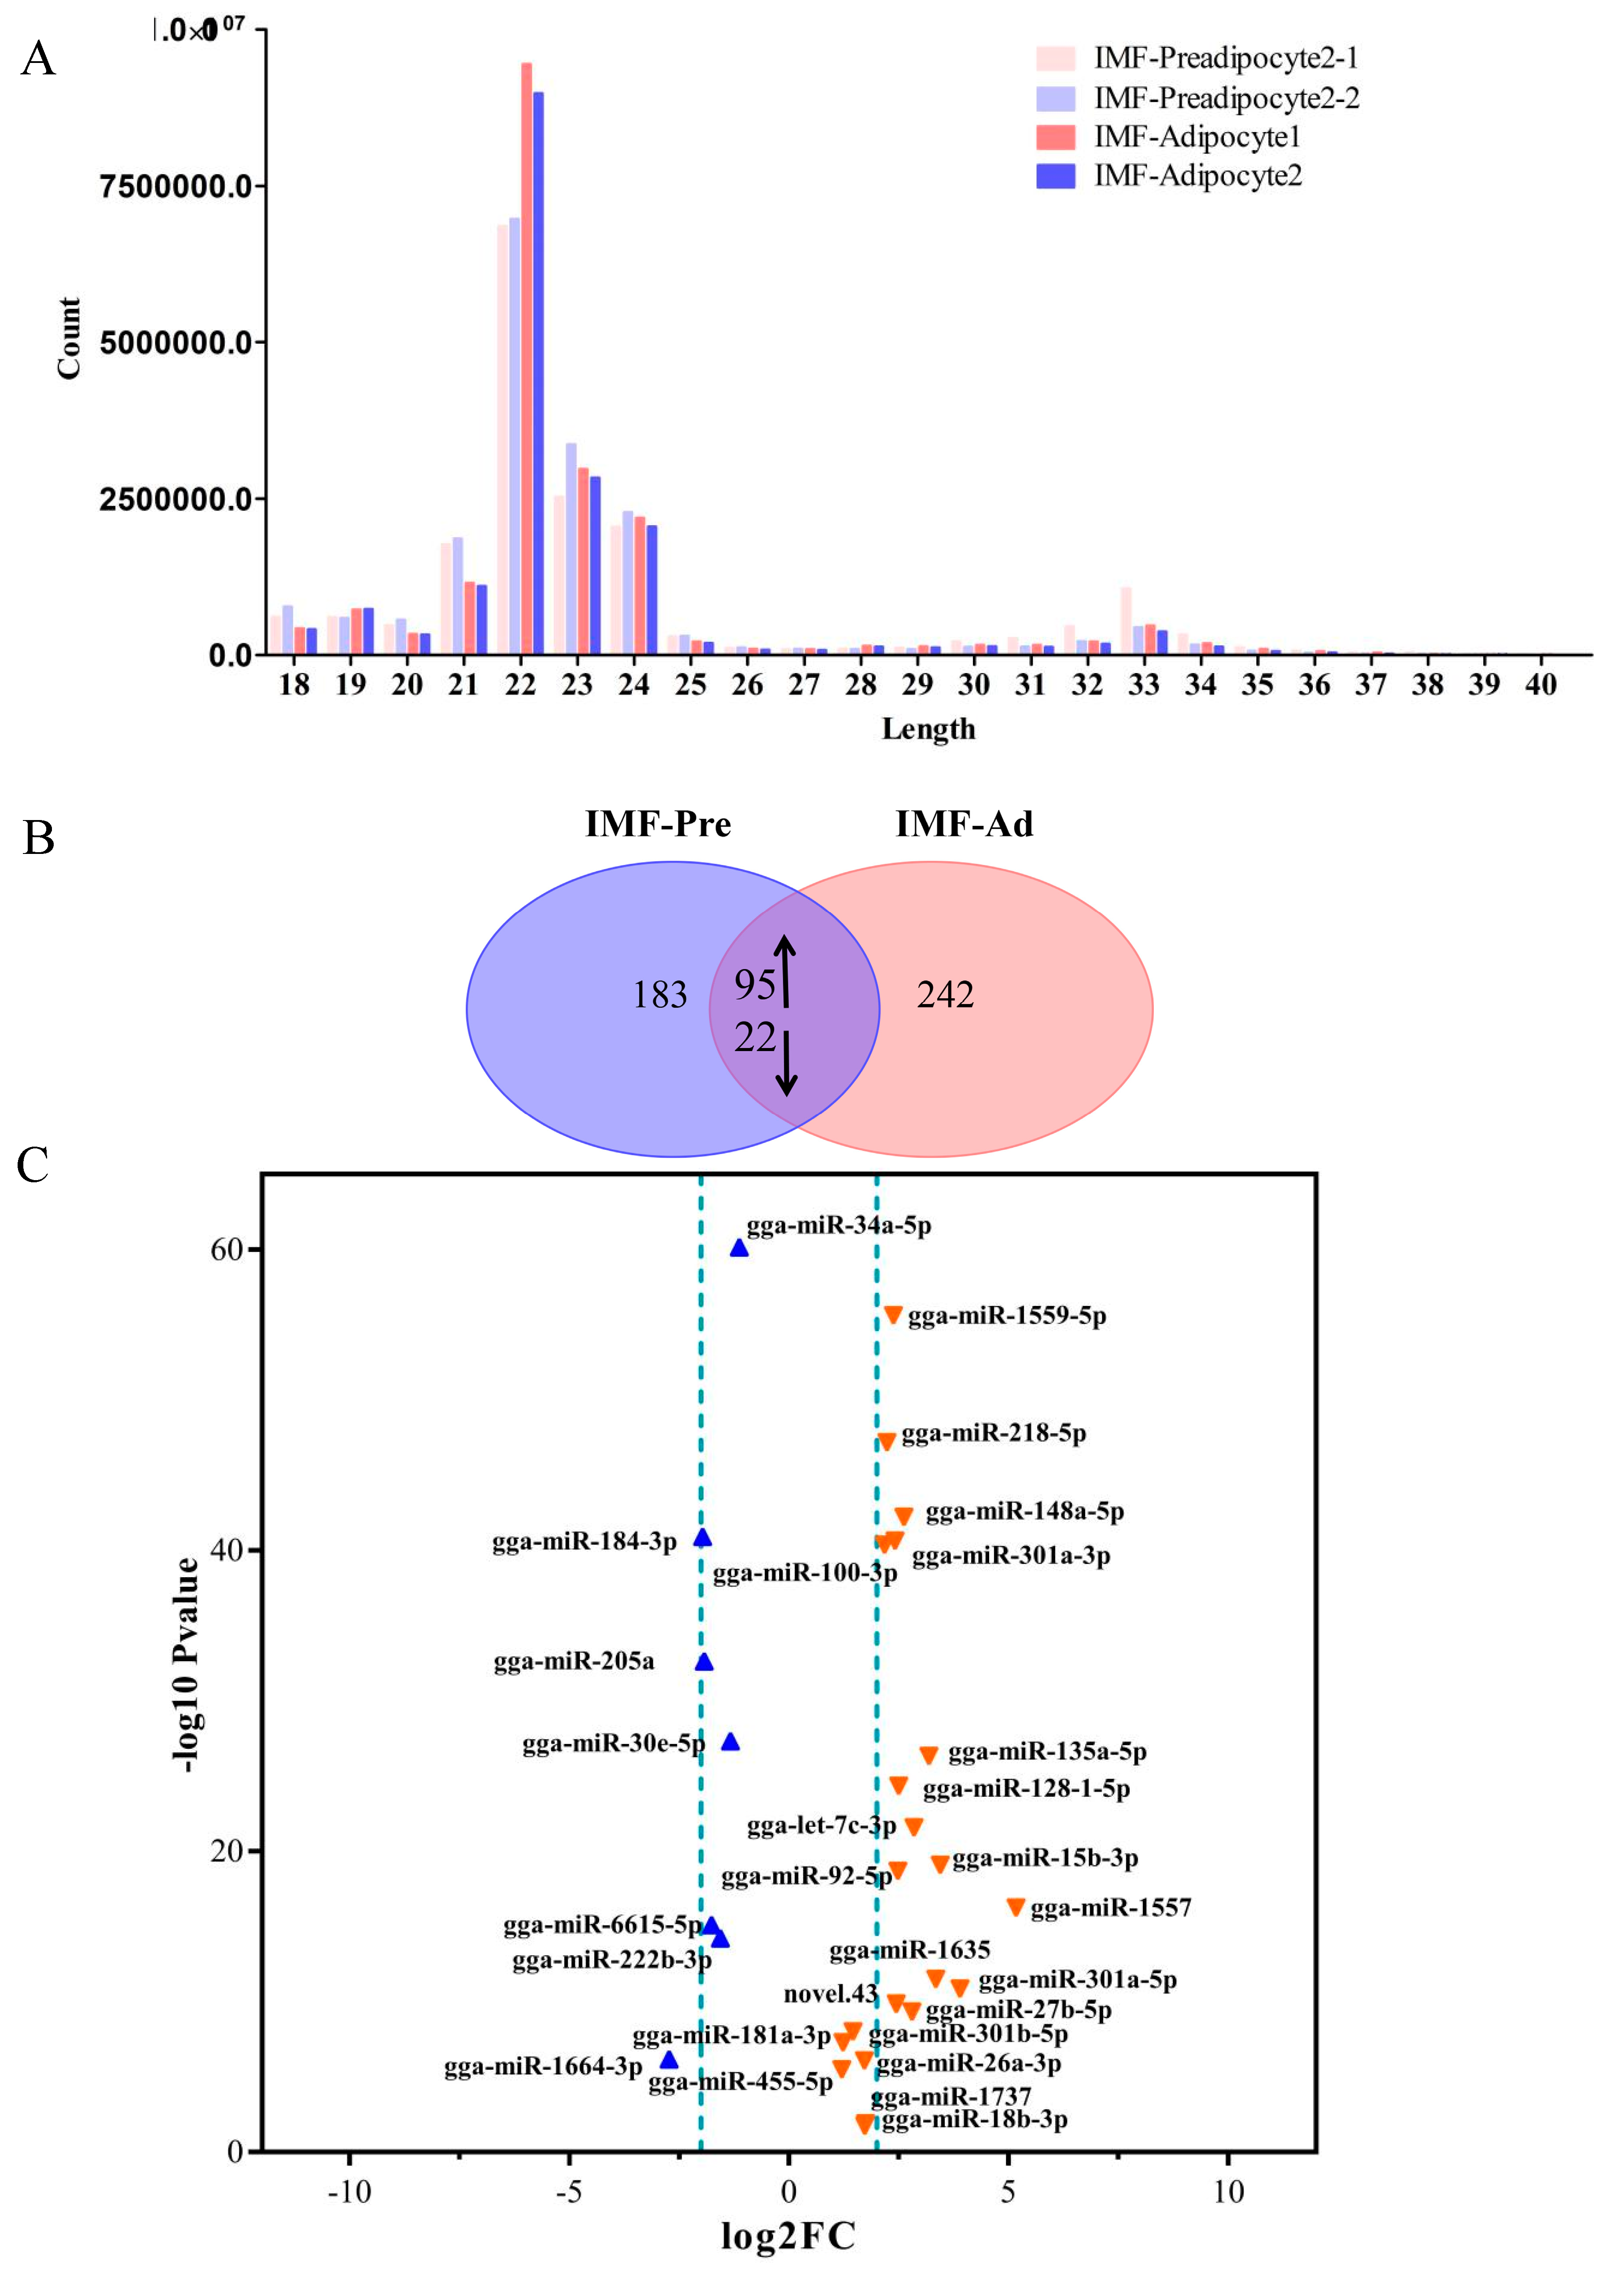
3.2. Summary of Sequencing Data

Four small RNA libraries were constructed as follows: IMF-Preadipocyte 2-1, IMF-Preadipocyte 2-2, IMF-Adipocyte 1, and IMF-Adipocyte 2, with two replicates for each treatment. And then were sequenced separately using an Illumina Genome Analyzer System. After discarding low-quality reads and masking adaptor sequences, clean reads with 21 to 24 nt in length were obtained, with the vast majority being 22 nt in length, which was consistent with the common size of miRNAs (Figure 2A). After quality control and adaptor removal, a total of 19,178,226; 19,786,345; 20,109,174; and 19,530,973 clean reads were obtained from four libraries respectively. The reads count of each library were about 20 M with more than 90% of Q20 score. The percentage of the 22 nt reads of the total were 37.68%, 38%, 48.83% and 49.56% for the four libraries. The high-quality reads were subsequently annotated to different categories of RNA (identified miRbase, repeats-associated RNA, rRNA, tRNA, snRNA, snoRNA, etc.) using databases such as miRBase (V19.0) [35] and Genbank (Gallus_gallus-5.0). The most abundant RNA species (based on read count) in the four libraries was classified as miRNAs, accounting for 71.58%, 56.53%, 72.41%, and 57.06% in the four libraries. This indicated that the deep sequencing data were highly enriched for mature miRNA sequences and well suitable for subsequent profiling analysis. The second most abundant category was rRNAs, accounting for 4.36%, 8.34%, 3.89%, and 14.02% in the four libraries, respectively. In addition, unknown RNAs also represented a high percentage (17.82%, 29.08%, 17.65%, and 24.13%, respectively). Finally, all reads were aligned against the chicken genome using the program miRCat [34].

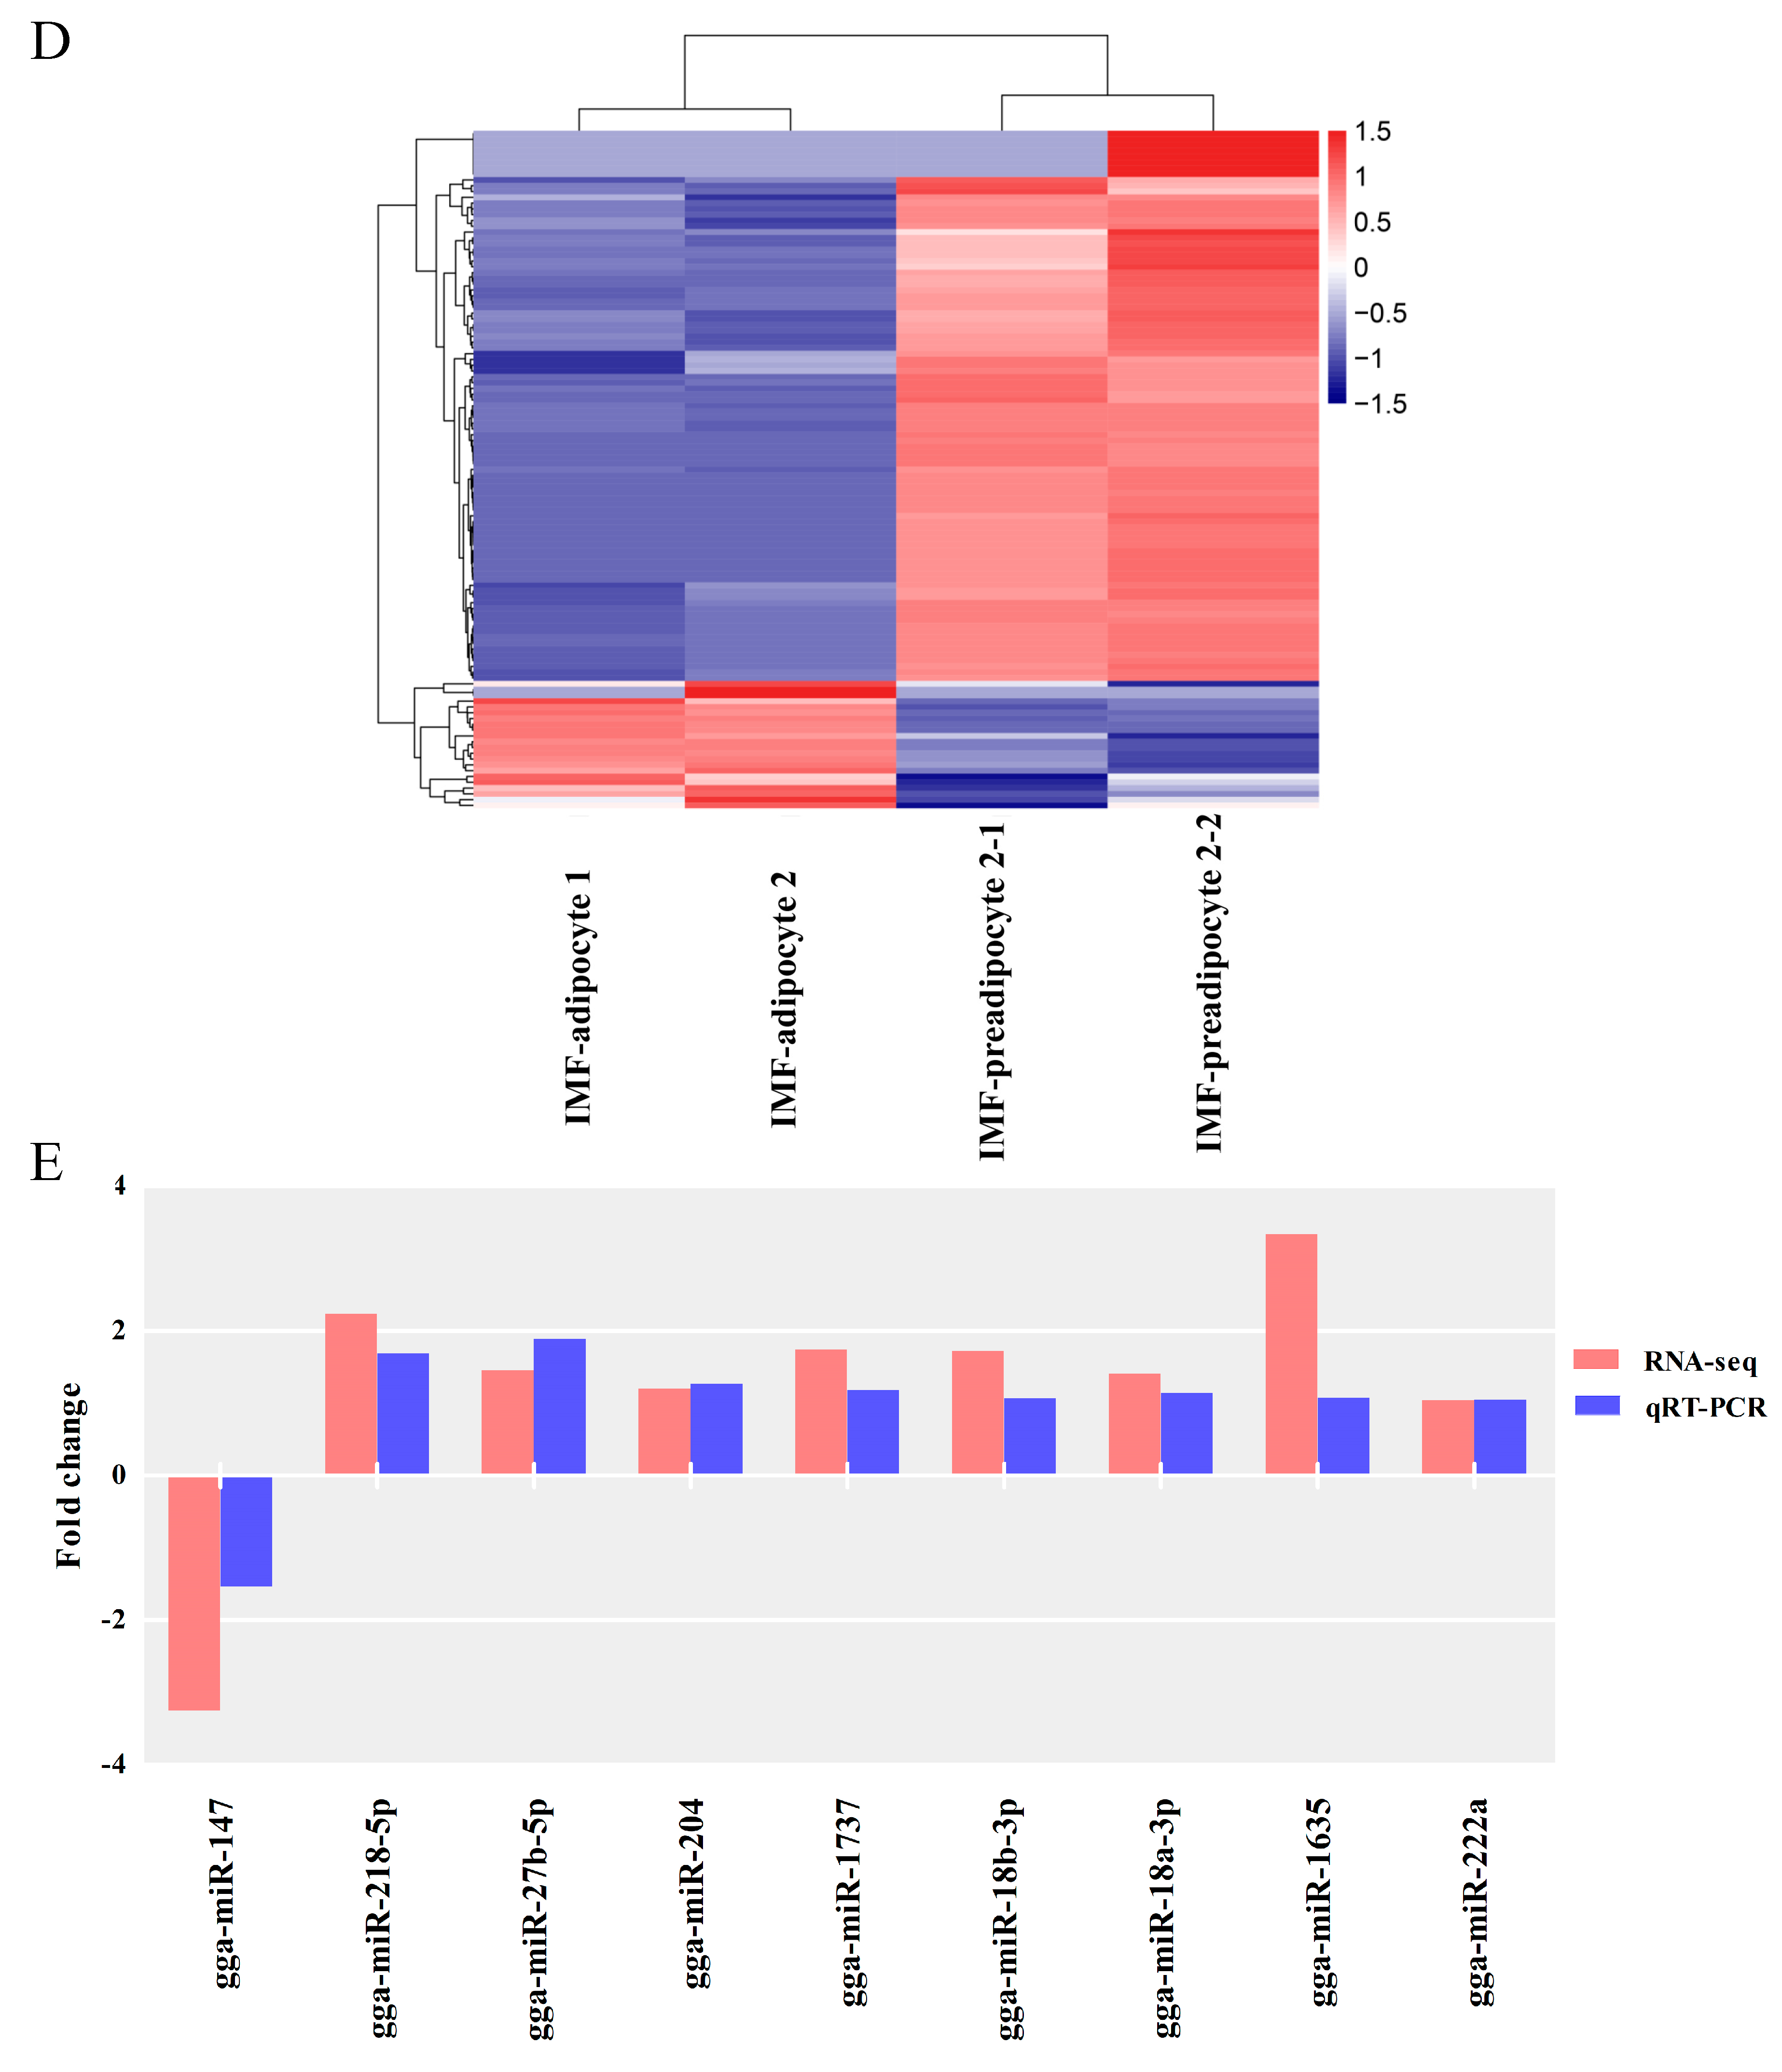
3.3. Screening for Differentially Expressed miRNAs

To identify the major miRNAs involved in intramuscular fat deposition in chicken, differentially expressed miRNAs were screened between the IMF-preadipocytes and IMF-adipocytes groups. In total, 117 differential miRNAs were identified, including 91 known miRNAs and 26 novel miRNAs (Table S1). Of these, 95 were up-regulated and 22 were down-regulated miRNAs in IMF-adipocytes relative to IMF-preadipocytes (Figure 2B,C). Furthermore, clustering analysis indicated that high similarity was shown within two replicates for each group (Figure 2D). To double check the results of miRNA-seq, nine differentially expressed miRNAs, including eight down-regulated and one up-regulated, were randomly selected for qPCR assay. Figure 2E showed the result of relative expression level from qPCR, which was consistent with the miRNA-Seq data. It indicated that identification and abundance estimation of miRNAs were reliable in this study.

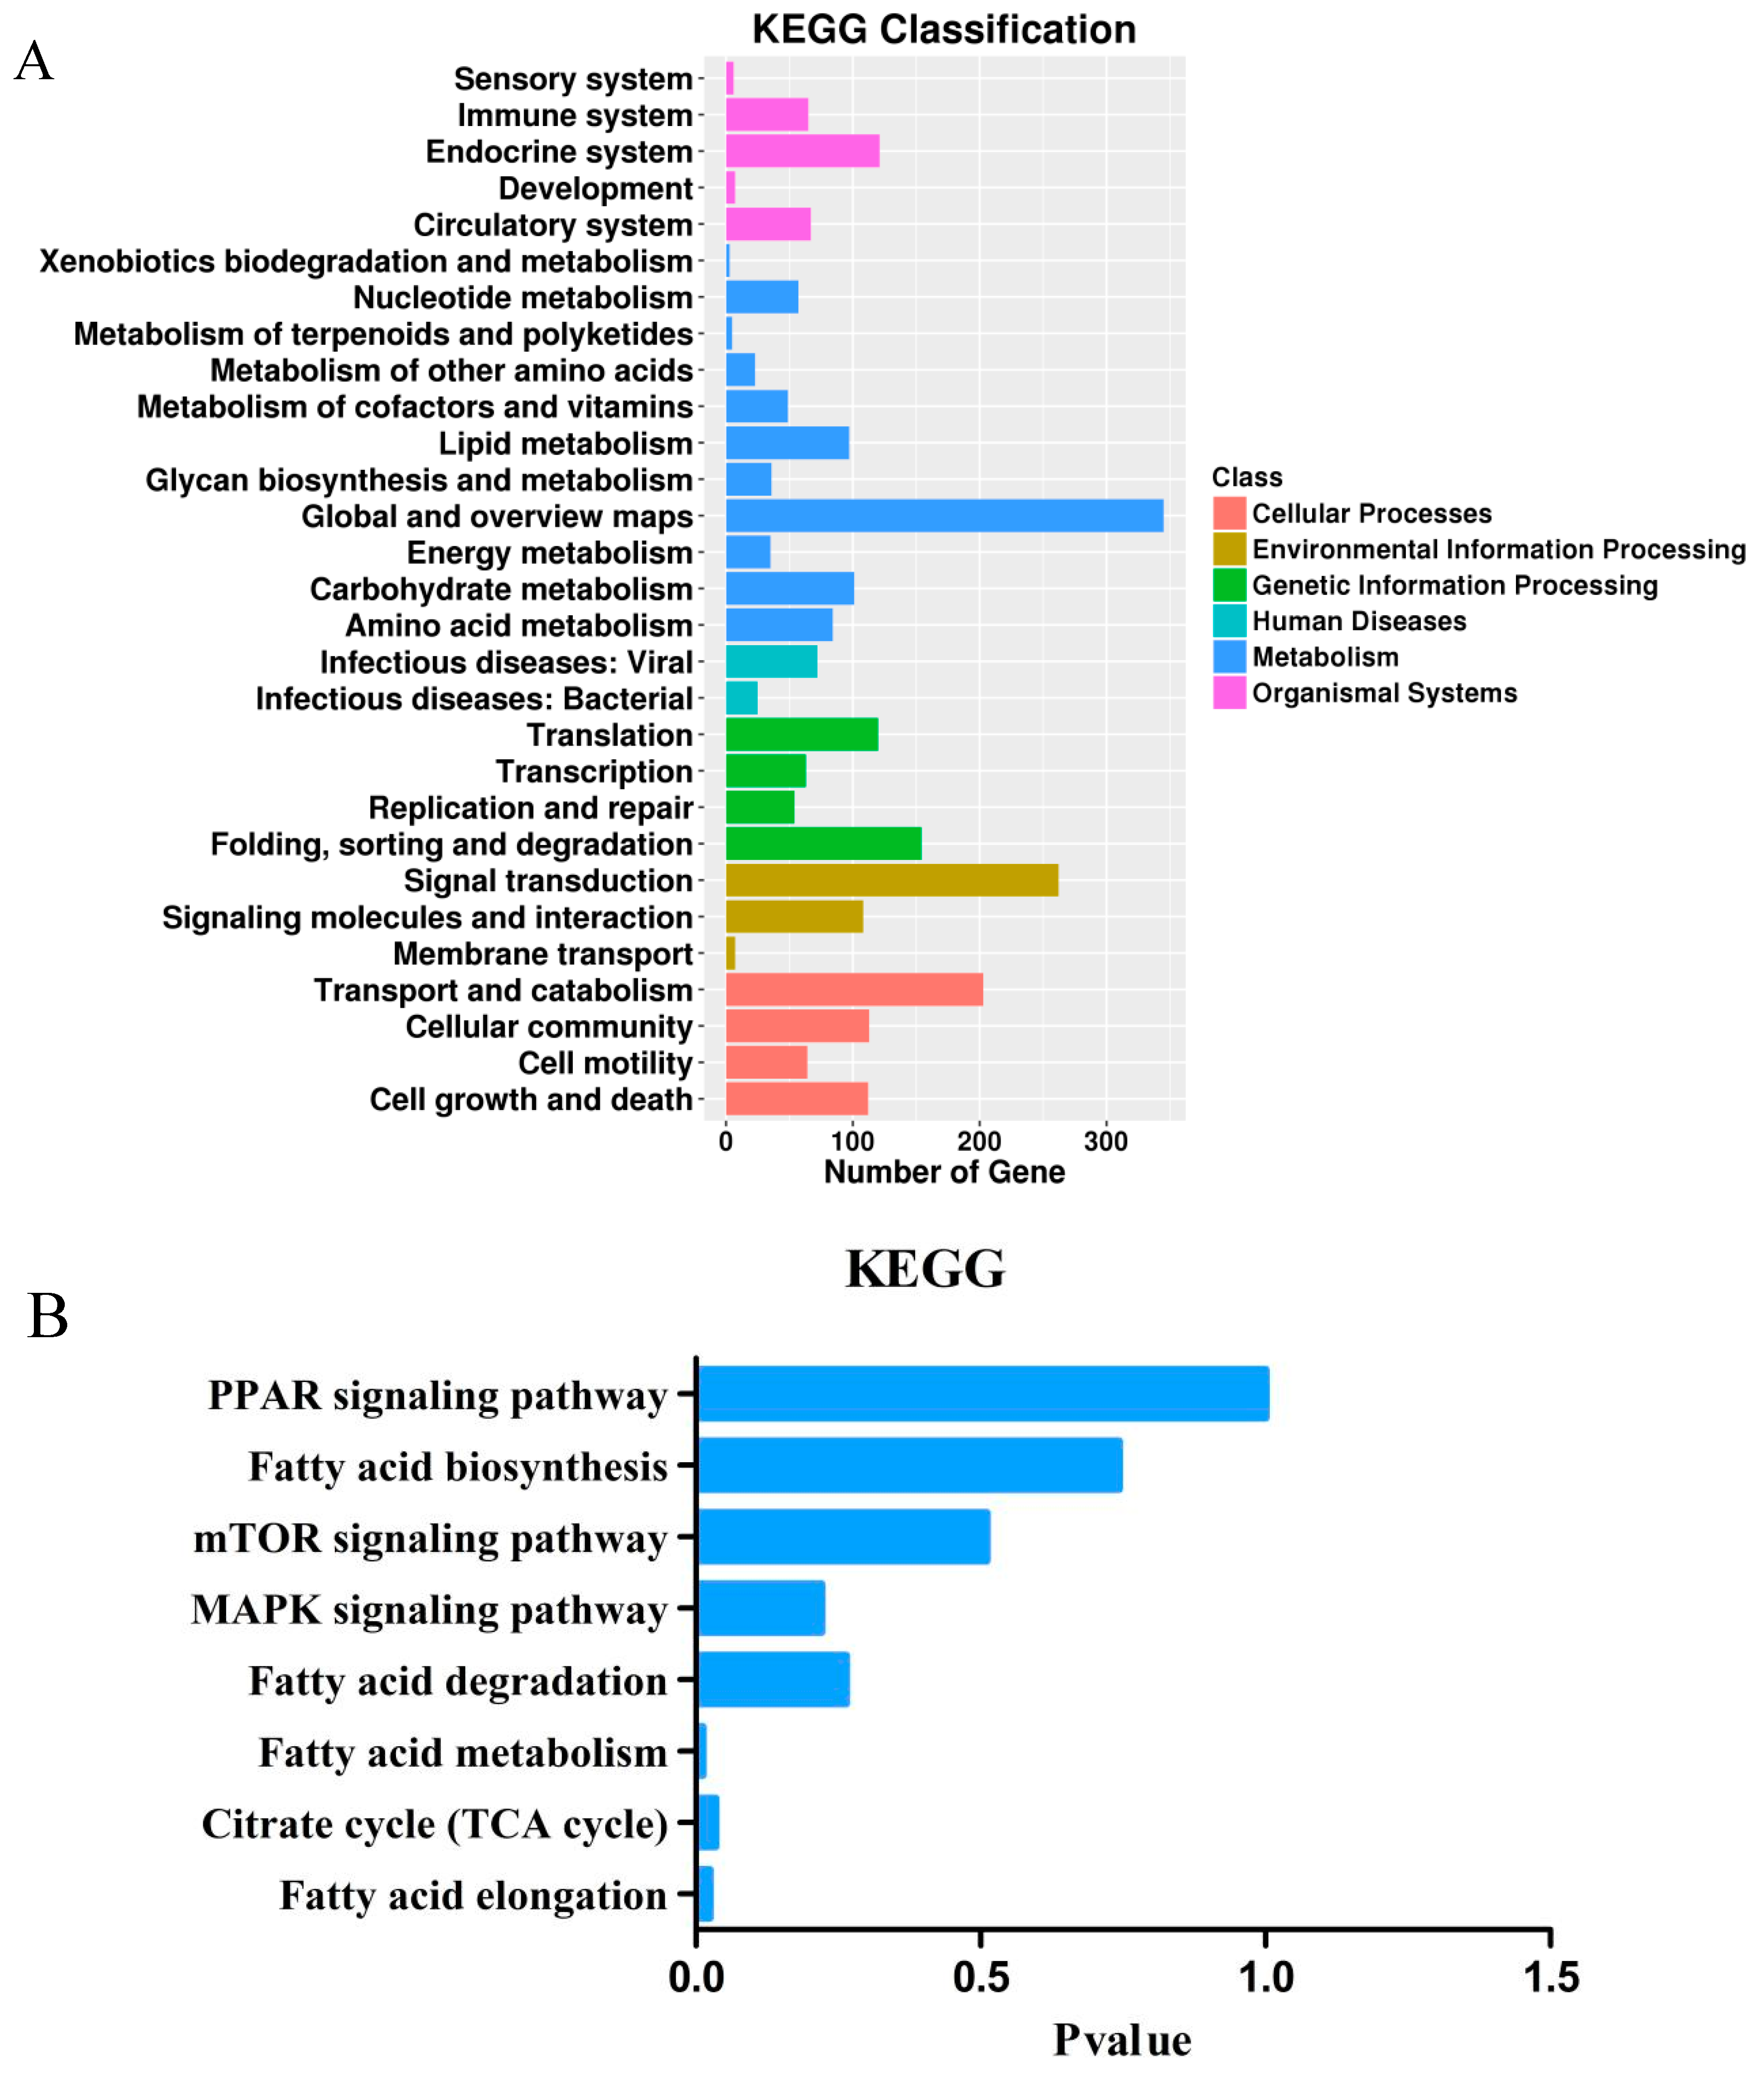
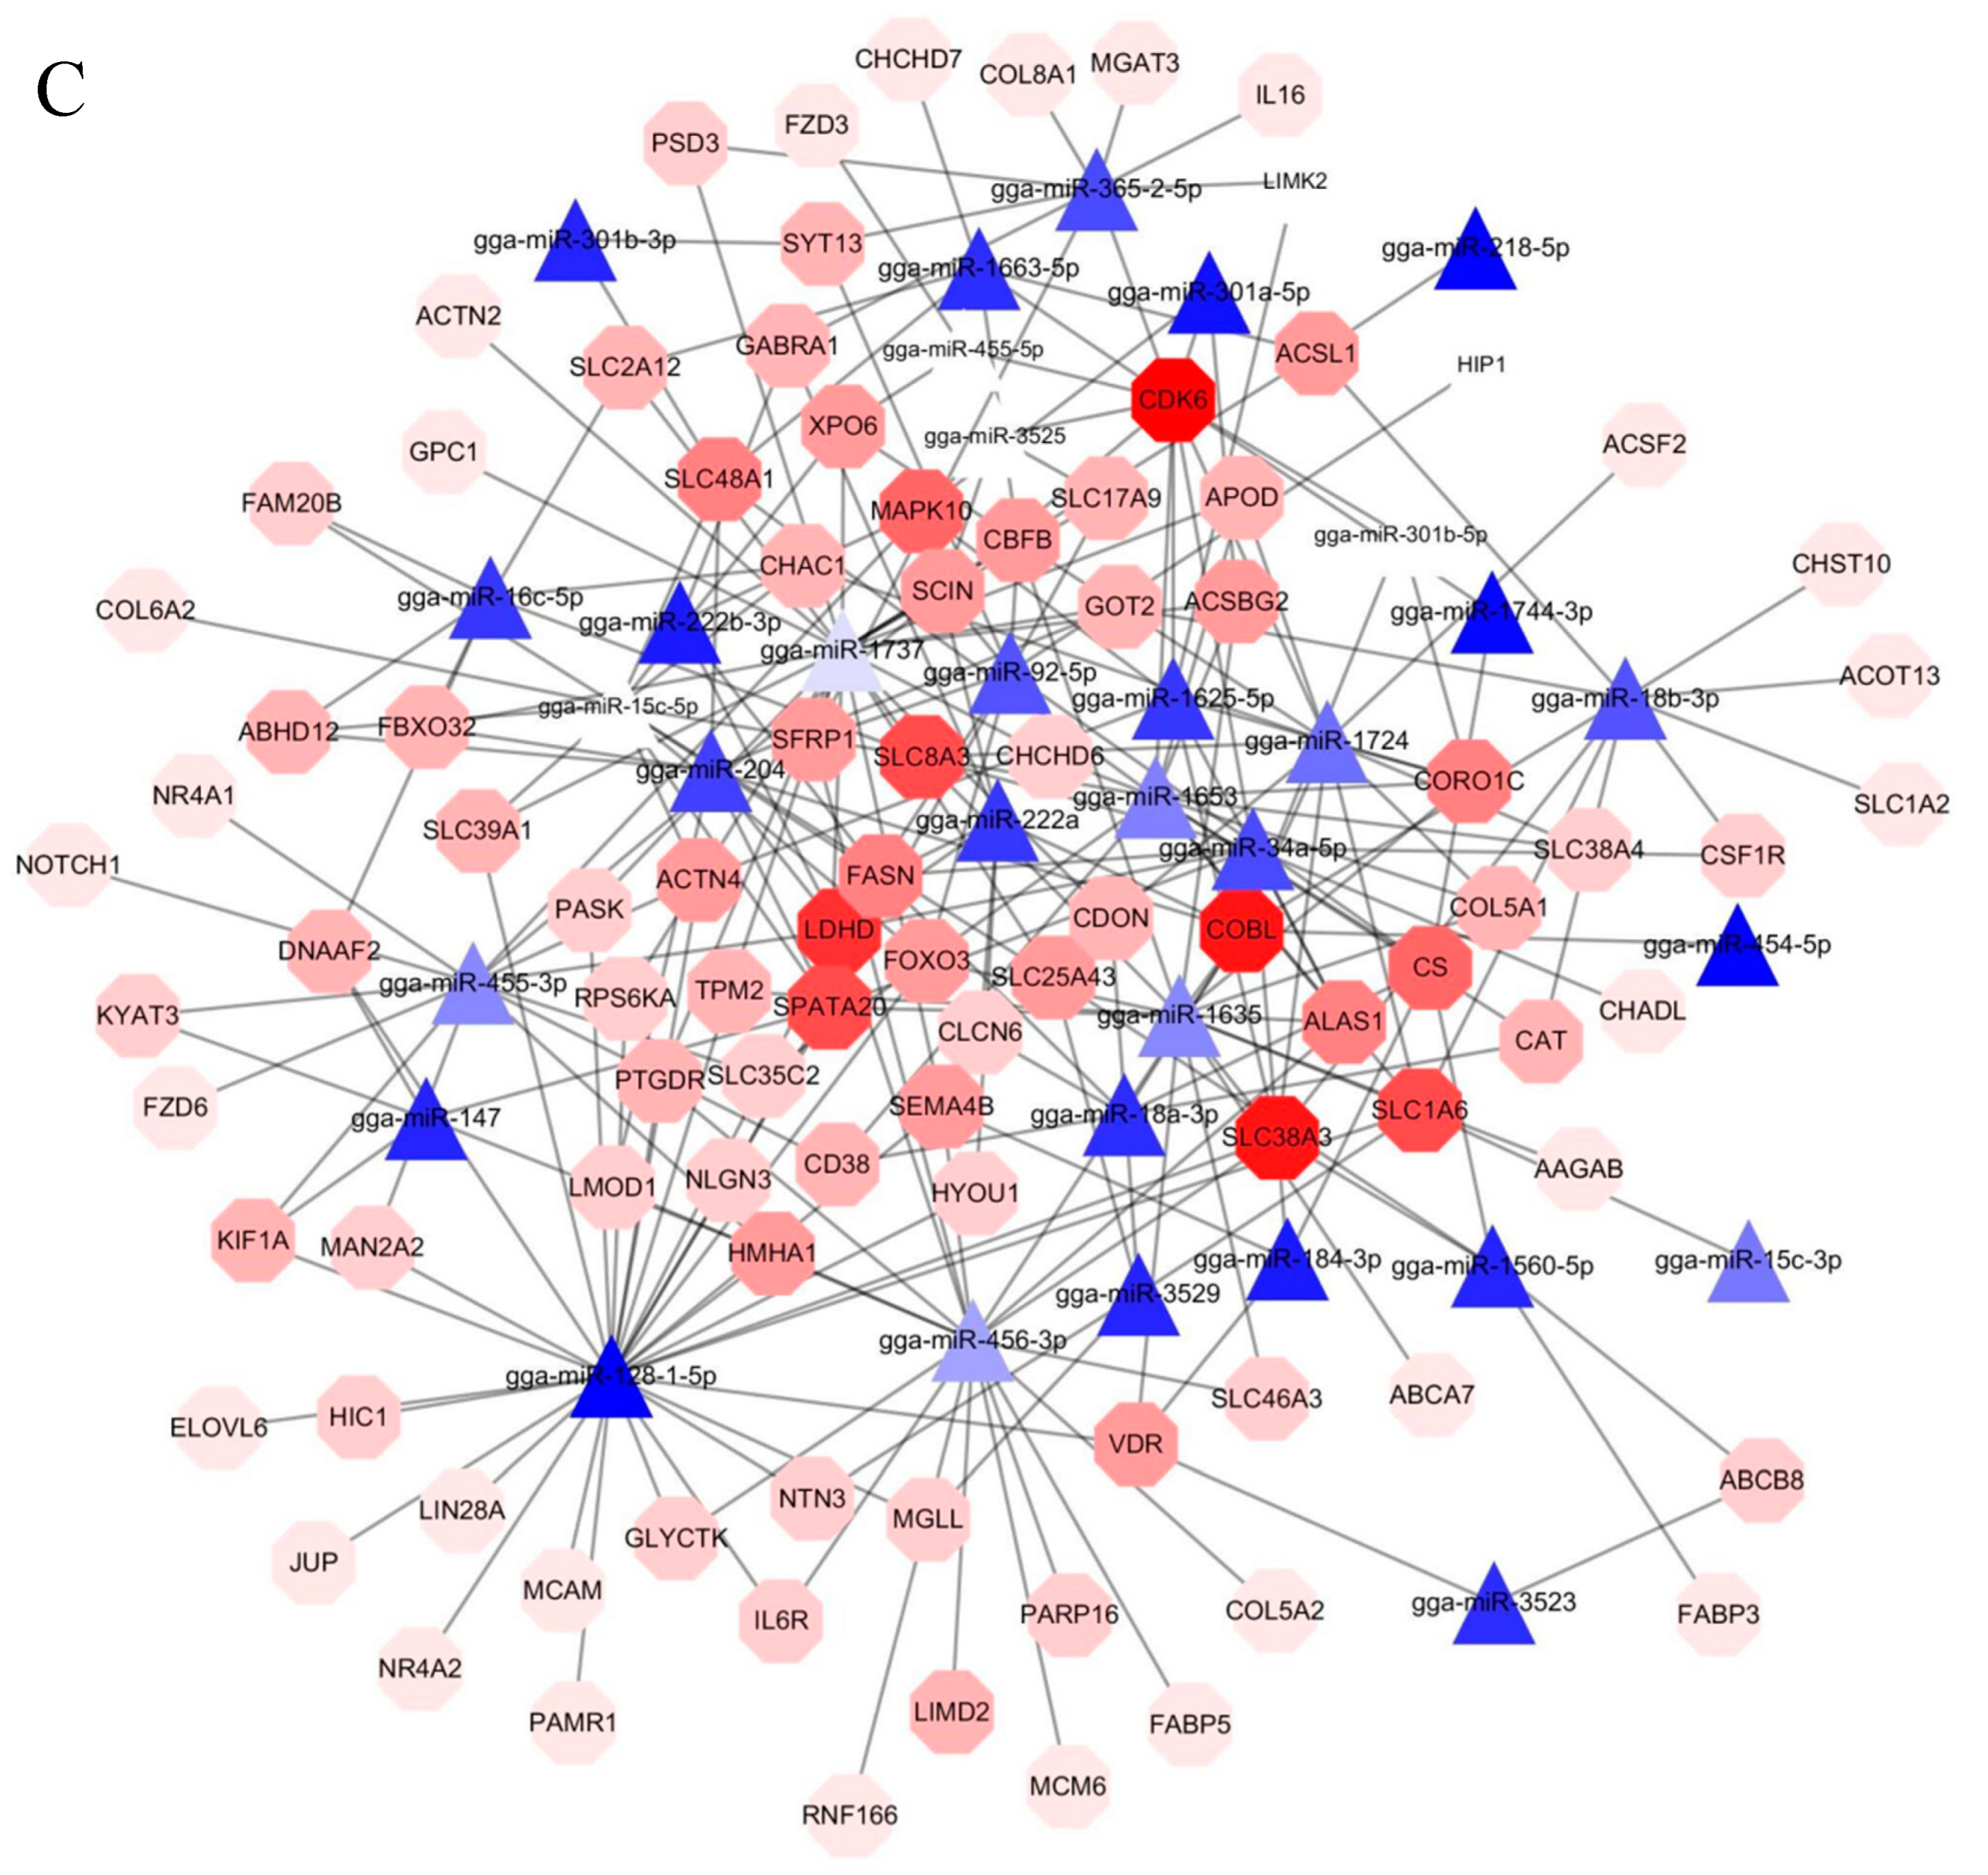
3.4. Target Gene Prediction, Functional Enrichment Analysis, and Candidate Genes Identification

To better understand the potential miRNAs responsible for adipogenesis in chicken, target prediction of differentially expressed miRNAs and functional enrichment analysis were conducted. A total of 4005 target genes were identified by 117 differentially expressed miRNAs. All target genes were subjected to enrichment analysis of functions and signaling pathways. Biological processes significantly enriched in adipogenesis-related terms, including regulation of cell differentiation (GO:0045595), cellular lipid metabolic process (GO:0044255) and lipid metabolic process (GO:0006629) (Table S2). Furthermore, many lipid-related pathways were also enriched by target genes, such as fatty acid metabolism (gga01212), fatty acid elongation (gga00062), citrate cycle (TCA cycle) (gga00020) and fatty acid degradation (gga00071) (Figure 3A). Eight pathways related to lipid metabolism were focuse (Figure 3B and Table 2). Of these, “fatty acid elongation” was significantly enriched by the ELOVL gene family, HACD gene family, ACOT7, etc. Lots of published data has proven that the ELOVL and HACD gene families catalyzed the reactions of the long-chain fatty acids elongation cycle [35,36,37]. Additionally, it has already been reported that the ACOT gene family, such as ACOT7 and ACOT13, played a key role in the regulation of hepatic lipid metabolism [38,39].
In order to clarify the roles of miRNAs and genes in regulating lipid metabolism, a network was established with Cytoscape. Among these differentially expressed miRNAs, miR-18b-3p was noticed with its targets, the ACOT13 gene (Figure 3C). It was inferred that gga-miR-18b-3p might be an important miRNA responsible for lipid metabolism.

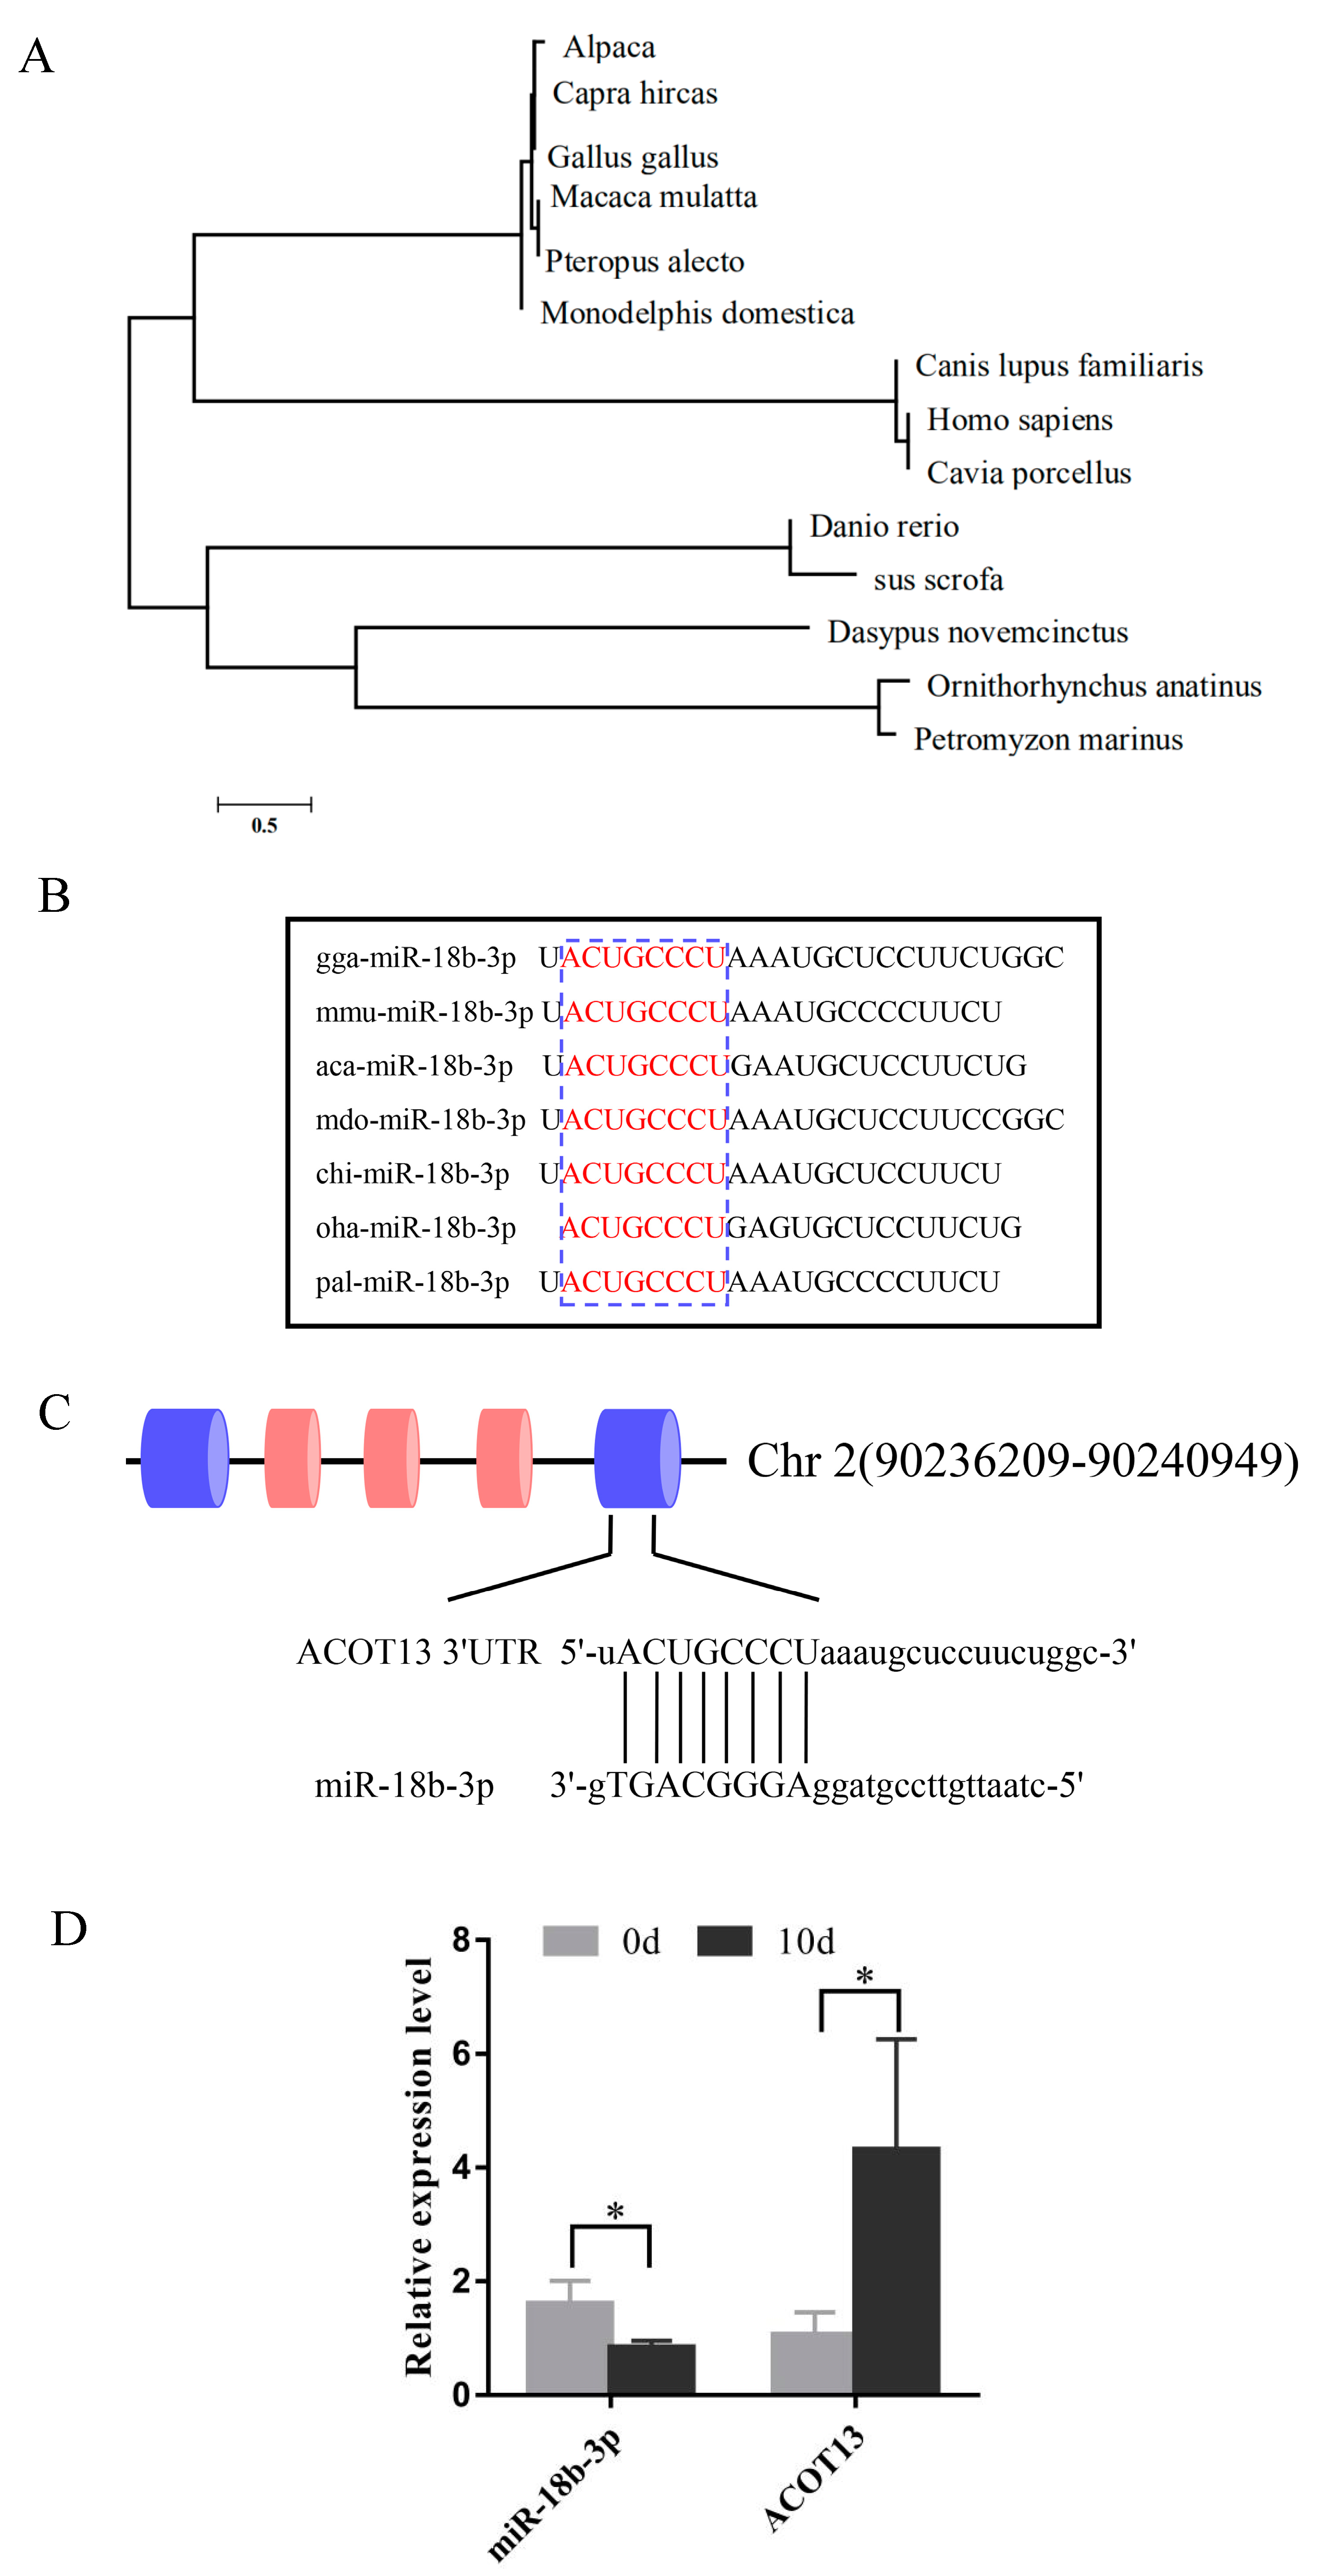
3.5. Expression of gga-miR-18b-3p and ACOT13 in Preadipocytes and Adipocytes

To illustrate the homology of miR-18b-3p in various species, cluster analysis was performed, which indicated that chicken miR-18b-3p was highly identical with alpaca and Capra hircas (Figure 4A). Besides, the seed region of the mature miR-18b-3p sequence was highly conserved in mouse, reptile, chicken, goat, etc. (Figure 4B). A potential binding site for miR-18b-3p was identified in the 3′UTR region of the ACOT13 gene (Figure 4C). Furthermore, the expression pattern of gga-miR-18b-3p and its putative target ACOT13 were detected between pre-differentiation (0 day) and post-differentiation (10 days). As shown in Figure 4D, oppose expression pattern of miR-18b-3p and ACOT13 gene was observed at 10 days post-differentiation (Figure 4D). It indicated that there was a negative correlation between the expression of miR-18b-3p and the ACOT13 gene.

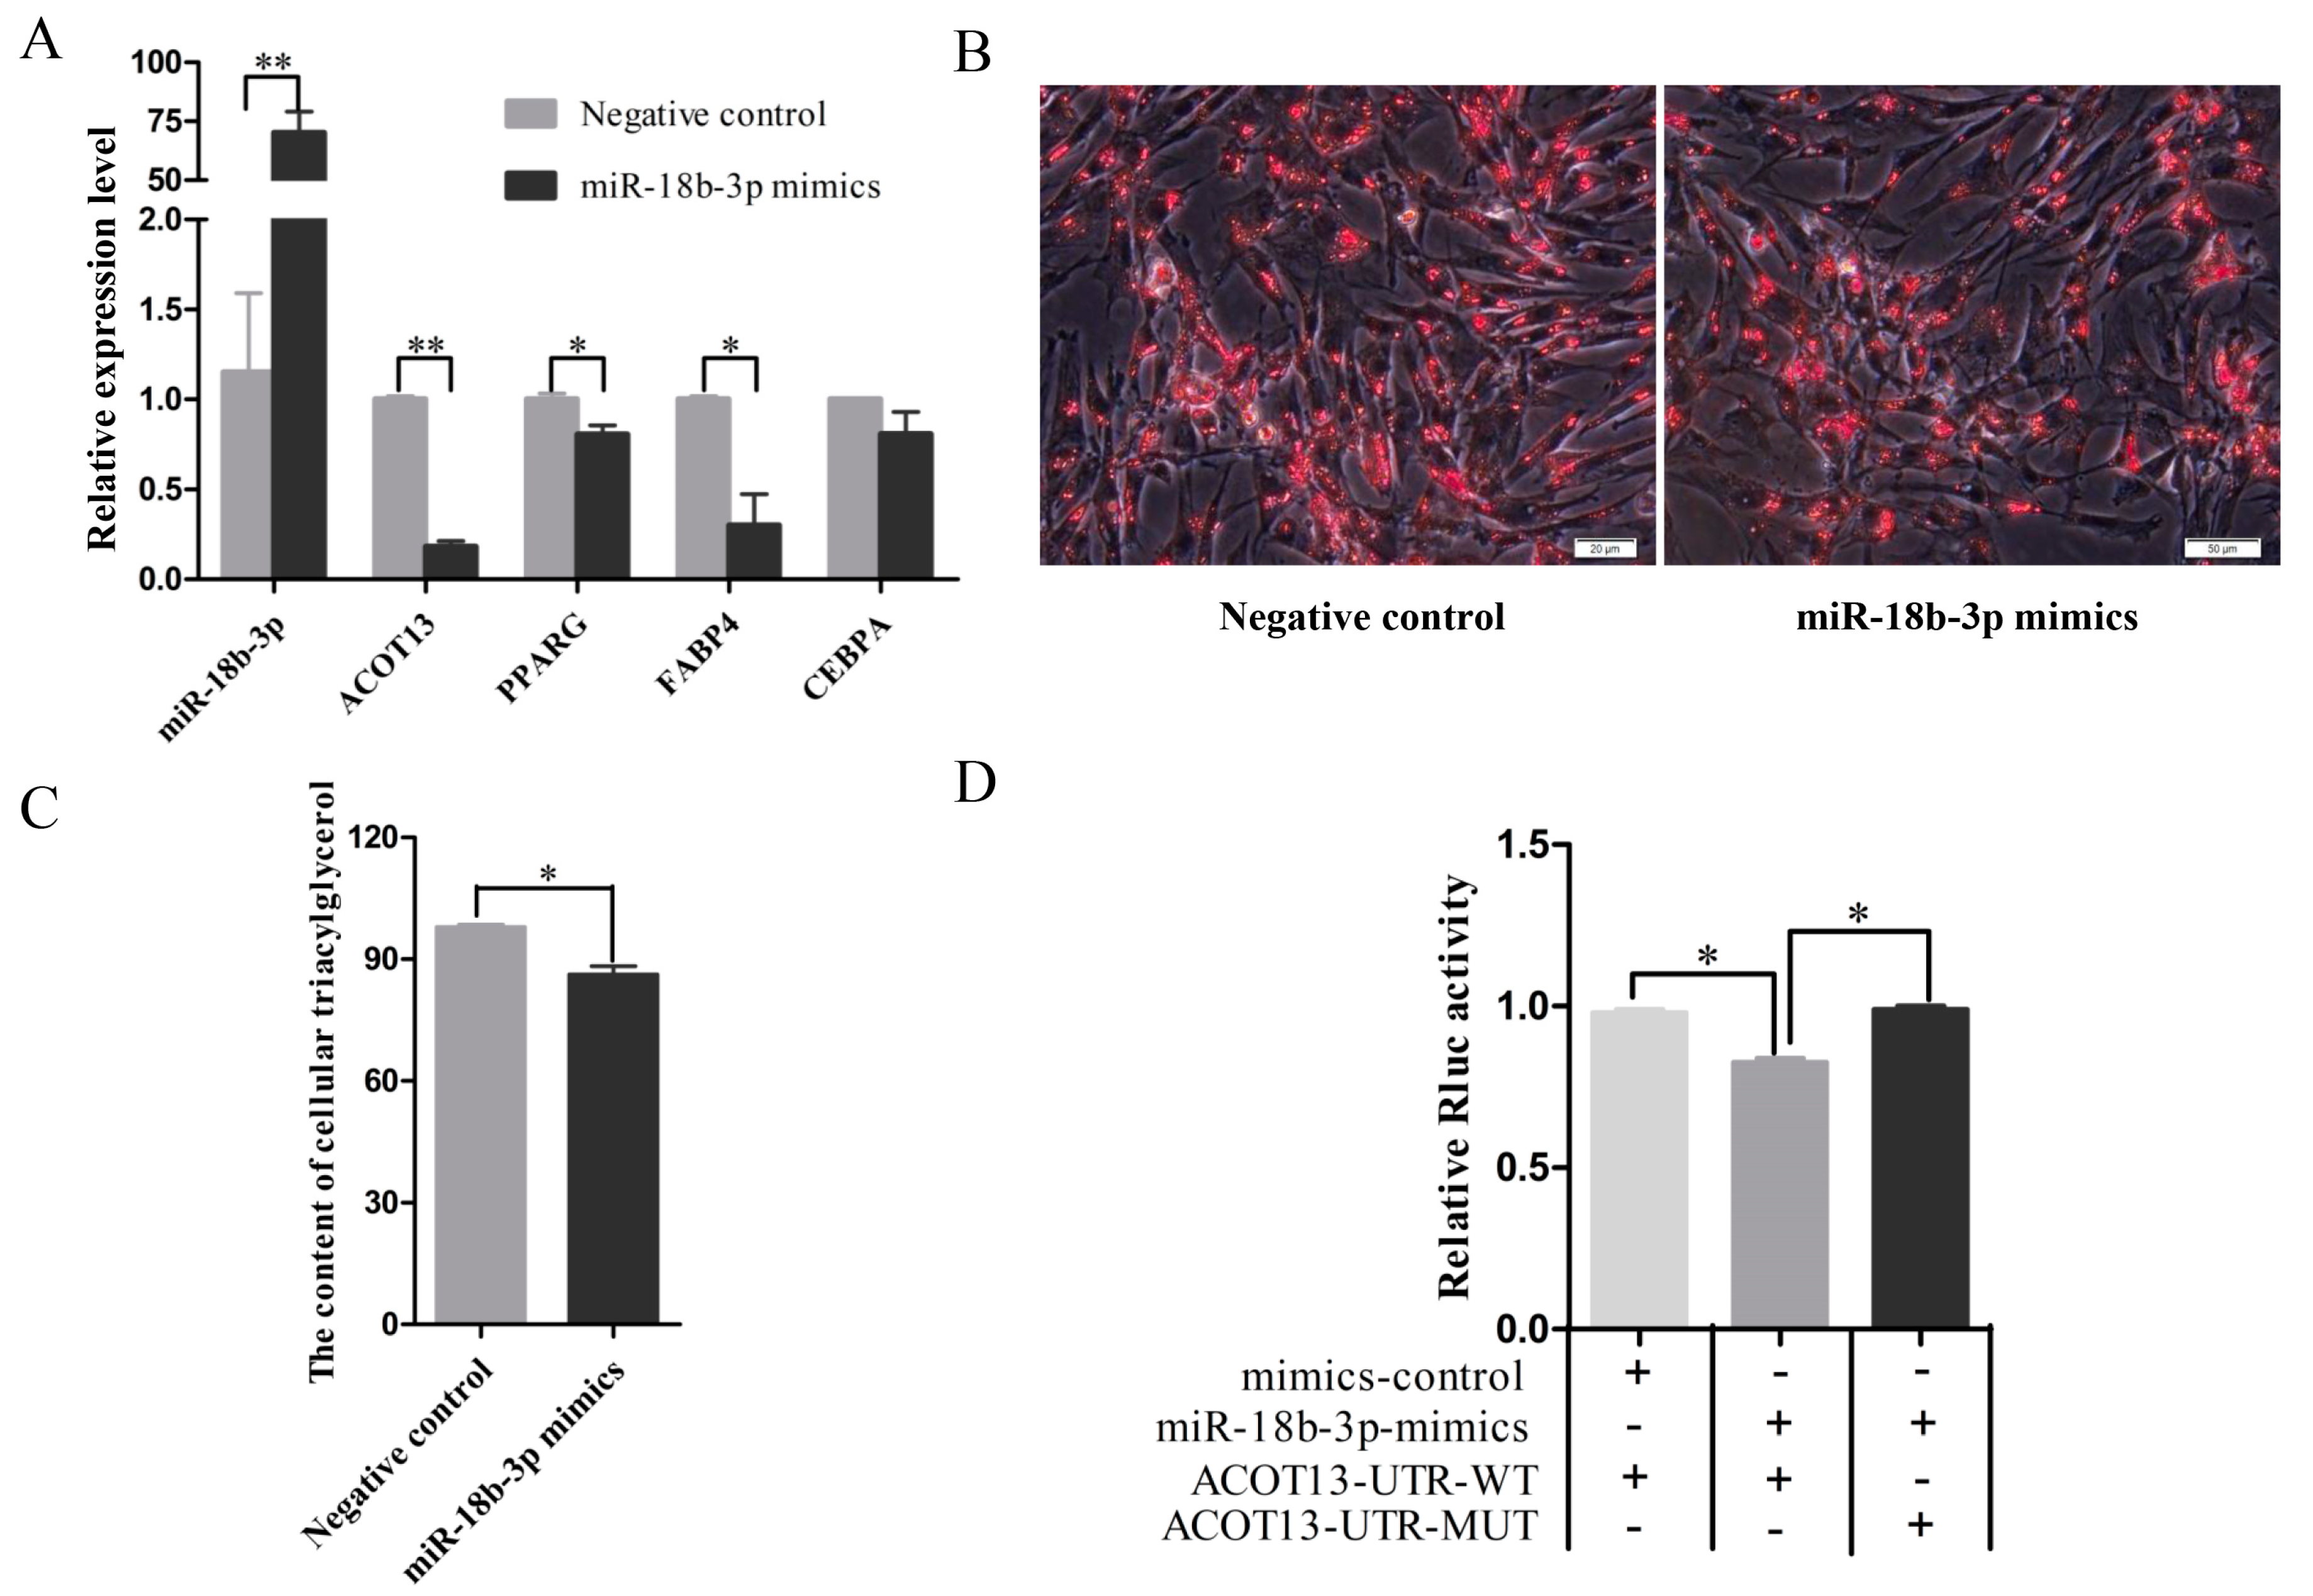
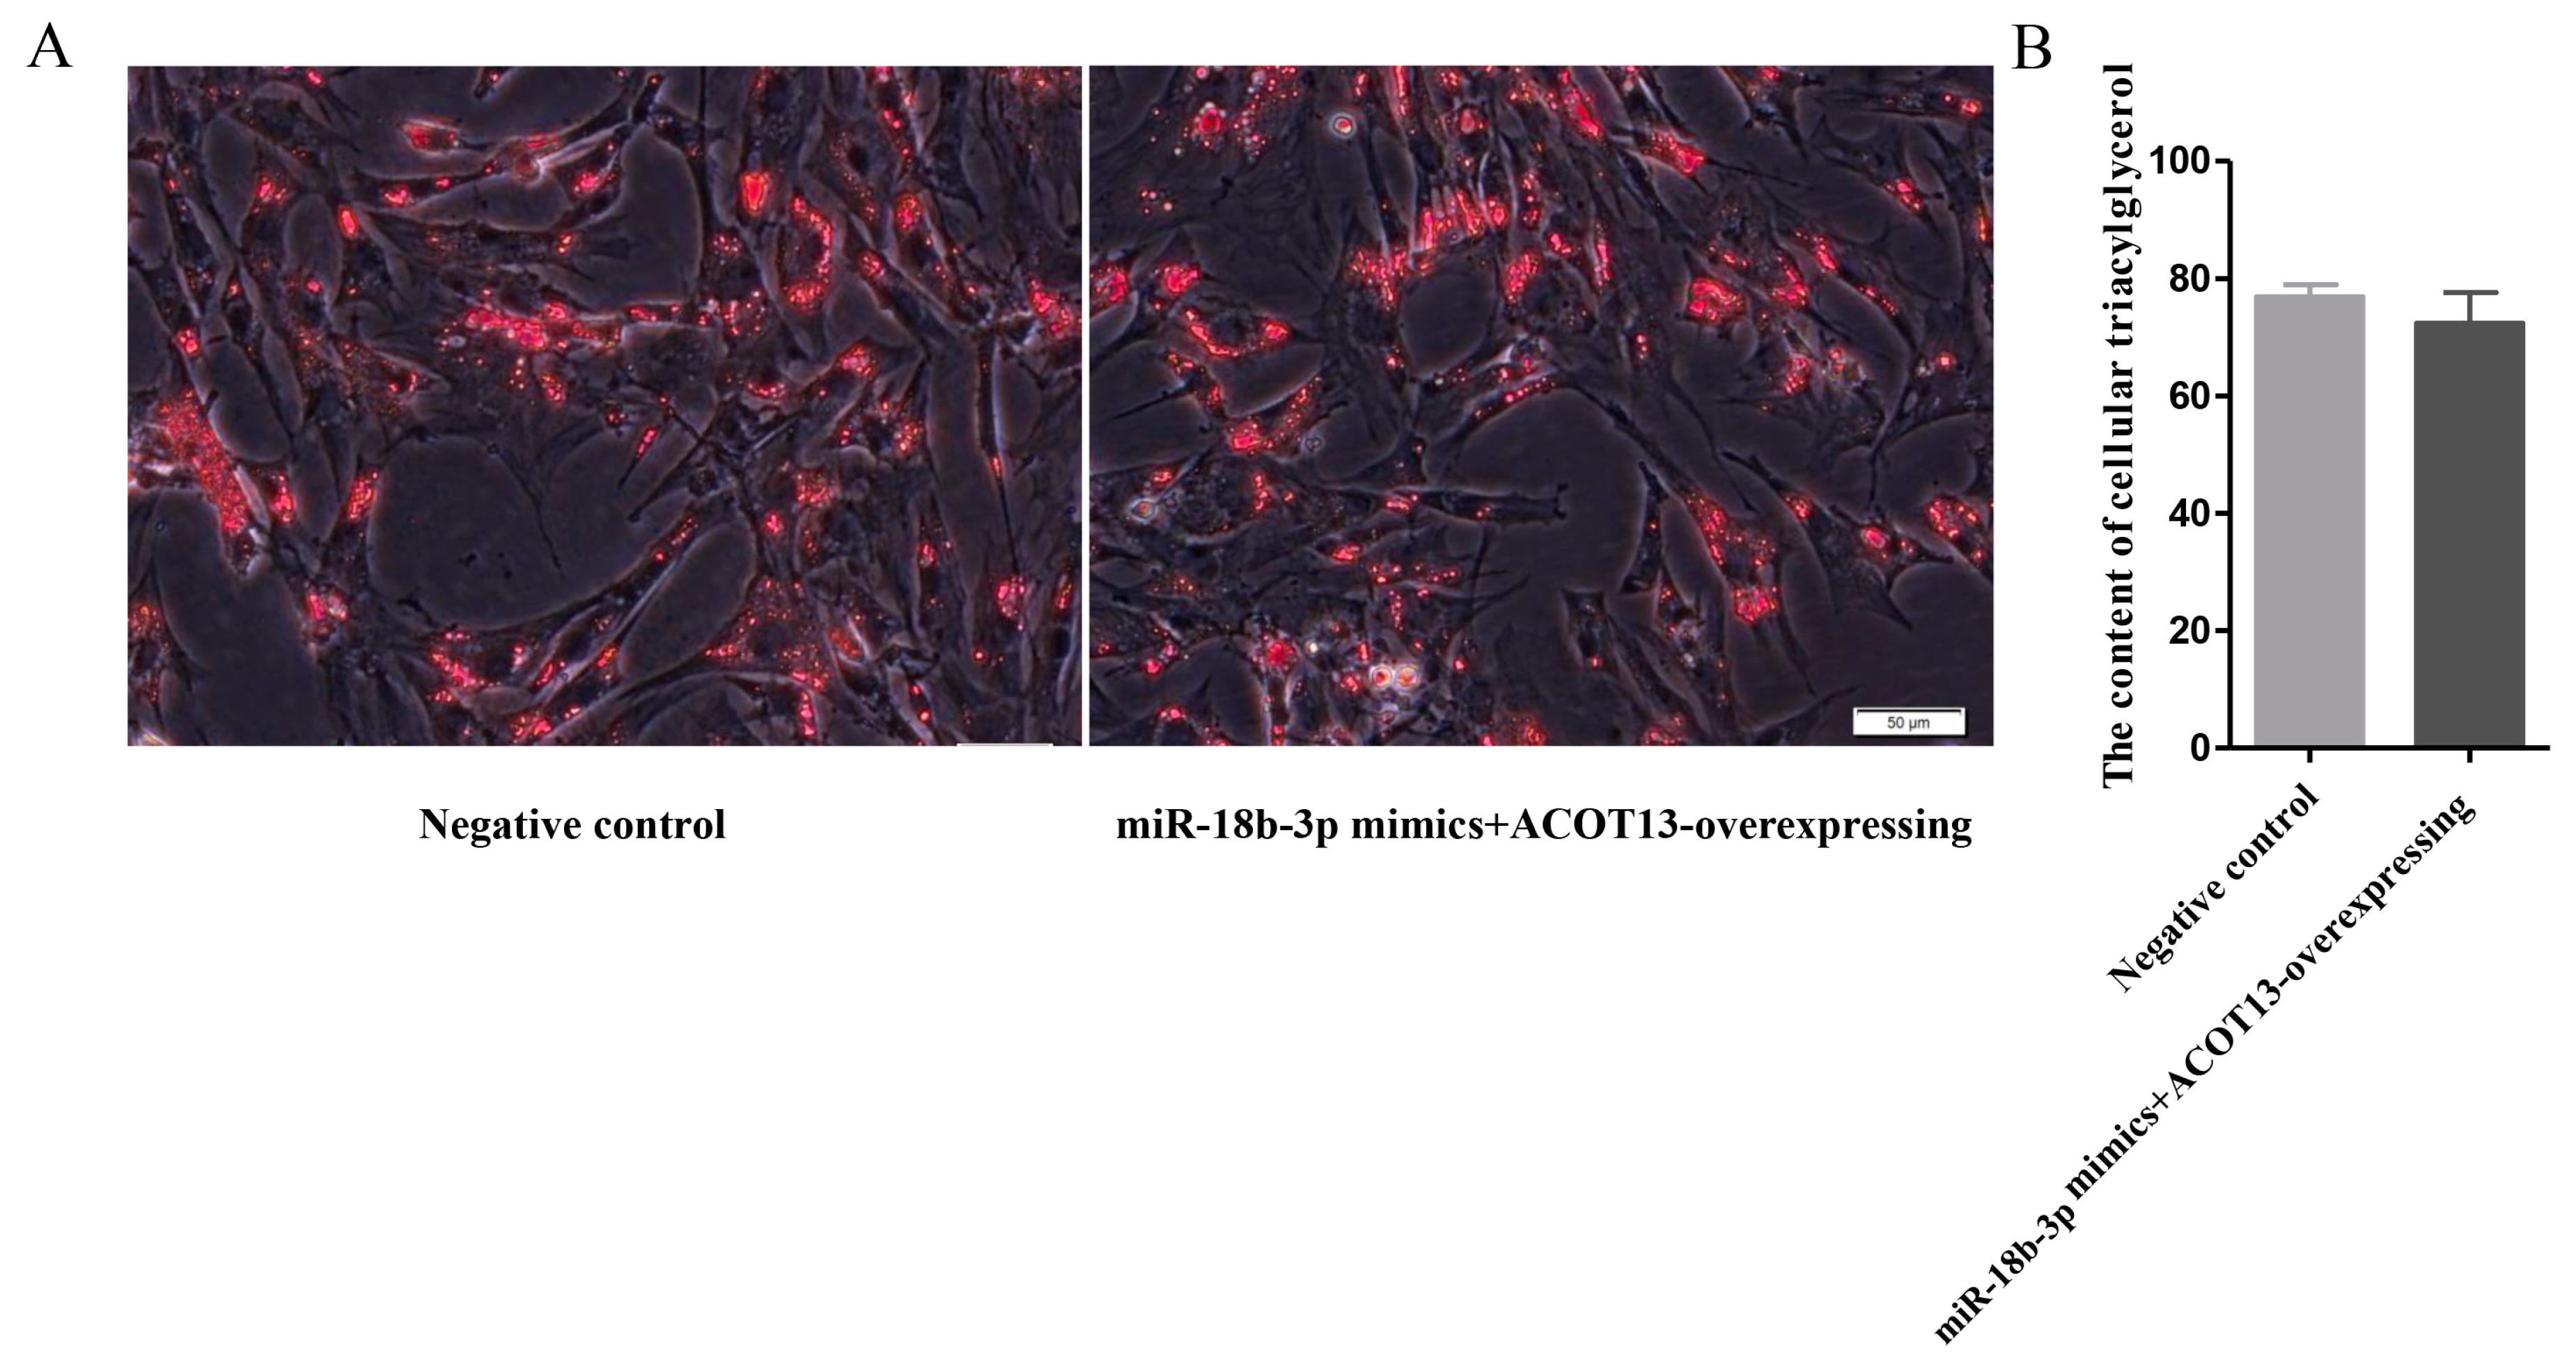
3.6. miR-18b-3p Functioned as an Inhibitor during Preadipocytes Differentiation by Targeting the ACOT13 Gene

To investigate the regulatory role of gga-miR-18b-3p on preadipocyte differentiation, an over-expression experiment was conducted by transfecting gga-miR-18b-3p mimics into chicken preadipocytes. Compared with negative control, the expression level of gga-miR-18b-3p was significantly increasing in the overexpression group (Figure 5A). Expectedly, the expression levels of ACOT13, PPARG, and FABP4 were significantly decreased in the gga-miR-18b-3p overexpressing group relative to negative control. The differentiation of preadipocytes was determined using Oil Red O staining and intracellular triglycerides concentration. Evidence from Oil Red O staining suggested that the number of lipid droplets was decreased in the overexpression group compared with the control group (Figure 5B). Furthermore, the concentration of intracellular triglyceride in the gga-miR-18b-3p overexpressing group was significantly lower than that of the negative control group (Figure 5C). All of the above results demonstrated that gga-miR-18b-3p functioned as an inhibitor for preadipocytes differentiation.
In order to confirm the gga-miR-18b-3p target on ACOT13, a plasmid-containing wild-type or mutant target site of the 3′UTR region of the ACOT13 gene was transfected into DF1 cells together with gga-miR-18b-3p or negative control mimics. gga-miR-18b-3p mimics significantly decreased the luciferase activity of ACOT13-3′UTR-WT, but it did not affect the activity of ACOT13-3′UTR-MUT (Figure 5D). This result indicated that gga-miR-18b-3p could directly bind on the 3′UTR region of the ACOT13 gene. Taken together, these results suggested that miR-18b-3p inhibited the preadipocytes differentiation by down-regulating the ACOT13 gene.

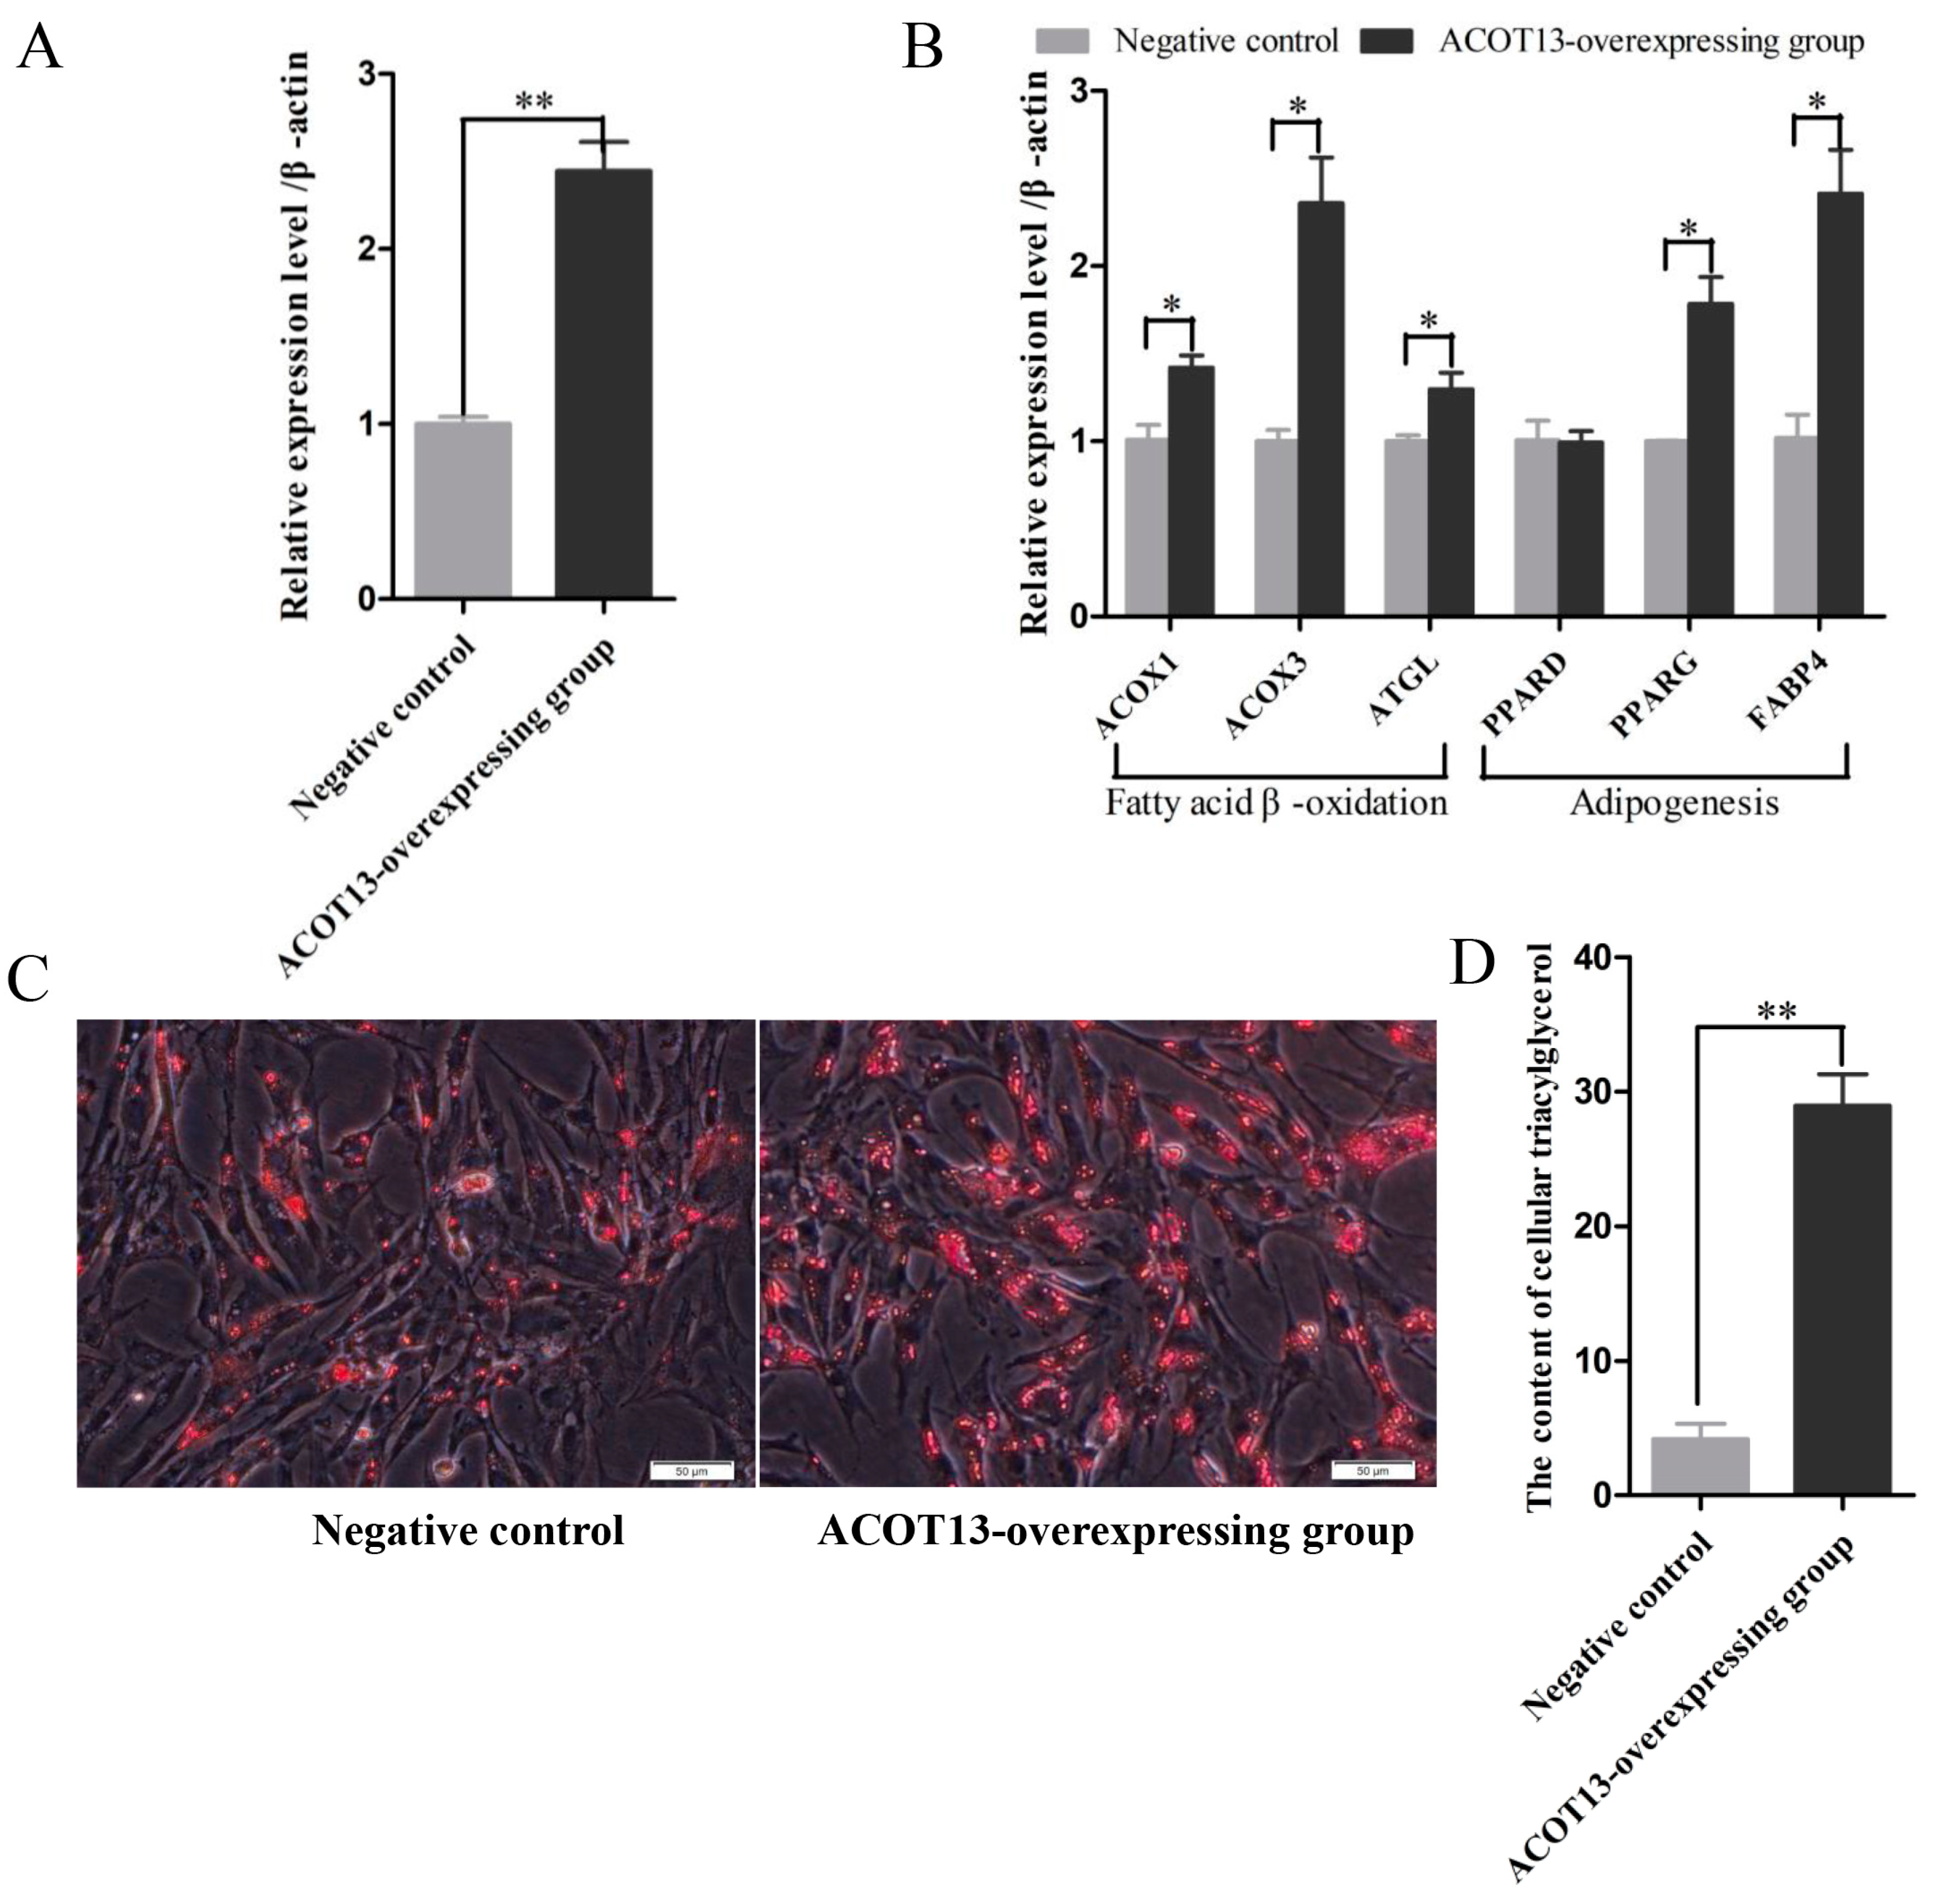
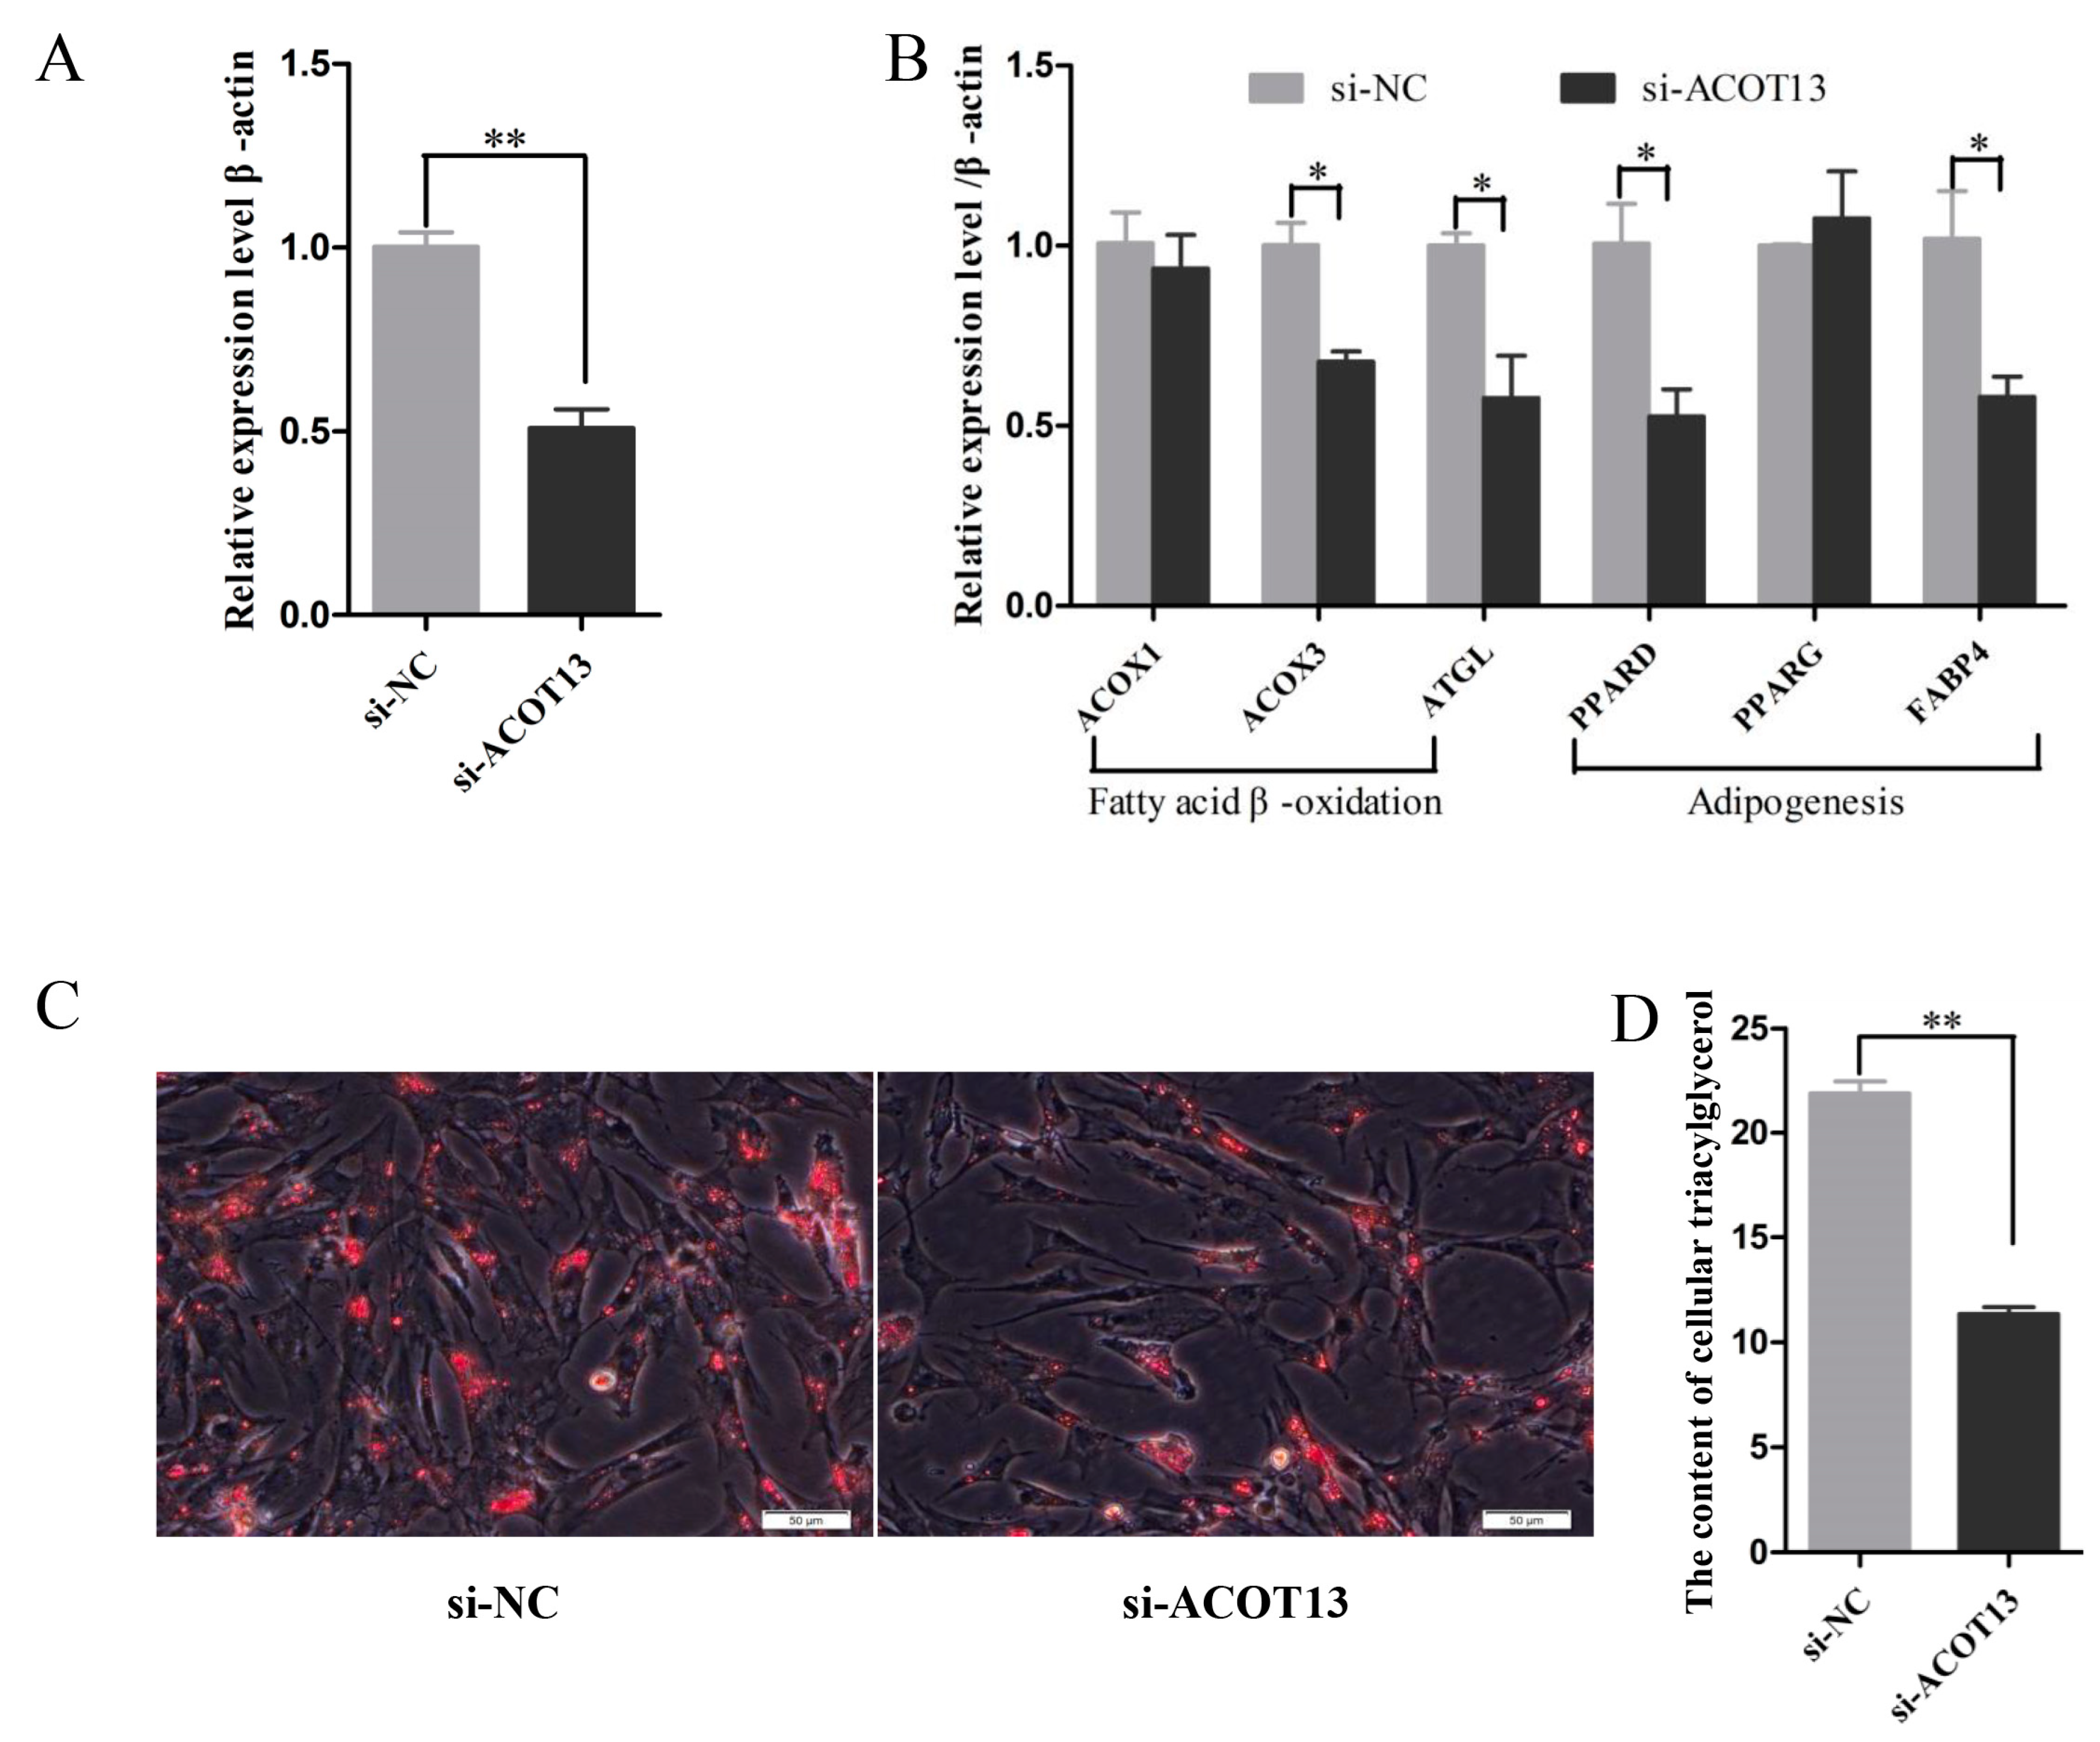
3.7. ACOT13 Promoted Preadipocyte Differentiation by Fatty Acid β-Oxidation and Lipogenic Transcription

To elucidate the function of ACOT13 on chicken preadipocyte differentiation, overexpression, knockdown and rescue experiment of the ACOT13 gene in chicken intramuscular preadipocytes were designed. After transfection for 48 hours, expression of marker genes that involved in fatty acid β-oxidation and adipogenesis were investigated. Meanwhile, the content of intracellular triglyceride was measured.
First, overexpression of the ACOT13 gene in chicken intramuscular preadipocytes. Compared with the negative control group, the expression level of ACOT13 significantly increased (Figure 6A). The marker genes related to fatty acid β-oxidation, including ACOX1, ACOX3, and ATGL, were significantly higher in the ACOT13 overexpressing group relative to the control group (Figure 6B). Meanwhile, marker genes involved in adipogenesis, including PPARG and FABP4, also presented a higher expression level in the ACOT13 overexpressing group relative to the control (Figure 6B). Results from Oil Red O staining and content of intracellular triglyceride suggested that the accumulation of lipid droplets significantly increased in the ACOT13 overexpressing group compared with the control (Figure 6C,D).
Second, knockdown of ACOT13 in chicken intramuscular preadipocytes. As we expected, the expression level of ACOT13 and marker genes involved in fatty acid β-oxidation (ACOX3 and ATGL) and adipogenesis (PPARA, PPARD, CEBPA, and FABP4) were significantly lower in ACOT13 knockdown group than that in the control group (Figure 7A,B). Furthermore, evidence from Oil Red O staining and intracellular triglyceride assay demonstrated that lipid droplet accumulation and intracellular triglyceride content significantly declined in the ACOT13 knockdown group (Figure 7C,D).
Third, co-transfection of gga-miR-18b-3p mimicswith ACOT13 overexpression plasmid was performed to further verify the effects of gga-miR-18b-3p and ACOT13 on preadipocyte differentiation. The treatment of negative control mimics together with the negative control plasmid was also conducted. The results showed that there was no significance in both lipid droplet accumulation and intracellular triglyceride concentration between the two treatments (Figure 8A,B).
Taken together, overexpression of ACOT13 promoted preadipocyte differentiation, fatty acid β-oxidation, and adipogenesis. Conversely, knockdown of ACOT13 would inhibit these processes. Moreover, the promoting effect of ACOT13 on preadipocyte differentiation, fatty acid β-oxidation and adipogenesis can be eased by the inhibitory effect of gga-miR-18b-3p. All the results demonstrated that gga-miR-18b-3p targeting ACOT13 inhibited intramuscular adipocytes differentiation.

4. Discussion

In recent years, understanding the mechanisms underlying the process of adipocyte differentiation has vastly expanded. Several potential miRNAs in our miRNA-seq data have been reported to be associated with cell differentiation, such as miR-221, miR-146, miR-30-5p, miR-301, and miR-148 [38]. Some of them played pivotal roles in the differentiation of adipocytes [39,40], which was consistent with our expected results, that we could obtain the differentially expressed miRNAs related to adipocyte differentiation.
KEGG pathway analysis was performed to investigate the biological interpretation of target genes for differentially expressed miRNAs. Three important pathways involved in fatty acid metabolism were excessively enriched, including the PPAR signaling pathway (gga03320), fatty acid metabolism (gga01212), and fatty acid degradation (gga00071). The PPAR signaling pathway is a very important intermediate metabolic pathway. Fatty acids are able to activate the expression of genes via PPARs [41]. PPARs are transcription factors that are ligand-activated, and they belong to the superfamily of nuclear hormone receptors. PPARα, PPARβ/δ, and PPARγ are included in PPARs. These three transcription factors act on their target genes and participate in lipid metabolism and adipocyte differentiation. Recent research found that PPARs had an influence on adipocyte differentiation [42,43] and fatty acid oxidation [44,45]. The marker gene, FABP [46], has been proven to have the same function in the PPARs signaling pathway. In the pathway of fatty acid metabolism and fatty acid degradation, ACOX1 [47] is also involved in fatty acid oxidation, while FASN [48] and ELOVL5 [49] are related to fatty acid biosynthesize.
Recent studies have found that miR-18b was considered as important marker of cell proliferation and cell adhesion. Murakami Y et al. found that the expression level of miR-18b was significantly associated with histological differentiation. Poorly differentiated hepatocellular carcinoma (HCC) presented high miR-18b and low TNRC6B (trinucleotide repeat containing 6B) expression levels. The mechanism underlying was that miR-18b inhibited HCC differentiation via targeting the TNRC6B gene [50]. Namløs HM et al. also reported that the expression of miR-18b in osteoblast and normal bone was identical with the differentiation level of osteosarcoma. From osteoblasts to osteosarcoma, then to bone, the degree of cell differentiation gradually increased. The higher the degree of cell differentiation, the lower the expression of miR-18b [51]. Both above studies suggested that miR-18b might function as a crucial factor in cell differentiation. Therefore, we concluded that miR-18b participated in the cell differentiation process. At the same time, miR-18b-3p was also a differential expressing miRNA between IMF-preadipocytes and IMF-adipocytes. We inferred that miR-18b-3p should be involved in the process of IMF preadipocytes. Meanwhile ACOT13 was one of the differential genes in IMF-preadipocytes and IMF-adipocytes (unpublished data). Prediction of miRNA target genes suggested ACOT13 was the target of gga-miR-18b-3p.
Acyl-CoA thioesterase 13 (ACOT13), a member of the acyl-CoA thioesterase (ACOT) gene family, catalyzed the key steps in fatty acid biosynthesis, bioluminescence, and non-ribosomal peptide synthesis [52]. ACOT13 abundantly expressed in oxidative tissues (e.g., liver, adipose tissue) [53] and co-localized with mitochondria and long-chain fatty acyl-CoA substrates [54]. ACOT gene family could catalyze the hydrolysis of fatty acyl-CoAs to form free fatty acids (FFAs) and coenzyme A (CoASH). Indeed, the balance between FFAs and fatty acyl-CoAs within cells regulated fatty acid oxidation and controlled the synthesis of complex lipids [55,56]. Hung J Y et al. found that ACOT11 and ACOT13 knockdown-mediated growth inhibition could be rescued by the addition of fatty acids [57]. Nicholls previous studies have revealed that activated ACOT13 at the mitochondrial membrane could result in increased fatty acid oxidation [58]. All these findings showed that ACOT13 took part in lipid metabolism and fatty acid β-oxidation. In this study, results from overexpression and knockdown of the ACOT13 gene demonstrated that ACOT13 played an important role in fatty acid β-oxidation and adipogenesis, which were all consistent with previous studies.
Zhang et al. reported that miR-140-5p affected IMF deposition in chicken with the association with meat quality [4]. However, gga-miR-140-5p was not the top miRNA in our present study. The differentially expressed miRNAs in Zhang’s study were detected between 20 and 55 weeks in Gushi chicken, so the difference might be not only caused by the different IMF deposition, but also by different stages between groups. As a short-chain non-coding small RNA, the expression of miRNAs in different tissues, and stages were different. In addition, miRNAs have coordinated biological functions by targeting genes, meanwhile, the target interactions were different in different tissues and stages [59,60]. Although miR-140-5p had potential effects on cell growth, migration, and death [61] in many species, such as pig [62], human, and chicken [63,64], many gene were involved in the process. Therefore, the direct effect between preadipocytes and adipocytes in our study might not be caused by miR-140-5p.
In our study, we identified a candidate miRNA, gga-miR-18b-3p, involved in the adipocyte differentiation based on the results of miRNA-seq. Bioinformatics analysis and functional assay suggested that gga-miR-18b-3p inhibited the differentiation of chicken intramuscular preadipocytes via targeting the ACOT13 gene.

5. Conclusions

In conclusion, our study identified that miRNAs were associated with chicken preadipocyte differentiation between IMF-preadipocytes and IMF-preadipocytes. This study demonstrated that gga-miR-18b-3p could inhibit the intramuscular adipocytes differentiation by negatively regulating ACOT13 (Figure 9). These findings may provide fundamental basis for improving poultry meat quality, and it will also be helpful for a deeper understanding of chicken IMF deposition.

Supplementary Materials

The following are available online at https://www.mdpi.com/2073-4409/8/6/556/s1. Table S1: Identification of differentially expressed miRNAs; Table S2: Gene ontology (GO) terms enrichment analysis.

Author Contributions

Data curation, G.S., F.L., J.S. and X.M.; formal analysis, F.L., W.L. and R.J.; methodology, Y.T., R.H. and Z.L.; project administration, X.K. and G.S.; software, G.L. and Y.W.; writing—original draft, F.L. and W.L.

Funding

This work was supported by the Program for Innovation Research Team of Ministry of Education (No. IRT16R23), Key Science and Technology Research Project of Henan Province (151100110800), National Natural Science Foundation of China (31501948).

Conflicts of Interest

The authors declare no conflict of interest.

Accession Numbers

All the Illumina miRNA-seq data sets supporting the results of this article have been submitted to the National Center for Biotechnology Information (NCBI) Gene Expression Omnibus (GEO). Accession numbers are SAMN08325464, SAMN08325465, SAMN08325466, SAMN08325467.

Abbreviations

ACOX1acyl coenzyme A oxidase 1: palmitoyl
ACOX3acyl coenzyme A oxidase 3, palmitoyl
ATGLadipose triglyceride lipase
PPARAperoxisome proliferator-activated receptor α
PPARDperoxisome proliferator-activated receptor β
CEBPACCAAT-enhancer binding protein-alpha
FABP4fatty acid binding protein 4
ACOT13acyl-CoA thioesterase 13
IMFIntramuscular fat
PBSphosphate buffered saline
TGtriacylglycerol
GOgene ontology
KEGGKyoto encyclopedia of genes and genomes

References

  1. Du, M.; Yin, J.; Zhu, M.J. Cellular signaling pathways regulating the initial stage of adipogenesis and marbling of skeletal muscle. Meat Sci. 2010, 86, 103–109. [Google Scholar] [CrossRef] [PubMed]
  2. Massimiliano, P.; Claudio, C. Muscle growth and poultry meat quality issues. Nutrients 2012, 4, 1–12. [Google Scholar]
  3. Hocquette, J.F.; Gondret, F.; Baéza, E.; Médale, F.; Jurie, C.; Pethick, D.W. Intramuscular fat content in meat-producing animals: Development, genetic and nutritional control, and identification of putative markers. Animal 2010, 4, 303–319. [Google Scholar] [CrossRef]
  4. Zhang, M.; Li, D.-H.; Li, F.; Sun, J.-W.; Jiang, R.-R.; Li, Z.-J.; Han, R.-L.; Li, G.-X.; Liu, X.-J.; Kang, X.-T.; et al. Integrated Analysis of MiRNA and Genes Associated with Meat Quality Reveals that Gga-MiR-140-5p Affects Intramuscular Fat Deposition in Chickens. Cell. Physiol. Biochem. 2018, 46, 2421–2433. [Google Scholar] [CrossRef]
  5. Wang, S.; Zhang, Y.; Yuan, X.; Pan, R.; Yao, W.; Zhong, L.; Song, Q.; Zheng, S.; Wang, Z.; Xu, Q.; et al. Identification of differentially expressed microRNAs during preadipocyte differentiation in Chinese crested duck. Gene 2018, 661, 126–132. [Google Scholar] [CrossRef]
  6. Gan, L.; Yan, J.; Liu, Z.; Feng, M.; Sun, C. Adiponectin Prevents Reduction of Lipid-Induced Mitochondrial Biogenesis via AMPK/ACC2 Pathway in Chicken Adipocyte. J. Cell. Biochem. 2015, 116, 1090–1100. [Google Scholar] [CrossRef]
  7. Song, J.H.; Yang, J.; Pan, F.; Jin, B. Differential expression of microRNAs may regulate pollen development in Brassica oleracea. Genet. Mol. Res. 2015, 14, 15024–15034. [Google Scholar] [CrossRef] [PubMed]
  8. Fonseca-Sanchéz, M.A.; Pérez-Plasencia, C.; Fernández-Retana, J.; Arechaga-Ocampo, E.; Marchat, L.A.; Rodríguez-Cuevas, S.; Bautista-Piña, V.; Arellano-Anaya, Z.E.; Flores-Pérez, A.; Diaz-Chávez, J. MicroRNA-18b is upregulated in breast cancer and modulates genes involved in cell migration. Oncol. Rep. 2013, 30, 2399–2410. [Google Scholar] [CrossRef] [PubMed]
  9. Xiao, T.; Dong, M.J.; Wang, M.; Yin, B.Q.; Luo, H.; Lin-Yun, H.E.; Fang, H.U. The roles of miRNAs in the regulation of brown adipocyte function and white adipocyte browning. Chin. Bull. Life Sci. 2014, 26, 1051–1056. [Google Scholar]
  10. Chen, L.; Song, J.; Cui, J.; Hou, J.; Zheng, X.; Li, C.; Liu, L. MicroRNAs regulate adipocyte differentiation. Cell Boil. Int. 2013, 37, 533–546. [Google Scholar] [CrossRef]
  11. Esau, C.; Kang, X.; Peralta, E.; Hanson, E.; Marcusson, E.G.; Ravichandran, L.V.; Sun, Y.; Koo, S.; Perera, R.J.; Jain, R.; et al. MicroRNA-143 Regulates Adipocyte Differentiation. J. Boil. Chem. 2004, 279, 52361–52365. [Google Scholar] [CrossRef] [PubMed] [Green Version]
  12. Lin, Q.; Gao, Z.; Alarcon, R.M.; Ye, J.; Yun, Z. A role of miR-27 in the regulation of adipogenesis. Febs J. 2010, 276, 2348–2358. [Google Scholar] [CrossRef]
  13. Leivonen, S.K.; Mäkelä, R.; Östling, P.; Kohonen, P.; Haapapaananen, S.; Kleivi, K.; Enerly, E.; Aakula, A.; Hellström, K.; Sahlberg, N. Protein lysate microarray analysis to identify microRNAs regulating estrogen receptor signaling in breast cancer cell lines. Oncogene 2009, 28, 3926. [Google Scholar] [CrossRef] [PubMed]
  14. Morselli, E.; Santos, R.D.S.; Gao, S.; Y, Á.; Criollo, A.; Palmer, B.F.; Clegg, D.J. Impact of Estrogens and Estrogen Receptor Alpha (ESR1) in Brain Lipid Metabolism. Am. J. Physiol. Endocrinol. Metab. 2018, 315, E7–E14. [Google Scholar] [CrossRef] [PubMed]
  15. Heine, P.A.; Taylor, J.A.; Iwamoto, G.A.; Lubahn, D.B.; Cooke, P.S. Increased adipose tissue in male and female estrogen receptor-alpha knockout mice. Proc. Natl. Acad. Sci. USA 2000, 97, 12729–12734. [Google Scholar] [CrossRef] [PubMed]
  16. Murata, Y.; Robertson, K.M.; Jones, M.E.E.; Simpson, E.R. Effect of estrogen deficiency in the male: the ArKO mouse model. Mol. Cell. Endocrinol. 2002, 193, 7–12. [Google Scholar] [CrossRef]
  17. Grodstein, F. Response to comments on ‘A Prospective, Observational Study of Postmenopausal Hormone Therapy and Primary Prevention of Cardiovascular Disease’. Maturitas 2001, 38, 239–241. [Google Scholar] [CrossRef]
  18. Willembergink, E.; Wallace, R.A.; Berg, J.A.V.D. Estrogen-Induced Synthesis of Yolk Proteins in Roosters. Am. Zool. 1974, 14, 1177–1193. [Google Scholar]
  19. Kirchgessner, T.G.; Heinzmann, C.; Svenson, K.L.; Gordon, D.A.; Nicosia, M.; Lebherz, H.G.; Lusis, A.J.; Williams, D.L. Regulation of chicken apolipoprotein B: Cloning, tissue distribution, and estrogen induction of mRNA. Gene 1987, 59, 241–251. [Google Scholar] [CrossRef]
  20. Schneider, W.J.; Carroll, R.; Severson, D.L.; Nimpf, J. Apolipoprotein VLDL-II inhibits lipolysis of triglyceride-rich lipoproteins in the laying hen. J. Lipid Res. 1990, 31, 507–513. [Google Scholar]
  21. Clegg, D.J. Minireview: The year in review of estrogen regulation of metabolism. Mol. Endocrinol. 1957, 26, 1957–1960. [Google Scholar] [CrossRef] [PubMed]
  22. Cooke, P.S.; Naaz, A. Role of estrogens in adipocyte development and function. Exp. Biol. Med. 2004, 229, 1127–1135. [Google Scholar] [CrossRef]
  23. Wu, J.-H.; Wang, Y.-H.; Wang, W.; Shen, W.; Sang, Y.-Z.; Liu, L.; Chen, C.-M. MiR-18b suppresses high-glucose-induced proliferation in HRECs by targeting IGF-1/IGF1R signaling pathways. Int. J. Biochem. Cell Boil. 2016, 73, 41–52. [Google Scholar] [CrossRef] [PubMed]
  24. Smith, P.J.; Wise, L.S.; Berkowitz, R. Insulin-like growth factor-I is an essential regulator of the differentiation of 3T3-L1 adipocytes. J. Biol. Chem. 1988, 263, 9402. [Google Scholar] [PubMed]
  25. Jin, S.; Zhai, B.; Qiu, Z.; Wu, J.; Lane, M.D.; Liao, K. c-Crk, a substrate of the insulin-like growth factor-1 receptor tyrosine kinase, functions as an early signal mediator in the adipocyte differentiation process. J. Biol. Chem. 2000, 275, 34344. [Google Scholar] [CrossRef] [PubMed]
  26. Hairong, H.; Xuemin, G.; Shangyu, H.; Manrong, J.; Xinyuan, L.; Kan, L. Lipid rafts/caveolae are essential for insulin-like growth factor-1 receptor signaling during 3T3-L1 preadipocyte differentiation induction. J. Boil. Chem. 2003, 278, 11561–11569. [Google Scholar]
  27. Langmead, B. Aligning short sequencing reads with Bowtie. Curr. Protoc. Bioinform. 2010, 32, 11.7.1–11.7.14. [Google Scholar]
  28. Kozomara, A.; Griffiths-Jones, S. miRBase: Annotating high confidence microRNAs using deep sequencing data. Nucleic Acids Res. 2014, 42, D68. [Google Scholar] [CrossRef]
  29. Moxon, S.; Schwach, F.; Dalmay, T.; Maclean, D.; Studholme, D.J.; Moulton, V. A toolkit for analysing large-scale plant small RNA datasets. Bioinformatics 2008, 24, 2252–2253. [Google Scholar] [CrossRef] [Green Version]
  30. Chang, T.-H.; Huang, H.-Y.; Hsu, J.B.-K.; Weng, S.-L.; Horng, J.-T.; Huang, H.-D. An enhanced computational platform for investigating the roles of regulatory RNA and for identifying functional RNA motifs. BMC Bioinform. 2013, 14, S4. [Google Scholar]
  31. Kohl, M.; Wiese, S.; Warscheid, B. Cytoscape: Software for visualization and analysis of biological networks. Methods Mol. Biol. 2011, 696, 291–303. [Google Scholar] [PubMed]
  32. Li, F.; Li, D.; Zhang, M.; Sun, J.; Li, W.; Jiang, R.; Han, R.; Wang, Y.; Tian, Y.; Kang, X. miRNA-223 targets the GPAM gene and regulates the differentiation of intramuscular adipocytes. Gene 2019, 685, 106–113. [Google Scholar] [CrossRef]
  33. Livak, K.J.; Schmittgen, T.D. Analysis of Relative Gene Expression Data Using Real-Time Quantitative PCR and the 2−ΔΔCT Method. Methods 2001, 25, 402–408. [Google Scholar] [CrossRef] [PubMed]
  34. Stocks, M.B.; Moxon, S.; Mapleson, D.; Woolfenden, H.C.; Mohorianu, I.; Folkes, L.; Schwach, F.; Dalmay, T.; Moulton, V. The UEA sRNA workbench: A suite of tools for analysing and visualizing next generation sequencing microRNA and small RNA datasets. Bioinformatics 2012, 28, 2059–2061. [Google Scholar] [CrossRef] [PubMed]
  35. Ikeda, M.; Kanao, Y.; Yamanaka, M.; Sakuraba, H.; Mizutani, Y.; Igarashi, Y.; Kihara, A. Characterization of four mammalian 3-hydroxyacyl-CoA dehydratases involved in very long-chain fatty acid synthesis. FEBS Lett. 2008, 582, 2435–2440. [Google Scholar] [CrossRef] [PubMed] [Green Version]
  36. Moon, Y.A.; Hammer, R.E.; Horton, J.D. Deletion of ELOVL5 leads to fatty liver through activation of SREBP-1c in mice. J. Lipid Res. 2009, 50, 412–423. [Google Scholar] [CrossRef] [PubMed] [Green Version]
  37. Kang, H.W.; Niepel, M.W.; Han, S.; Kawano, Y.; Cohen, D.E. Thioesterase superfamily member 2/acyl-CoA thioesterase 13 (Them2/Acot13) regulates hepatic lipid and glucose metabolism. FASEB J. 2012, 26, 2209–2221. [Google Scholar] [CrossRef]
  38. Zhang, B.W.; Cai, H.F.; Wei, X.F.; Sun, J.J.; Lan, X.Y.; Lei, C.Z.; Lin, F.P.; Qi, X.L.; Martin, P.; Hong, C. miR-30-5p Regulates Muscle Differentiation and Alternative Splicing of Muscle-Related Genes by Targeting MBNL. Int. J. Mol. Sci. 2016, 17, 182. [Google Scholar] [CrossRef]
  39. Roos, J.; Enlund, E.; Funcke, J.B.; Tews, D.; Holzmann, K.; Debatin, K.M.; Wabitsch, M.; Fischerposovszky, P. miR-146a-mediated suppression of the inflammatory response in human adipocytes. Sci. Rep. 2016, 6, 38339. [Google Scholar] [CrossRef] [Green Version]
  40. Li, H.; Xue, M.; Xu, J.; Qin, X. MiR-301a is involved in adipocyte dysfunction during obesity-related inflammation via suppression of PPARγ. Die Pharm. 2016, 71, 84. [Google Scholar]
  41. Kersten, S.; Desvergne, B.; Wahli, W. Roles of PPARs in health and disease. Nature 2000, 405, 421–424. [Google Scholar] [CrossRef] [PubMed]
  42. Kim, S.-N.; Choi, H.Y.; Lee, W.; Park, G.M.; Shin, W.S.; Kim, Y.K. Sargaquinoic acid and sargahydroquinoic acid from Sargassum yezoense stimulate adipocyte differentiation through PPARα/γ activation in 3T3-L1 cells. FEBS Lett. 2008, 582, 3465–3472. [Google Scholar] [CrossRef] [PubMed]
  43. Bai, N.; He, K.; Ibarra, A.; Bily, A.; Roller, M.; Chen, X.; Rühl, R. Iridoids from Fraxinus excelsior with Adipocyte Differentiation-Inhibitory and PPARα Activation Activity. J. Nat. Prod. 2015, 73, 2. [Google Scholar] [CrossRef] [PubMed]
  44. Lee, J.-Y.; Hashizaki, H.; Goto, T.; Sakamoto, T.; Takahashi, N.; Kawada, T. Activation of peroxisome proliferator-activated receptor-α enhances fatty acid oxidation in human adipocytes. Biochem. Biophys. Res. Commun. 2011, 407, 818–822. [Google Scholar] [CrossRef] [PubMed]
  45. Lee, S.K.; Lee, J.O.; Kim, J.H.; Kim, N.; You, G.Y.; Moon, J.W.; Sha, J.; Kim, S.J.; Lee, Y.W.; Kang, H.J.; et al. Coenzyme Q10 increases the fatty acid oxidation through AMPK-mediated PPARα induction in 3T3-L1 preadipocytes. Cell Signal. 2012, 24, 2329–2336. [Google Scholar] [CrossRef] [PubMed]
  46. Wang, S.; Zhang, Y.; Xu, Q.; Yuan, X.; Dai, W.; Shen, X.; Wang, Z.; Chang, G.; Wang, Z.; Chen, G. The differentiation of preadipocytes and gene expression related to adipogenesis in ducks (Anas platyrhynchos). PLoS ONE 2018, 13, e0196371. [Google Scholar] [CrossRef] [PubMed]
  47. Starčević, K.; Filipović, N.; Šperanda, M.; Đidara, M.; Mašek, T. The influence of sex and gonadectomy on hepatic and brain fatty acid composition, lipogenesis and β-oxidation. J. Anim. Physiol. Anim. Nutr. 2017, 101, 649–657. [Google Scholar] [CrossRef]
  48. Wang, B.; Wang, H.; Xiang, M.A.; Guang, P.U.; Niu, P.; Zhang, Z.; Zhou, J.; Pinghua, L.I.; Huang, R. Analysis of intramuscular fat content in Suhuai pigs and its correlation with polymorphisms of IGF2 and SCD genes. Anim. Husb. Vet. Med. 2018, 50, 20–25. [Google Scholar]
  49. Shi, H.B.; Du, Y.; Zhang, C.H.; Sun, C.; He, Y.L.; Wu, Y.H.; Liu, J.X.; Luo, J.; Loor, J.J. Fatty acid elongase 5 (ELOVL5) alters the synthesis of long-chain unsaturated fatty acids in goat mammary epithelial cells. J. Dairy Sci. 2018, 101, 4586–4594. [Google Scholar] [CrossRef] [Green Version]
  50. Murakami, Y.; Tamori, A.; Itami, S.; Tanahashi, T.; Toyoda, H.; Tanaka, M.; Wu, W.; Brojigin, N.; Kaneoka, Y.; Maeda, A.; et al. The expression level of miR-18b in hepatocellular carcinoma is associated with the grade of malignancy and prognosis. BMC Cancer 2013, 13, 99. [Google Scholar] [CrossRef]
  51. Namløs, H.M.; Meza-Zepeda, L.A.; Tale, B.Y.; ?Stensen, I.H.G.; Kresse, S.H.; Kuijjer, M.L.; Massimo, S.; Horst, B.; Anne-Marie, C.J.; Ola, M. Modulation of the osteosarcoma expression phenotype by microRNAs. PLoS ONE 2012, 7, e48086. [Google Scholar] [CrossRef] [PubMed]
  52. Cantu, D.C.; Ardèvol, A.; Rovira, C.; Reilly, P.J. Molecular Mechanism of a Hotdog-Fold Acyl-CoA Thioesterase. Chem. A Eur. J. 2014, 20, 9045–9051. [Google Scholar] [CrossRef] [PubMed]
  53. Kawano, Y.; Ersoy, B.A.; Li, Y.; Nishiumi, S.; Yoshida, M.; Cohen, D.E. Thioesterase Superfamily Member 2 (Them2) and Phosphatidylcholine Transfer Protein (PC-TP) Interact To Promote Fatty Acid Oxidation and Control Glucose Utilization. Mol. Cell. Boil. 2014, 34, 2396–2408. [Google Scholar] [CrossRef] [PubMed] [Green Version]
  54. Kang, H.W.; Ozdemir, C.; Kawano, Y.; LeClair, K.B.; Vernochet, C.; Kahn, C.R.; Hagen, S.J.; Cohen, D.E. Thioesterase Superfamily Member 2/Acyl-CoA Thioesterase 13 (Them2/Acot13) Regulates Adaptive Thermogenesis in Mice. J. Boil. Chem. 2013, 288, 33376–33386. [Google Scholar] [CrossRef] [PubMed] [Green Version]
  55. Li, L.O.; Klett, E.L.; Coleman, R.A. Acyl-CoA synthesis, lipid metabolism and lipotoxicity. Biochim. Biophys. Acta (BBA) Mol. Cell Boil. Lipids 2010, 1801, 246–251. [Google Scholar] [CrossRef] [PubMed] [Green Version]
  56. Ellis, J.M.; Lei, O.; Li Pei-Chi, W.; Koves, T.R.; Olga, I.; Stevens, R.D.; Watkins, S.M.; Muoio, D.M.; Coleman, R.A. Adipose acyl-CoA synthetase-1 directs fatty acids toward beta-oxidation and is required for cold thermogenesis. Cell Metab. 2010, 12, 53–64. [Google Scholar] [CrossRef] [PubMed]
  57. Hung, J.-Y.; Chiang, S.-R.; Liu, K.-T.; Tsai, M.-J.; Huang, M.-S.; Shieh, J.-M.; Yen, M.-C.; Hsu, Y.-L. Overexpression and proliferation dependence of acyl-CoA thioesterase 11 and 13 in lung adenocarcinoma. Oncol. Lett. 2017, 14, 3647–3656. [Google Scholar] [CrossRef] [PubMed] [Green Version]
  58. Nicholls, H.T.; Hornick, J.L.; Cohen, D.E. Phosphatidylcholine transfer protein/StarD2 promotes microvesicular steatosis and liver injury in murine experimental steatohepatitis. Am. J. Physiol. Liver Physiol. 2017, 313, G50–G61. [Google Scholar] [CrossRef] [Green Version]
  59. Bushati, N.; Cohen, S.M. microRNA Functions. Annu. Rev. Cell Dev. Biol. 2007, 23, 175–205. [Google Scholar] [CrossRef]
  60. Wienholds, E.; Plasterk, R.H.A. MicroRNA function in animal development. FEBS Lett. 2005, 579, 5911–5922. [Google Scholar] [CrossRef] [Green Version]
  61. Tripathi, G.; Salih, D.A.M.; Drozd, A.C.; Cosgrove, R.A.; Cobb, L.J.; Pell, J.M. IGF-independent effects of insulin-like growth factor binding protein-5 (Igfbp5) in vivo. FASEB J. 2009, 23, 2616. [Google Scholar] [CrossRef] [PubMed]
  62. Cave, M.C.; Clair, H.B.; Hardesty, J.E.; Falkner, K.C.; Feng, W.; Clark, B.J.; Sidey, J.; Shi, H.; Aqel, B.A.; Mcclain, C.J.; et al. Nuclear receptors and nonalcoholic fatty liver disease. Biochim. Biophys. Acta 2016, 1859, 1083–1099. [Google Scholar] [CrossRef] [PubMed] [Green Version]
  63. Lollar, P.; Parker, E.T.; Fay, P.J. Coagulant properties of hybrid human/porcine factor VIII molecules. J. Boil. Chem. 1992, 267, 23652. [Google Scholar]
  64. Petersen, B.; Carnwath, J.W.; Niemann, H. The perspectives for porcine-to-human xenografts. Comp. Immunol. Microbiol. Infect. Dis. 2009, 32, 91–105. [Google Scholar] [CrossRef] [PubMed]
Figure 1. Introduction of intramuscular preadipocytes in vitro. (A) IMF (intramuscular fat)-preadipocytes. (B) Oil Red O staining of IMF-preadipocytes. (C) IMF-adipocytes. (D) Oil Red O staining of IMF-adipocytes. (E) Triacylglycerol (TG) content of IMF-preadipocytes and IMF-adipocytes group. Data is shown as mean ± SE. ** p < 0.01.
Cells 08 00556 g001
Figure 2. Small RNA sequencing and analysis of differentially expressed miRNAs. (A) Distribution of the length and abundance of small RNA sequences in chicken adipocytes. (B) Differential expression of miRNA in IMF-preadipocytes overlapping with that in IMF-adipocytes. (C,D) Volcano plot and heatmap of differentially expressed miRNAs between preadipocytes and adipocytes. (E) Verification of sequencing results by qPCR.
Cells 08 00556 g002aCells 08 00556 g002b
Figure 3. Functional enrichment analysis of target genes. (A) KEGG (Kyoto Encyclopedia of Genes and Genomes) analysis on targets of differentially expressed miRNAs. (B) Identified KEGG pathways related to lipid metabolism. (C) Interactive network for differentially expressed miRNAs and their targets.
Cells 08 00556 g003aCells 08 00556 g003b
Figure 4. The ACOT13 gene was a potential target gene of miR-18-3p. (A) Cluster analysis showed miR-18b-3p was conserved in various species. (B) Conservatism analysis of the miR-18b-3p seed region. (C) The interaction of miR-18b-3p and ACOT13 was predicted based on miRCat. (D) Expression of miR-18b-3p and ACOT13 in pre-differentiation (0 day) and post-differentiation (10 days).
Cells 08 00556 g004
Figure 5. miR-18b-3p inhibited adipocyte differentiation by targeting ACOT13. (A) The expression level of miR-18b-3p and marker genes of adipocyte differentiation after miR-18b-3p overexpression. (B) Number of lipid droplets with miR-18b-3p overexpression. (C) The concentration of intracellular triglyceride in the miR-18b-3p overexpressing group was significantly lower. (D) Verification of miR-18b-3p target gene using luciferase assay.
Cells 08 00556 g005
Figure 6. Overexpression of ACOT13 promoted adipocyte differentiation in intramuscular adipocytes. (A) ACOT13 expression level was induced in the ACOT13 overexpressing group. (B) Levels of ACOX1, ACOX3, ATGL, PPARG, and FABP4 mRNAs increased after ACOT13 overexpression. (C) Overexpression of the ACOT13 gene increased the lipid droplet formation in intramuscular adipocytes by Oil Red O staining. (D) In the ACOT13 overexpressing group, triacylglycerol synthesis was increased. * p < 0.05; ** p < 0.01.
Cells 08 00556 g006
Figure 7. Knockdown of ACOT13 inhibited adipocyte differentiation in intramuscular adipocytes. (A) ACOT13 levels were reduced by the si-ACOT13. (B) Levels of ACOX3, ATGL, PPARD, and FABP4 mRNAs decreased after transfection with si-ACOT13. (C) si-ACOT13 decreased the lipid droplet formation in intramuscular adipocytes by Oil Red O staining. (D) After transfection of si-ACOT13, triacylglycerol synthesis was decreased. * p < 0.05; ** p < 0.01.
Cells 08 00556 g007
Figure 8. Rescue experiment of ACOT13, co-transfecting with miR-18b-3p mimics and ACOT13 overexpression. (A) Lipid droplet formation between groups. (B) Triacylglycerol content between groups.
Cells 08 00556 g008
Figure 9. Proposed model of gga-miR-18b-3p regulation on intramuscular adipocyte differentiation.
Cells 08 00556 g009
Table 1. Primer sequences used for qPCR in this study.
GeneAcc. #Forward Primer Sequence 5’-3′Reverse Primer Sequence 5′-3′
ACOT13XM_015282414.2CTTTGGAACAGCAGCACAGTTTTACAGGAACCCTTCACTGCC
β-actinNM_205518.1CAGCCAGCCATGGATGATGAACCAACCATCACACCCTGAT
siRNAXM_015282414.2GCACGUUACACGGAGGUUUTTAAACCUCCGUGUAACGUGCTT
ACOX1NM_001006205.1AAGGAGATCGAGGCCTTAGTGGCCGTCCACGATGAACAAAG
ACOX3XM_420814.6AAAGAAGACAGTGGCAACCGTCACCATCGAGAAACACTGC
ATGLNM_001113291.1CACTGCCATGATGGTCCCCTACCACAAGGAGATGCTGAAGAA
PPARAXM_015289937.2AGTAAGCTCTCAGAAACTTTGTTGGTCATTTCACTTCACGCAGCA
PPARDXM_015298893.2GCAAGCCCTTCAACGAGATCAGGGACGATCTCCACACAGG
CEBPANM_001031459.1TTCTACGAGGTCGATTCCCGAGCCTCTCTGTAGCCGTAG
FABP4NM_204290.1ATGTGCGACCAGTTTGTTCACCATTGATGCTGATAG
PPARGXM_015292931.2GTGCAATCAAAATGGAGCCCTTACAACCTTCACATGCAT
ACOT13(CDS)XM_015282414.2CCCAAGCTTGCCACCATGGGCAGCATGCGCTTCACCCGGAATTCCTGTCCTATGTACTTTGTAT
WT-ACOT13ENSGALT00000086884.1CCGCTCGAGAAGCAACTCACCCTTCAGGCATTTGCGGCCGCAGCTTGCTTCACACTTCCCAT
MUT-ACOT13ENSGALT00000086884.1CTTACTAATTGTTCCGTAGGTCCCGTCAGAAGGGTTCCTGTAAGCAACGTTGCTTACAGGAACCCTTCTGACGGGACCTACGGAACAATTAGTAAG
Table 2. The eight significantly-enriched pathways related to lipid metabolism.
Pathway IDPathway TermTarget Gene List
gga00062Fatty acid elongationELOVL5, HACD3, HADHA, ACAA2, ELOVL4, HACD1, ECHS1, ELOVL1, HSD17B12, MECR, PPT1, ACOT7, HACD2, ELOVL6
gga00020Citrate cycleDLD, IDH3B, IDH3A, SDHA, ACLY, SUCLG2, SUCLG1, ACO2, MDH1, IDH1, ACO1, OGDH, SDHB, IDH3G, IDH2, CS
gga01212Fatty acid metabolismELOVL5, HACD3, ACADS, EHHADH, HADHA, ACAA2, SCD5, FASN, ACSBG2, ACOX1, HACD1, ACSBG1, ECHS1, SCD, HSD17B12, MECR, PPT1, ACSL1, PECR, CPT2, HACD2,
ACADSB, ACADL, ELOVL6
gga00071Fatty acid degradationACADS, EHHADH, HADHA, ACAA2, ACSBG2, ACOX1, ECI1, ACSBG1, ECHS1, ACSL1, CPT2, ALDH7A1, ECI2, ACADSB, ACADL
gga04010MAPK (mitogen-activated protein kinase) signaling pathwayRELA, CHUK, TAOK3, BDNF, EGFR, TNFSF6, PAK1, ChALK5, TAB1, TGFB3, ARR3, RAC2, MAP2K1, NF1, FOS, MAP3K13, PRKCA, CRKL, DUSP6, SRF, CACNG5, GADD45A, FGFR4, MAP3K14, HSPA2, NRAS, cRac1B, PDGF-A,CACNA1D, CASP3, CDC42, MAPK10, STK4, PTPN7, TGFBR2, RPS6KA5, FGF1, DUSP4, GNG12, DUSP7, MAP3K1, NR4A1, HSPA8, LAMTOR3, PPP3CB, TAOK1, MRAS, CACNA1S, MAP2K5, MAPK11, PPP3R1, NFATC3, DUSP10, CACNA1G, RPS6KA, DUSP3, cRac1A, FLNB, CACNA2D1, H-RAS, GADD45B, PPM1B, MAPKAPK3, CACNA1B, TNFRSF1A, BRAF, FGFR1, NFKB2, FGFR3, MAP3K5, CACNG4, FGF8, MAPK9, CACNG3, MAP2K3
gga04150mTOR (mammalian target of rapamycin) signaling pathwayCHUK, ATP6V1G1, PDPK1, SLC7A5, STRADA, RNF152, PIK3R5, FZD5, MAP2K1, CAB39L, RPS6KB1, WDR24, SKP2,PRKCA, ATP6V1G3, NPRL2, WNT6, STK11, FZD6, FZD9, SLC38A9, ATP6V1B2, RPS6, FZD4, NRAS, WDR59, MLST8, Wnt8c, RRAGC, PIK3CB, PIK3CD, RRAGD, LAMTOR3, FZD3, ATP6V1A, RPTOR, ULK3, ATP6V1D, CLIP1, WNT11, RPS6KA, PRKAA1,HRAS, EIF4E2, PRKAA2, TNFRSF1A, BRAF, RHOA, TBC1D
gga00061Fatty acid biosynthesisFASN, ACSBG2, ACSBG1, ACSL1, ACOT13
gga03320PPAR (peroxisome proliferator-activated receptors) signaling pathwayFABP5, PDPK1, EHHADH, FABP3, LXR, PLIN2, SCD5, ACSBG2, LPL, ACOX1, SLC27A2, ACSBG1, SCD, ACSL1, CPT2, CYP8B1, PLIN1, ACADL

