Data Descriptor

CVm6A: A Visualization and Exploration Database for m6As in Cell Lines

1
School of Basic Medical Sciences, Wuhan University, Wuhan 430071, Hubei, China
2
Hubei Province Key Laboratory of Allergy and Immunology, Wuhan 430071, Hubei, China
3
Hubei Provincial Key Laboratory of Developmentally Originated Disease, Wuhan 430071, Hubei, China
4
School of Computer Science, Wuhan University, Wuhan 430072, Hubei, China
5
Department of Developmental Biology, School of Basic Medical Sciences, Southern Medical University, Guangzhou 510515, China
6
Sun Yat-sen University Cancer Center, State Key Laboratory of Oncology in South China, Collaborative Innovation Center for Cancer Medicine, Sun Yat-sen University, Guangzhou 510060, China
*
Authors to whom correspondence should be addressed.
These authors contributed equally to this work.
Cells 2019, 8(2), 168; https://doi.org/10.3390/cells8020168
Submission received: 15 December 2018 / Revised: 14 February 2019 / Accepted: 15 February 2019 / Published: 17 February 2019
(This article belongs to the Special Issue Bioinformatics and Computational Biology 2019)

Abstract

:
N6-methyladenosine (m6A) has been identified in various biological processes and plays important regulatory functions in diverse cells. However, there is still no visualization database for exploring global m6A patterns across cell lines. Here we collected all available MeRIP-Seq and m6A-CLIP-Seq datasets from public databases and identified 340,950 and 179,201 m6A peaks dependent on 23 human and eight mouse cell lines respectively. Those m6A peaks were further classified into mRNA and lncRNA groups. To better understand the potential function of m6A, we then mapped m6A peaks in different subcellular components and gene regions. Among those human m6A modification, 190,050 and 150,900 peaks were identified in cancer and non-cancer cells, respectively. Finally, all results were integrated and imported into a visualized cell-dependent m6A database CVm6A. We believe the specificity of CVm6A could significantly contribute to the research for the function and regulation of cell-dependent m6A modification in disease and development.

1. Introduction

As one important post-transcriptional modification, N6-methyladenosine (m6A) was largely discovered by high throughput sequencing in recent years [1,2,3]. m6A was identified with consensus sequence surrounding m6A site RRACH (R=G or A, H=A, C or U) and conserved in human, mouse, chimpanzee and even in plants [1,4,5]. m6A was also found to exist in bacterial and archaeal species [6]. The abundance of m6A is reported as being correlated with evolutionarily conserved region of genome [2]. m6A modification was a reversible status mediated by methyltransferases METTL3/ METTL14/ WTAP complex [7], demethylases FTO/ALKBH5 [2,8] and recognized by m6A binding proteins YTH (YT521-B homology) domain family/HNRNPA2B1 [9,10], which were called writer, eraser and reader, respectively.
m6A can regulate the multiple biological functions in spatial and temporal [11]. m6A methyltransferase complex controls the neuronal functions and fine-tuning sex determination in Drosophila [12]. m6A also acts as a regulator at molecular switches in murine naive pluripotency for proper lineage priming and differentiation [13]. The existence of m6A in lncRNA XIST mediated the gene silencing on X chromosome. Knockdown of m6A methytransferase METTL3 can impair XIST-mediated gene silencing [14]. m6A RNA can recruit DNA polymerase k (Pol k) to facilitate repairing of ultraviolet-induced DNA damage [15]. Furthermore, m6A could alter RNA structure to affect RNA-protein interactions in cells [16]. The m6A-driven gene network was already constructed and the dynamic interactions between m6A related methyltransferases and demthylases were established [17]. The deficiency of m6A modification led to various diseases, such as obesity, cancer, type 2 diabetes mellitus, infertility and developmental arrest, etc. [18].
In previous researches, m6A was discovered mainly located near stop codons, large internal exons and 3’UTR (3’-Untranslated region), as well as in CDS (Coding sequence), transcriptional start sites and intron [1,2,19]. Dynamic m6A modification could affect translation status and lifetime of mRNA in Hela [20]. Several lncRNAs also hosted m6A modification [1,2] and long intergenic noncoding RNAs (lincRNAs) established significantly higher level than mRNAs in B-cell lymphoblastoid cell line GM12878 [21]. In CD4T, m6A modification happened on HIV-1 RNA could regulate viral infection [22].
Though m6A patterns were analyzed in different cells independently, the global patterns across those cells were not well summarized. Several databases collected and detected m6A from public datasets, such as RMBase [23] and MeT-DB [24]. However, RMBase and MeT-DB were not focused on cell-dependent m6A. For examples, MeT-DB only included m6A datasets from a portion of wild type cell lines, and RMBase included m6A sites from various samples without indicating the cell sources. To better understand the function of m6A in cellular biological processes, a more specific database is needed for exploring and comparing the distribution and patterns of m6A in different cell lines. Here, using latest public datasets, we collected MeRIP-Seq and m6A-CLIP-Seq datasets from 23 human cell lines and eight mouse cell lines from previous work, and inspected the global patterns of m6As across those cell lines, including the distribution and abundance of m6A modification in lncRNA or mRNA, different subcellular location and gene regions. The m6A patterns from cancer or non-cancer cell lines were also classified. Moreover, validated m6A sites from previous experiments were also collected and summarized. All results were imported into a cell-dependent m6A database CVm6A (http://gb.whu.edu.cn:8080/CVm6A) providing a visualization interface for searching and comparing the m6A patterns in different cell lines, which could contribute to the function and regulation research of m6A in disease and development.

2. Data Collection and Database Content

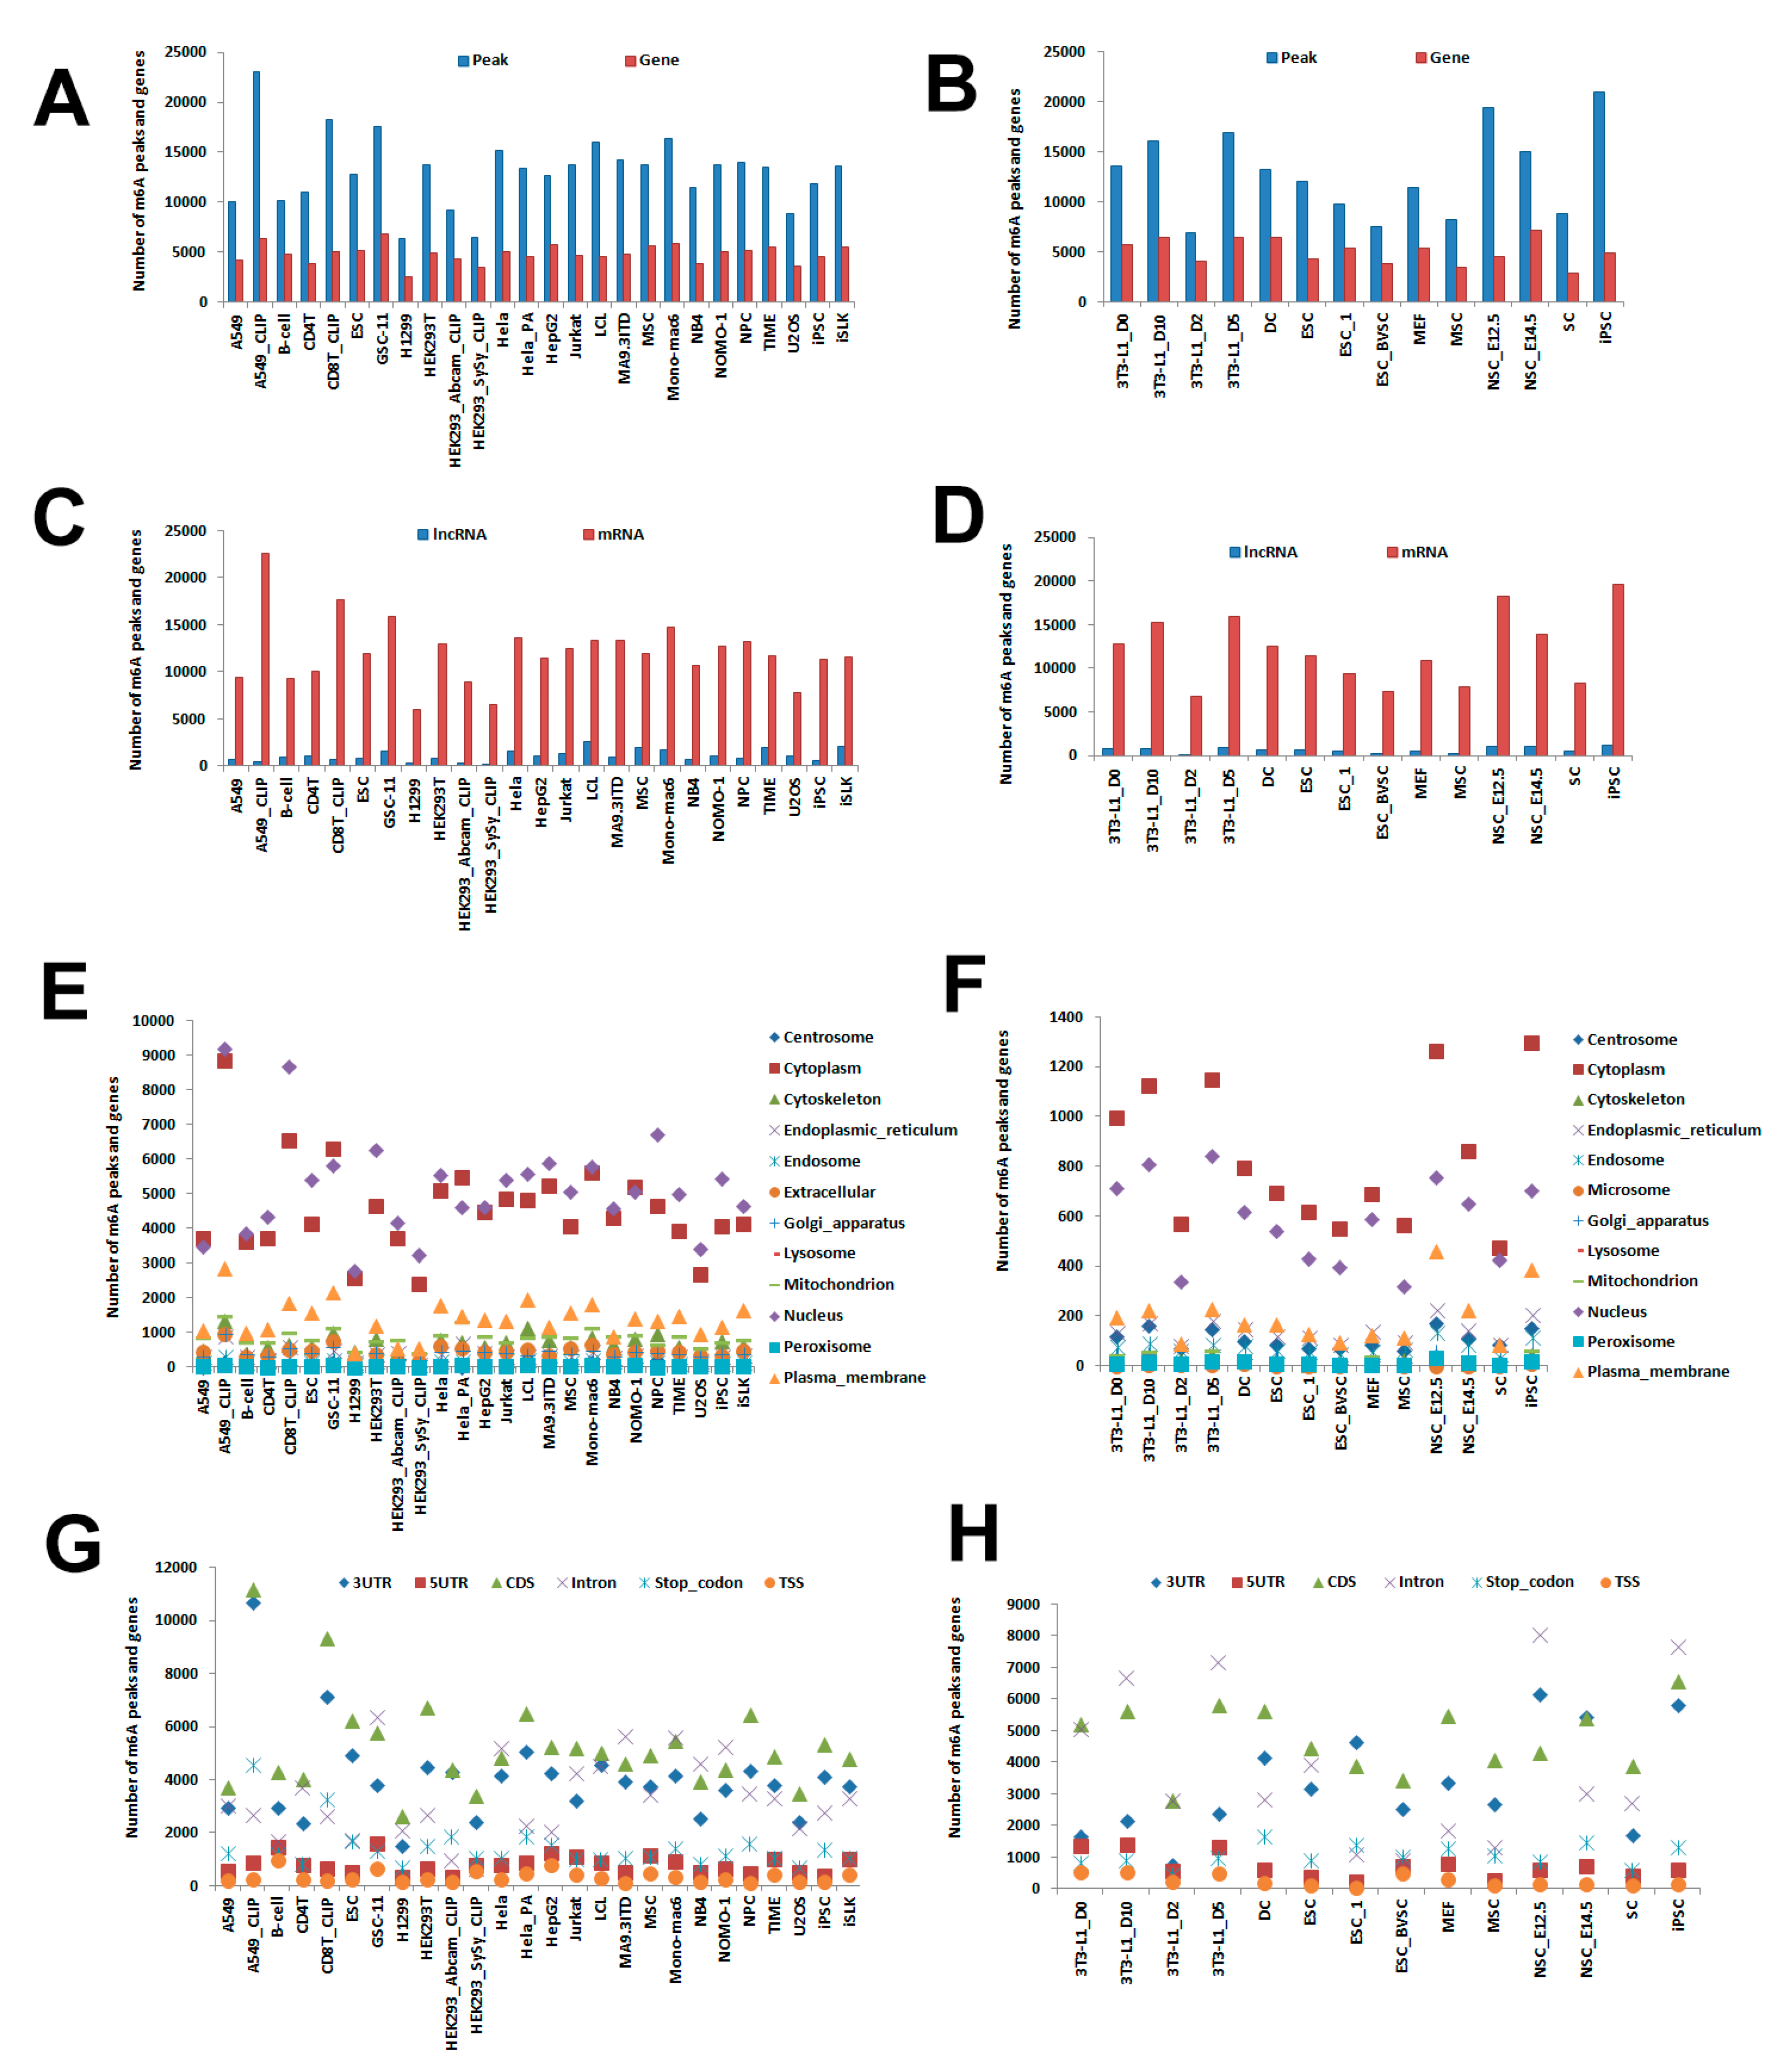
2.1. Cell Line Samples in CVm6A

Previous studies showed that MeRIP-Seq (Methylated RNA Immunoprecipitation sequencing) [20], miCLIP-Seq (m6A individual-nucleotide-resolution cross-linking and immunoprecipitation sequencing) [25] and PA-m6A-Seq (Photo-crosslinking-assisted m6A-seq) [26] could be used for detecting m6A modification in transcriptomic level. Therefore, we collected all available MeRIP-Seq, miCLIP-Seq and PA-m6A-Seq datasets with total RNA or PolyA enriched library construction from NCBI GEO database (http://www.ncbi.nlm.nih.gov/GEO). In total, 47 samples from 23 human cell lines and 22 samples from 8 mouse cell lines were collected (Table S1).

2.2. Identification of Cell m6A Peaks

For MeRIP-Seq datasets, both reads from IP (Immunoprecipitation) and Input samples were mapped to human (hg38 version) and mouse (mm10 version) genome separately via Hisat2 [27]. Mapped reads with MAPQ <30 were filtered by samtools [28], and removed PCR duplicates using Picard (http://broadinstitute.github.io/picard, v2.16.0). Then m6A peaks were called and enrichment score of each peak was calculated by MeTPeak [29]. m6A sites from miCLIP-Seq and PA-m6A-Seq were collected from previous works [19,25,26]. Gene annotation of GENCODE (GRCh38 release 28 and GRCm38 release M20) including 35,048 human genes and 31,237 mouse genes were used to annotate m6A sites or peaks. Detailed pipeline was included in Supplemental Method. In all cell lines, total 340,950 m6A peaks from 16,950 human genes and 179,201 m6A peaks from 14,360 mouse genes were identified. In human cell lines, we retrieved 6345 (H1299) ~ 23,052 (A549) m6A peaks, and 2562 (H1299) ~ 6838 (GSC-11) genes with m6A modification (Figure 1A). In mouse cell lines, 6833 (3T3-L1) ~ 20,892 (iPSC) m6A peaks and 2882 (SC) ~ 7125 (NSC) genes with m6A modification were identified (Figure 1B).

2.3. Prediction of m6A lncRNA and mRNA

All m6A peaks were mapped to mRNA and lncRNA using GENCODE gene annotation (GRCh38 release 28 and GRCm38 release M20) [30] via Bedtools [31]. To view the similarities and differences of m6A modification in lncRNA and mRNA, those all m6A genes were separated into lncRNA or mRNA groups. In human cell lines, there were 225 (HEK293) ~ 2627 (LCL) peaks from lncRNA, while 6044 (H1299) ~ 22,630 (A549) peaks were from mRNA (Figure 1C). We also checked the enrichment score of those m6A peaks from lncRNA and mRNA. The average enrichment scores of lncRNA were from 2.37 (U2OS) ~ 9.55 (ESC), while in mRNAs, the scores were from 2.36 (U2OS) ~ 11.15 (iPSC) (Figure S1A). In mouse cell lines, there were 101 (3T3-L1) ~ 1,243 (iPSC) peaks from lncRNA, while 6732 (3T3-L1) ~ 19,649 (iPSC) peaks were from mRNA (Figure 1D). The average enrichment scores of lncRNA and mRNA from mouse cell lines were also established (Figure S1B).

2.4. Prediction of Subcellular Location

To view the location of m6A in subcellular component, we acquired the subcellular location information of genes from public database Hum-mPloc 3.0 [32] and Euk-mPLoc [33] and classified m6A peaks into subcellular components according to their annotated genes. Total 309,137 peaks were located into different components in all cell lines. Across human cell lines, 2439 (HEK293) ~ 8866 (A549) of peaks were located in Cytoplasm, 2772 (H1299) ~ 9195 (A549) of peaks located in Nucleus and 447 (H1299) ~ 2878 (A549) of m6A peaks located in Plasma membrane. Other peaks were distributed in other subcellular location: Centrosome, Cytoskeleton, Endoplasmic reticulum, Endosome, Golgi apparatus, Lysosome, Mitochondrion, Peroxisome, and Extracellular (Figure 1E). The average enrichment scores of those peaks from different components were also calculated (Figure S1C). Similar distributions were observed in mouse cell lines (Figure 1F and Figure S1D).

2.5. Prediction of Gene Regions

Previous works revealed m6A modification were not uniform on different gene regions [1,2,20]. In CVm6A, we separated all annotated genes into 6 regions: TSS, 5′UTR, CDS, Stop codon, 3′UTR and Intron and located m6A peaks in these regions. The middle site of each peak from MeRIP-Seq or the precise m6A site from m6A-CLIP-Seq was used for the localization. For TSS and stop codon, a 200 bp window (±100 bp surrounding the coordinates) were allowed to locate the m6A site according to previous work [1,2]. Across human cell lines, 2668 (H1299) ~ 11,209 (A549) of m6A peaks were distributed in CDS, while 1517 (H1299) ~ 10,706 (A549) were located in 3′UTR and 710 (CD8T) ~ 4608 (A549) were distributed in Stop codon (Figure 1G). We also checked the average enrichment scores distributed in those regions. In all cell lines, stop codon had average scores from 2.34 (U2OS) to 12.5 (iPSC), while the average scores in CDS were 2.41 (U2OS) ~ 11.7 (iPSC) and the average scores in 3′UTR were 2.32 (U2OS) ~ 11.6 (iPSC) (Figure S1E). The m6A distribution of gene regions in mouse cell lines was also established (Figure 1H and Figure S1F).

2.6. Classification of Cancer and Non-Cancer m6A

To view the association of m6A and diseases, all human m6A peaks were classified into cancer and non-cancer groups. Overall, 190,050 m6A peaks from 14,628 genes were identified in 12 cancer cell lines and 150,900 peaks from 14,346 genes were identified in 11 non-cancer cell lines (Figure S1G).

2.7. Validated m6A Sites

Previous research had validated several m6A modification in cell lines. To enhance the usability of CVm6A, we collected those m6A sites from m6A-RIP or m6A-CLIP experiment from previous literatures. Totally, CVm6A contains validated m6A modification in 96 genes, which were identified in 25 cell lines from human, mouse, zebrafish and Drosophila (Table S2).

3. Database Organization and Web Interface
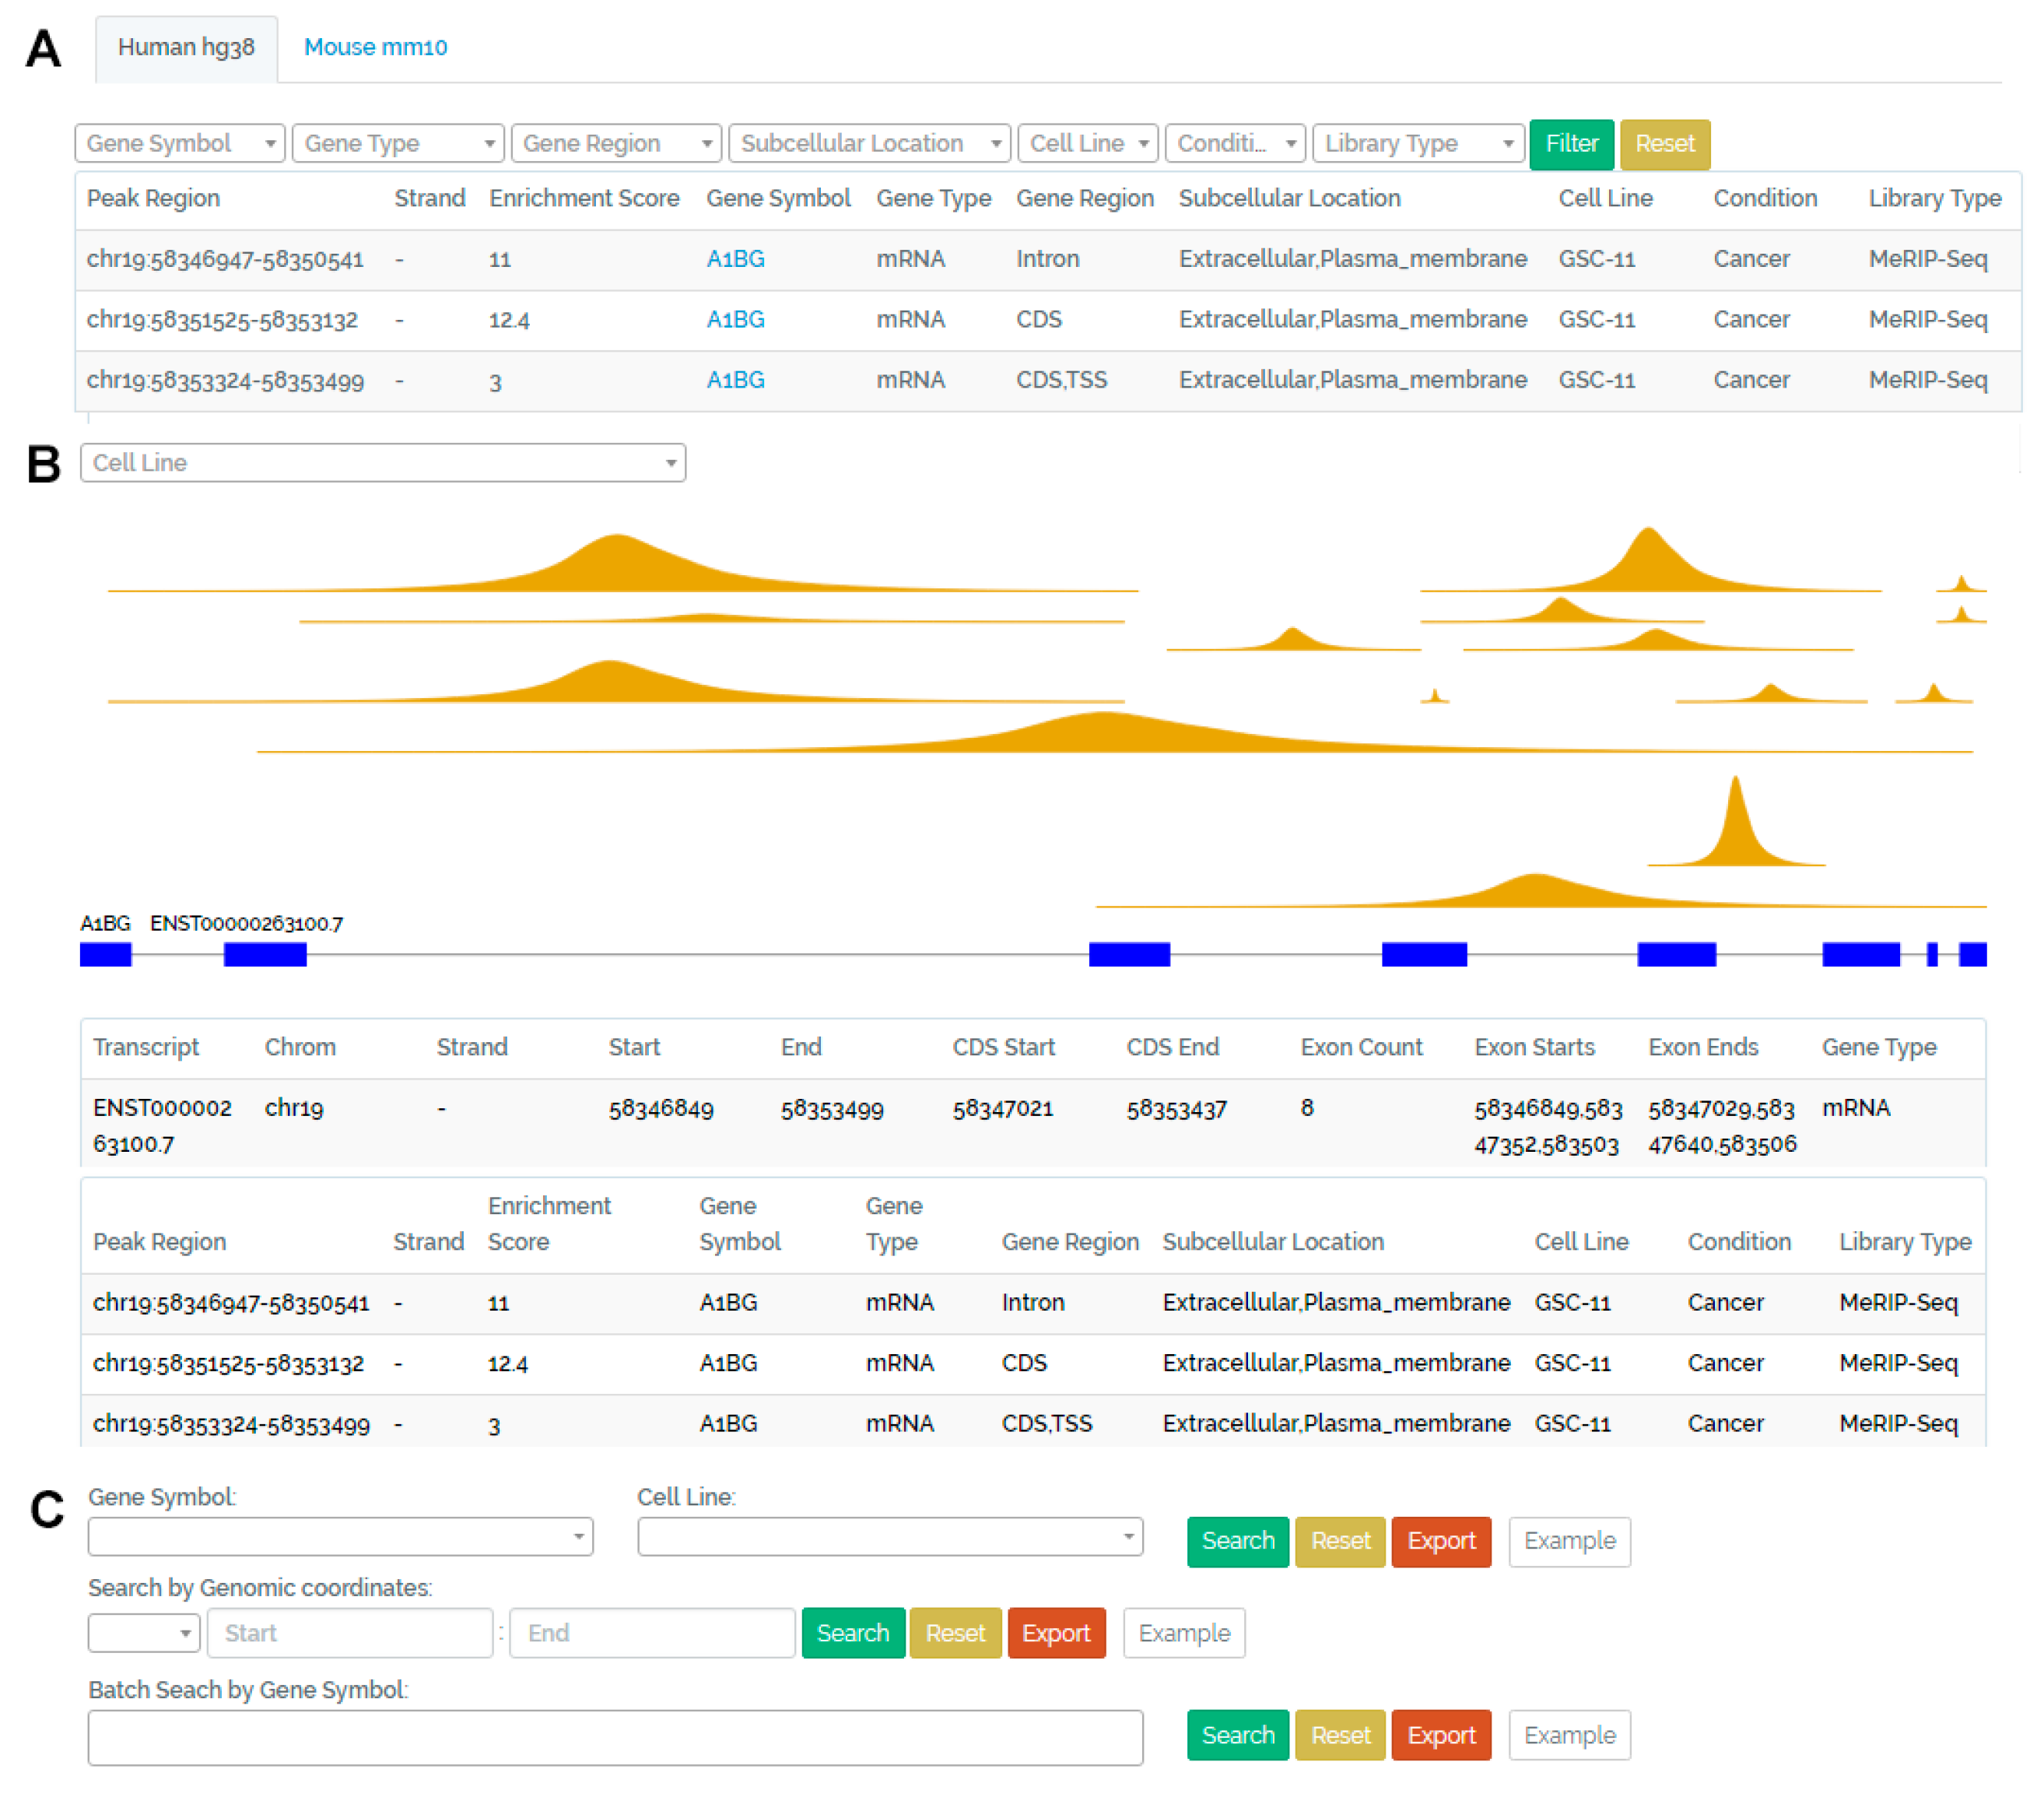
All the analyzed results, including peak region, gene type, gene region, subcellular location, conditions and library types associated with m6A peaks were integrated into a set of interactive MySQL tables. Laravel–an open-source web framework based in PHP (https://laravel.com) and JavaScript library were used to construct the CVm6A database. The web interface of CVm6A is summarized in Figure 2.

3.1. Browse Page

On this page, users can browse all m6A peaks from 23 human and eight mouse cell lines. All information, including the peak region, strand, enrichment score, gene symbol, gene type (mRNA/lncRNA), gene region (CDS, 3’UTR, et al.), subcellular location (plasma_membrane, nucleus, et al.), cell line, condition (cancer/non-cancer) and library type for each peak are displayed in the table (Figure 2A). Peak region and gene symbol are linked to the visualization page of m6A peaks located in this gene (Figure 2B).

3.2. Visualization Page

On this page, users can view all m6A peaks distributed in selected annotated gene. All peaks in current gene are displayed with dark yellow color. In the top left corner, user can also select special cell line in the search box. All peaks in the selected cell line are displayed with brown color both in the figure and table. The summit of each peak is determined according to the enrichment score. The gene structure with exon (blue box) and intron (gray line) is displayed below peak figures. If the selected gene has more than one transcript, all transcripts are displayed. The relative location of each peak and the annotated gene are placed according to genomic coordinates. Mouse hover over on or click each peak can display the peak region, enrichment score, gene region, subcellular location, cell line, condition and library type of this peak. The table below the figures includes the coordinates of annotated transcripts and detailed information of all peaks in the selected gene (Figure 2B).

3.3. Search Page

On this page, users can search m6A peaks by gene symbol, cell line or genomic coordinates. While users select gene symbol or cell line, all peaks in this gene or cell line will be displayed in tables below and can be exported into files. Batch search by gene symbol is also provided. The search function by genomic coordinates supports fuzzy search. All peaks surrounding the input coordinates will be displayed (Figure 2C).

4. Summary and Future Directions

CVm6A collects available MeRIP-Seq and m6A-CLIP-Seq datasets in human and mouse cell lines, and provides a visualized m6A database to benefit functional studies of m6A in cell lines. Those samples include the most frequently used cell lines in previous researches. For example, users working on stem cells could explore the m6A modification in ESC, MSC, NPC and iPSC and can compare the distribution of m6A peaks in nucleus and other subcellular components, as well as 3′UTR and other gene regions. Users working on the immune cell lines could inspect the distribution in CD4T, CD8T and LCL. Moreover, more than ten cancer cell lines are included in CVm6A, which allow researchers to study the potential function of m6A in cancers. CVm6A also predicts the enrichment score of each peak, which allow users to check the abundance of m6A. Due to the limited m6A-Seq datasets for total RNA, only two total RNA datasets are included in the current version, which cannot thoroughly establish the distribution of m6A on lncRNA and other non-polyA RNAs. We will update CVm6A when more sequencing data from other library types becomes available.

Supplementary Materials

The supplementary materials are available online https://www.mdpi.com/2073-4409/8/2/168/s1.

Author Contributions

J.F., Y.H. and L.X. (Linjian Xia) carried out the data collection, alignment and analysis. J.F. carried out the web interface and database construction. X.D., X.Z., S.Z., Y.M., Q.X., S.X., Z.Z. and C.H. carried out the result correction and integration. C.H. and L.X. (Laixin Xia) performed figure production and wrote the manuscript. All authors read and approved the final manuscript.

Funding

This work was supported by the National Key R&D Program of China (2017YFA0106700) to S.X., the National Natural Science Foundation of China [81500140 and 81870129] to C.H., the China National Grand S&T Special Project [2018ZX10733403] to C.H. and the Fundamental Research Funds for the Central Universities of China [2042018kf0232] to C.H.

Conflicts of Interest

The authors declare no conflict of interest.

References

  1. Dominissini, D.; Moshitch-Moshkovitz, S.; Schwartz, S.; Salmon-Divon, M.; Ungar, L.; Osenberg, S.; Cesarkas, K.; Jacob-Hirsch, J.; Amariglio, N.; Kupiec, M.; et al. Topology of the human and mouse m6a RNA methylomes revealed by m6a-seq. Nature 2012, 485, 201–206. [Google Scholar] [CrossRef] [PubMed]
  2. Meyer, K.D.; Saletore, Y.; Zumbo, P.; Elemento, O.; Mason, C.E.; Jaffrey, S.R. Comprehensive analysis of mrna methylation reveals enrichment in 3’ utrs and near stop codons. Cell 2012, 149, 1635–1646. [Google Scholar] [CrossRef]
  3. Li, X.; Xiong, X.; Yi, C. Epitranscriptome sequencing technologies: Decoding RNA modifications. Nat. Methods 2016, 14, 23–31. [Google Scholar] [CrossRef] [PubMed]
  4. Ma, L.; Zhao, B.; Chen, K.; Thomas, A.; Tuteja, J.H.; He, X.; He, C.; White, K.P. Evolution of transcript modification by n6-methyladenosine in primates. Genome Res. 2017, 27, 385–392. [Google Scholar] [CrossRef] [PubMed]
  5. Wan, Y.; Tang, K.; Zhang, D.; Xie, S.; Zhu, X.; Wang, Z.; Lang, Z. Transcriptome-wide high-throughput deep m(6)a-seq reveals unique differential m(6)a methylation patterns between three organs in arabidopsis thaliana. Genome Biol. 2015, 16, 272. [Google Scholar] [CrossRef] [PubMed]
  6. Blow, M.J.; Clark, T.A.; Daum, C.G.; Deutschbauer, A.M.; Fomenkov, A.; Fries, R.; Froula, J.; Kang, D.D.; Malmstrom, R.R.; Morgan, R.D.; et al. The epigenomic landscape of prokaryotes. PLoS Genet. 2016, 12, e1005854. [Google Scholar] [CrossRef] [PubMed]
  7. Liu, J.; Yue, Y.; Han, D.; Wang, X.; Fu, Y.; Zhang, L.; Jia, G.; Yu, M.; Lu, Z.; Deng, X.; et al. A mettl3-mettl14 complex mediates mammalian nuclear RNA n6-adenosine methylation. Nat. Chem. Biol. 2014, 10, 93–95. [Google Scholar] [CrossRef]
  8. Zhang, S.; Zhao, B.S.; Zhou, A.; Lin, K.; Zheng, S.; Lu, Z.; Chen, Y.; Sulman, E.P.; Xie, K.; Bogler, O.; et al. M6a demethylase alkbh5 maintains tumorigenicity of glioblastoma stem-like cells by sustaining foxm1 expression and cell proliferation program. Cancer Cell 2017, 31, 591–606. [Google Scholar] [CrossRef]
  9. Li, A.; Chen, Y.S.; Ping, X.L.; Yang, X.; Xiao, W.; Yang, Y.; Sun, H.Y.; Zhu, Q.; Baidya, P.; Wang, X.; et al. Cytoplasmic m6a reader ythdf3 promotes mRNA translation. Cell Res. 2017, 27, 444–447. [Google Scholar] [CrossRef]
  10. Alarcon, C.R.; Goodarzi, H.; Lee, H.; Liu, X.; Tavazoie, S.; Tavazoie, S.F. Hnrnpa2b1 is a mediator of m(6)a-dependent nuclear RNA processing events. Cell 2015, 162, 1299–1308. [Google Scholar] [CrossRef]
  11. Roundtree, I.A.; Evans, M.E.; Pan, T.; He, C. Dynamic RNA modifications in gene expression regulation. Cell 2017, 169, 1187–1200. [Google Scholar] [CrossRef] [PubMed]
  12. Lence, T.; Akhtar, J.; Bayer, M.; Schmid, K.; Spindler, L.; Ho, C.H.; Kreim, N.; Andrade-Navarro, M.A.; Poeck, B.; Helm, M.; et al. M6a modulates neuronal functions and sex determination in drosophila. Nature 2016, 540, 242–247. [Google Scholar] [CrossRef] [PubMed]
  13. Geula, S.; Moshitch-Moshkovitz, S.; Dominissini, D.; Mansour, A.A.; Kol, N.; Salmon-Divon, M.; Hershkovitz, V.; Peer, E.; Mor, N.; Manor, Y.S.; et al. Stem cells. M6a mRNA methylation facilitates resolution of naive pluripotency toward differentiation. Science 2015, 347, 1002–1006. [Google Scholar] [CrossRef] [PubMed]
  14. Patil, D.P.; Chen, C.K.; Pickering, B.F.; Chow, A.; Jackson, C.; Guttman, M.; Jaffrey, S.R. M(6)a RNA methylation promotes xist-mediated transcriptional repression. Nature 2016, 537, 369–373. [Google Scholar] [CrossRef] [PubMed]
  15. Xiang, Y.; Laurent, B.; Hsu, C.H.; Nachtergaele, S.; Lu, Z.; Sheng, W.; Xu, C.; Chen, H.; Ouyang, J.; Wang, S.; et al. RNA m6a methylation regulates the ultraviolet-induced DNA damage response. Nature 2017, 543, 573–576. [Google Scholar] [CrossRef] [PubMed]
  16. Liu, N.; Zhou, K.I.; Parisien, M.; Dai, Q.; Diatchenko, L.; Pan, T. N6-methyladenosine alters RNA structure to regulate binding of a low-complexity protein. Nucleic Acids Res. 2017. [Google Scholar]
  17. Zhang, S.Y.; Zhang, S.W.; Liu, L.; Meng, J.; Huang, Y. M6a-driver: Identifying context-specific mRNA m6a methylation-driven gene interaction networks. PLoS Comput. Biol. 2016, 12, e1005287. [Google Scholar] [CrossRef] [PubMed]
  18. Wei, W.; Ji, X.; Guo, X.; Ji, S. Regulatory role of n6 -methyladenosine (m6 a) methylation in RNA processing and human diseases. J. Cell. Biochem. 2017, 118, 2534–2543. [Google Scholar] [CrossRef]
  19. Ke, S.; Alemu, E.A.; Mertens, C.; Gantman, E.C.; Fak, J.J.; Mele, A.; Haripal, B.; Zucker-Scharff, I.; Moore, M.J.; Park, C.Y.; et al. A majority of m6a residues are in the last exons, allowing the potential for 3’ utr regulation. Genes Dev. 2015, 29, 2037–2053. [Google Scholar] [CrossRef]
  20. Wang, X.; Lu, Z.; Gomez, A.; Hon, G.C.; Yue, Y.; Han, D.; Fu, Y.; Parisien, M.; Dai, Q.; Jia, G.; et al. N6-methyladenosine-dependent regulation of messenger RNA stability. Nature 2014, 505, 117–120. [Google Scholar] [CrossRef]
  21. Molinie, B.; Wang, J.; Lim, K.S.; Hillebrand, R.; Lu, Z.X.; Van Wittenberghe, N.; Howard, B.D.; Daneshvar, K.; Mullen, A.C.; Dedon, P.; et al. M(6)a-laic-seq reveals the census and complexity of the m(6)a epitranscriptome. Nat. Methods 2016, 13, 692–698. [Google Scholar] [CrossRef] [PubMed]
  22. Tirumuru, N.; Zhao, B.S.; Lu, W.; Lu, Z.; He, C.; Wu, L. N(6)-methyladenosine of hiv-1 RNA regulates viral infection and hiv-1 gag protein expression. eLife 2016, 5, e15528. [Google Scholar] [CrossRef] [PubMed]
  23. Xuan, J.J.; Sun, W.J.; Lin, P.H.; Zhou, K.R.; Liu, S.; Zheng, L.L.; Qu, L.H.; Yang, J.H. Rmbase v2.0: Deciphering the map of RNA modifications from epitranscriptome sequencing data. Nucleic Acids Res. 2018, 46, D327–D334. [Google Scholar] [CrossRef]
  24. Liu, H.; Wang, H.; Wei, Z.; Zhang, S.; Hua, G.; Zhang, S.W.; Zhang, L.; Gao, S.J.; Meng, J.; Chen, X.; et al. Met-db v2.0: Elucidating context-specific functions of n6-methyl-adenosine methyltranscriptome. Nucleic Acids Res. 2018, 46, D281–D287. [Google Scholar] [CrossRef] [PubMed]
  25. Linder, B.; Grozhik, A.V.; Olarerin-George, A.O.; Meydan, C.; Mason, C.E.; Jaffrey, S.R. Single-nucleotide-resolution mapping of m6a and m6am throughout the transcriptome. Nat. Methods 2015, 12, 767–772. [Google Scholar] [CrossRef] [PubMed]
  26. Chen, K.; Lu, Z.; Wang, X.; Fu, Y.; Luo, G.Z.; Liu, N.; Han, D.; Dominissini, D.; Dai, Q.; Pan, T.; et al. High-resolution n(6) -methyladenosine (m(6) a) map using photo-crosslinking-assisted m(6) a sequencing. Angew. Chem. Int. Ed. Engl. 2015, 54, 1587–1590. [Google Scholar] [CrossRef] [PubMed]
  27. Pertea, M.; Kim, D.; Pertea, G.M.; Leek, J.T.; Salzberg, S.L. Transcript-level expression analysis of rna-seq experiments with hisat, stringtie and ballgown. Nat. Protoc. 2016, 11, 1650–1667. [Google Scholar] [CrossRef]
  28. Li, H.; Handsaker, B.; Wysoker, A.; Fennell, T.; Ruan, J.; Homer, N.; Marth, G.; Abecasis, G.; Durbin, R.; Genome Project Data Processing, S. The sequence alignment/map format and samtools. Bioinformatics 2009, 25, 2078–2079. [Google Scholar] [CrossRef]
  29. Cui, X.; Meng, J.; Zhang, S.; Chen, Y.; Huang, Y. A novel algorithm for calling mrna m6a peaks by modeling biological variances in merip-seq data. Bioinformatics 2016, 32, i378–i385. [Google Scholar] [CrossRef]
  30. Harrow, J.; Frankish, A.; Gonzalez, J.M.; Tapanari, E.; Diekhans, M.; Kokocinski, F.; Aken, B.L.; Barrell, D.; Zadissa, A.; Searle, S.; et al. Gencode: The reference human genome annotation for the encode project. Genome Res. 2012, 22, 1760–1774. [Google Scholar] [CrossRef]
  31. Quinlan, A.R.; Hall, I.M. Bedtools: A flexible suite of utilities for comparing genomic features. Bioinformatics 2010, 26, 841–842. [Google Scholar] [CrossRef] [PubMed]
  32. Zhou, H.; Yang, Y.; Shen, H.B. Hum-mploc 3.0: Prediction enhancement of human protein subcellular localization through modeling the hidden correlations of gene ontology and functional domain features. Bioinformatics 2017, 33, 843–853. [Google Scholar] [CrossRef] [PubMed]
  33. Chou, K.C.; Shen, H.B. Cell-ploc: A package of web servers for predicting subcellular localization of proteins in various organisms. Nat. Protoc. 2008, 3, 153–162. [Google Scholar] [CrossRef] [PubMed]
Figure 1. Statistics of m6A patterns in CVm6A. (A) Number of m6A peaks and genes in human cell lines. (B) Number of m6A peaks and genes in mouse cell lines. (C) Number of m6A peaks distributed in lncRNA or mRNA in human cell lines. (D) Number of m6A peaks distributed in lncRNA or mRNA in mouse cell lines. (E) Number of m6A peaks distributed in 12 subcellular components in human cell lines. (F) Number of m6A peaks distributed in 12 subcellular components in mouse cell lines. (G) Number of m6A peaks distributed in 6 gene regions: TSS (Transcription start site), 5’UTR, CDS, Stop codon, 3’UTR and intron in human cell lines. (H) Number of m6A peaks distributed in 6 gene regions: TSS, 5’UTR, CDS, Stop codon, 3’UTR and intron in mouse cell lines.
Cells 08 00168 g001
Figure 2. Overview of CVm6A. (A) Browse page. All m6A peaks in this page can be filtered by gene symbol, gene type, gene region, subcellular location, cell line, condition and library type. The peak region and gene symbol are linked to the visualization page. (B) Visualization page. All m6A peaks in a selected gene are displayed with dark yellow color. Peaks in selected cell lines are displayed with brown color. Annotated gene and transcripts structure are displayed in blue box (exon) and gray line (intron). Coordinates of annotated transcripts and table with detailed information corresponding to these peaks are displayed below. (C) Search page. Users can search all m6A peaks in a special gene or cell line. The Search function by genomic coordinates supports fuzzy search of all peaks surrounding the input genomic region. Batch search by gene symbol is also provided.
Cells 08 00168 g002

