Next Article in Journal
Gene Expression Profiling of NFATc1-Knockdown in RAW 264.7 Cells: An Alternative Pathway for Macrophage Differentiation
Next Article in Special Issue
CVm6A: A Visualization and Exploration Database for m6As in Cell Lines
Previous Article in Journal
Control of the Epithelial-to-Mesenchymal Transition and Cancer Metastasis by Autophagy-Dependent SNAI1 Degradation
Previous Article in Special Issue
A High Efficient Biological Language Model for Predicting Protein–Protein Interactions
 
 
Correction published on 5 August 2019, see Cells 2019, 8(8), 832.
Article

Retroelement—Linked Transcription Factor Binding Patterns Point to Quickly Developing Molecular Pathways in Human Evolution

1
I.M. Sechenov First Moscow State Medical University, 119991 Moscow, Russia
2
Omicsway Corp., Walnut, CA 91798, USA
3
Faculty of Biology, Moscow State University, 119192 Moscow, Russia
4
D. Rogachev Federal Research Center of Pediatric Hematology, Oncology and Immunology, 117198 Moscow, Russia
5
Shemyakin-Ovchinnikov Institute of Bioorganic Chemistry, 117198 Moscow, Russia
6
Faculty of Bioengineering and Bioinformatics, Lomonosov Moscow State University, 119992 Moscow, Russia
7
Faculty of Fundamental Medicine, Moscow State University, 119992 Moscow, Russia
8
Laboratory of the Swiss Hepato-Pancreato-Biliary (HPB) and Transplantation Center, Department of Surgery, University Hospital Zürich, Raemistrasse 100, CH-8091 Zürich, Switzerland
9
Program in Immunology, Sackler Graduate School, Tufts University, Boston, MA 02111, USA
*
Author to whom correspondence should be addressed.
Cells 2019, 8(2), 130; https://doi.org/10.3390/cells8020130
Submission received: 20 December 2018 / Revised: 29 January 2019 / Accepted: 30 January 2019 / Published: 6 February 2019
(This article belongs to the Special Issue Bioinformatics and Computational Biology 2019)

Abstract

:
Background: Retroelements (REs) are transposable elements occupying ~40% of the human genome that can regulate genes by providing transcription factor binding sites (TFBS). RE-linked TFBS profile can serve as a marker of gene transcriptional regulation evolution. This approach allows for interrogating the regulatory evolution of organisms with RE-rich genomes. We aimed to characterize the evolution of transcriptional regulation for human genes and molecular pathways using RE-linked TFBS accumulation as a metric. Methods: We characterized human genes and molecular pathways either enriched or deficient in RE-linked TFBS regulation. We used ENCODE database with mapped TFBS for 563 transcription factors in 13 human cell lines. For 24,389 genes and 3124 molecular pathways, we calculated the score of RE-linked TFBS regulation reflecting the regulatory evolution rate at the level of individual genes and molecular pathways. Results: The major groups enriched by RE regulation deal with gene regulation by microRNAs, olfaction, color vision, fertilization, cellular immune response, and amino acids and fatty acids metabolism and detoxication. The deficient groups were involved in translation, RNA transcription and processing, chromatin organization, and molecular signaling. Conclusion: We identified genes and molecular processes that have characteristics of especially high or low evolutionary rates at the level of RE-linked TFBS regulation in human lineage.

1. Background

Retroelements (REs) are transposable elements that occupy ~40% of the human genome [1,2] and regulate the expression of human genes by providing functional transcription factor binding sites (TFBS) [3,4,5,6], being one of the major forces of regulatory innovation [3,4,5]. RE inserts are far less conserved than the surrounding unique genomic regions [1]. RE-linked transcriptional regulation of human genes, therefore, can indicate quickly transforming gene regulatory modules [7,8,9] (Figure 1).
The evolution of gene regulatory networks is one of the hot topics in current genetics [10,11]. At the level of individual genes, it can be investigated by analyzing structural and functional properties. Structural features include mutations or polymorphisms in gene regulatory regions [12] and inserts of REs [11,12]. Functional features may deal with the binding of transcriptional factors [13], DNA modification (e.g., methylation [14,15] or hydroxymethylation [16]) and chromatin rearrangement patterns [17,18], such as histone modifications [19].
Modern OMICS technologies enable direct interrogation of those features, e.g., screening mutations and polymorphisms by direct high throughput sequencing [20], or identifying TFBS, DNA and chromatin modifications by different versions of sequencing-followed immunoprecipitation techniques [21]. Bioinformatic approaches become key for the comprehensive analysis of “big data” generated by these methods [22,23,24,25].
A more profound level of data analysis may cope with groups of genes aggregated by some specific patterns, e.g. participation in molecular pathways [26,27], apparent common gene expression traits [28], or involvement in complex gene signatures [29]. Here, the approaches like pathway activation strength (PAS) calculation [30,31] or quantization of Gene Ontology (GO) clustering features [32,33] may be appropriate to assess oscillations of gene networks in response to any specific condition [34,35].
On the interface of studying both structural and functional features of gene evolution, a conceptually new method was recently published that analyzes the impact of RE-linked regulation for each gene [36]. It is based on a simple rationale to measure the proportion of gene regulatory items hosted by REs. Higher ratios are thought to indicate relatively quickly evolving regulatory modules, and vice versa. For every gene, a 10kb neighborhood of the transcriptional start site (TSS) was investigated, as TSS-proximal regions are thought to be enriched in functional regulatory modules, such as promoters and enhancers [37]. In its first application, proportions of RE-linked TFBS were calculated for all human genes based on the published experimental chromatin immunoprecipitation sequencing (ChIP-Seq) data [6] for hematological cancer cell line K562. ChIP-Seq makes it possible to precisely measure the binding of transcriptional factors with DNA, with greater number of sequencing reads (=hits) suggesting stronger binding with transcriptional factors at the same locus, and vice versa [38]. This approach of combining ChIP-Seq data and REs mapping was also for both types of data analysis, i.e. for the levels of individual genes and molecular pathways [36].
To assess the RE-associated regulatory charge for individual genes, a quantitative measure was introduced (1) termed Gene RE-linked TFBS Enrichment score (GRE score; Supplementary dataset 1). Conceptually, GRE for an individual gene is the sum of RE-specific TFBS hits mapped in a 10kb-neighborhood of its TSS, that is, normalized on the average content of RE-specific TFBS hits for all genes under study (Supplementary dataset 1). For every gene, GRE makes it possible to measure the regulation by RE-linked TFBS. However, this metric has the following limitation: Different genes have different regulation mechanisms and may have very different numbers of TFBS hits (both RE-linked and not) in their TSS neighborhood. The previous value (GRE score) shows if a gene is enriched or deficient by RE-linked TFBS hits relative to other genes, but the same gene may also be enriched in total (also non-RE) hits.
It is important, therefore, to have a double-normalized value showing if gene regulation is specifically enriched in RE-linked hits relative to its total hits. To this end, a universal gene-specific metric (2) termed Normalized Gene RE-linked TFBS Enrichment score (NGRE) was proposed (Supplementary dataset 1), equal to the sum of RE-specific hits for a gene under investigation, double-normalized to the (i) average number of RE-specific hits for all genes and (ii) balanced total number of hits (not only RE-linked) for the same individual gene (formulas are given in Supplementary dataset 1) [36].
Similarly, at the level of molecular pathways, analogous additive values were proposed [36], termed Pathway Involvement Index (PII) and Normalized Pathway Involvement Index (NPII) (for formulas, see Supplementary dataset 1). PII is needed to assess the total impact of RE-linked TFBS on the regulation of an individual molecular pathway. The bigger PII suggests a higher impact of RE-linked hits on the overall regulation of a molecular pathway, and vice versa. However, PII is not informative to assess the importance of RE-linked regulation of a pathway in the context of its total regulation. To this end, the next metric termed NPII was proposed. The NPII (Normalized PII) is needed to estimate the relative RE-linked impact on the regulation of a whole molecular pathway. Higher NPII indicates a higher relative impact of RE-linked TFBS in the total regulation of a molecular pathway, and vice versa (Supplementary dataset 1) [36].
NGRE and NPII values were designed to estimate the relative impacts of REs in the regulation of individual genes and molecular pathways, respectively. Bigger NGRE and NPII evidence, respectively, a greater RE-linked regulatory impact for an individual gene or for a molecular pathway and, therefore, faster evolution of the corresponding gene regulatory network [36].
Several groups of molecular processes appeared highly enriched in the NGRE/NPII characteristics of their members. These dealt with the immunity and response to pathogens, negative transcriptional regulation, ubiquitination and proteasomal activity, extracellular matrix organization, regulation of STAT signaling, fatty acids metabolism, GTPase activity, protein targeting to Golgi, development, and functioning of perception and reproductive systems. In contrast, the most deficient in RE regulation processes related to the conservative pathways of embryo development [36]. However, these recent results were obtained for only one human cell line and could relate to the cell type- or tissue-specific patterns rather than to the evolutionary context of TFBS reshaping [39].
To distinguish cell type-specific and general evolutionary features, in this study we investigated into the distributions of RE-linked hits for all 13 human cell lines TFBS-profiled for 563 DNA-binding proteins during ENCODE project [40] and representing eight different tissues/organs from the different individuals (Supplementary file 2, Figure 2A). We found that 55.5% of totally mapped TFBS overlapped with the RE sequences, thus confirming RE’s status as the major source of TFBS for human cells. All the different cell lines investigated showed highly correlated patterns of NGRE distributions in pairwise comparisons, with correlation coefficients varying 0.5–0.95 with a median of ~0.85. The degree of RE-linked regulation for the individual genes was, therefore, roughly uniform in the different human tissues. We did the analysis on two evolutionary scales, first roughly corresponding to mammalian radiation and second to common human ancestry divergence with New World monkeys. The major processes enriched by integral RE-linked regulation dealt with olfaction, color vision, spermatogenesis and fertilization, particular aspects of immune and hormonal responses, intracellular molecular trafficking, amino acids, vitamins and fatty acids metabolism, xenobiotic metabolism, and detoxication. In contrast, the deficient pathways were involved in protein synthesis and ribosome biogenesis, RNA transcription and processing, nuclear chromatin organization, cell cycle, apoptosis, cell contacts, embryo development, most signaling pathways, cellular stress response, oxidative phosphorylation in mitochondria, and some other aspects of immunity. Among the top enriched cohort we found an approximate three times higher number of known genes for noncoding RNAs than in the bottom cohort of the same size. The pathway of gene silencing by microRNAs was also the top enriched pathway according to GO analysis.

2. Methods

2.1. Identification of RE-Specific Transcription Factor Binding Sites

Complete genome binding profiles of 563 investigated transcription factor proteins were extracted from the ENCODE database [41] for 13 human cell lines (K562, HepG2, HEK293, GM12878, MCF-7, A549, HeLa-s3, SK-N-SH, HCT116, Ishikawa, HEK293T, MCF-10A, GM12891) according to the standard ENCODE ChIP-seq protocol [6]. The reference human genome assembly 2009 (hg19) was indexed via Burrows–Wheeler algorithm using BWA software, version 0.7.10 [42]. Concatenation of fastq files with single-end or pairwise reads, alignment to the reference genome and filtering were done using BWA, Samtools (version 1.0), Picard (version 1.92), Bedtools (version 2.17.0) and Phantompeakqualtools (version 1.1) software [42] Aligned TFBS reads for each cell line were mapped on the RE sequences annotated by RepeatMasker (version 3.2.7) [43] and downloaded from the UCSC Browser [44] (RepeatMasker table). TFBS occurrence data were extracted from the bedGraph files [45] containing conservative IDR-thresholded peaks according to the standard ENCODE ChIP-seq analysis pipeline [46]. The folds change over control profiles for TFBS as well as the profiles for p-value to reject the null hypothesis that the signal at that location is present in the control were built using Macs software (version 2.1.0) [46] based on the alignment data. The list of transcription factors investigated here and raw ENCODE data files for each cell line is shown in Supplementary file 2.
Quality control of TFBS peaks analyzed in this study was performed using Irreproducible Discovery Rate correction according to ENCODE recommendations [46].

2.2. Evaluation of Evolutionary Age of Mapped REs

For each family of REs, average divergence from the consensus sequence was used as a measure of its evolutionary age. REs with an average divergence less than 8% were considered as evolutionary younger fraction, concerning the evolution of human lineage since its divergence from New World monkeys [47]. Another group contained all REs and roughly reflected genome shaping by REs since the origin of major eutherian clades [47]. Gene and molecular pathway enrichment by RE-linked TFBS was calculated separately for all and young REs. Average divergence from the consensus sequence was calculated using Repeatmasker software.

2.3. Measuring Gene Enrichment by RE–linked TFBS

The coordinates of human protein-coding genes were downloaded from the USCS Browser [44] (RefGenes table, genome assembly hg19). For each gene and cell line, all individual REs overlapping with the 10 kb-long neighborhood of its reference transcription start site were selected for further analysis. The 10-kb neighborhood covered an interval starting 5 kb upstream and ending 5 kb downstream the transcription start site. For every known gene in every cell line, we calculated its GRE and NGRE scores according to the formulas shown in Supplementary dataset 1. In total, we calculated GRE and NGRE scores for 24 389 human genes.

2.4. Measuring Molecular Pathway Enrichment by RE–Linked TFBS

Gene architecture data of the molecular pathways were extracted from the following databases: BioCarta [48] (downloaded on March 2015), KEGG [49] (downloaded on June 2015), NCI [50] (downloaded on March 2015), Reactome [51] (downloaded on March 2015) and Pathway Central [52] (downloaded on March 2015). Data on molecular pathways structure were downloaded in .xml and .biopax formats from these databases and implemented in our computational algorithm [30]. In total, 3123 pathways were investigated. For each pathway in every cell line, we calculated PII and NPII scores according to the formulas shown in Supplementary dataset 1.

2.5. Analysis of Cell Line Patterns of RE-Linked TFBS.

To screen for correlations of RE-linked TFBS distribution patterns among the cell lines under investigation, we first calculated Pearson correlation coefficients of gene-specific GRE values for each cell line under investigation except K562, with GRE values of previously investigated cell line K562 [36]. In this study, TFBS profiles for 260 TFs were studied for the K562 cell line. Second, we calculated all pairwise Pearson correlation coefficients of GRE values among all 13 cell lines under investigation (including K562). Similarly, the set of Pearson correlation coefficients was also calculated for the NGRE values as well. GRE and NGRE scores were calculated for the groups of all REs. Pairwise correlation for GRE and NGRE and the numbers of transcription factors investigated in each cell line are shown in Supplementary file 3. The entries in the main diagonal show numbers of transcription factors for each cell line; the intersections of the cell line vertical and horizontal rows above the main diagonal show Pearson correlation coefficients among the GRE scores for these two cell lines; and intersections of the cell line vertical and horizontal rows below the main diagonal show Pearson correlation coefficients among the NGRE scores. The same set of pairwise correlations for pathway scores of all REs, PII and NPII, are shown in Supplementary file 4. Similarly, the entries in the main diagonal show the numbers of transcription factors; intersections of the cell line vertical and horizontal rows above the main diagonal show Pearson correlation coefficients among the PII scores; and intersections of the cell line vertical and horizontal rows below the main diagonal show Pearson correlation coefficients among the NGRE scores.

2.6. Gene Ontology Enrichment Analysis

Gene Ontology analysis of genes that are enriched or deficient in RE-linked TFBS regulation (RRE-enriched and RRE-deficient genes, respectively) was performed using DAVID (version 6.8) software [53] and Gorilla (version 1.0) software [54] using human genes IDs extracted from USCS Genome Browser [55]. The p-values specifying the significance of observed GO-terms enrichment were calculated using a modified Fisher’s exact test [56]. The cut-off for p-values was set as 0.05. The enrichment values of GO-terms and Annotation Clusters were calculated as fold changes of their occurrences in the sample and in the human genome [56].

2.7. Significance of Correlations

The statistical significance of correlations was calculated as a Pearson correlation coefficient with a p-value using the Seaborn (version 0.9.0) package [57].

2.8. Significance of Gene Ontology Enrichment Analysis

To assess the confidence of the observed patterns for RE-impacted functional processes, we generated 500 sets of randomly permutated GRE and NGRE scores across the cell lines tested by randomly rearranging gene names. For each perturbation, we extracted a set of GRE-NGRE distribution-based 1219 top and bottom genes. These gene sets were profiled by DAVID software and top-100 GO terms were selected for each set by the lowest p-value for each random permutation. Finally, we compared the distributions of p-values for the top-100 GO terms for the permutated and real gene sets: real RRE-enriched and RRE-deficient genes were respectively compared with the distributions of RRE-enriched and RRE-deficient genes in random permutations. The overall data analysis pipeline is schematically depicted in Supplementary file 5.
All computational methods and all the codes used are freely available upon request to the authors.

3. Results

3.1. Mapping of RE-Specific TFBS

From the ENCODE project repository, we extracted experimental TFBS data based on the sequencing of immunoprecipitated DNA for 563 transcription factor proteins [6,58,
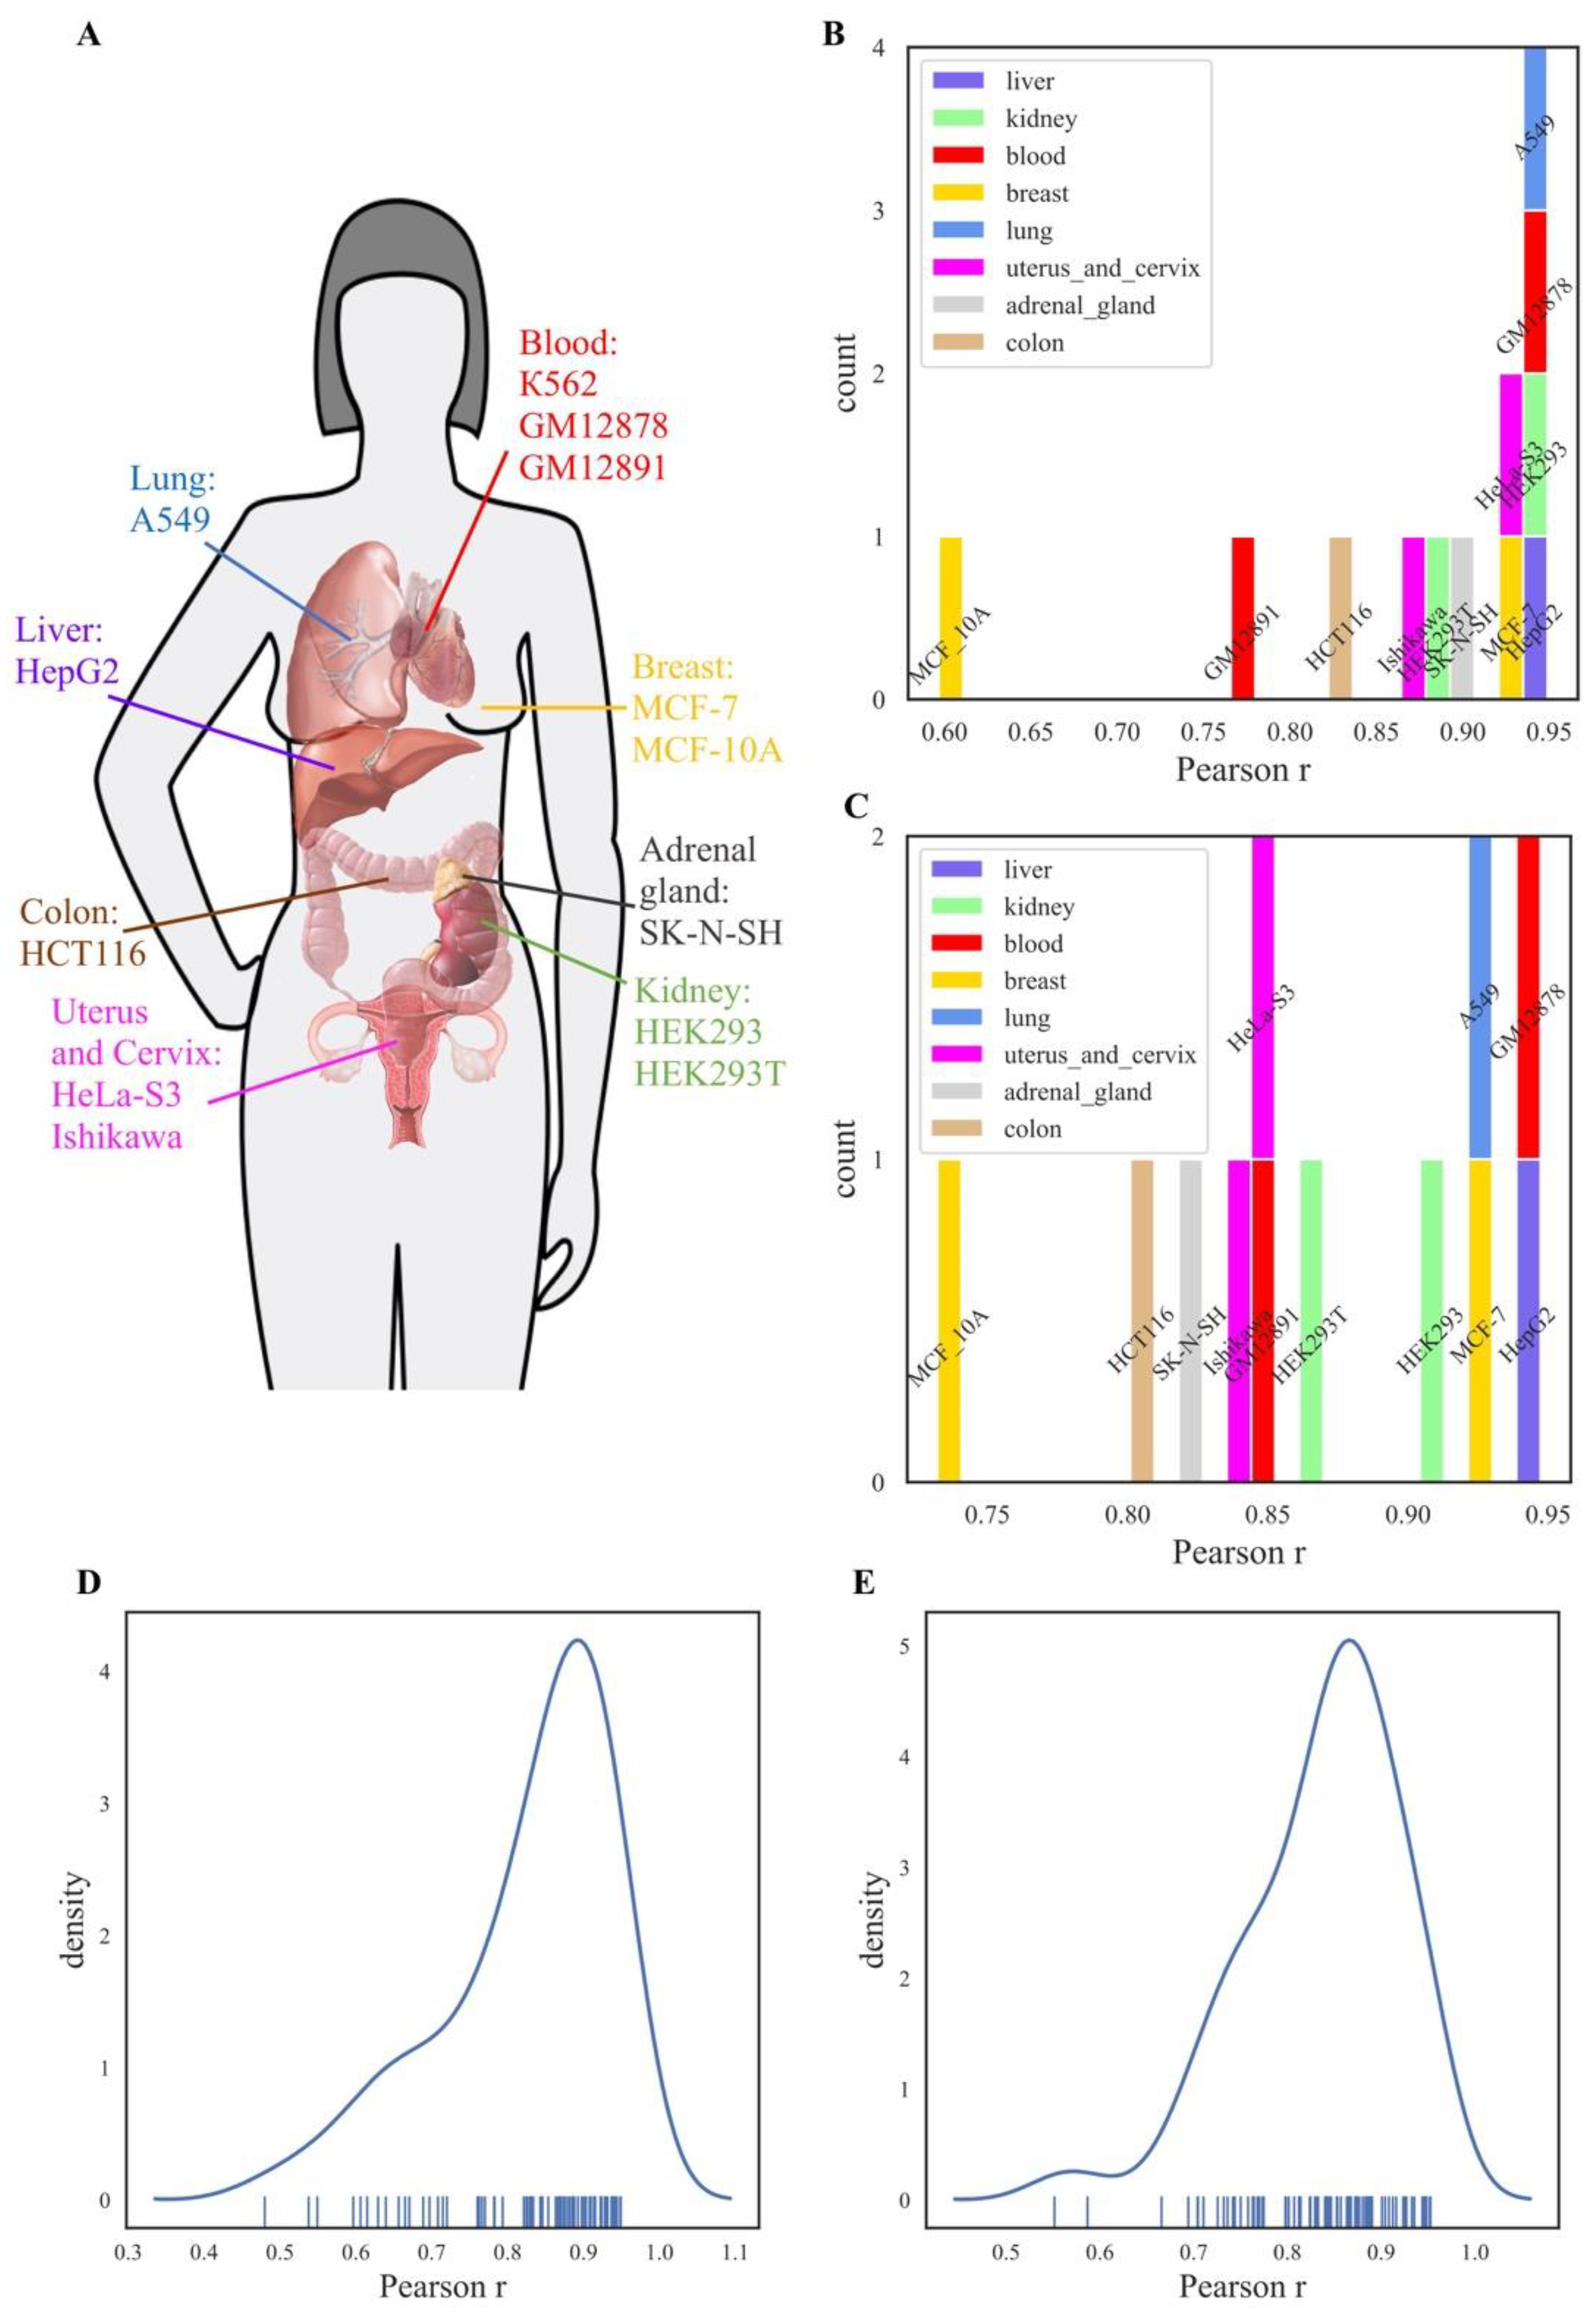
59]. The sufficient amount of data including mapping TFBS for at least three transcription factors was available for 13 human cell lines (Supplementary file 2): myelogenous leukemia K562, transformed B cells GM12891, transformed lymphoblasts GM12878, cervix adenocarcinoma HeLa S3, endometrial adenocarcinoma Ishikawa, original and transformed human embryonal kidney HEK293 and HEK293T, breast cancer MCF-7 and MCF-10A, lung adenocarcinoma A549, hepatocyte carcinoma HepG2, colon carcinoma HCT116, and neuroblastoma SK-N-SH. These cell lines, therefore, represented eight cancerous or transformed human tissues/organs: blood, cervix, kidney, adrenal gland, mammary gland, lung, liver, and colon. Statistics for the TFBS data extracted and mapped on REs for these cell lines is shown in Table 1.
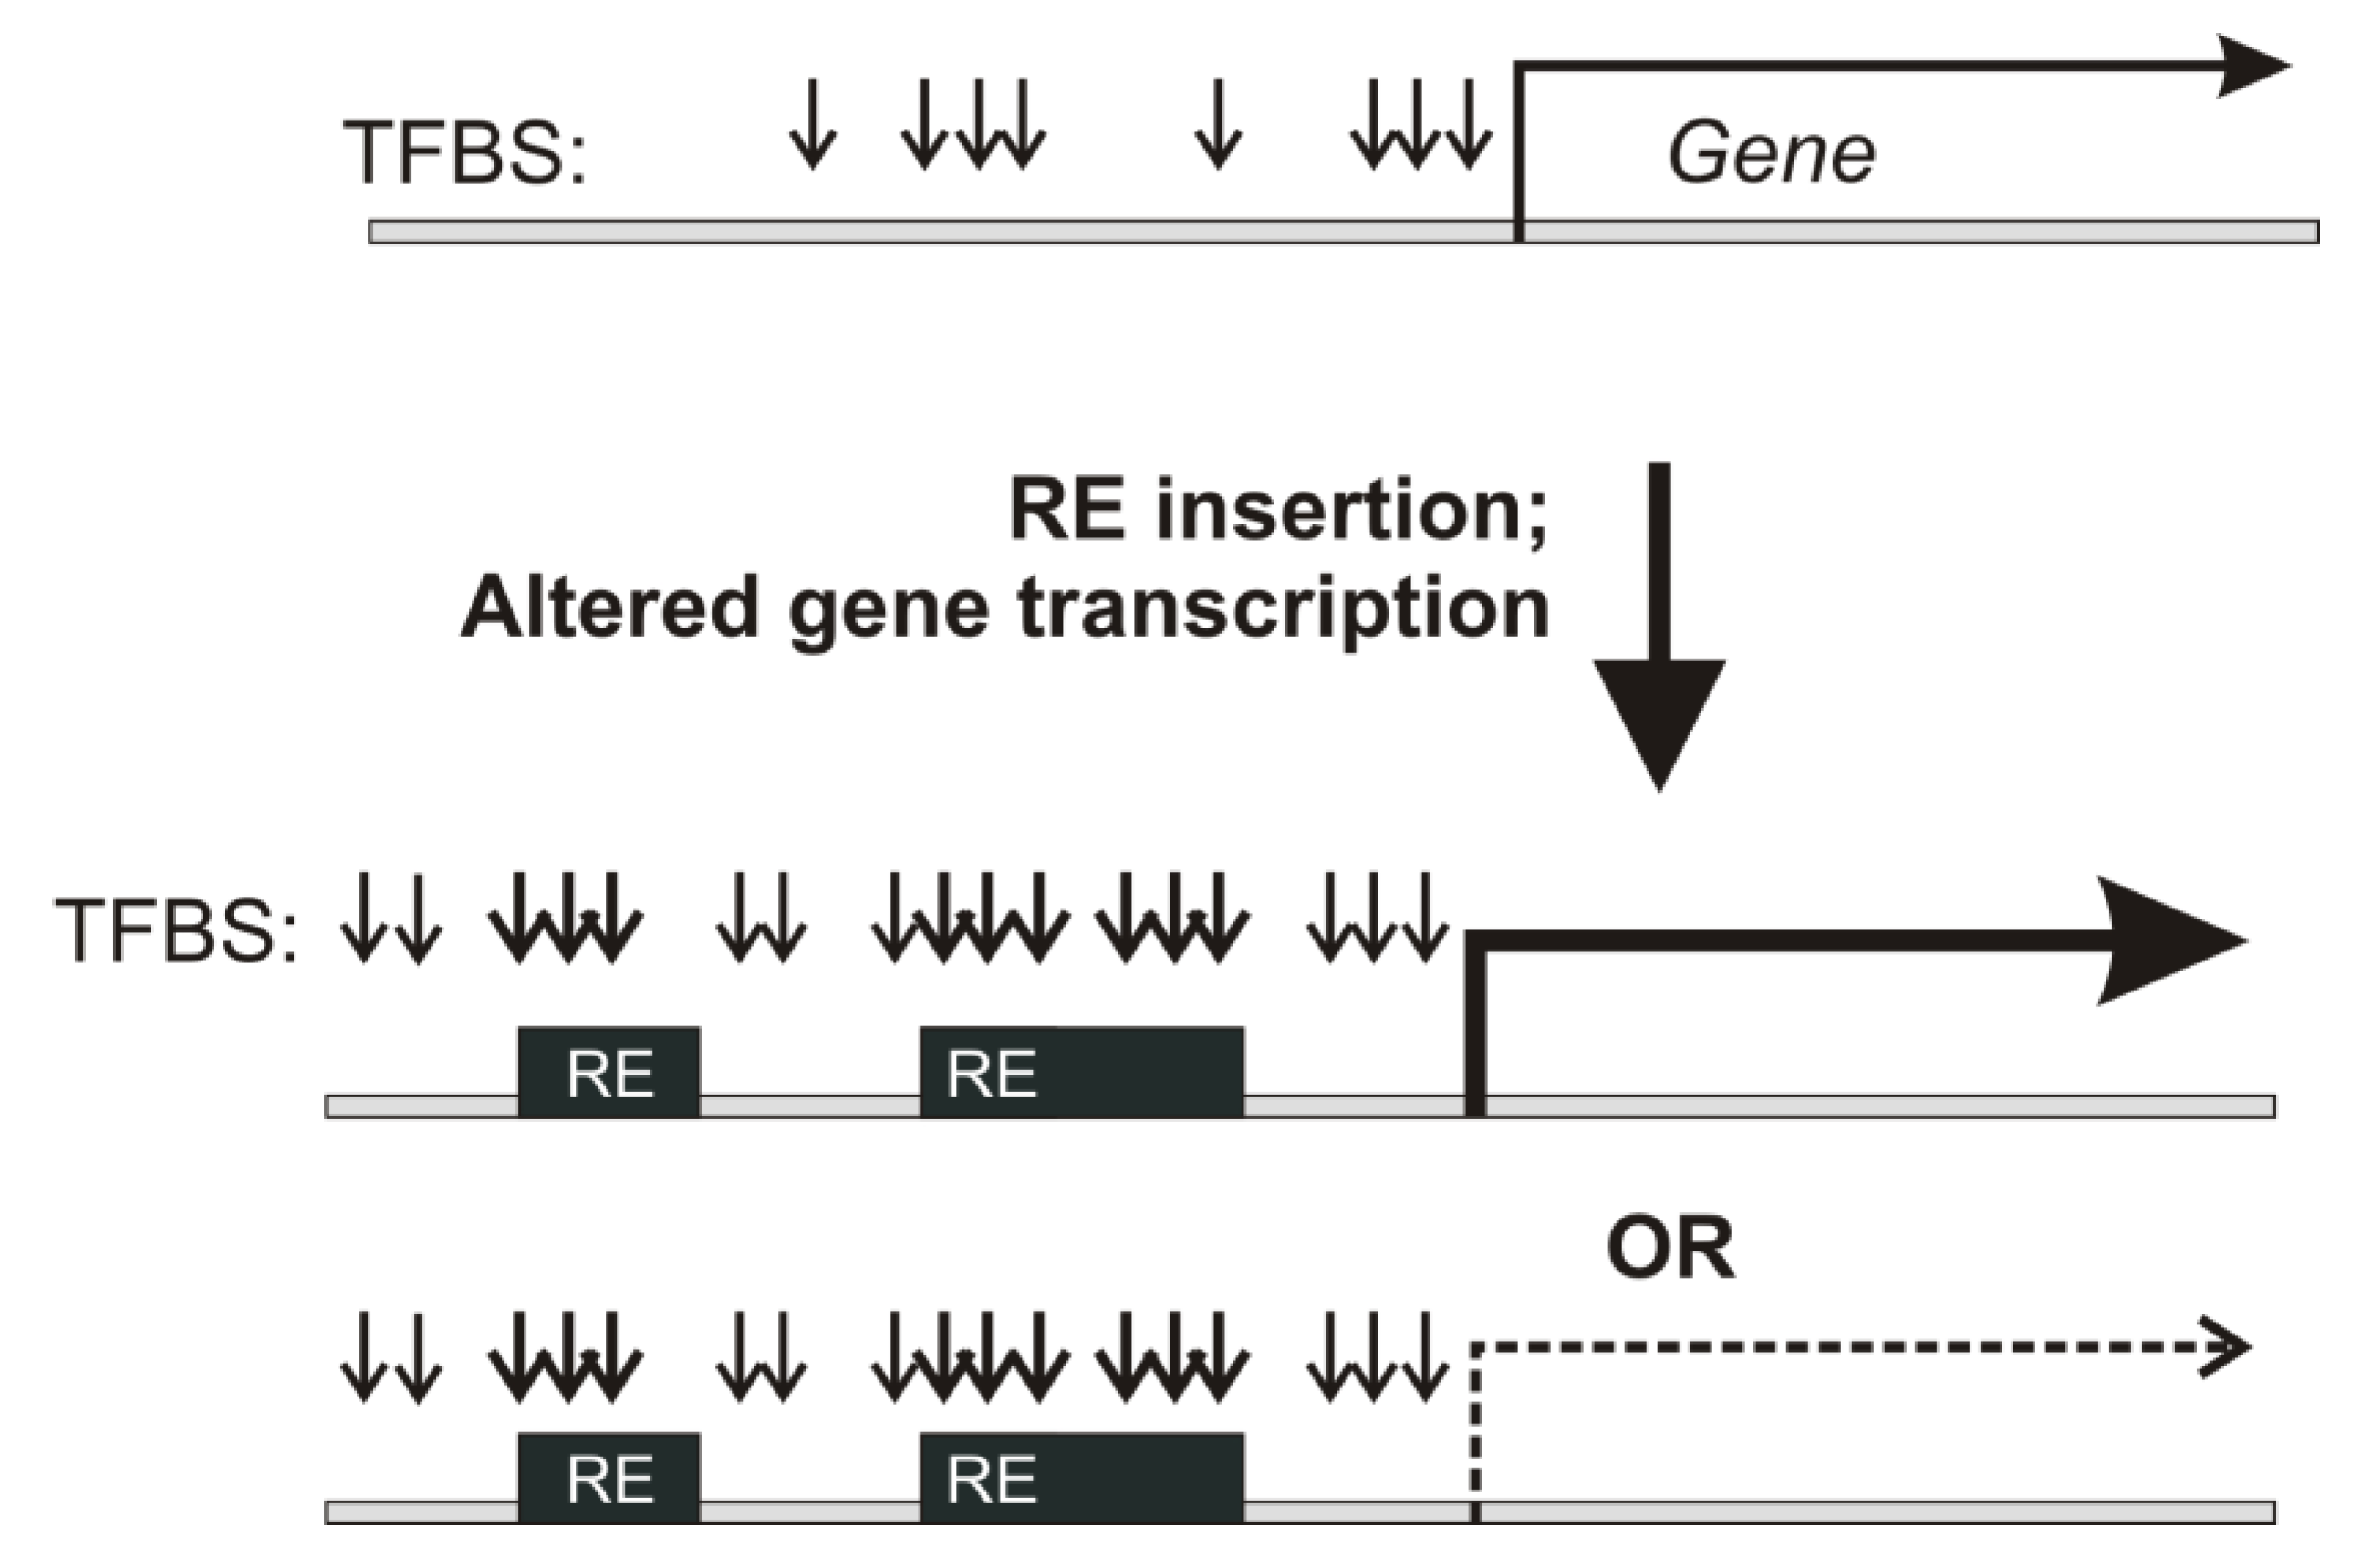
In total, 277,187,723 TFBS hits could be mapped on the human genome for all these cell lines. Of them, 55.5% overlapped with the RE sequences, thus confirming that REs serve as the major source of TFBS in human cells.
Considering previous reports, this proportion may seem high [60]. However, in our analysis, all multimapped TFBS reads were filtered out according to the standard ENCODE ChIP-seq mapping and filtering pipeline [42], so the results represented uniquely mapped TFBS reads. To confirm this TFBS proportion, we also validated the method used by parallel mapping of all human RE sequences extracted from USCS Genome Browser [55] on the human genome. In a good agreement with previously published data [1], REs mapped by the same approach occupied ~45% of human DNA, genome assembly hg19. We therefore found no technological drawbacks here and suggest that the proportion of 55.5% RE-linked TFBS is correct at least for the ENCODE primary cell culture datasets used.
However, this proportion was somewhat lower for the TFBS mapped in a 10-kb neighborhood of gene transcriptional start sites (TSS): among 43,042,026 totally mapped TFBS, only 47% overlapped with REs. This overall trend was representative for all cell lines under investigation (Table 2). The TSS-proximal TFBS hits were unevenly distributed among the major classes of REs: ~30% were attributed to SINEs; ~17%–to LINEs and ~7%–to LTR retrotransposons and endogenous retroviruses. For the total fraction of RE-linked TFBS hits (not only gene-proximal), these proportions were, respectively, 28%, 26% and 12%.
These data evidence that TSS-proximal TFBS are peculiar because they have a ~1,2-fold lower proportion of RE-linked hits (Table 1).
The distribution of TFBS hits for the different transcriptional factor proteins varied among the different cell lines (Supplementary file 6, color scale shows depth of TFBS mapping; blank spaces mean an absence of TFBS data for the respective transcriptional factor in the context of a given cell line in the ENCODE dataset).

3.2. Calculation of Gene- and Pathway-Specific Characteristics of RE-Linked TFBS

For 25075 known individual human genes, we calculated the RE-linked TFBS absolute and normalized enrichment scores GRE and NGRE, respectively (Supplementary tables 1 and 7). For 3126 molecular pathways, we calculated the RE-linked TFBS absolute and normalized enrichment scores PII and NPII, respectively (Supplementary tables 1 and 8). All RE enrichment scores were calculated both for all and evolutionary young RE groups. The REs having a mean divergence from their consensus sequence of 8% and less were considered evolutionary young. This 8% divergence value roughly corresponds to the radiation of human ancestry from the New-World monkeys evolutionary clade [47]. It should be noted that for the most extensively profiled cell line K562, as much as 44% of genes were not impacted by evolutionary young REs and had zero GRE scores. To compare, for all Res, only 1.5% of human genes had zero GRE scores. A similar trend was seen in all the cell lines investigated here.

3.3. Comparison of RE-Linked TFBS Distribution Patterns among the Cell Lines

We next compared NGRE scores for all individual genes among the different cell lines investigated in this study (Figure 2). For comparisons with the previously published profiles of leukemia K562 cells [36], the NGRE scores were strongly correlated among the cell lines with a Pearson correlation r varying from 0.6 to 0.95 with a median value of ~0.9 (Figure 2B). Similarly, the molecular pathway-based NPII scores were also significantly correlated (r varying from 0.75 to 0.95 with median ~0.85), Figure 2C. NGRE and NPII correlations were calculated for all REs since RE-linked TFBS enrichment values were non-zero for the majority of genes.
The correlations between K562 and other cell lines were not tissue-specific, as there were no tissue type-specific patterns observed in the distributions of the correlation coefficients (Figure 2A-C). For example, at the NGRE level, myelogenous leukemia cells K562 were equally strongly correlated (r~0.95) with the transformed lymphoblasts GM12878 cells and with the kidney HEK293, lung adenocarcinoma A549 and hepatocyte carcinoma HepG2 cells (Figure 2B). At the level of molecular pathways, the highest NPII score correlations with K562 were also seen for the same cell lines in addition to mammary gland carcinoma cells MCF-7 (Pearson r varying 0.9–0.95, Figure 2C). Finally, for all possible pairwise comparisons between all the cell lines investigated here, we observed unimodal distribution of Pearson correlations varying from ~0.5–0.95 with a median of 0.88, both at the gene and the pathway levels (Figure 2D and E, respectively).
These findings strongly suggest that all 13 tested cell lines representing eight different human tissues are strongly congruent in RE-linked TFBS regulation of human genes and molecular pathways.

3.4. Genes and Molecular Pathways Enriched or Deficient in all RE-Linked TFBS Regulation

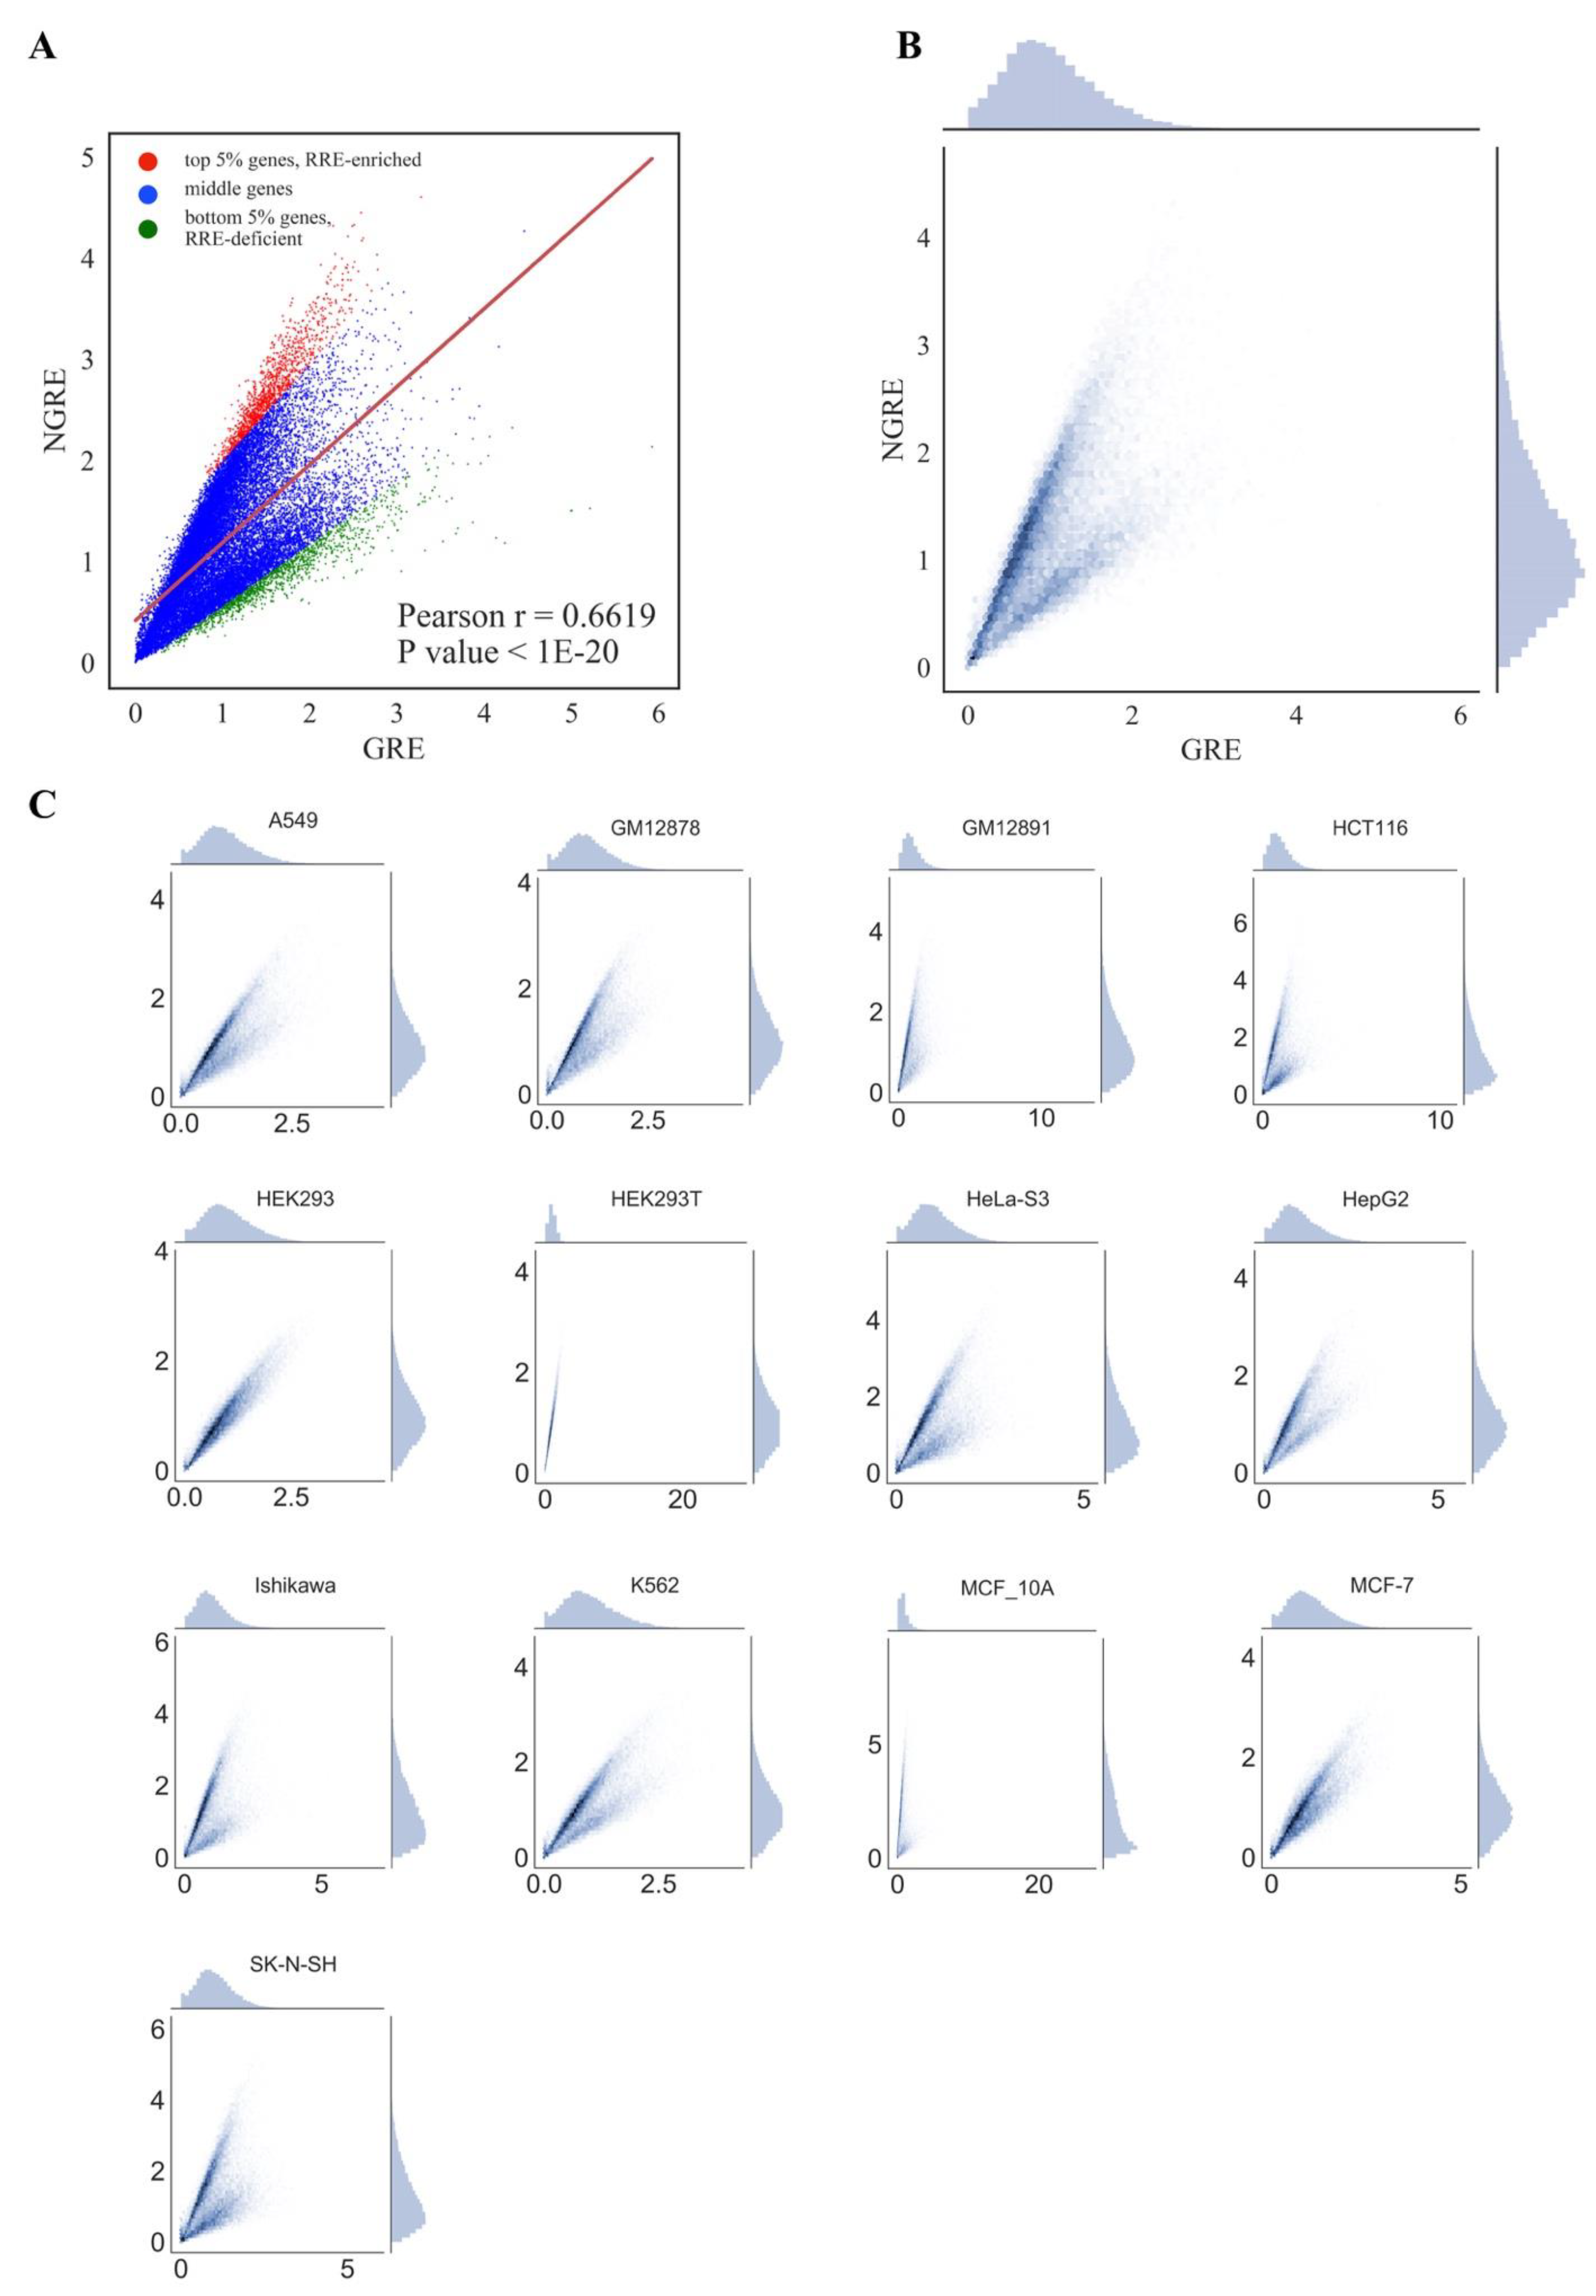
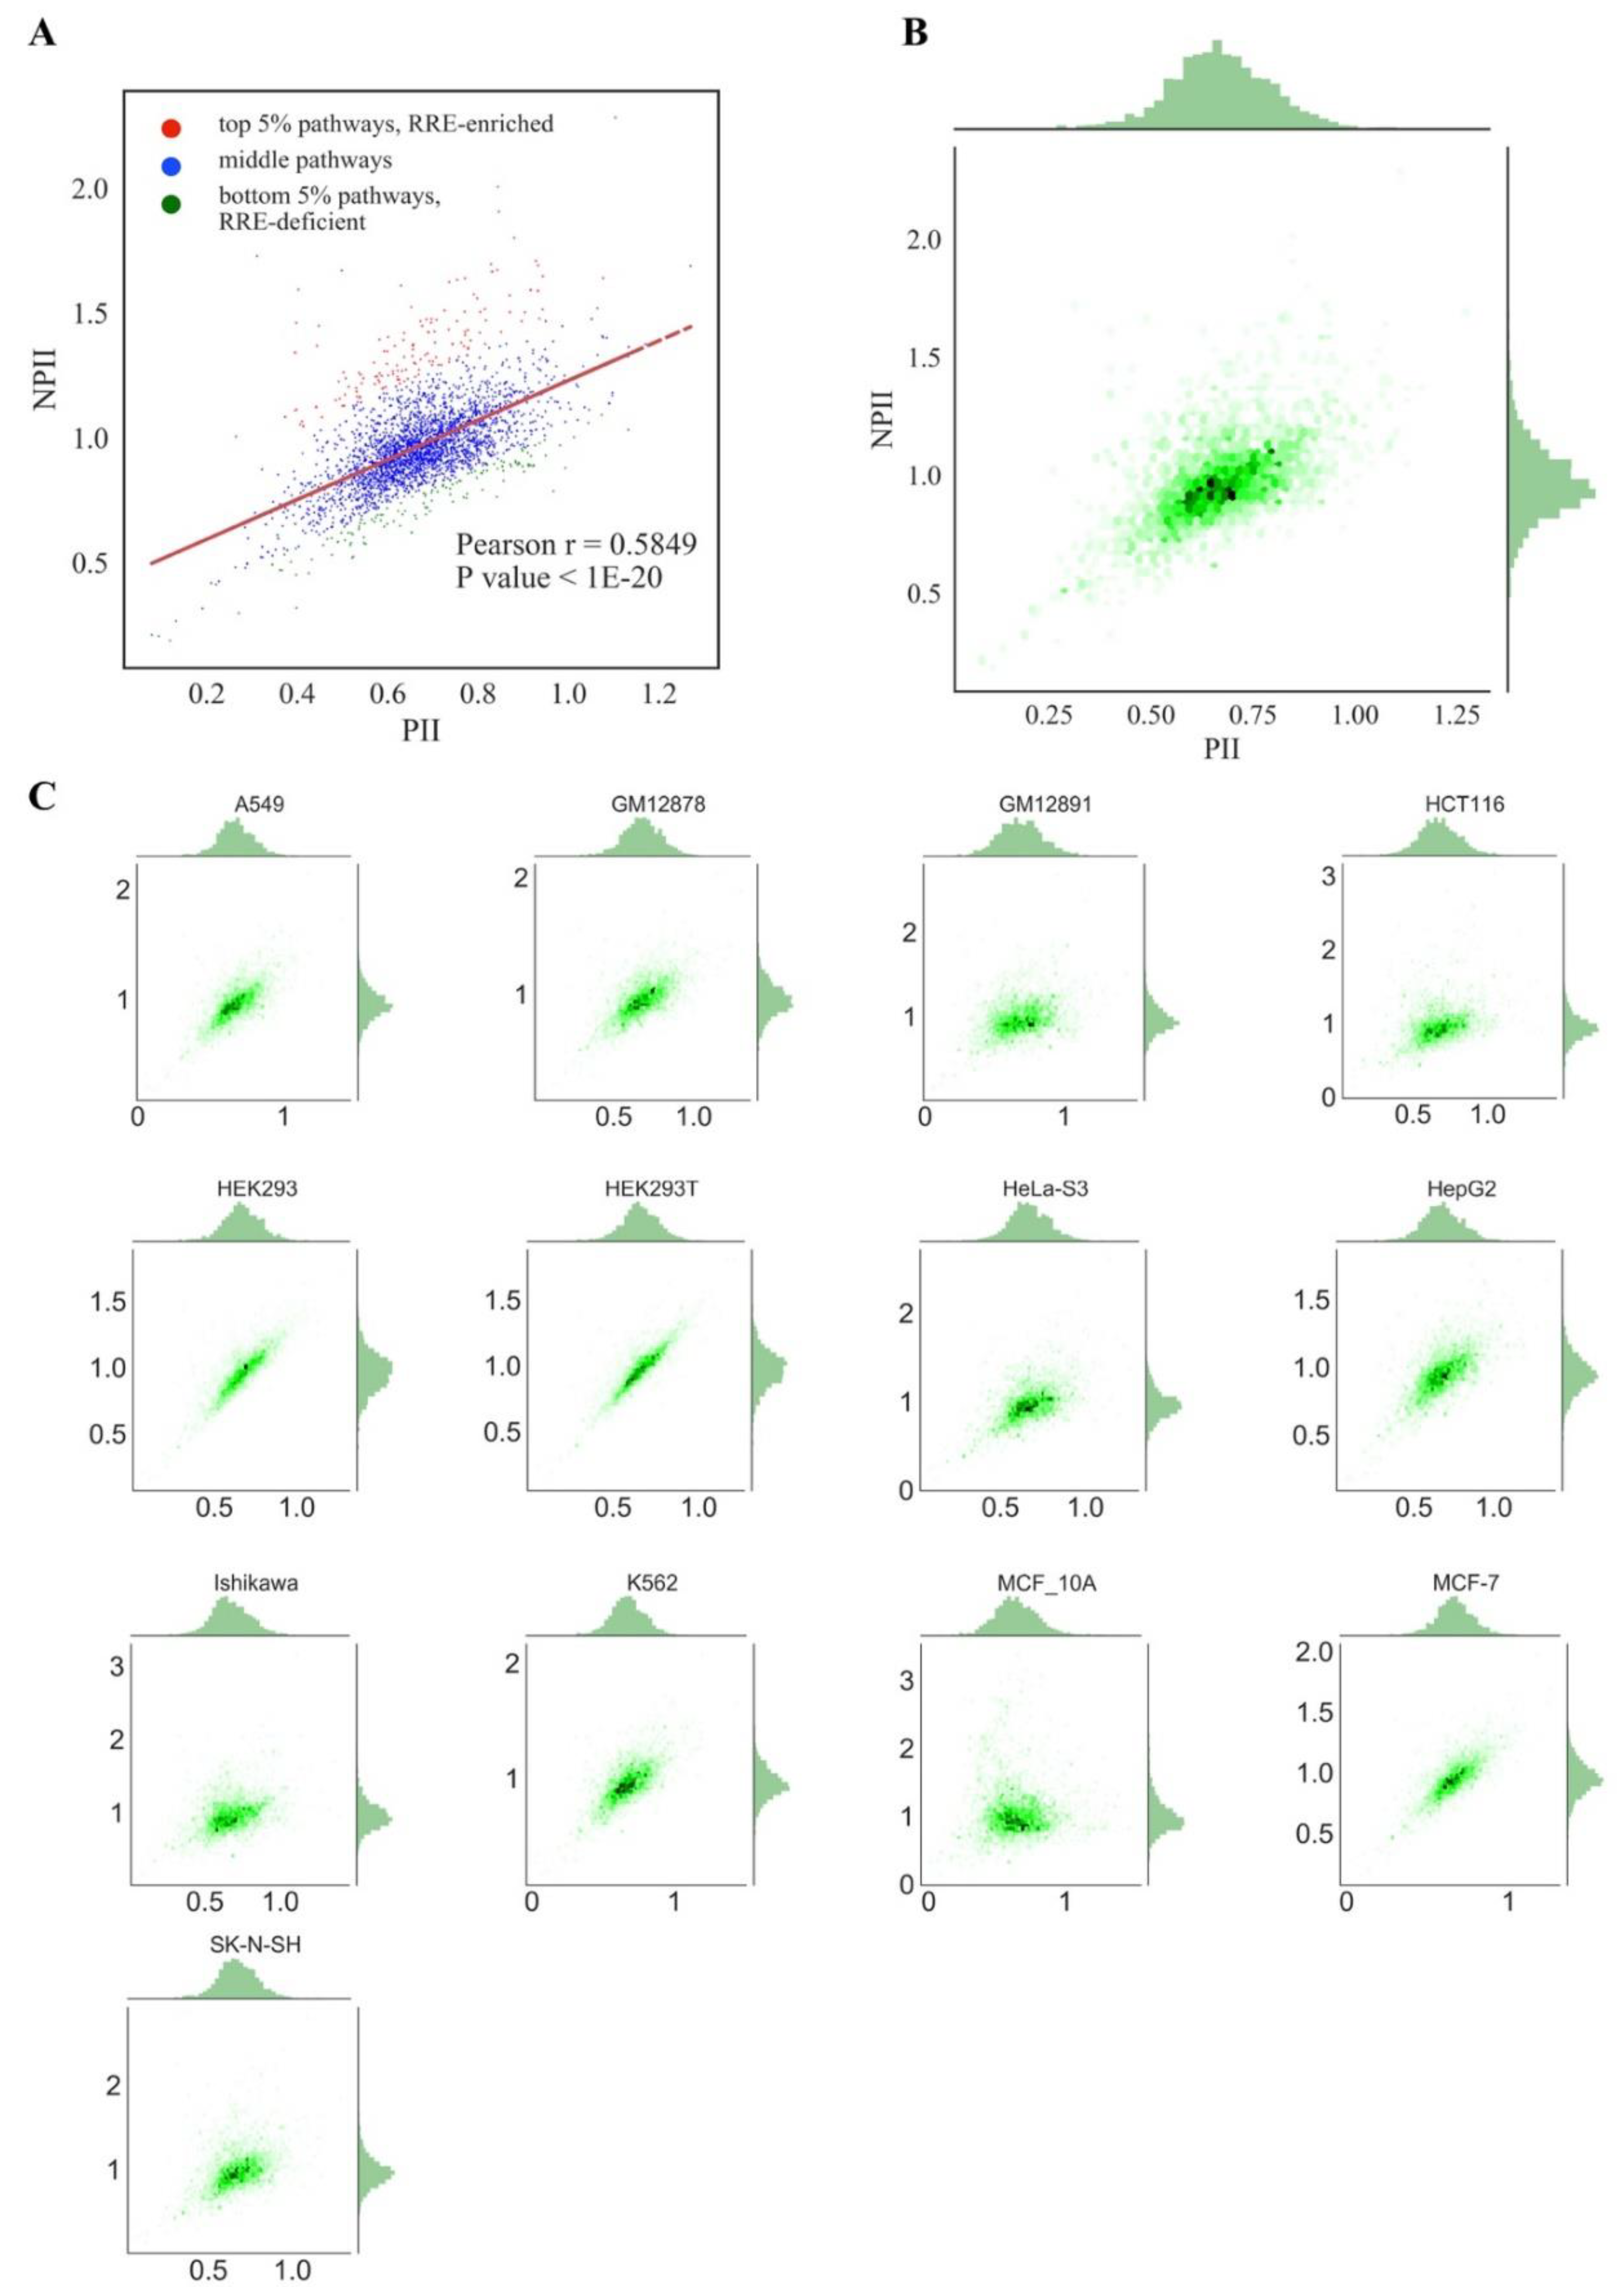
We next attempted to identify genes and molecular pathways enriched or deficient in RE-linked TFBS regulation (RRE-enriched and RRE-deficient genes/pathways). To this end, 24,389 human genes and 3123 pathways under investigation were examined respectively on scatter plots with an abscissa axis showing the GRE score for genes or PII for pathways, and, respectively, ordinate axis showing the NGRE score for genes and NPII for pathways (Figure 3 and Figure 4, respectively). This kind of presentation enables to visually distinguish genes/pathways that have a higher or lower RRE impact. Among the entries with the same GRE /PII scores, those having higher NGRE /NPII metrics will be enriched in RRE, end vice versa: Those with lower NGRE /NPII will be RRE-deficient.
For both types of graphs, we observed very similar distribution trends among the different cell lines (Figure 3 and Figure 4). At the pathway level, PII and NPII scores were statistically significantly correlated for all the cell lines (Pearson r~0.58; Figure 4). Correlation was also strong at the gene level (GRE /NGRE), but in 12/13 of the cell lines tested we observed unusual yet very similar V-shaped distributions (Figure 3). This shape was remarkable and represented two rays of higher and lower slope coming from a zero point. The upper and lower rays accumulated, respectively, in relatively RRE-enriched and RRE-deficient genes.
We concluded, therefore, that different cell lines demonstrate highly similar patterns of RE-linked TFBS regulation at both the gene and pathway levels, as also suggested by the strong correlations among the cell lines (previous section). To operate with the universal values representing all cell lines tested, we next introduced the aggregated scores equal to the mean GRE, NGRE, PII and NPII values for all cell lines investigated, respectively (Figure 3A,B, Figure 4A,B). The distributions of the aggregated values were similar to those for the individual cell lines (Figure 3 and Figure 4).
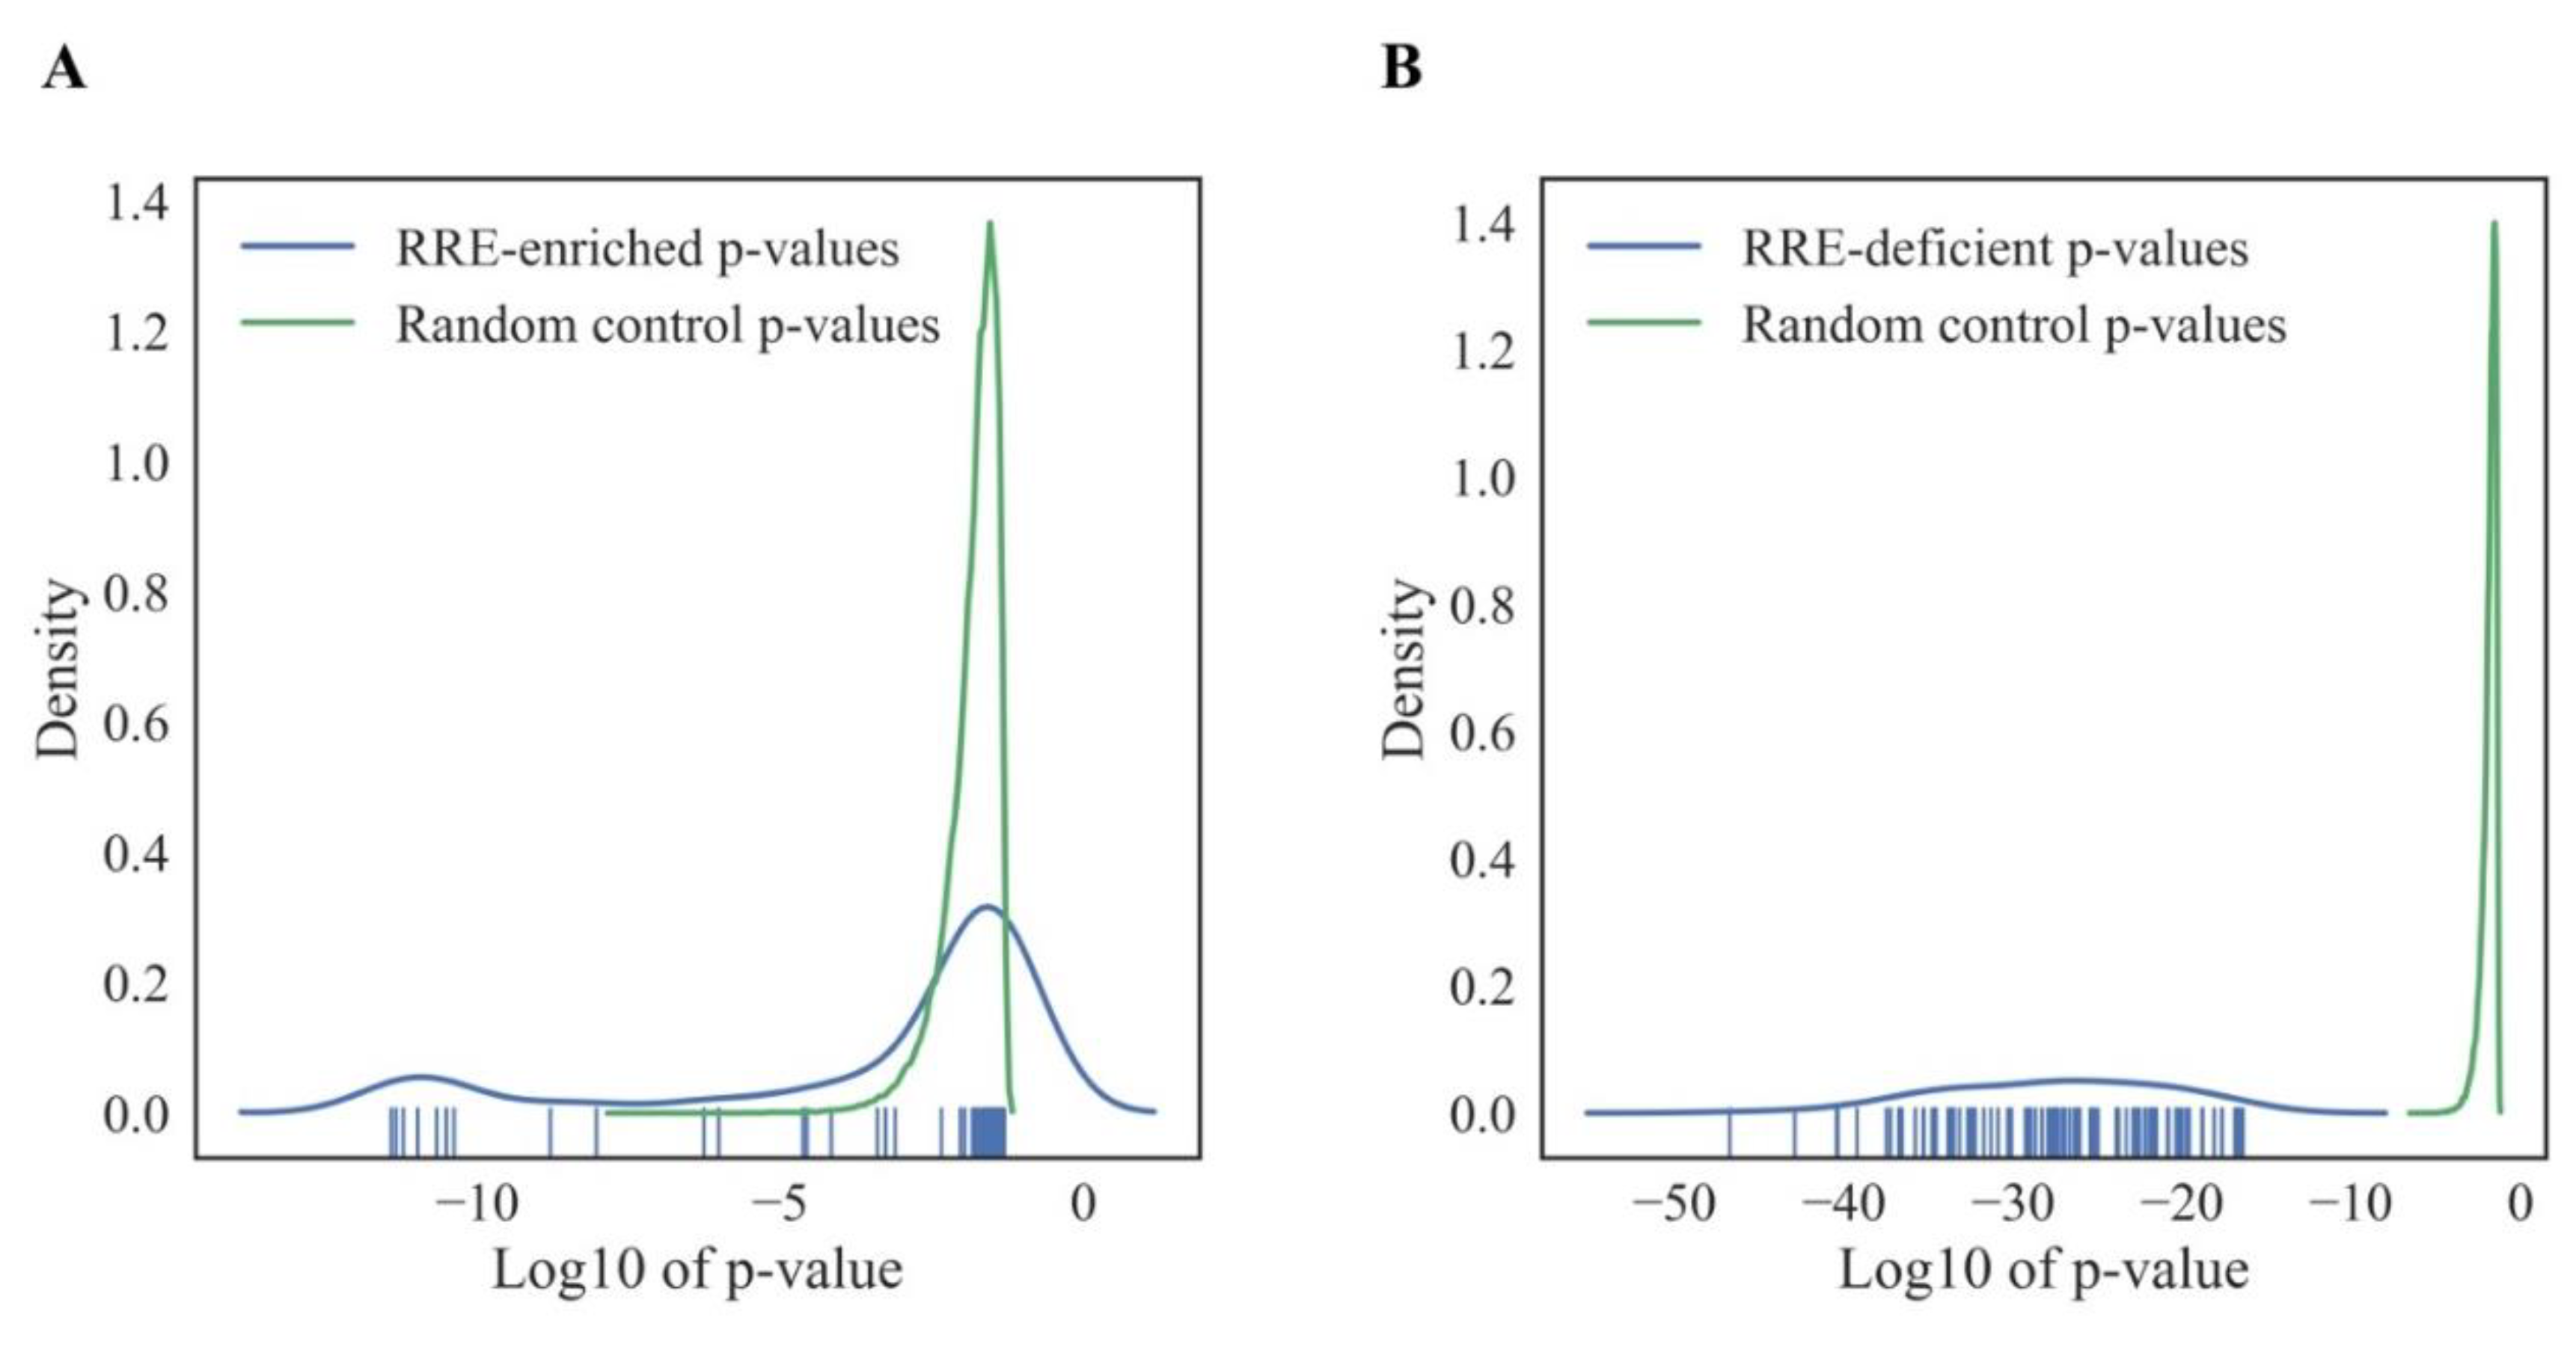
To formalize the identification of the top RRE-enriched and deficient genes and pathways, we did the following. For the gene level, 1000 random sets each containing 500 genes were examined and a regression line (polynomial curve of first degree) was calculated using the Least Squares method [61]. Then two regression lines with the highest and lowest slope were selected. Then, 5% (1219) genes lying above the highest slope regression line with the maximal Euclidean distance to this regression line were considered as RRE-enriched. Similarly, 5% of the genes lying below the lowest slope regression line with maximal Euclidean distance from it were considered as RRE-deficient (Figure 3).
At the level of molecular pathways, a regression line (polynomial curve of first degree) was calculated using the Least Squares method [61] for the entire set of 3123 molecular pathways. Five percent (156) of pathways with maximal Euclidean distance lying above the regression line were considered as RRE-enriched, and 5% with maximal Euclidean distance lying below the regression line were considered as RRE-deficient pathways (Figure 4). We, therefore, identified 1219 top and 1219 bottom genes and 156 top and 156 bottom molecular pathways according to a measured aggregated RE-linked TFBS regulation in all13 human cell lines tested (Supplementary dataset 9 and 10).

3.5. Functional Characteristics of Top RRE-Enriched and Deficient Genes (all REs)

For the selected 1219 top and 1219 bottom genes, we performed Gene Ontology (GO) analysis using DAVID software [62,63] to identify if they are enriched by the clusters of genes included in any biological processes. The data on the top GO annotation clusters with a p-value < 0.05 are shown in Supplementary dataset 11. In total, 141 GO annotation terms were identified for the RRE-enriched genes, versus as much as 1022 (~7 times more) terms for the fraction of RRE-deficient genes. This finding may represent a phenomenon that more biological processes in human cells are evolutionary conserved than quickly evolving.
We manually curated the identified annotation terms and could classify them into 27 major groups (Table 3). The significantly RRE-enriched groups of the processes dealt with the metabolism of amino acids, lipids and metals, detoxication and response to xenobiotics, with sensory perception, neurotransmission and fertilization. The RRE-deficient groups of processes were more numerous and featured protein translation, RNA transcription, intracellular signaling, cell adhesion and interaction, cell cycle progression, programmed cell death, metabolism of nucleic acids, carbohydrates, response to phorbol acetate, protein modifications, stress response and general virus response mechanisms, maintaining chromatin organization, electron transfer chain, and mitochondria functioning.
Fifty annotation terms were linked with immunity; they were distributed differently depending on their functional roles. For example, immune cells migration/activation and cellular immune response by T- and NK cells were RRE-enriched, whereas B cells-related terms were RRE-deficient (Table 4).
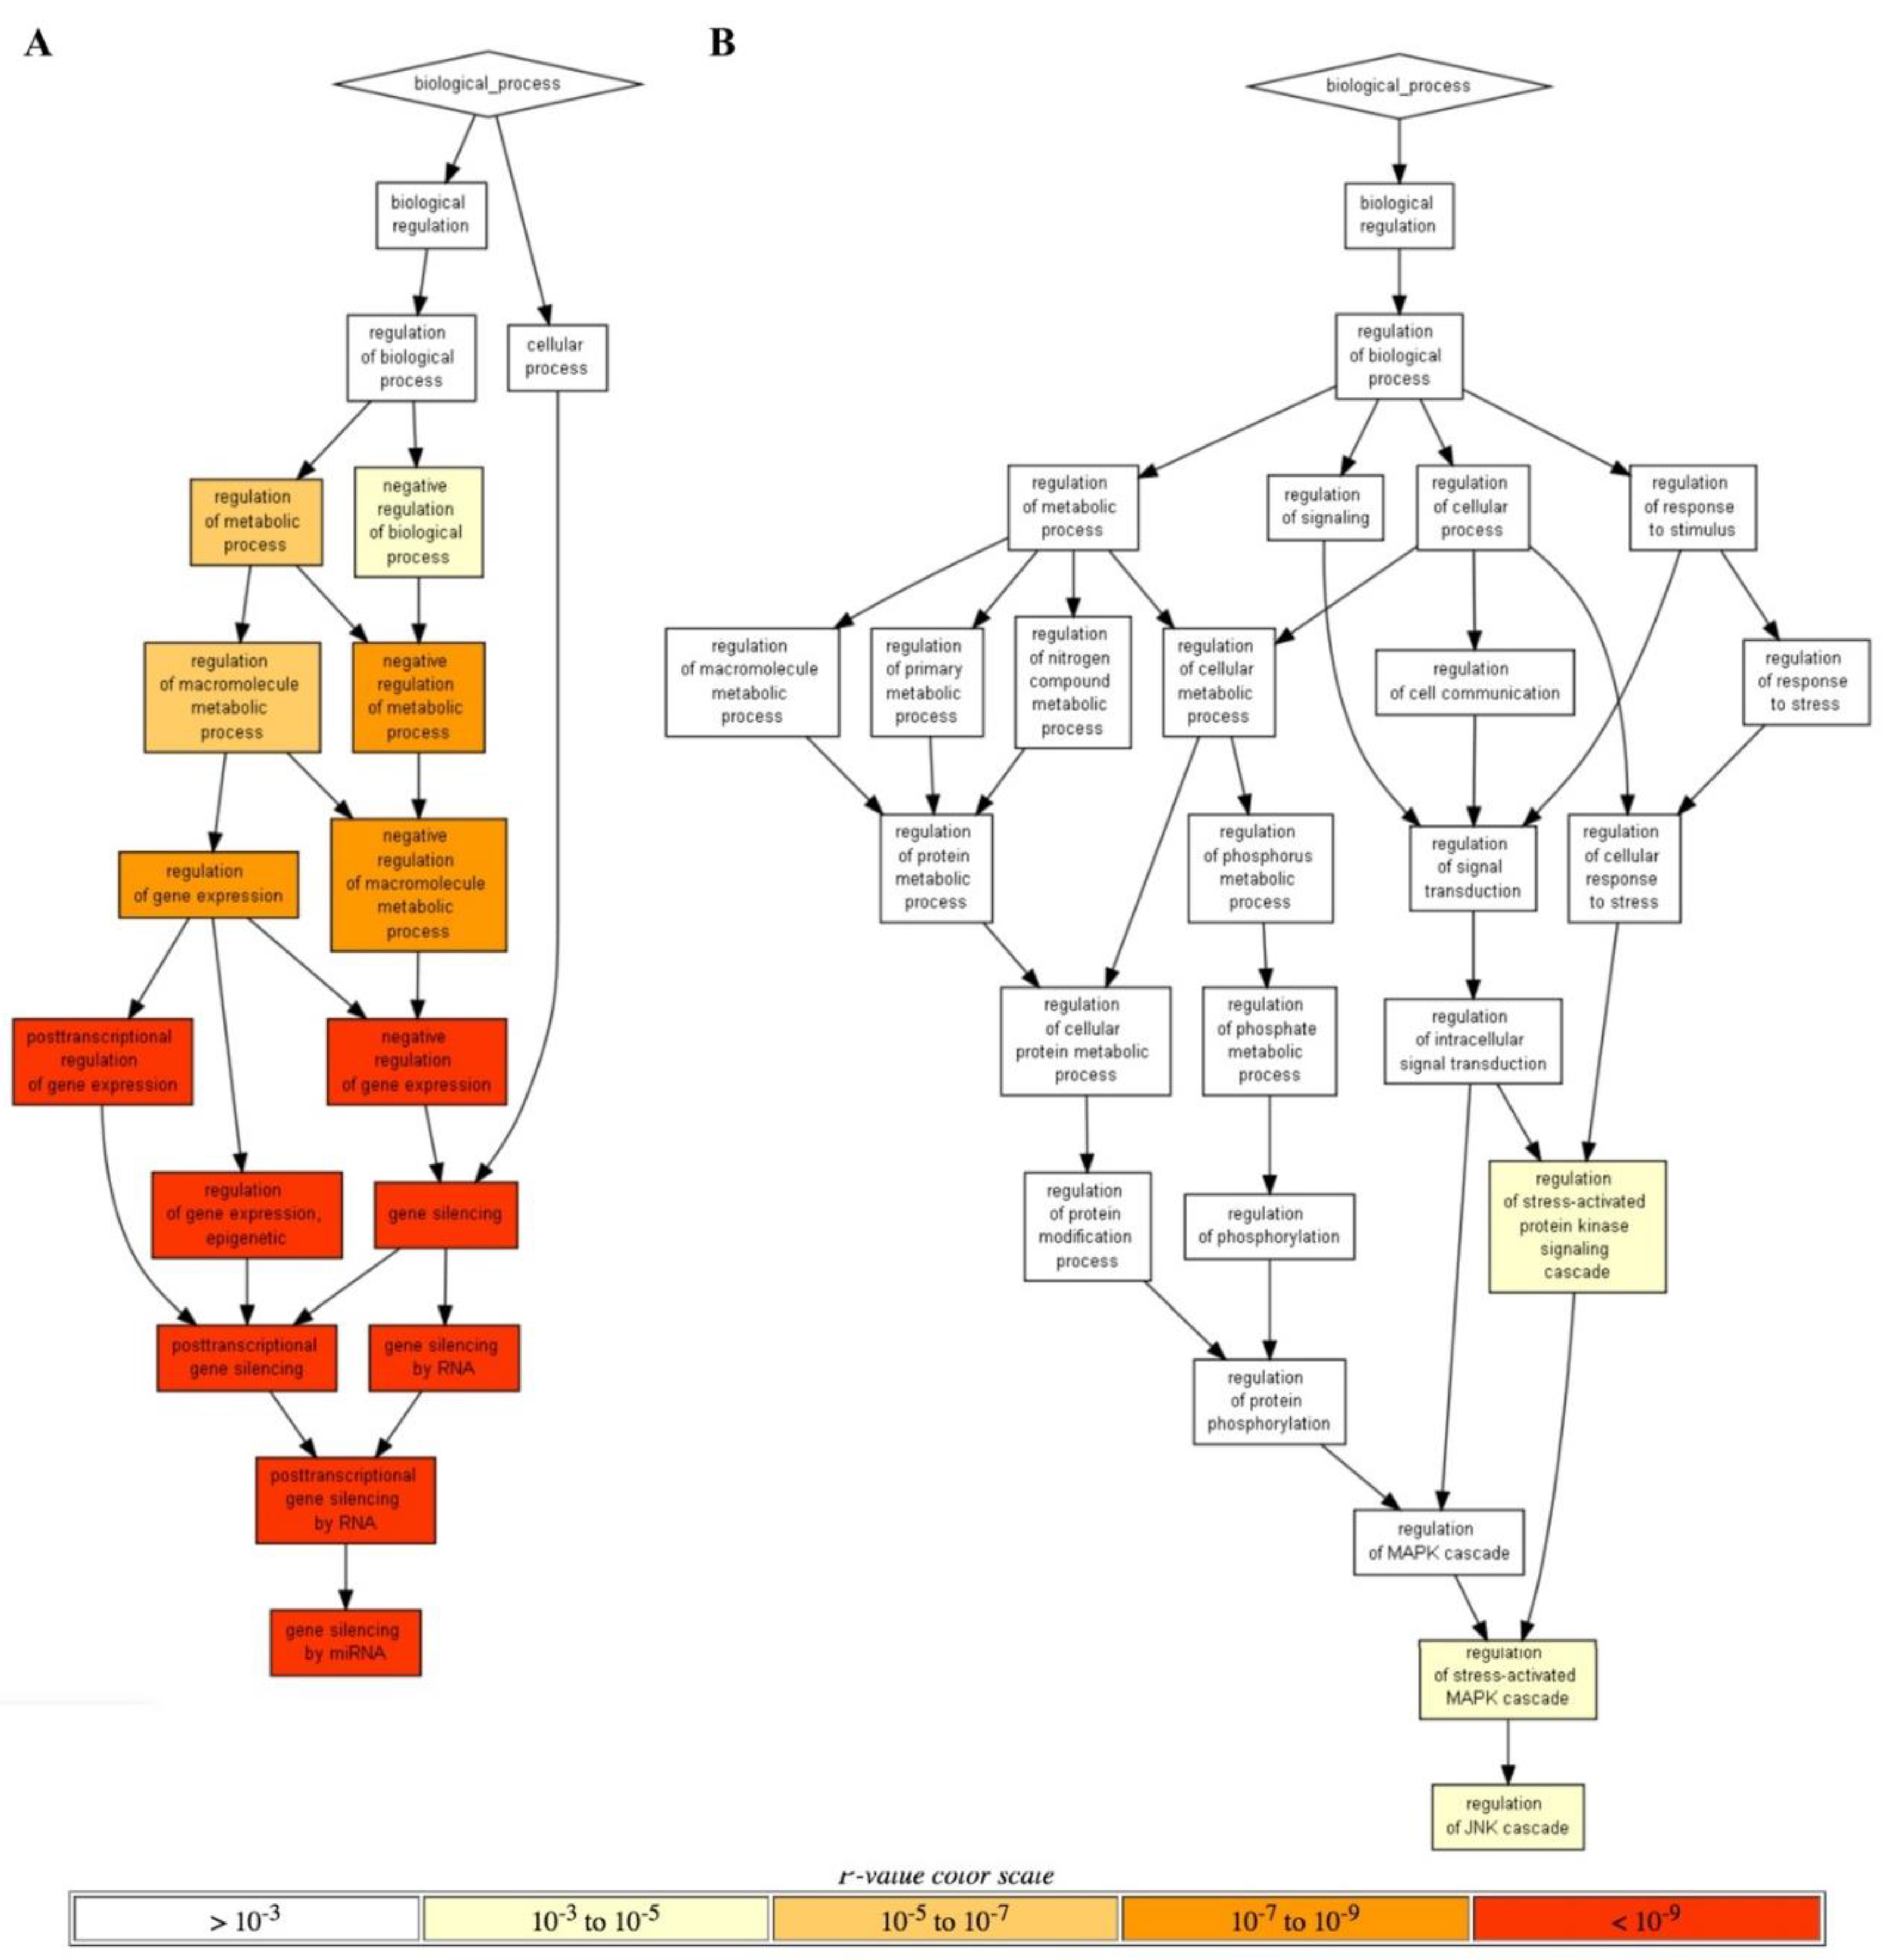
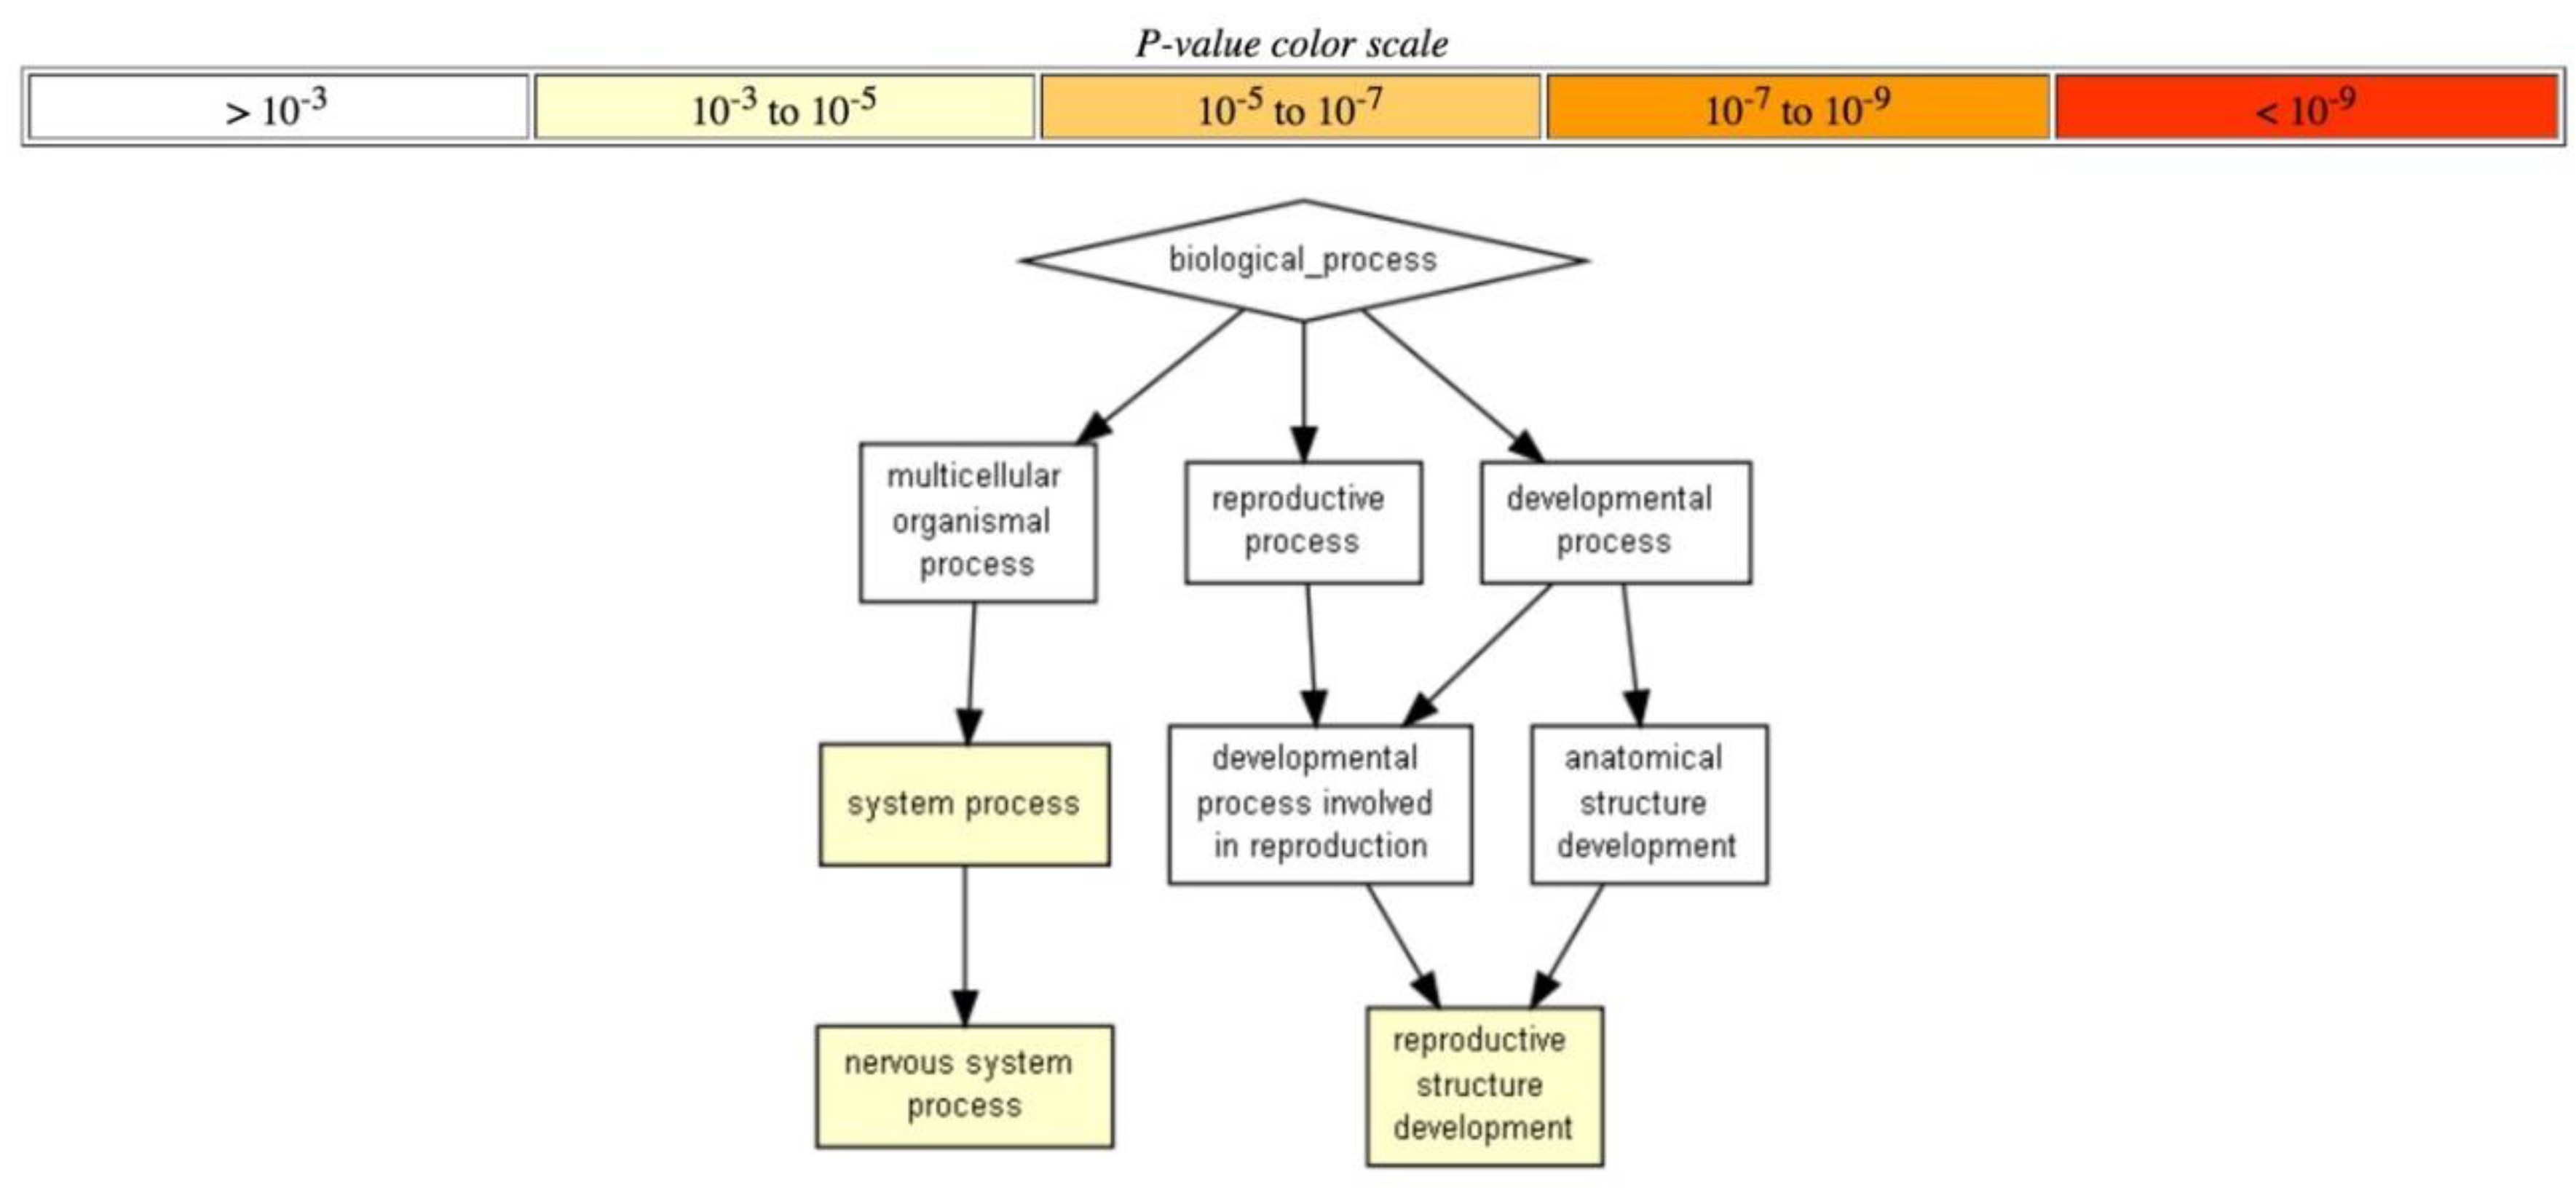
In addition, another line of GO data analysis performed using Gorilla software [64] returned only the annotation terms that could pass significantly more stringent threshold. In this way, a unique yet extremely strongly statistically significant RRE-enriched annotation cluster (p < 10−9; Figure 5A) was for gene silencing by microRNAs, whereas the top two RRE-deficient processes were for the Regulation of stress-activated MAPK cascade and Regulation of JNK cascade (p < 10−3; Figure 5B).
We next compared the microRNA (miR) contents of the RRE-enriched and -deficient gene sets (Table 5). The enriched group had 177 miR genes versus only 72 miR genes in the deficient group. Provided that the total content of miR genes in the human genome is 1865, a hypothesis can be accepted that the RRE-enriched group is also enriched in microRNA genes (p < 10−17) and that the RRE-deficient group is not enriched (p = 0.01). Similarly, the content of long non-coding RNA (lncRNA) genes also differed significantly among the gene sets (150 in the enriched versus only 18 in the deficient group; Table 5). With the total number of 1505 lncRNA genes in the human genome, this statistically supports the hypothesis that the RRE-enriched group is also enriched in lncRNA genes (p < 10−16) and that the RRE-deficient group is not enriched (p < 10−15). These findings clearly suggest that the regulation by RE-linked TFBS was particularly strongly recruited in the recent evolution of microRNA- and lncRNA-related mechanisms.

3.6. Characteristics of Top RRE-Enriched and Deficient Molecular Pathways (all REs)

We next examined the selected 156 top and 156 bottom molecular pathways sorted by RRE-enrichment as described above (shown in Supplementary file 10). As before, we manually curated the identified sets of molecular pathways and classified them into functional groups (Table 3).
The RRE-enriched pathways were connected with the metabolism of amino acids, vitamins, lipids, sulfur and carbohydrates, molecular transport, response to and production of hormones, detoxication and response to xenobiotics, sensory perception and neurotransmission, and fertilization. The RRE-deficient pathways were related to protein translation, intracellular signaling including cell adhesion and interaction, cell cycle progression and programmed cell death, metabolism of nucleic acids, general virus response mechanisms, and chromatin organization. These functional groups, accordingly, showed a remarkable overlap of ~74% of the mentioned items for the comparisons at the gene and pathway levels (Table 3).
As before, many [4] differential pathways dealt with immunity, thus showing differential trends depending on their functional roles. Consistently, with the gene level of data analysis, cellular immune response by T- and NK cells were RRE-enriched (Table 4). Other RRE-enriched immune pathways regulated blood clotting, innate immunity and autoimmunity mechanisms. The RRE-deficient pathways operated with the general inflammation mechanisms and with the activation of antigen-presenting cells by T-helpers.
The top five RRE-enriched and -deficient pathways sorted by NPII representing the above processes are shown in Figure 6.

3.7. Consensus Molecular Processes according to Gene- and Pathway- Based Assays (all REs)

Comparison of the results obtained at the gene and molecular pathway levels is outlined in 
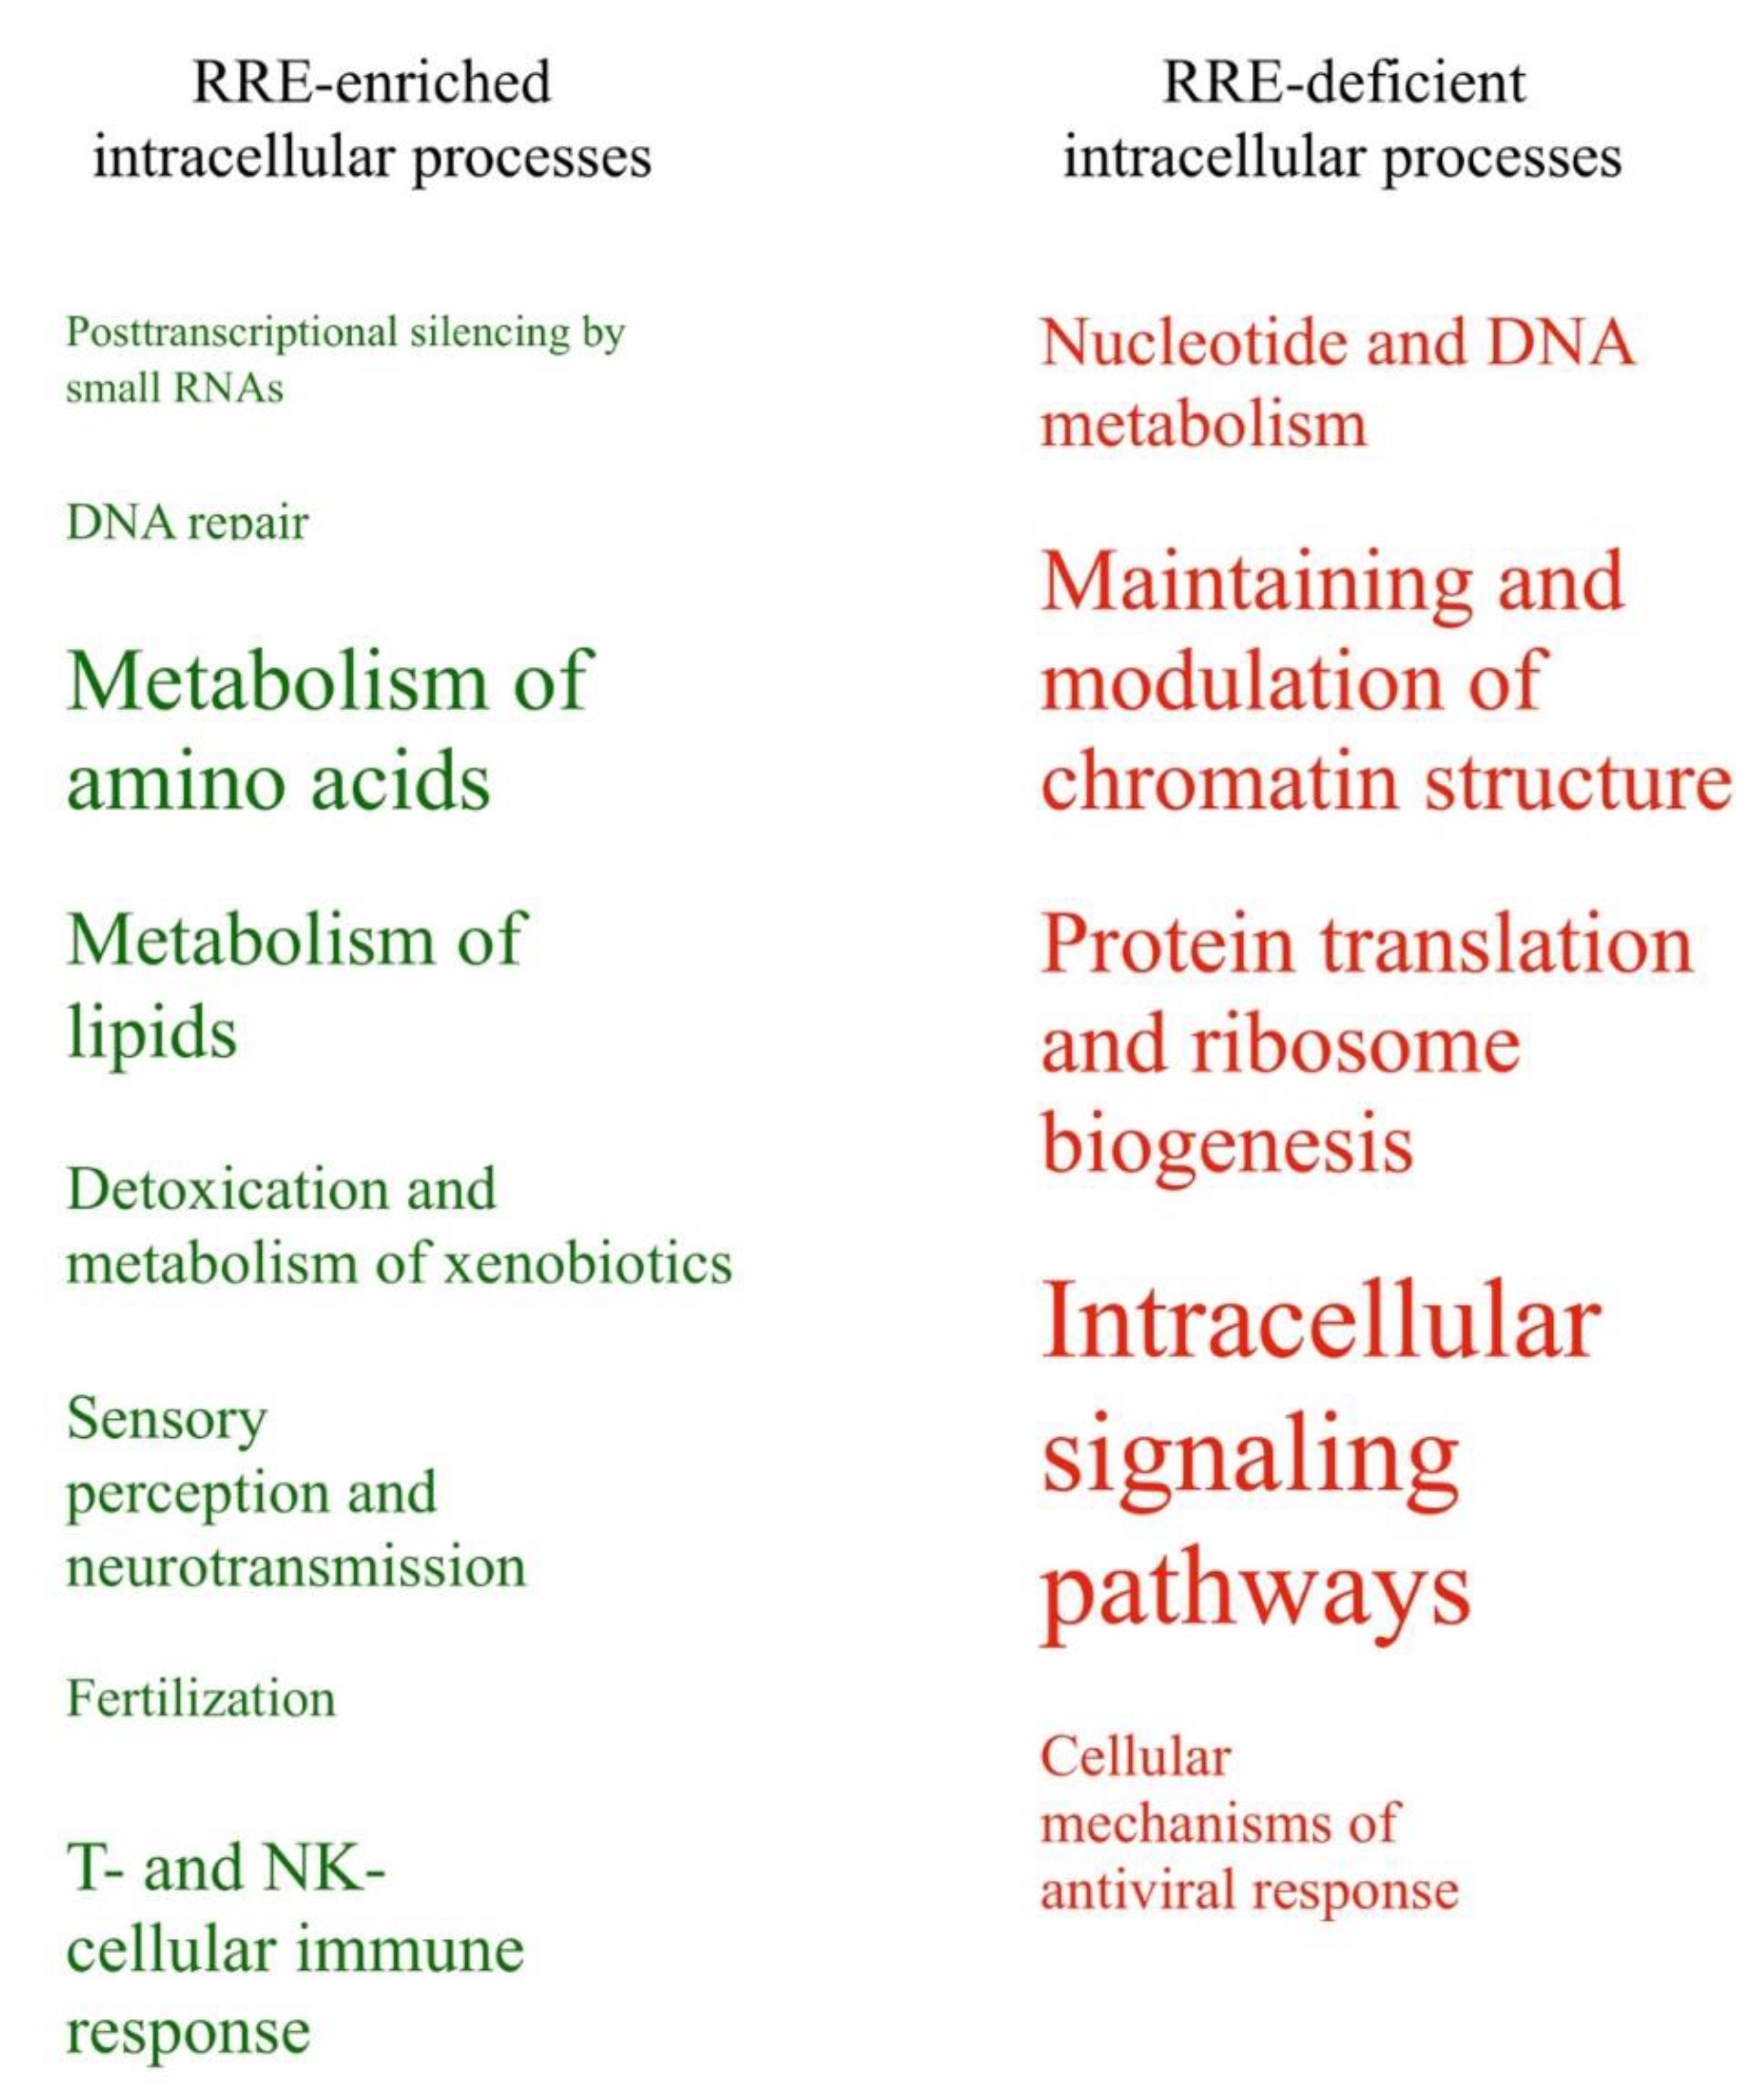
Table 3. As mentioned above, the results obtained using these two alternative methods were highly congruent. The following molecular processes showed consensus regulation patterns using both types of data analysis. Processes with the RRE-enriched regulation: (1) posttranscriptional silencing by small RNAs; (2) DNA repair; metabolism of (3) amino acids and (4) lipids; (5) detoxication and metabolism of xenobiotics; (6) sensory perception and neurotransmission; (7) fertilization; (8) T- and NK-cellular immune response.
More specifically, the posttranscriptional silencing by small RNAs (1) was represented by a single pathway and one GO term featuring gene regulation by microRNAs. Note also that according to GO analysis, the microRNA regulation was statistically the most strongly enriched cluster in the RRE-enriched subset. The content of microRNA and long non-coding (lnc) RNA genes in this subset was statistically also significantly enriched (p < 10−16).
The DNA repair (2) cluster was represented by the Protein kinase pathway in nonhomologous end joining and by the GO terms of Mitotic recombination, DNA synthesis involved in DNA repair, Meiosis, and Strand displacement.
The metabolism of amino acids (3) was represented by the pathways of D-arginine and D-ornithine metabolism, aspartate, asparagine, lysine, diphtamide, carnitine biosynthesis and cysteine, proline, hydroxyproline, beta-alanine, tryptophan and L-kynurenine catabolism, glutamate removal from folates, and conjugation of salicylate and benzoate with glycine. The GO terms were for the proline metabolic and tryptophan catabolic processes.
The metabolism of lipids (4) had pathways of bile secretion, bile salt and organic anion SLC transporters, fatty acids cycling pathway, acyl-CoA hydrolysis, alpha-linolenic acid metabolism, alpha-oxidation of phytanate, beta-oxidation of unsaturated fatty acids, lipoxin biosynthesis, ether lipid metabolism pathway, synthesis of (16–20)–hydroxyeicosatetraenoic, epoxyeicosatrienoic and dihydroxyeicosatrienoic acids, and phosphatidylinositol acyl chain remodeling pathway. The GO terms were for lipid catabolic process, carboxylic ester hydrolase activity, arachidonic acid metabolism, epoxygenase and monooxygenase activity, and lipase activity.
The detoxication and metabolism of xenobiotics (5) cluster included pathways of CYP2E1 reactions, drug metabolism by cytochrome P450, nicotine, heme and bupropion degradation, caffeine metabolism, flavin-containing monooxygenase (FMO) oxidation of nucleophiles, formaldehyde oxidation, S-reticuline metabolism, aflatoxin activation and detoxification. The GO terms were for cellular response to xenobiotic stimulus, xenobiotic metabolic process and epoxygenase P450 pathway.
The cluster of sensory perception and neurotransmission (6) processes has molecular pathways involved in olfactory signaling and transduction, visual signal perception via cones and GABA A (rho) receptor activation, dopamine receptors pathway and mechanism of acetaminophen activity, and toxicity pathway. The GO terms here were for the sensory perception of smell, odorant binding and olfactory receptor activity.
The fertilization (7) was represented by a unique pathway of interaction with the zona pellucida and by several GO terms: fertilization, sperm-egg recognition, sperm flagellum, positive regulation of sperm motility, binding of sperm to zona pellucida, and single fertilization.
The T- and NK-cellular immune response (8) pathways regulated the phosphorylation of CD3 and T-cellular receptor zeta chains, downstream signaling in naive CD8 T-cells (alpha, beta T-cell proliferation), and CD28 co-stimulation in T-cell homeostasis. The GO terms were for the regulation of leukocyte-mediated cytotoxicity, natural killer cell-mediated immunity and its regulation.
Finally, the processes with the RRE-deficient regulation were: (9) nucleotide and DNA metabolism; (10) maintenance and modulation of chromatin structure; (11) protein translation and ribosome biogenesis; (12) intracellular signaling pathways; and (13) cellular mechanisms of antiviral response.
Here, the nucleotide and DNA metabolism (9) pathways controlled adenine and adenosine salvage, cleavage of the damaged purines, UMP biosynthesis, UDP-N-acetyl-D-galactosamine biosynthesis, GDP-L-fucose biosynthesis from GDP-D-mannose, and NADH repair. The GO terms were found for ATP metabolism, adenine transport, GTP binding, purine nucleosides and ribonucleotides metabolism, and pyrimidine binding.
The maintenance and modulation of chromatin structure (10) clade comprised pathways of PRC2 methylation of histones and DNA, HDACs histone deacetylation, arginine methyltransferases (RMTs) methylation of histone arginine residues, G2/M DNA damage checkpoint, and HDAC proteasomal degradation. The GO terms were found for the CENP-dependent centromere formation, for telomere formation and capping, lamin binding with chromatin, purine NTP-dependent helicase activity, histone exchange, histone lysine H3-K4 and H3-K9 methylation, acetylation and deacetylation, and for signal transduction in response to DNA damage.
The protein translation and ribosome biogenesis (11) pathways account for ribosomal and transfer RNA transcription, processing including RNA modifications such as wybutosine and 7-3-amino-3-carboxypropyl-wyosine biosynthesis, spliceosomal biogenesis and assembly, ribosomal assembly, tRNA aminoacetylation, ribosomal scanning, initiation, elongation and termination of translation for nonsense mediated decay. The identified GO terms fully functionally matched these molecular pathways.
The intracellular signaling pathways (12) formed the biggest group of molecular processes including 94 various pathways and 48 GO terms. These included all major aspects of human intracellular signaling (Table 3).
The cellular mechanisms of antiviral response (13) included pathways of host cell interaction with retroviruses, including APOBEC3-mediated resistance to HIV-1 infection. The GO terms were related to the assembly of viral capsids, viral transcription and translation, and IRES-dependent and cap-independent viral translational initiation.
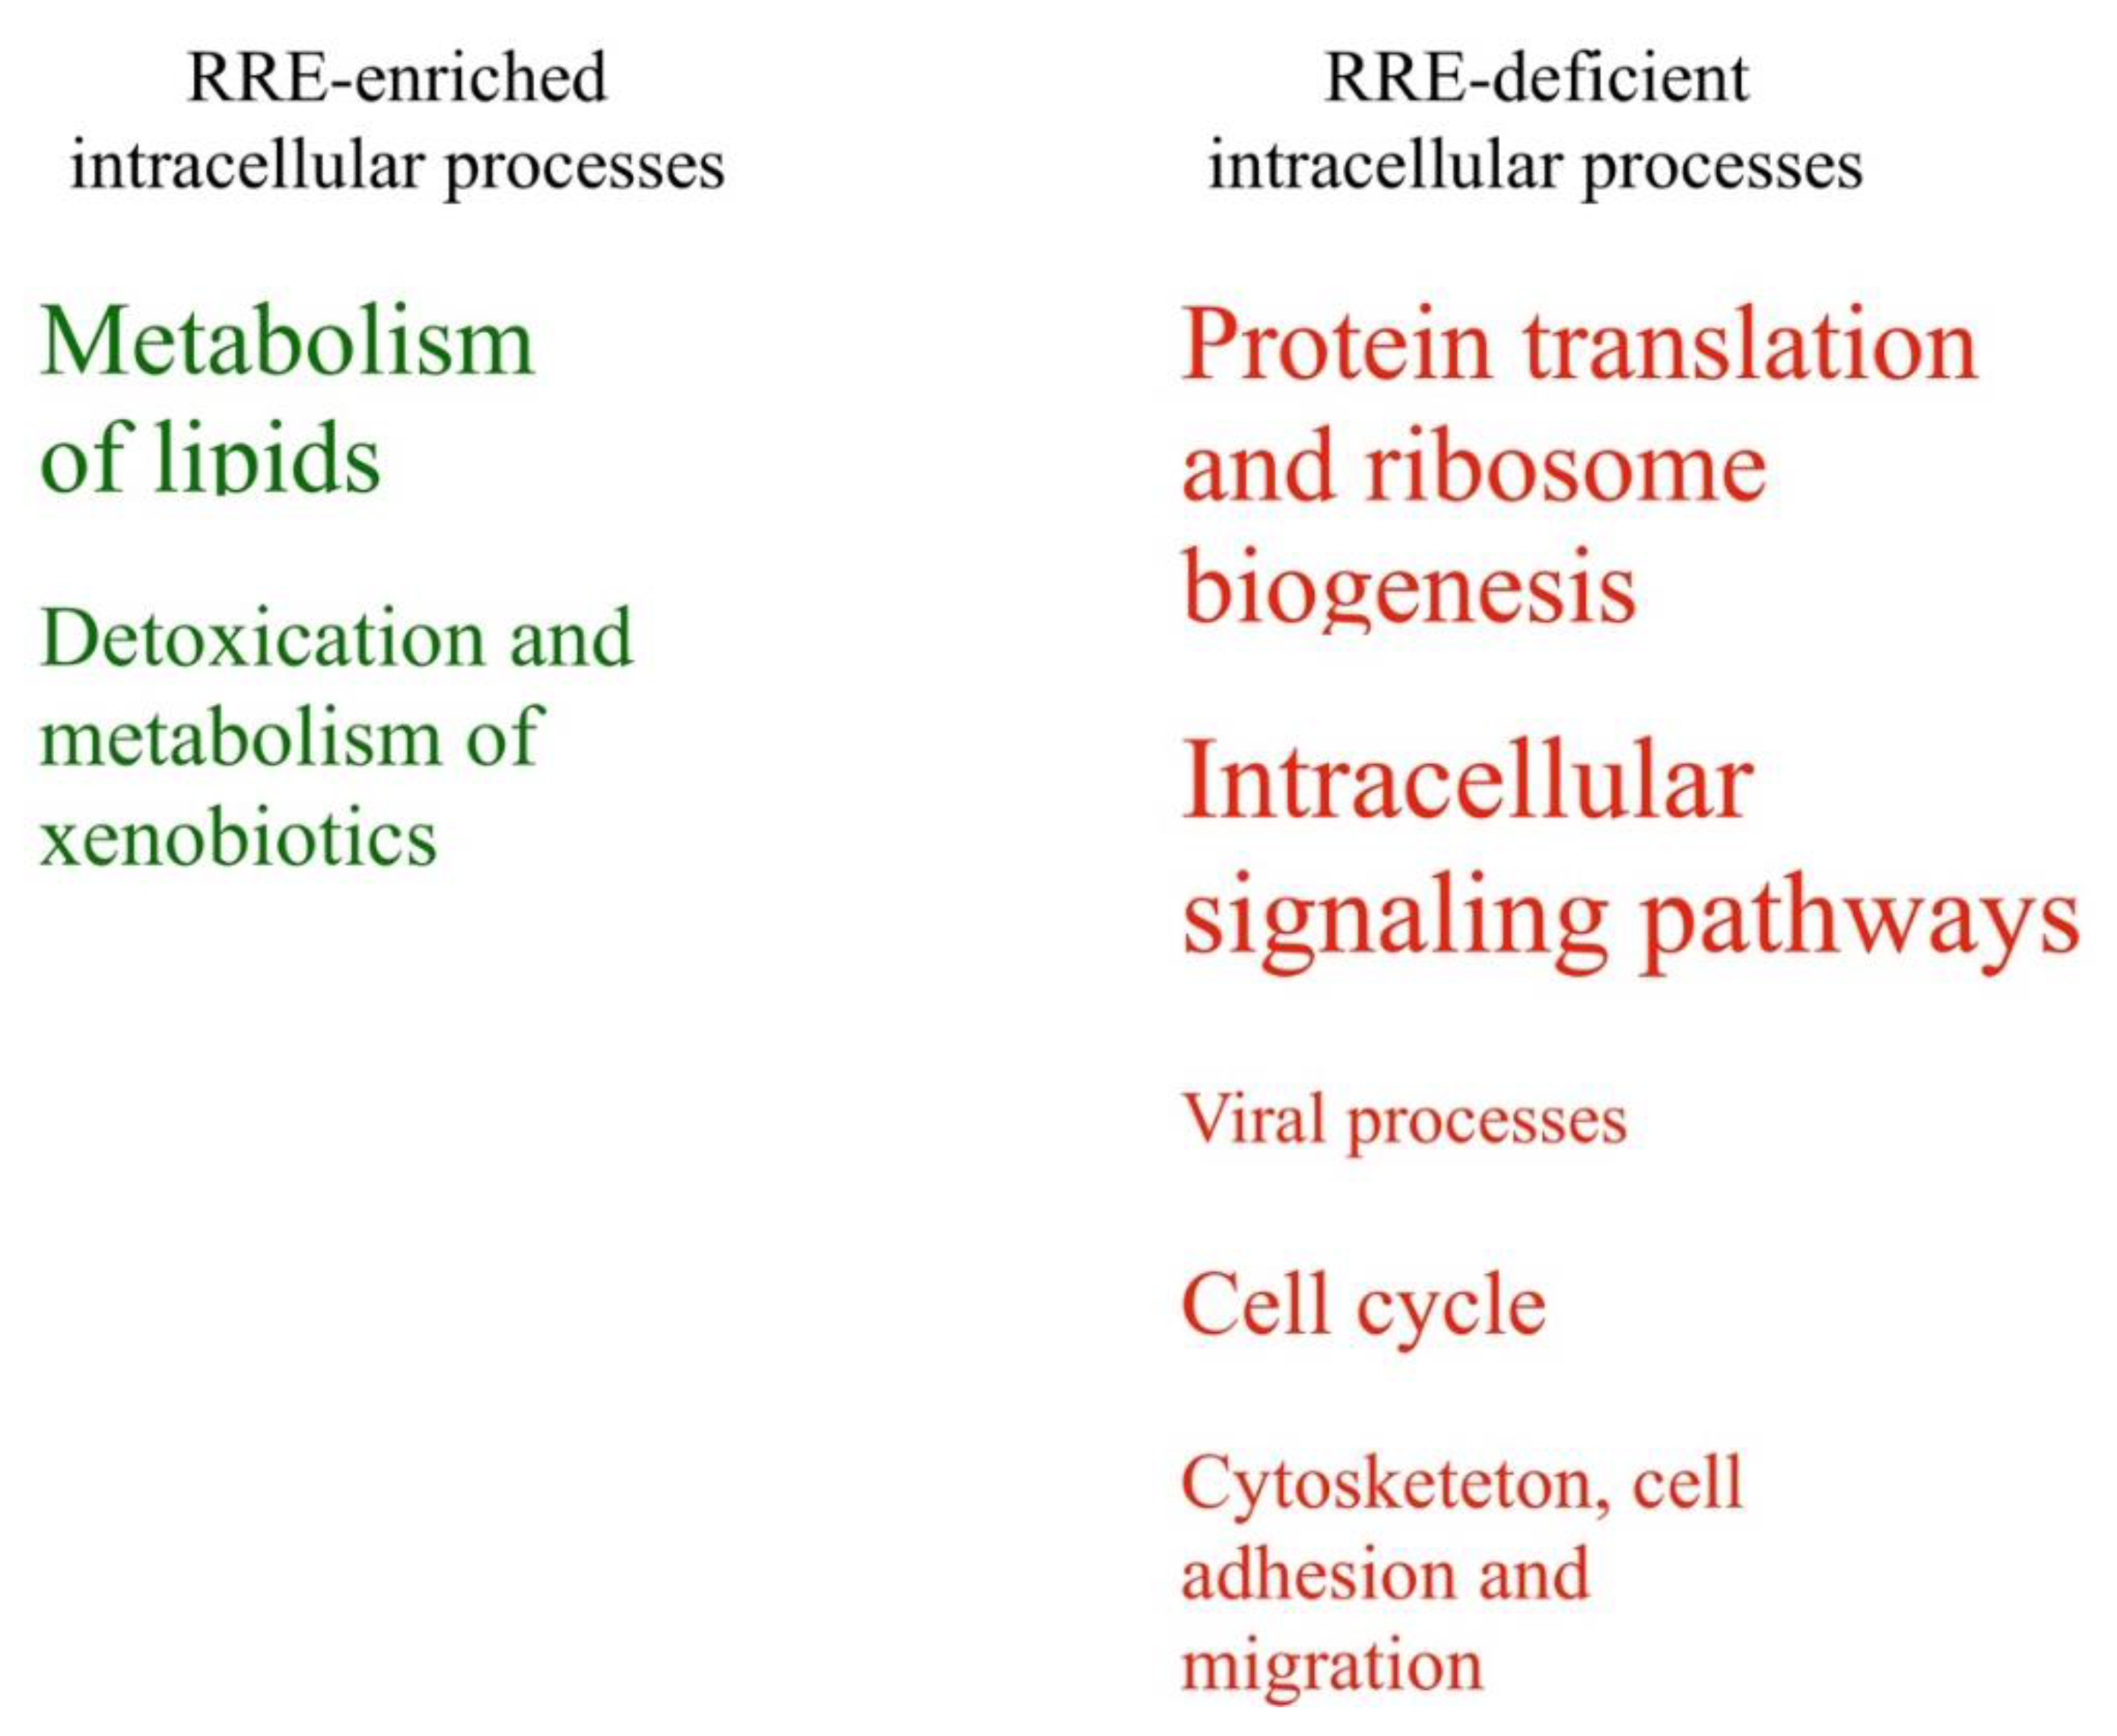
All these categories were represented by different numbers of enclosed pathways and GO terms (Table 3). Schematically, these processes linked with enriched or deficient RRE-regulation are shown in Figure 7 in relation with the number of enclosed features. Fourteen other groups of processes (50%) were identified as either RRE-enriched or deficient using only one of the methods used (either gene- or pathway-based), and only one group (~4% of the total amount of groups considered) for the metabolism of carbohydrates showed ambiguous trends in these two types of analyses (Table 3).

3.8. Randomness Test of GRE and NGRE-Based Data

In order to assess the confidence of the observed patterns of RE-impacted intracellular processes, we generated 500 random permutations, averaged across cell lines, of GRE and NGRE value sets for all genes tested by randomly rearranging gene names. For each iteration, we created a GRE-NGRE scatter plot and extracted 1219 top and 1219 bottom genes as described above. Next, we analyzed these randomly generated gene sets using DAVID software, and top-100 GO terms were selected by the lowest p-value for each random permutation. Finally, we compared the distribution of p-values for the real and random gene sets (Figure 8A for RRE-enriched and Figure 8B for RRE-deficient genes). This randomness analysis showed that the RRE-deficient molecular processes identified here are nonrandom, because random and real distributions did not intersect (Figure 8B). Interestingly, a major part of RRE-enriched GO-terms overlapped with the random distribution (Figure 8A), although there was a specific peak of outstandingly non-random 10 GO terms among the RRE-enriched items, which had smaller p-values than each of the random items in 500 permutations. Since none of the 500 random permutations generated GO-terms with p-values lower than those observed for the real RRE-enriched or RRE-deficient genes, the overall q-values of confidence for both groups were smaller than 0.002, which indicates high confidence level of the molecular processes identified.

3.9. Functional Characteristics of Top RRE-Enriched and Deficient Genes (Evolutionary Young REs)

Similarly, we analyzed the top RRE-enriched and deficient molecular processes by using the fraction of evolutionary young human retrotransposons. We first identified the top 673 RRE-enriched and 673 RRE-deficient genes. A smaller number of top genes compared to all REs was taken because only 44% of genes had non-zero GRE scores and could be properly analyzed. For the genes selected, we performed GO analysis using DAVID software. The data on the top GO annotation clusters with a p-value of <0.05 are shown in Supplementary dataset 12. In total, 55 GO annotation terms were identified for the RRE-enriched genes, versus as much as 730 (~13 times more) terms for the fraction of RRE-deficient genes. As in the case of all REs, there were more evolutionary conserved than quickly evolving intracellular molecular processes identified.
We manually curated the identified annotation terms and classified them into 24 major groups (Table 6). Similarly to all REs, the significantly RRE-enriched groups were connected with sensory perception and neurotransmission, immune system, metabolism of lipids, detoxication, and response to xenobiotics. The RRE-deficient groups of processes were also generally in line with all REs and included protein translation, RNA transcription, intracellular signaling, cell adhesion and interaction, cell cycle progression, programmed cell death, metabolism of nucleic acids and carbohydrates, protein modifications, stress response and processes interfering with viral life cycle, maintaining chromatin organization, oxidative phosphorylation, and mitochondrial functioning. Immunity processes had contradictory trends and were represented by 15 annotation terms (Table 7).
Alternative analysis using Gorilla software showed that only RRE-deficient genes were organized into a distinct network (processes of nervous system and reproductive organs development), whereas no statistically significant processes were found for RRE-enriched genes at the level of confidence p < 10−3. Figure 9).

3.10. Characteristics of Top RRE-Enriched and Deficient Molecular Pathways (Evolutionary Young REs)

Results of analysis and manual curation (Table 6) of the top 152 RRE-enriched and 152 RRE-deficient molecular pathways for evolutionary young REs (shown in Supplementary file 13) were congruent with the results for all REs.
The RRE-enriched pathways featured the metabolism of amino acids, polyamines, vitamins, lipids, sulfur and carbohydrates, molecular transport of small molecules, detoxication and response to xenobiotics, blood clotting, cell cycle progression, and cell death. The RRE-deficient pathways, in turn, related to protein translation and maturation, intracellular signaling including cell adhesion and interaction, cell cycle progression and programmed cell death, metabolism of nucleotides and nucleic bases, amino acids, polyamines, lipids, carbohydrates, and virus life cycle mechanisms. Overlap of processes at the level of genes (GO terms analysis) and pathways was ~50%, that is lower than in the case of all REs (Table 3, Table 6).
Unexpectedly, the same groups of immunity processes were identified for RRE-enriched and deficient pathways: those linked with innate immunity, T-cell mediated immunity and inflammation. In the first two groups, more pathways were RRE-enriched than RRE-deficient (Table 7).

3.11. Consensus Molecular Processes according to Gene- and Pathway- Based Assays (Evolutionary Young REs)

We compared RRE-enriched and deficient groups of processes identified using Gene Ontology terms and molecular pathway analysis (Table 6, Table 7 and Figure 10). The following RRE-enriched processes were identified by evolutionary young REs: (1) metabolism of lipids, (2) detoxication and metabolism of xenobiotics. The processes with the RRE-deficient regulation were: (3) cell cycle; (4) cytoskeleton, cell adhesion and migration; (5) protein translation and ribosome biogenesis; (6) intracellular signaling pathways; and (7) processes of viral life cycle.
The compositions of these groups are identical to those observed for all REs, except for a new RRE-deficient group “cytoskeleton, cell adhesion and migration”. It included pathways of cell adhesion, cell-cell junction, cell migration, myoblast fusion, and actin cytoskeleton reorganization.
All these groups were supported by different numbers of activated pathways and GO terms (Table 6). Schematically, these intracellular processes linked with enriched or deficient RRE-regulation by evolutionary young REs and are shown in Figure 10 in relation to the number of features. Twelve other groups of processes (50%) were identified as ambiguously being RRE-enriched or deficient using only one of the methods used (either gene- or pathway-based), and four groups (~17% of the total amount of groups considered) showed ambiguous trends in both methods (Table 6). Analysis of immunity consensus processes also did not reveal concordant trends by GO and pathway analysis (Table 7).

4. Discussion

In this study, for the first time, we combined two independent types of data analysis to identify the molecular processes impacted by the RE-linked TFBS regulation in 13 cell lines representing eight human tissues, on two different evolutionary time scales. The gene level analysis was performed by classifying Gene Ontology (GO) annotation features, and the pathway level analysis was done by interrogating a high-throughput Oncobox molecular pathway database. These approaches identified different sets of molecular processes being either enriched or deficient in the RE-linked TFBS regulation. Based on RE families’ mean divergence from the respective consensus sequences, we set two different evolutionary time scales for this type of analysis. First, at the level of mammalian radiation (reflected by all REs), and second, at the level of radiation of human ancestry and New-World monkeys (reflected by evolutionary young REs). Of them, for all REs, 13 types of processes (46%) coincided for the two types of analysis and 14 processes (50%) were specific for only one of the above methods used. One process (4%) had contradictory trends at the gene and pathway levels. The consensually regulated processes were RRE-enriched: posttranscriptional silencing by small RNAs, DNA repair, metabolism of amino acids and lipids, detoxication and metabolism of xenobiotics, sensory perception and neurotransmission, fertilization, and T- and NK-cellular immune response. The RRE-deficient processes were related to: nucleotide and DNA metabolism, maintenance and modulation of chromatin structure, protein translation and ribosome biogenesis, intracellular signaling pathways, and cellular mechanisms of antiviral response.
At more recent evolutionary scale, only eight processes (33%) showed congruent results for the two approaches used, whereas most of the processes had ambiguous trends. These results most likely suggest that the method of RRE-analysis used here has different utility for the different evolutionary time scales. For the deeper evolutionary horizon (mammalian radiation), the results were more robust and reproducible than for the fleet horizon (human–New-World monkeys radiation).
The molecular pathways investigated here represent processes that are cumulatively differentially impacted at the level of gene expression regulation by retrotransposons. Retrotransposons are considered pacemakers of eukaryotic genome evolution [9] and were shown to be the major source of transcription factor binding sites (TFBS) for the mammalian DNA [1, 5, 7]. SNPs and nucleotide substitutions mediate continuous but relatively slow changes in the mammalian genetic landscapes [65]. In contrast, insertion of a retrotransposon has potential to dramatically transform the genomic background by immediately providing a totally new sequence of up to 10 kb long, which is non-homologous and non-orthologous to the pre-integration locus as in the case of human REs [66]. These newcomer elements contain numerous functional TFBS that can donate to a new genetic neighborhood, including genes [67]. Moreover, following mutations and epigenetic landmarks can further transform these TFBS profiles, thus enhancing the evolution of gene regulation [24]. A higher proportion of RE-linked TFBS, therefore, can be considered a marker of faster evolution of gene regulation, and vice versa. Our data, therefore, point to the genes and molecular processes that can be regarded as having especially high or especially low rates of evolution in terms of gene expression regulation on different evolutionary time scales.
In many aspects, our results concerning the regulatory evolution of human molecular pathways are congruent with the previous findings obtained using different methods. For example, the processes of ribosome biogenesis and protein synthesis, as well as nucleotide and DNA metabolism, are highly evolutionary conserved in all domains of life [68,69]. Here, we showed that the regulatory evolution rate of these processes in human lineage is also relatively slow. Contrarily, the regulatory networks of DNA repair evolve quickly according to our results, which is in accord with high redundancy and promiscuity of DNA repair enzymatic systems [70] that need to be tightly regulated especially in long-living organisms to prevent proliferative disorders [71]. We show that the evolution of immune response shows contradictory trends: T- and NK-cellular immune responses (intercellular antiviral response) are evolving rapidly, whereas the mechanisms of intracellular antiviral defense are changing slowly. This pattern is in line with the previous finding that cellular immune response to viruses (especially adaptive T-cell mediated response) is a more recent evolutionary innovation [72]; its regulatory evolution, therefore, can go faster. Similarly, the regulation of amino acids and lipids metabolism also changes relatively quickly, which can relate to changes in nutritional adaptation during evolution [69]. An extremely fast evolutionary signature was observed for the mechanisms of posttranscriptional silencing by small RNAs. This silencing is a primary mechanism repressing newly integrated REs and other intracellular pathogens [73]. Its regulatory networks are permanently evolving, reflecting an intragenome evolutionary arms race between host genes, REs and invasive pathogens.
Here, we investigated the gene regulatory evolution features at the level of transcription factor binding sites. However, targeted profiling of the additional functional landmarks of the human genome such as covalent histone modifications, DNA methylation and nucleosome positioning, can provide further avenues for studying the regulatory potential and evolutionary impact of transposable elements. Regulation by histone modification can be activating and repressive; therefore, the investigation of RE-driven regulatory evolution for different histone marks could provide a complex and integrative pattern of epigenetic evolution. Another direction of future works could be the comparison of molecular evolution at the level of gene regulation (such as studied in this report) with the evolution of the gene/protein structure. Moreover, these exploratory approaches could be applied to a broad number of model organisms not limited to mammalian or vertebrate species. The feasibility of using the same computational approach in various organisms depends on (i) availability of epigenomic data such as of TFBS and histone modification sites and on (ii) knowledge of molecular pathways in the organisms under investigation. For example, we presume that human molecular pathways can be used only for closely related species such as higher primates. Certain modifications of the pathway contents may expand their utility also on the other mammalian species. For example, we expect that the investigation of mouse regulatory evolution in comparison to humans will be possible only when orthologous genes will be considered. The analysis of more distantly related organisms such as zebrafish, drosophila or Arabidopsis, would, therefore, require revision of molecular pathway databases in addition to complete sets of epigenomic data.
The current computational approach has an important limitation: its resolution of evolutionary time is relatively low, concerning here only two key points (radiation of New World monkeys and radiation of major eutherian clades). Future research can improve time-precision by considering more evolutionary important events, that can be selected individually for the different species. Comparative analysis of the same evolutionary horizon (such as the origin of Amniotes) for two or more species could provide new insights into our understanding of molecular determinants governing phenotypic macroevolution. Furthermore, the concept of regulatory evolutionary clock (or, shortly, regulatory clock) can be tested in the future by comparing scores of RE regulatory load for multiple organisms with established dates of evolutionary divergence. Another limitation of our approach can be the simultaneous interrogation of many different TFs (here we investigate DNA binding patterns of 563 TFs) to calculate one characteristic value for each gene. Further research concerning TFs grouped by tissue specificity and mechanism of action can provide a more detailed view of RE-directed evolution. Finally, we believe that further applications of the analytic approach discovered here for various model organisms will shed light on the general evolution of eukaryotic regulatory networks.

5. Conclusions

In this study, we extracted human molecular processes undergoing a relatively fast and slow evolution of their transcriptional regulation under the impact of newly integrating REs. Processes were identified for different evolutionary timescales: (1) radiation of New World monkeys and (2) radiation of major eutherian clades. The most quickly evolving processes were concerning gene regulation by noncoding RNAs including microRNAs, olfaction, color vision, fertilization, T- and NK-cellular immune response, amino acids and fatty acids metabolism, and detoxication. Groups of the relatively slow regulatory evolution were connected with protein biosynthesis, RNA transcription and processing, nuclear chromatin organization, and intracellular molecular signaling. Finally, we propose a quantitative measure of the rate of regulatory evolution that can be calculated reproducibly in different organisms.

Supplementary Materials

The following are available online at https://www.mdpi.com/2073-4409/8/2/130/s1.
Supplementary file 1—mathematical description of proposed calculation of RE-linked TFBS regulatory impact on human genes and molecular pathways.
Supplementary file 2—the list of transcription factors investigated here and raw ENCODE data files for each cell line.
Supplementary file 3—pairwise correlation for GRE and NGRE and numbers of transcription factors investigated in each cell line.
Supplementary file 4—pairwise correlation for PII and NPII and numbers of transcription factors investigated in each cell line.
Supplementary file 5—overall data analysis pipeline used in current study.
Supplementary file 6—the distribution of TFBS hits for the different transcriptional factor proteins varied among the different cell lines. Color scale shows depth of TFBS mapping; blank spaces mean absence of TFBS data for the respective transcriptional factor in the context of a given cell line in ENCODE dataset.
Supplementary file 7—the gene RE-linked TFBS absolute and normalized enrichment scores GRE and NGRE, respectively.
Supplementary file 8—the molecular pathway RE-linked TFBS absolute and normalized enrichment scores PII and NPII, respectively.
Supplementary file 9—RRE-enriched and RRE-deficient genes.
Supplementary file 10—manually classified RRE-enriched and RRE-deficient molecular pathways for all REs.
Supplementary file 11—manually classified RRE-enriched and RRE-deficient GO terms for all REs.
Supplementary file 12—manually classified RRE-enriched and RRE-deficient GO terms for evolutionary young REs.
Supplementary file 13—manually classified RRE-enriched and RRE-deficient molecular pathways for evolutionary young REs.

Author Contributions

DN participated in all types of data analysis and wrote the manuscript, DP wrote code to analyze the data and edited the manuscript, AB generated overall concept, proposed analytic pipeline and wrote the manuscript. AG, MS, AM, NG, PB and AP generated concept of this study, created and annotated databases of molecular pathways and edited the manuscript. VT wrote protocols and performed cloud computing calculations.

Funding

This work was supported by the Russian Science Foundation grant no. 18-15-00061.

Acknowledgments

This work was supported by Amazon and Microsoft Azure grants for cloud-based computational facilities. We thank Oncobox/OmicsWay research program in machine learning and digital oncology for software and pathway databases for this study. Financial support was provided by the Russian Science Foundation grant no. 18-15-00061.

Conflicts of Interest

The authors declare that they have no competing interests.

References

  1. Lander, E.S.; Linton, L.M.; Birren, B.; Nusbaum, C.; Zody, M.C.; Baldwin, J.; Devon, K.; Dewar, K.; Doyle, M.; FitzHugh, W.; et al. Initial sequencing and analysis of the human genome. Nature 2001, 409, 860–921. [Google Scholar] [PubMed]
  2. Kazazian, H.H., Jr.; Moran, J.V. Mobile DNA in Health and Disease. New Engl. J. Med. 2017, 377, 361–370. [Google Scholar] [CrossRef] [PubMed]
  3. Chuong, E.B.; Elde, N.C.; Feschotte, C. Regulatory evolution of innate immunity through co-option of endogenous retroviruses. Science 2016, 351, 1083–1087. [Google Scholar] [CrossRef] [PubMed]
  4. Feschotte, C. Transposable elements and the evolution of regulatory networks. Nat. Rev. Genet. 2008, 9, 397–405. [Google Scholar] [CrossRef] [PubMed]
  5. Suntsova, M.; Garazha, A.; Ivanova, A.; Kaminsky, D.; Zhavoronkov, A.; Buzdin, A. Molecular functions of human endogenous retroviruses in health and disease. Cell. Mol. Life Sci. 2015, 72, 3653–3675. [Google Scholar] [CrossRef] [PubMed]
  6. ENCODE Project Consortium. An integrated encyclopedia of DNA elements in the human genome. Nature 2012, 489, 57–74. [Google Scholar] [CrossRef] [PubMed]
  7. Cordaux, R.; Batzer, M.A. The impact of retrotransposons on human genome evolution. Nat. Rev. Genet. 2009, 10, 691–703. [Google Scholar] [CrossRef]
  8. Thompson, D.; Regev, A.; Roy, S. Comparative analysis of gene regulatory networks: From network reconstruction to evolution. Annu. Rev. Cell Dev. Biol. 2015, 31, 399–428. [Google Scholar] [CrossRef]
  9. Cheatle Jarvela, A.M.; Hinman, V.F. Evolution of transcription factor function as a mechanism for changing metazoan developmental gene regulatory networks. EvoDevo 2015, 6, 3. [Google Scholar] [CrossRef]
  10. Albert, F.W.; Kruglyak, L. The role of regulatory variation in complex traits and disease. Nat. Rev. Genet. 2015, 16, 197–212. [Google Scholar] [CrossRef]
  11. Doucet-O'Hare, T.T.; Sharma, R.; Rodić, N.; Anders, R.A.; Burns, K.H.; Kazazian, H.H., Jr. Somatically Acquired LINE-1 Insertions in Normal Esophagus Undergo Clonal Expansion in Esophageal Squamous Cell Carcinoma. Hum. Mutat. 2016, 37, 942–954. [Google Scholar] [CrossRef] [PubMed]
  12. Badge, R.M.; Alisch, R.S.; Moran, J.V. ATLAS: A system to selectively identify human-specific L1 insertions. Am. J. Hum. Genet. 2003, 72, 823–838. [Google Scholar] [CrossRef] [PubMed]
  13. Villar, D.; Flicek, P.; Odom, D.T. Evolution of transcription factor binding in metazoans - mechanisms and functional implications. Nat. Rev. Genet. 2014, 15, 221–233. [Google Scholar] [CrossRef] [PubMed]
  14. Varriale, A. DNA methylation, epigenetics, and evolution in vertebrates: Facts and challenges. Int. J. Evol. Biol. 2014, 475981. [Google Scholar] [CrossRef] [PubMed]
  15. Zhong, X. Comparative epigenomics: A powerful tool to understand the evolution of DNA methylation. New Phytol. 2016, 210, 76–80. [Google Scholar] [CrossRef] [PubMed]
  16. Kato, T.; Iwamoto, K. Comprehensive DNA methylation and hydroxymethylation analysis in the human brain and its implication in mental disorders. Neuropharmacology 2014, 80, 133–139. [Google Scholar] [CrossRef] [PubMed]
  17. Meier, K.; Brehm, A. Chromatin regulation: How complex does it get? Epigenetics 2014, 9, 1485–1495. [Google Scholar] [CrossRef]
  18. Turner, B.M. Nucleosome signalling; An evolving concept. Biochim. Biophys. Acta 2014, 623–626. [Google Scholar] [CrossRef]
  19. Maleszka, R.; Mason, P.H.; Barron, A.B. Epigenomics and the concept of degeneracy in biological systems. Brief Funct Genomics. Brief. Funct. Genom. 2014, 13, 191–202. [Google Scholar] [CrossRef]
  20. Royer-Bertrand, B.; Rivolta, C. Whole genome sequencing as a means to assess pathogenic mutations in medical genetics and cancer. Cell. Mol. Life Sci. 2014, 72, 1463–1471. [Google Scholar] [CrossRef]
  21. Mundade, R.; Ozer, H.G.; Wei, H.; Prabhu, L.; Lu, T. Role of ChIP-seq in the discovery of transcription factor binding sites, differential gene regulation mechanism, epigenetic marks and beyond. Cell Cycle 2014, 13, 2847–2852. [Google Scholar] [CrossRef] [PubMed]
  22. Kapitonov, V.V.; Jurka, J. A universal classification of eukaryotic transposable elements implemented in Repbase. Nat. Rev. Genet. 2008, 9, 411–412. [Google Scholar] [CrossRef] [PubMed]
  23. Barrio, A.M.; Lagercrantz, E.; Sperber, G.O.; Blomberg, J.; Bongcam-Rudloff, E. Annotation and visualization of endogenous retroviral sequences using the Distributed Annotation System (DAS) and eBioX. BMC Bioinform. 2009, 10, S18. [Google Scholar]
  24. Garazha, A.; Ivanova, A.; Suntsova, M.; Malakhova, G.; Roumiantsev, S.; Zhavoronkov, A.; Buzdin, A. New bioinformatic tool for quick identification of functionally relevant endogenous retroviral inserts in human genome. Cell Cycle 2015, 14, 1476–1484. [Google Scholar] [CrossRef] [PubMed]
  25. Buzdin, A.A.; Prassolov, V.; Garazha, A.V. Friends-Enemies: Endogenous Retroviruses Are Major Transcriptional Regulators of Human DNA. Front. Chem. 2017, 5, 35. [Google Scholar] [CrossRef] [PubMed]
  26. Borisov, N.M.; Terekhanova, N.V.; Aliper, A.M.; Venkova, L.S.; Smirnov, P.Y.; Roumiantsev, S.; Korzinkin, M.B.; Zhavoronkov, A.A.; Buzdin, A.A. Signaling pathways activation profiles make better markers of cancer than expression of individual genes. Oncotarget 2014, 5, 10198–10205. [Google Scholar] [CrossRef] [PubMed]
  27. Borisov, N.; Suntsova, M.; Sorokin, M.; Garazha, A.; Kovalchuk, O.; Aliper, A.; Ilnitskaya, E.; Lezhnina, K.; Korzinkin, M.; Tkachev, V.; et al. Data aggregation at the level of molecular pathways improves stability of experimental transcriptomic and proteomic data. Cell Cycle 2017, 16, 1810–1823. [Google Scholar] [CrossRef]
  28. Harris, B.H.; Barberis, A.; West, C.M.; Buffa, F.M. Gene Expression Signatures as Biomarkers of Tumour Hypoxia. Clin. Oncol. 2015, 27, 547–560. [Google Scholar] [CrossRef]
  29. Yuryev, A. Gene expression profiling for targeted cancer treatment. Expert Opin. Drug Discov. 2015, 10, 91–99. [Google Scholar] [CrossRef]
  30. Buzdin, A.A.; Prassolov, V.; Zhavoronkov, A.A.; Borisov, N.M. Bioinformatics Meets Biomedicine: OncoFinder, a Quantitative Approach for Interrogating Molecular Pathways Using Gene Expression Data. Methods Mol Biol. 2017, 53–83. [Google Scholar]
  31. Aliper, A.M.; Korzinkin, M.B.; Kuzmina, N.B.; Zenin, A.A.; Venkova, L.S.; Smirnov, P.Y.; Zhavoronkov, A.A.; Buzdin, A.A.; Borisov, N.M. Mathematical Justification of Expression-Based Pathway Activation Scoring (PAS). In Biological Networks and Pathway Analysis. Methods in Molecular Biology; Tatarinova, T., Nikolsky, Y., Eds.; Humana Press: New York, NY, USA, 2017; Volume 1613, pp. 31–51. [Google Scholar]
  32. Ashburner, M.; Ball, C.A.; Blake, J.A.; Botstein, D.; Butler, H.; Cherry, J.M.; Davis, A.P.; Dolinski, K.; Dwight, S.S.; Eppig, J.T.; et al. Gene Ontology: Tool for the unification of biology. Nat. Genet. 2000, 25, 25–29. [Google Scholar] [CrossRef] [PubMed]
  33. The Gene Ontology Consortium. Expansion of the Gene Ontology knowledgebase and resources. Nucleic Acids Res. 2017; 45, D331–D338. [Google Scholar]
  34. Artemov, A.; Aliper, A.; Korzinkin, M.; Lezhnina, K.; Jellen, L.; Zhukov, N.; Roumiantsev, S.; Gaifullin, N.; Zhavoronkov, A.; Borisov, N.; et al. A method for predicting target drug efficiency in cancer based on the analysis of signaling pathway activation. Oncotarget 2015, 6, 29347–29356. [Google Scholar] [CrossRef] [PubMed]
  35. Yin, H.; Wang, S.; Zhang, Y.H.; Cai, Y.D.; Liu, H. Analysis of Important Gene Ontology Terms and Biological Pathways Related to Pancreatic Cancer. Biomed Res. Int. 2016, 7861274. [Google Scholar] [CrossRef] [PubMed]
  36. Nikitin, D.; Penzar, D.; Garazha, A.; Sorokin, M.; Tkachev, V.; Borisov, N.; Poltorak, A.; Prassolov, V.; Buzdin, A.A. Profiling of Human Molecular Pathways Affected by Retrotransposons at the Level of Regulation by Transcription Factor Proteins. Front. Immunol. 2018, 9, 30. [Google Scholar] [CrossRef] [PubMed]
  37. Danino, Y.M.; Even, D.; Ideses, D.; Juven-Gershon, T. The core promoter: At the heart of gene expression. Biochim. Biophys. Acta 2015, 1116–1131. [Google Scholar] [CrossRef] [PubMed]
  38. Johnson, D.S.; Mortazavi, A.; Myers, R.M.; Wold, B. Genome-wide mapping of in vivo protein-DNA interactions. Science 2007, 316, 1497–1502. [Google Scholar] [CrossRef] [PubMed]
  39. Moran, J.V.; Holmes, S.E.; Naas, T.P.; DeBerardinis, R.J.; Boeke, J.D.; Kazazian, H.H., Jr. High frequency retrotransposition in cultured mammalian cells. Cell 1996, 87, 917–927. [Google Scholar] [CrossRef]
  40. ENCODE: Encyclopedia of DNA Elements. Available online: https://www.encodeproject.org (accessed on 31 January 2019).
  41. ENCODE Database, Transcription Factors. Available online: https://www.encodeproject.org/chip-seq/transcription_factor/ (accessed on 31 January 2019).
  42. ENCODE Database, BWA Software. Available online: https://www.encodeproject.org/pipelines/ENCPL220NBH/ (accessed on 31 January 2019).
  43. RepeatMasker. Available online: http://www.repeatmasker.org (accessed on 31 January 2019).
  44. UCSC Browser, Human Genome. Available online: https://genome.ucsc.edu/cgi-bin/hgs (accessed on 31 January 2019).
  45. UCSC Browser, bedGraph Files. Available online: https://genome.ucsc.edu/goldenpath/help/bedgraph.html (accessed on 31 January 2019).
  46. ENCODE ChIP-seq Analysis Pipeline. Available online: https://www.encodeproject.org/pipelines/ENCPL138KID/ (accessed on 31 January 2019).
  47. Giordano, J.; Ge, Y.; Gelfand, Y.; Abrusán, G.; Benson, G.; Warburton, P.E. Evolutionary History of Mammalian Transposons Determined by Genome-Wide Defragmentation. PLoS Comput. Biol. 2007, 137, e137. [Google Scholar] [CrossRef]
  48. BioCarta. Available online: https://cgap.nci.nih.gov/Pathways/BioCarta_Pathways (accessed on 31 January 2019).
  49. KEGG. Available online: http://www.genome.jp/kegg/ (accessed on 31 January 2019).
  50. National Cancer Institute. Available online: https://cactus.nci.nih.gov/ncicadd/about.htm (accessed on 31 January 2019).
  51. Reactome. Available online: http://reactome.org (accessed on 31 January 2019).
  52. Pathway Central. Available online: http://www.sabiosciences.com/pathwaycentral.php (accessed on 31 January 2019).
  53. DAVID Functional Annotation Bioinformatics Microarray Analysis. Available online: https://david.ncifcrf.gov/ (accessed on 31 January 2019).
  54. GOrilla—A tool for Identifying Enriched GO Terms. Available online: http://cbl-gorilla.cs.technion.ac.il (accessed on 31 January 2019).
  55. USCS Genome Browser. Available online: https://genome.ucsc.edu/ (accessed on 31 January 2019).
  56. Huang, D.W.; Sherman, B.T.; Lempicki, R.A. Bioinformatics enrichment tools: Paths toward the comprehensive functional analysis of large gene lists. Nucleic Acids Res. 2009, 37, 1–13. [Google Scholar] [CrossRef]
  57. Seaborn. Available online: http://seaborn.pydata.org/ (accessed on 31 January 2019).
  58. Diehl, A.G.; Boyle, A.P. Deciphering ENCODE. Trends in Genetics, 32.
  59. Sloan, C.A.; Chan, E.T.; Davidson, J.M.; Malladi, V.S.; Strattan, J.S.; Hitz, B.C.; Gabdank, I.; Narayanan, A.K.; Ho, M.; Lee, B.T.; et al. ENCODE data at the ENCODE portal. Nucleic Acids Res. 2018, 44, D726–D732. [Google Scholar] [CrossRef]
  60. Sundaram, V.; Cheng, Y.; Ma, Z.; Li, D.; Xing, X.; Edge, P.; Snyder, M.P.; Wang, T. Widespread contribution of transposable elements to the innovation of gene regulatory networks. Genome Res. 2014, 24, 1963–1976. [Google Scholar] [CrossRef] [PubMed]
  61. Numpy Least Squares Polynomial Fit. Available online: https://docs.scipy.org/doc/numpy/reference/generated/numpy.polyfit.html (accessed on 31 January 2019).
  62. Huang, D.W.; Sherman, B.T.; Lempicki, R.A. Systematic and integrative analysis of large gene lists using DAVID bioinformatics resources. Nat. Protoc. 2009, 4, 44–57. [Google Scholar] [CrossRef] [PubMed]
  63. Charitou, T.; Bryan, K.; Lynn, D.J. Using biological networks to integrate, visualize and analyze genomics data. Genet. Sel. Evol. 2016, 48. [Google Scholar] [CrossRef] [PubMed]
  64. Eden, E.; Navon, R.; Steinfeld, I.; Lipson, D.; Yakhini, Z. GOrilla: A tool for discovery and visualization of enriched GO terms in ranked gene lists. BMC Bioinform. 2009, 10, 48. [Google Scholar] [CrossRef]
  65. Lynch, M.; Ackerman, M.S.; Gout, J.F.; Long, H.; Sung, W.; Thomas, W.K.; Foster, P.L. Genetic drift, selection and the evolution of the mutation rate. Nat. Rev. Genet. 2016, 17, 704–714. [Google Scholar] [CrossRef] [PubMed]
  66. Burns, K.H.; Boeke, J.D. Human transposon tectonics. Cell 2012, 149, 740–752. [Google Scholar] [CrossRef] [PubMed]
  67. Lavialle, C.; Cornelis, G.; Dupressoir, A.; Esnault, C.; Heidmann, O.; Vernochet, C.; Heidmann, T. Paleovirology of ‘syncytins’, retroviral env genes exapted for a role in placentation. Philos. Trans. R. Soc. B Biol. Sci. 2013, 368, 20120507. [Google Scholar] [CrossRef]
  68. Fox, G. Origin and evolution of the ribosome. Cold Spring Harb. Perspect. Biol. 2010, 2, a003483. [Google Scholar] [CrossRef]
  69. Caetano-Anollés, G.; Yafremava, L.; Gee, H.; Caetano-Anollés, D.; Kim, H.; Mittenthal, J. The origin and evolution of modern metabolism. Int. J. Biochem. Cell Biol. 2009, 41, 285–297. [Google Scholar] [CrossRef]
  70. O’Brien, P.J. Catalytic promiscuity and the divergent evolution of DNA repair enzymes. Chem. Rev. 2006, 106, 720–752. [Google Scholar] [CrossRef]
  71. Hoeijmakers, J. DNA damage, aging, and cancer. N. Engl. J. Med. 2009, 361, 1475–1485. [Google Scholar] [CrossRef] [PubMed]
  72. Boehm, T.; Swann, J. Origin and evolution of adaptive immunity. Annu. Rev. Anim. Biosci. 2014, 2, 259–283. [Google Scholar] [CrossRef] [PubMed]
  73. Moazed, D. Small RNAs in transcriptional gene silencing and genome defence. Nature 2009, 457, 413–420. [Google Scholar] [CrossRef] [PubMed]
Figure 1. RE insertion in the proximity of transcription start sites can bring new TFBS and drastically alter gene expression.
Cells 08 00130 g001
Figure 2. Comparison of NGRE and NPII scores between different cell lines for all REs. Colors denote human organs of cell lines origin. (A) Anatomical map of cell line origins investigated in this study. (B) Distribution of Pearson correlation coefficients of NGRE score of K562 cell line with NGRE scores of the 12 other cell lines investigated. (C) Distribution of Pearson correlation coefficients of NPII score of K562 cell line with NGRE scores of the 12 other cell lines. (D) Distribution of all pairwise Pearson correlation coefficients of NGRE scores of all 13 cell lines. (E) Distribution of all pairwise Pearson correlation coefficients of NPII scores of all 13 cell lines.
Cells 08 00130 g002
Figure 3. Comparison of GRE and NGRE scores across cell lines for all REs. (A) Comparison of mean GRE and mean NGRE scores. Each dot represents a single gene; GRE and NGRE scores were averaged across all cell lines. Genes enriched in RRE (regulation by retroelements) are shown as red dots. Genes deficient in RRE are shown as green dots. (B) Comparison of mean GRE and mean NGRE scores. Both scores were averaged across cell lines. Color depth is congruent with the number of single dots (each dot represents a single gene) in one grain. Univariate distributions of GRE and NGRE are shown in plot margins. (C) Comparison of GRE and NGRE scores for individual cell lines.
Cells 08 00130 g003
Figure 4. Comparison of PII and NPII scores across cell lines for all REs. (A) Comparison of mean PII and mean NPII scores. Each dot represents a single pathway; PII and NPII scores were averaged across all cell lines. Pathways enriched in RRE (regulation by retroelements) are shown as red dots. Pathways deficient in RRE are shown as green dots. (B) Comparison of mean PII and mean NPII scores. Both scores were averaged across cell lines. Color depth is proportional to the number of single dots (each dot represents a single pathway) in one grain. Univariate distributions of PII and NPII are shown in plot margins. (C) Comparison of PII and NPII scores for individual cell lines.
Cells 08 00130 g004
Figure 5. Hierarchically ordered GO annotated terms detected by Gorilla software for RRE-enriched (A) and RRE-deficient (B) genes for all REs.
Cells 08 00130 g005
Figure 6. Top five RRE-enriched and deficient pathways sorted by NPII for all REs.
Cells 08 00130 g006
Figure 7. RRE-enriched and RRE-deficient molecular processes for all REs.
Cells 08 00130 g007
Figure 8. Random control of GO processes enrichment in RRE-enriched (A) and RRE-deficient (B) genes for all REs.
Cells 08 00130 g008
Figure 9. Hierarchically ordered GO annotated terms detected by Gorilla software for RRE-deficient genes for evolutionary young REs.
Cells 08 00130 g009
Figure 10. RRE-enriched and RRE-deficient molecular processes for evolutionary young Res.
Cells 08 00130 g010
Table 1. Overall transcription factor binding sites (TFBS) statistics.
Cell LineNumber of TFs ProfiledNumber of Mapped TFBSNumber of TFBS Mapped on SINEsPercentage of TFBS Mapped on SINEsNumber of TFBS Mapped on LINEsPercentage of TFBS Mapped on LINEsNumber of TFBS Mapped on LR/ERVsPercentage of TFBS Mapped on LR/ERVsNumber of TFBS Mapped on All ClassesPercentage of TFBS Mapped on All Classes
K56226578,021,50025,078,42832.122,646,1412910,394,66213.347,072,03060.3
HepG217551,982,06516,406,06231.6140,104,77276,493,56212.530,359,14258.4
HEK29317753,100,00019,214,01536.215,708,68729.66,089,81311.533,394,94362.9
GM1287812737,688,35310,185,415279,927,94326.34,727,71912.520,728,92255
MCF-78023,851,3967,039,27129.57,499,70331.43,297,44313.814,788,90062
A5494413,044,4093,930,40730.13,569,21427.41,667,46412.87,524,69157.7
HeLa-S3154,500,0001,112,66924.71,036,66723566,61812.62,311,57151.3
SK-N-SH154,500,000874,57219.4958,40121.3473,34210.52,015,30144.3
HCT11641,200,000402,87233.6333,77127.8181,56215.1732,43261
Ishikawa41,200,000268,20922.4266,19122.2141,53011.8588,47849
HEK293T175,100,000129,787025.41,725,58933.8618,74512.13,050,40259.8
MCF_10A3900,000214,45823.8215,57624103,92511.5449,29049.9
GM1289172,100,000559,26026.6433,19420.6253,57712.11,058,65750.4
Table 2. Gene neighborhood-linked TFBS statistics.
Cell LineNumber of TFs ProfiledNumber of Mapped TFBSNumber of TFBS Mapped on SINEsPercentage of TFBS Mapped on SINEsNumber of TFBS Mapped on LINEsPercentage of TFBS Mapped on LINEsNumber of TFBS Mapped on LR/ERVsPercentage of TFBS Mapped on LR/ERVsNumber of TFBS Mapped on All ClassesPercentage of TFBS Mapped on All Classes
K56226012,547,0554,667,81037.22,508,956201,081,0848.66,782,65254.1
HepG21758,803,7483,023,41434.31,559,92917.7669,9077.64,366,65049.6
HEK2931778,074,1283,235,57340.11,569,00219.4587,7987.34,450,11355.1
GM128781275,626,4111,699,88230.2970,62617.3400,5027.12,589,33546
MCF-7803,067,4411,029,11833.5598,98219.5238,0057.81,560,66750.9
A549442,035,359662,45832.5358,08417.6142,8427969,61447.6
HeLa-S315720,963193,36526.8109,68315.247,7596.6301,21341.8
SK-N-SH15679,254139,23020.590,31313.336,7515.4233,82734.4
HCT1164202,22371,59035.438,29318.916,8788.3103,76651.3
Ishikawa4194,05352,21126.928,86714.912,7686.680,82241.6
HEK293T17518,287162,44031.3115,55522.342,2428.2266,80651.5
MCF_10A3145,89243,93030.125,50017.510,3047.166,09045.3
GM128917427,21294,46422.148,94711.521,5155179,95642.1
Table 3. RRE-enriched and deficient intracellular processes according to Gene Ontology (GO) and molecular pathway analysis (all REs).
ID Group of Processes RRE Enrichment by Pathway AnalysisRRE Enrichment by GO AnalysisOverall Status
Enriched pwsDeficient pwsEnriched GO termsDeficient GO-terms
1Posttranscriptional silencing by small RNAs1010RRE enriched
2DNA repair2050RRE enriched
3Amino acids, Peptides and Polyamines Metabolism205138RRE enriched
4Lipid Metabolism147110RRE enriched
5Detoxication, Metabolism of Xenobiotics and Rare Molecules13040RRE enriched
6Sensory Perception and Neurotransmission70100RRE enriched
7Fertilization1090RRE enriched
8Cellular Immune Response (T cells and NK cells)11076RRE enriched
9Nucleic Base, Nucleosides and Nucleotides Metabolism69024RRE deficient
10DNA metabolism and Chromatin structure040151RRE deficient
11Translation and Protein Quality Control0128130RRE deficient
12Intracellular Signaling2294548RRE deficient
13Response to Viruses03017RRE deficient
14Vitamin Metabolism4000RRE enriched
15Hormones6000RRE enriched
16Molecular Transport10000RRE enriched
17Sulfur Metabolism and Linked Redox Reactions5000RRE enriched
18Metal Metabolism0060RRE enriched
19Response to Phorbol Acetate0003RRE deficient
20Electron Transfer Reactions00517RRE deficient
21Mitochondria00517RRE deficient
22RNA Synthesis and Degradation 000139RRE deficient
23Cell Adhesion and Interaction00015RRE deficient
24Cell Cycle and Mitosis00055RRE deficient
25Cell Death00041RRE deficient
26Protein Localization and Modification00019RRE deficient
27Response to Physical and Chemical Stress00024RRE deficient
28Carbohydrates Metabolism5309Ambiguous Pattern
29Immunity36162345Shown separately
30Other/Too General Terms001317N/A
Table 4. RRE-enriched and deficient immunity-linked processes according to Gene Ontology (GO) and molecular pathway analysis (all REs).
Group of ProcessesRRE Enrichment by Pathway AnalysisRRE Enrichment by GO AnalysisOverall Status
Enriched pwsDeficient pwsEnriched GO termsDeficient GO-terms
Autoimmunity4000RRE enriched
Blood Clotting2000RRE enriched
Innate Immunity8005Ambiguous
Inflammation3500Ambiguous
Cellular Immune Response (T cells and NK cells)11076RRE enriched
Activation of Antigen-Presenting Cells by T-helper cells2700RRE deficient
Other/Too General Terms61811Ambiguous
Immune Cells Migration and Activation0070RRE enriched
Activity and maturation of B cells0006RRE deficient
Table 5. RRE-enriched and deficient microRNA and lncRNA genes (all REs).
Gene setMiRsGenes, totallyHypergeometric p-valueHypothesis tested
RRE-enriched17712192.416 × 10−18miRNA are enriched
RRE-deficient7212190.0138miRNA are not enriched
Totally—1865 miRNA genes in 25,075 genes of the human genome
Gene setlncRNAsGenes, totallyHypergeometric p-valueHypothesis tested
RRE-enriched15012191.9500× 10−17lncRNA are enriched
RRE-deficient1812192.42× 10−16lncRNA are not enriched
Totally—1505 lncRNA genes in 25,075 genes of the human genome
Table 6. RRE-enriched and deficient intracellular processes according to Gene Ontology (GO) and molecular pathway analysis (evolutionary young REs).
IDGroup of ProcessesRRE Enrichment by Pathway AnalysisRRE Enrichment by GO AnalysisOverall Status
Enriched pwsDeficient pwsEnriched GO termsDeficient GO-Terms
1Lipids metabolism22820RRE enriched
2Signaling2840831RRE deficient
3Immune System1814312Shown Separately
4Cell cycle16062RRE deficient
5Cell death76035Ambiguous Pattern
6Amino acids and polyamines metabolism13500RRE enriched
7Metabolism and detoxication of xenobiotics8020RRE enriched
8Sulfur-linked reactions6000RRE enriched
9Vitamins metabolism10000RRE enriched
10Carbohydrates and related molecules metabolism9506Ambiguous Pattern
11Nucleic base, nucleotides and nucleosides metabolism53014Ambiguous Pattern
12Transport of small molecules4000RRE enriched
13Blood Clotting3000RRE enriched
14Cytosketeton, cell adhesion and migration018016RRE deficient
15Endocytosis0400RRE deficient
16Translation and protein quality control0230105RRE deficient
17Viruses07018RRE deficient
18Signal perception and neurotransmission00220RRE enriched
19RNA Synthesis and Degradation00080RRE deficient
20DNA metabolism and chromatin00066RRE deficient
21Protein Localization and Modification00020RRE deficient
22Response to Physical and Chemical Stress00015RRE deficient
23Oxidative Phosphorylation in Mitochondria00019RRE deficient
24Other/Too General Terms181218231N/A
Table 7. RRE-enriched and deficient immunity-linked processes according to Gene Ontology (GO) and molecular pathway analysis (evolutionary young REs).
Group of Processes RRE enrichment by pathway analysisRRE enrichment by GO analysisOverall status
Enriched pwsDeficient pwsEnriched GO termsDeficient GO-terms
Innate immunity5209Ambiguous Pattern
Inflammation3300Ambiguous Pattern
T-cells mediated immunity4300RRE enriched
Other/Too General Terms5033

