Construction and Analysis of Gene Co-Expression Networks in Escherichia coli
Abstract
:1. Introduction
2. Results
2.1. A Gene Co-Expression Network for E. coli Was Successfully Constructed
2.2. Each Module Performs Distinct Functions
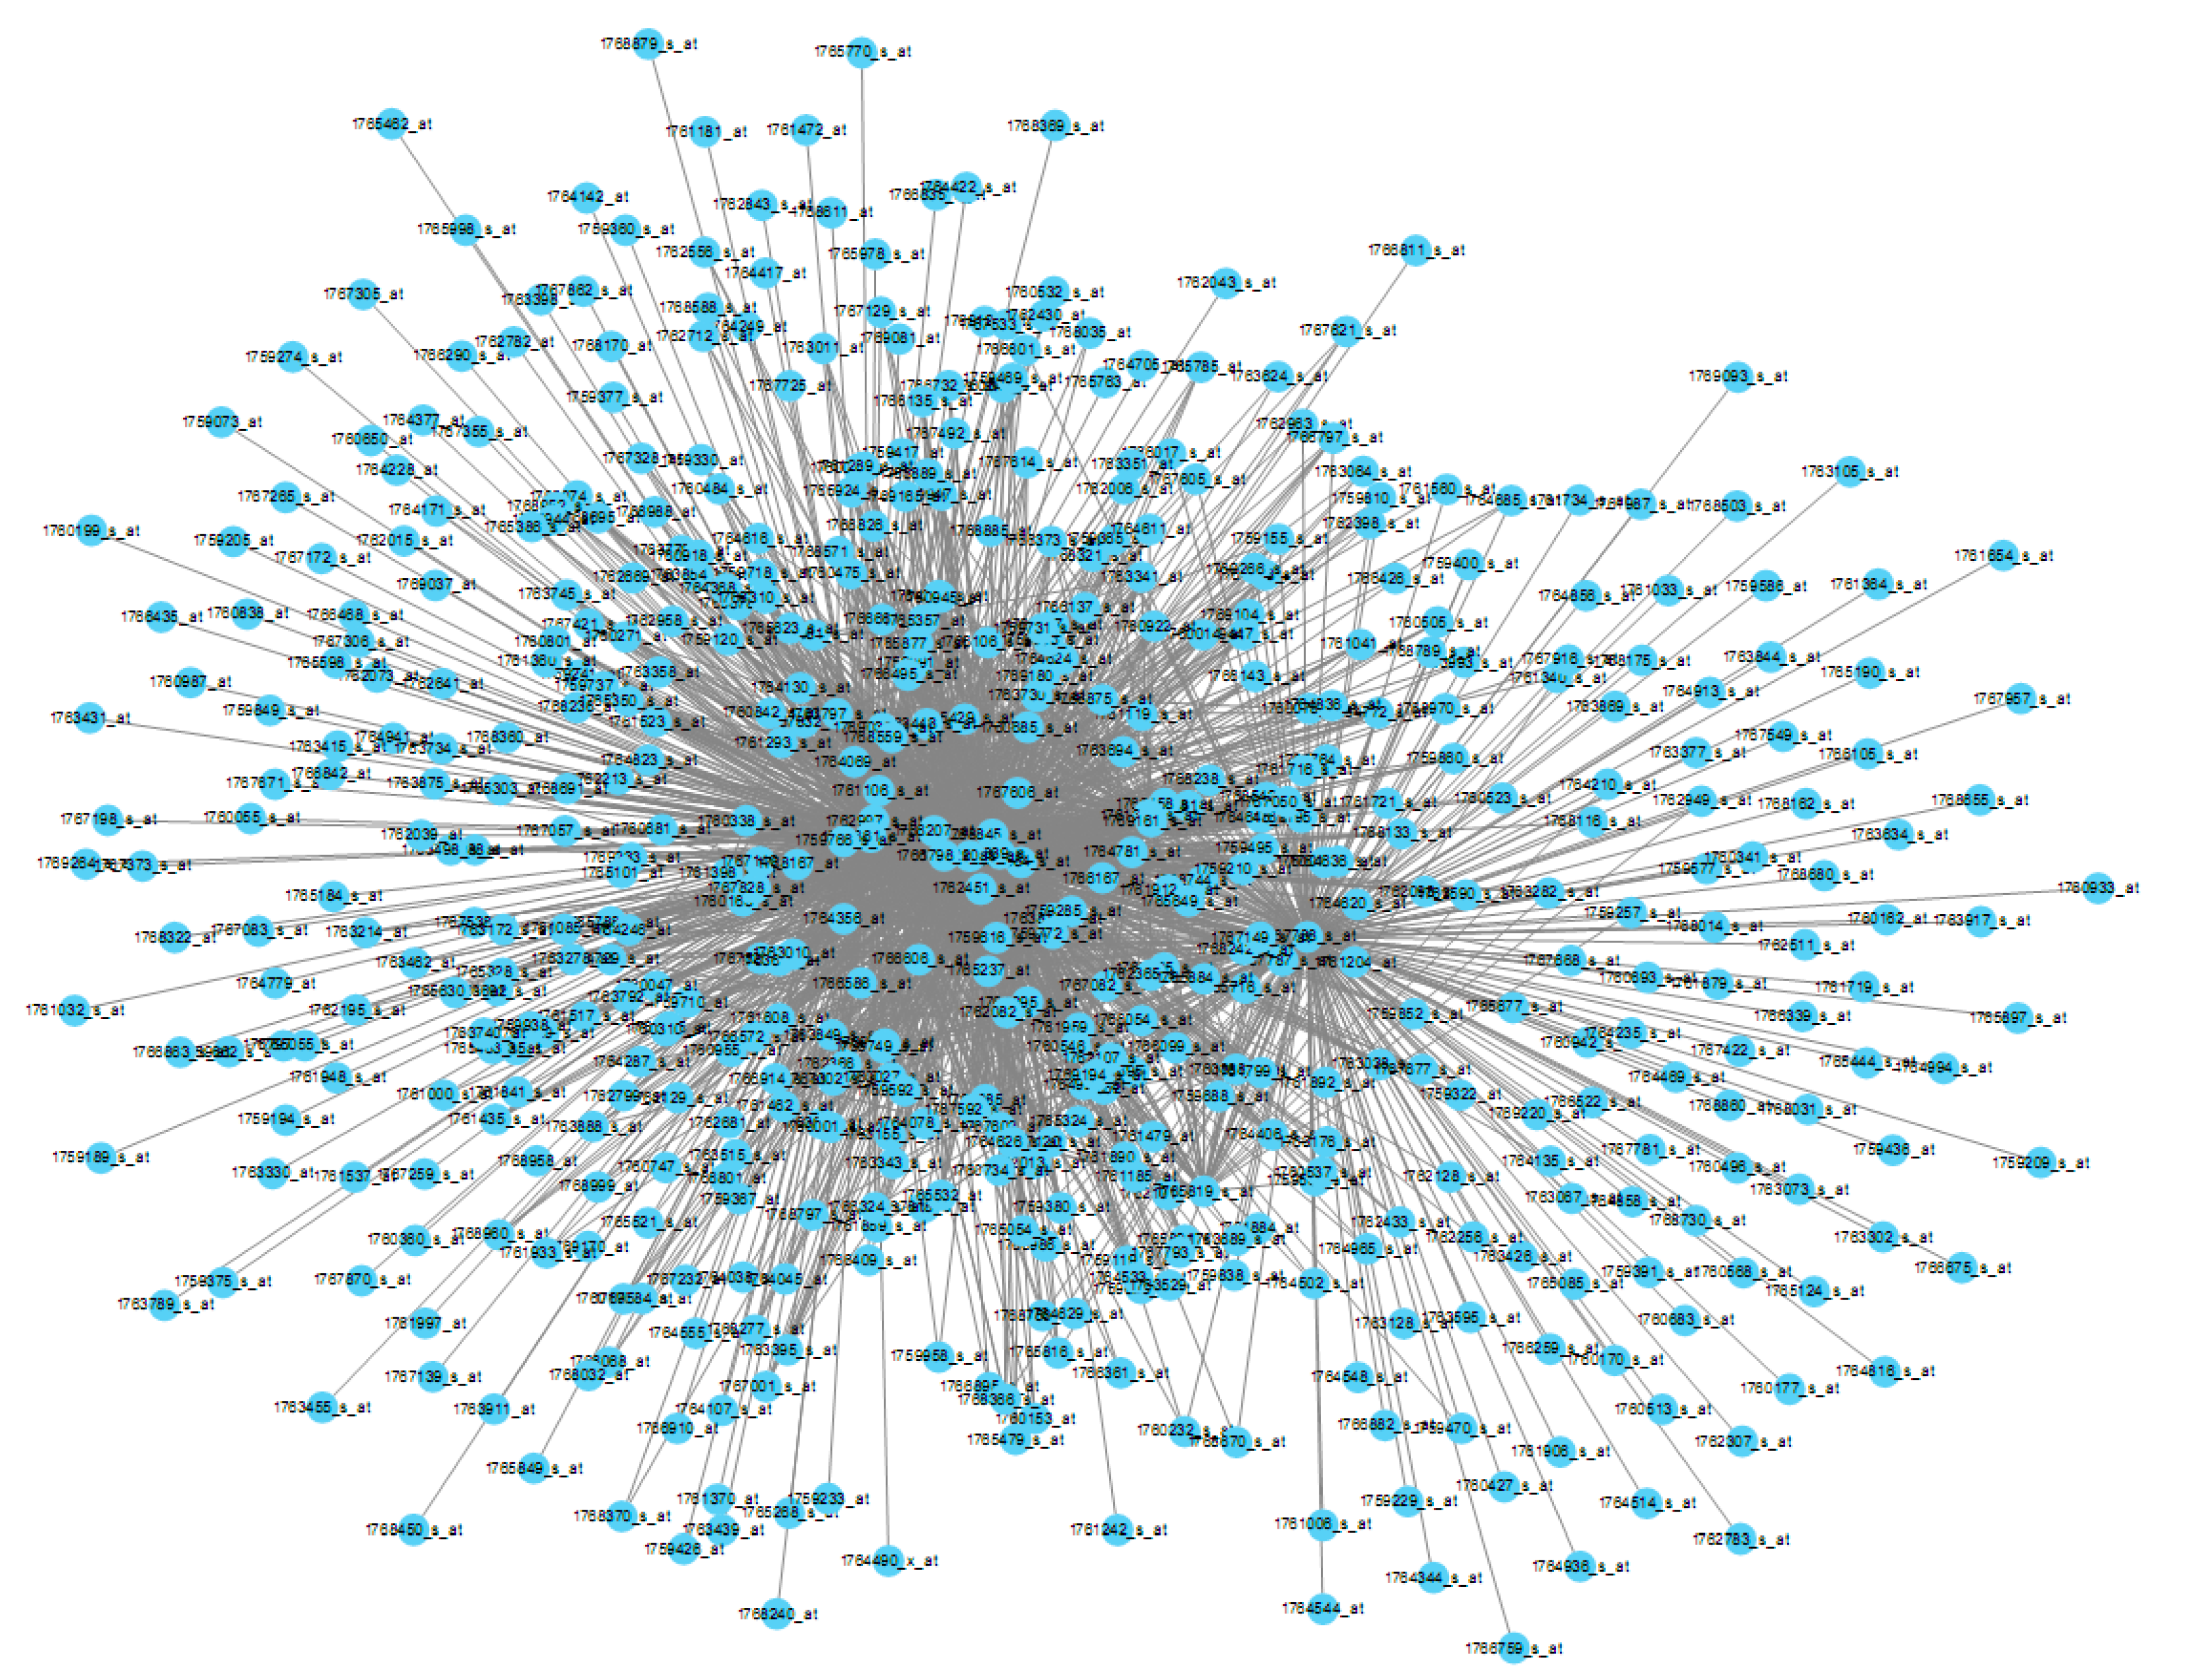
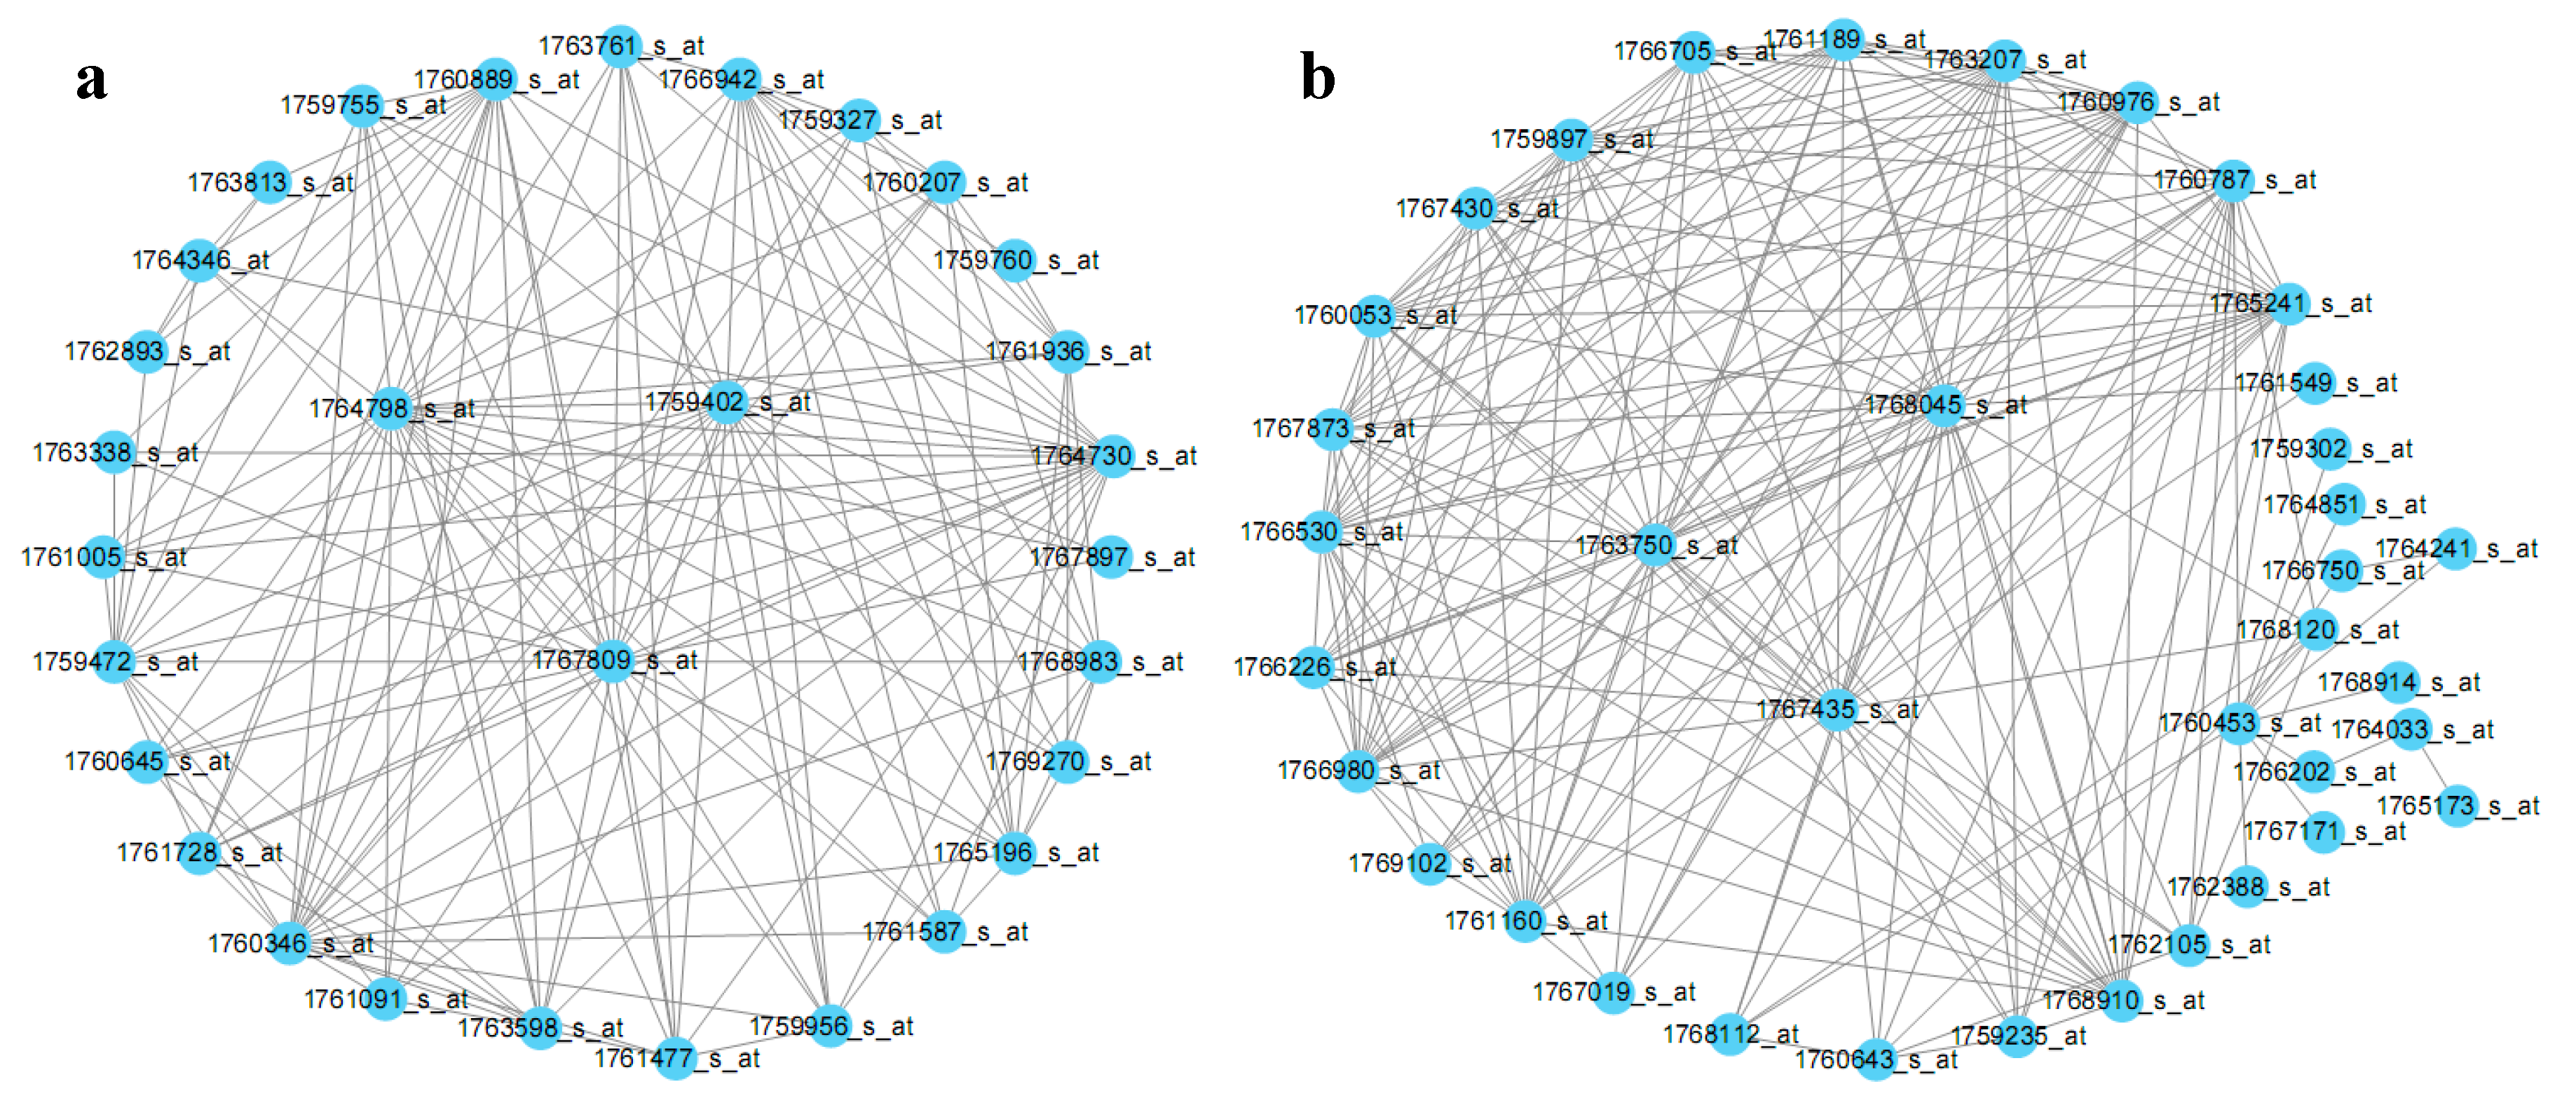
2.3. E. coli Hub Gene Screening
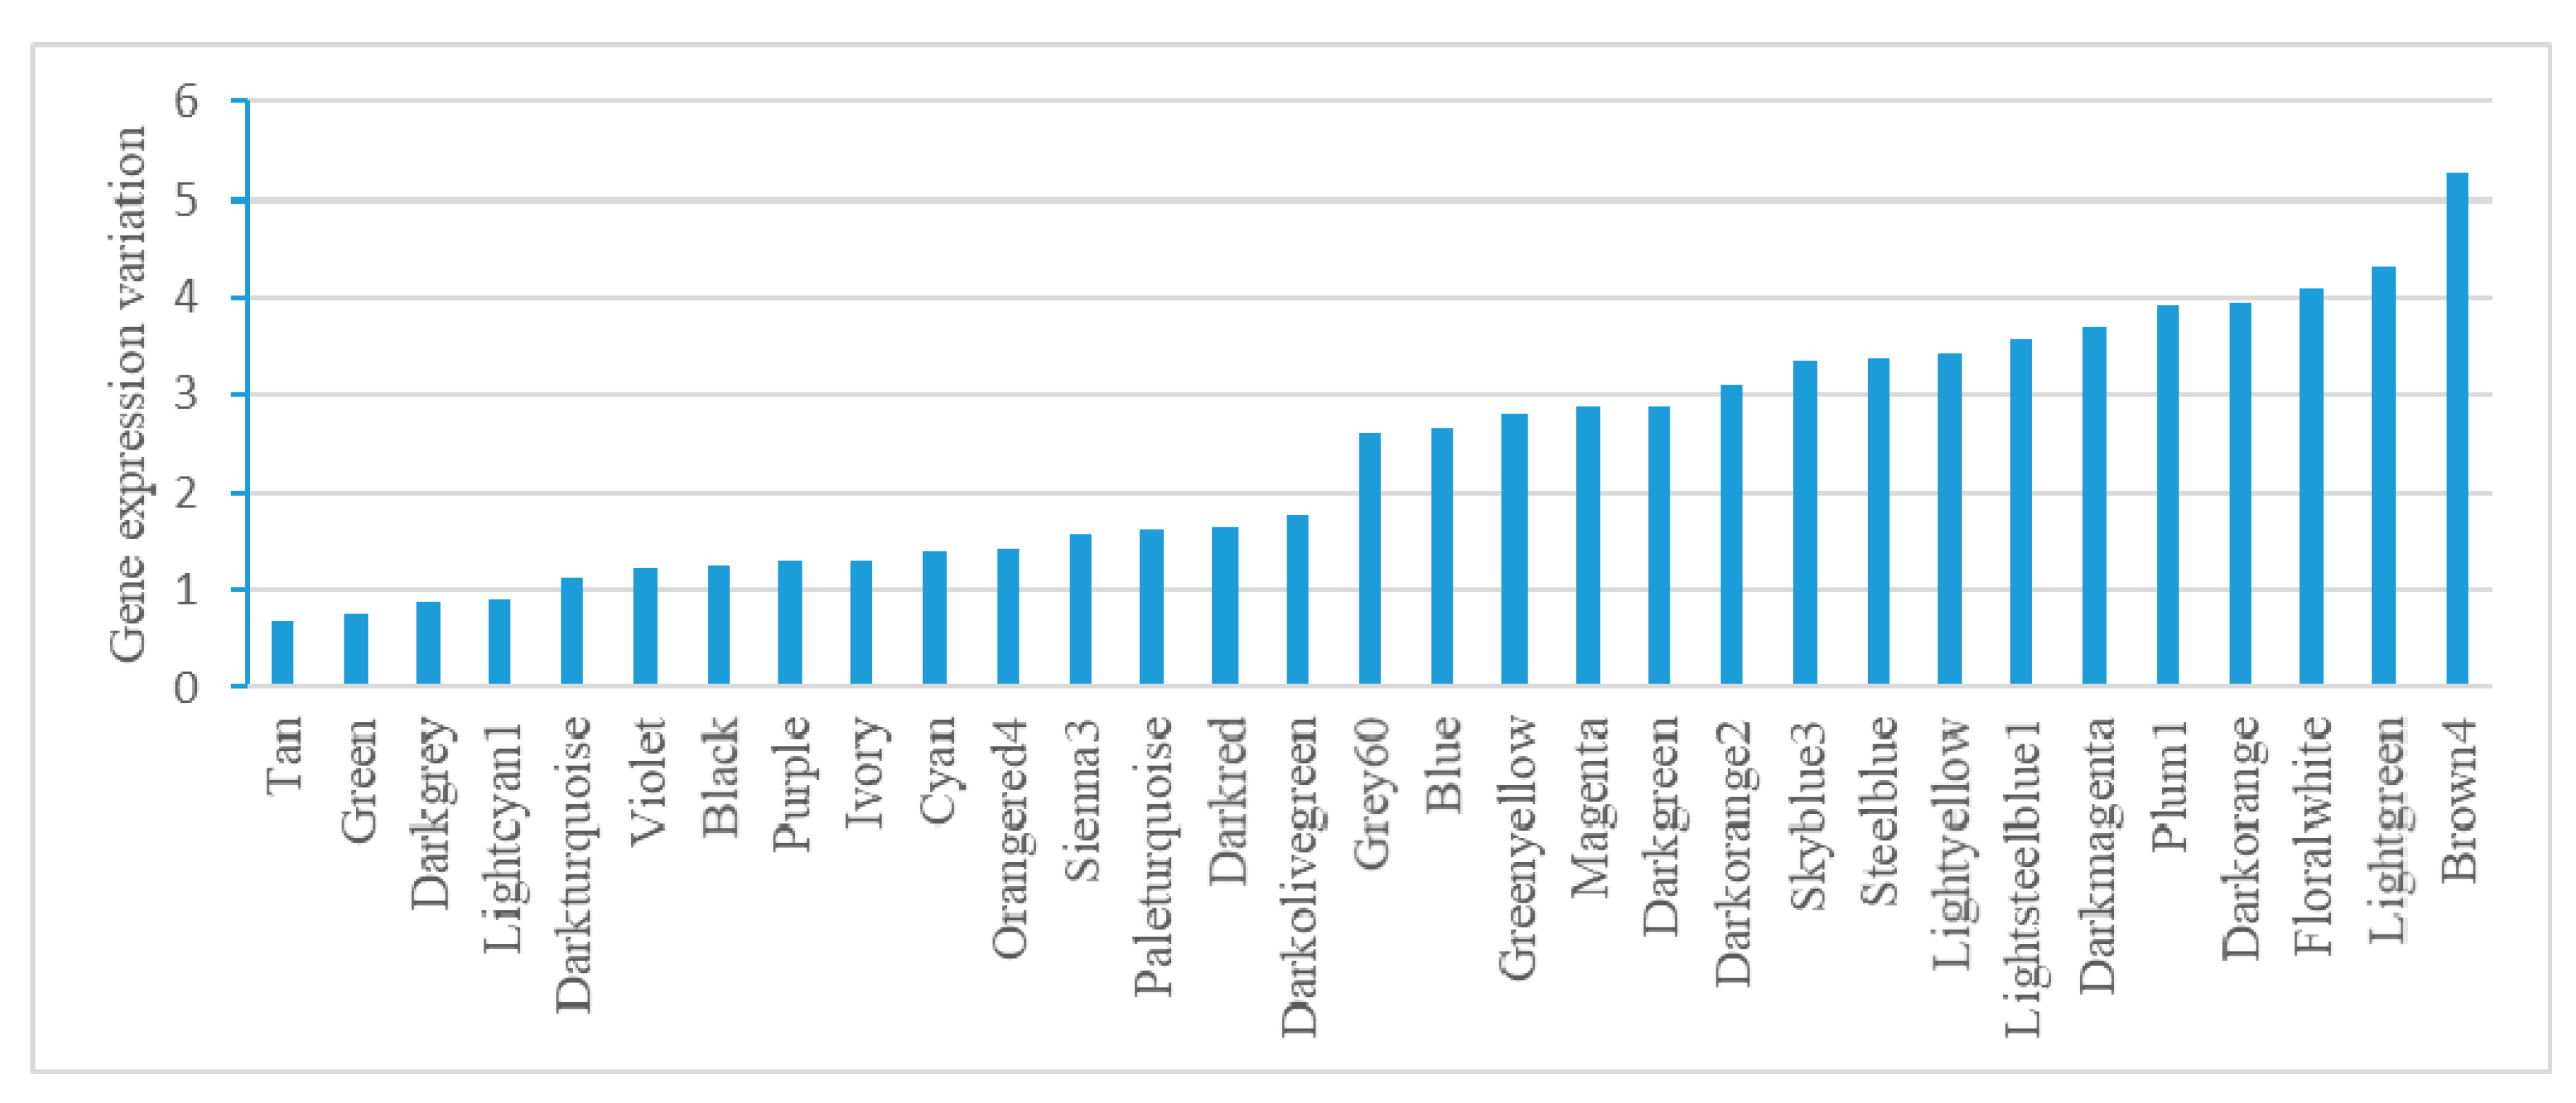
2.4. Module-Based Analysis of Gene Expression Variation
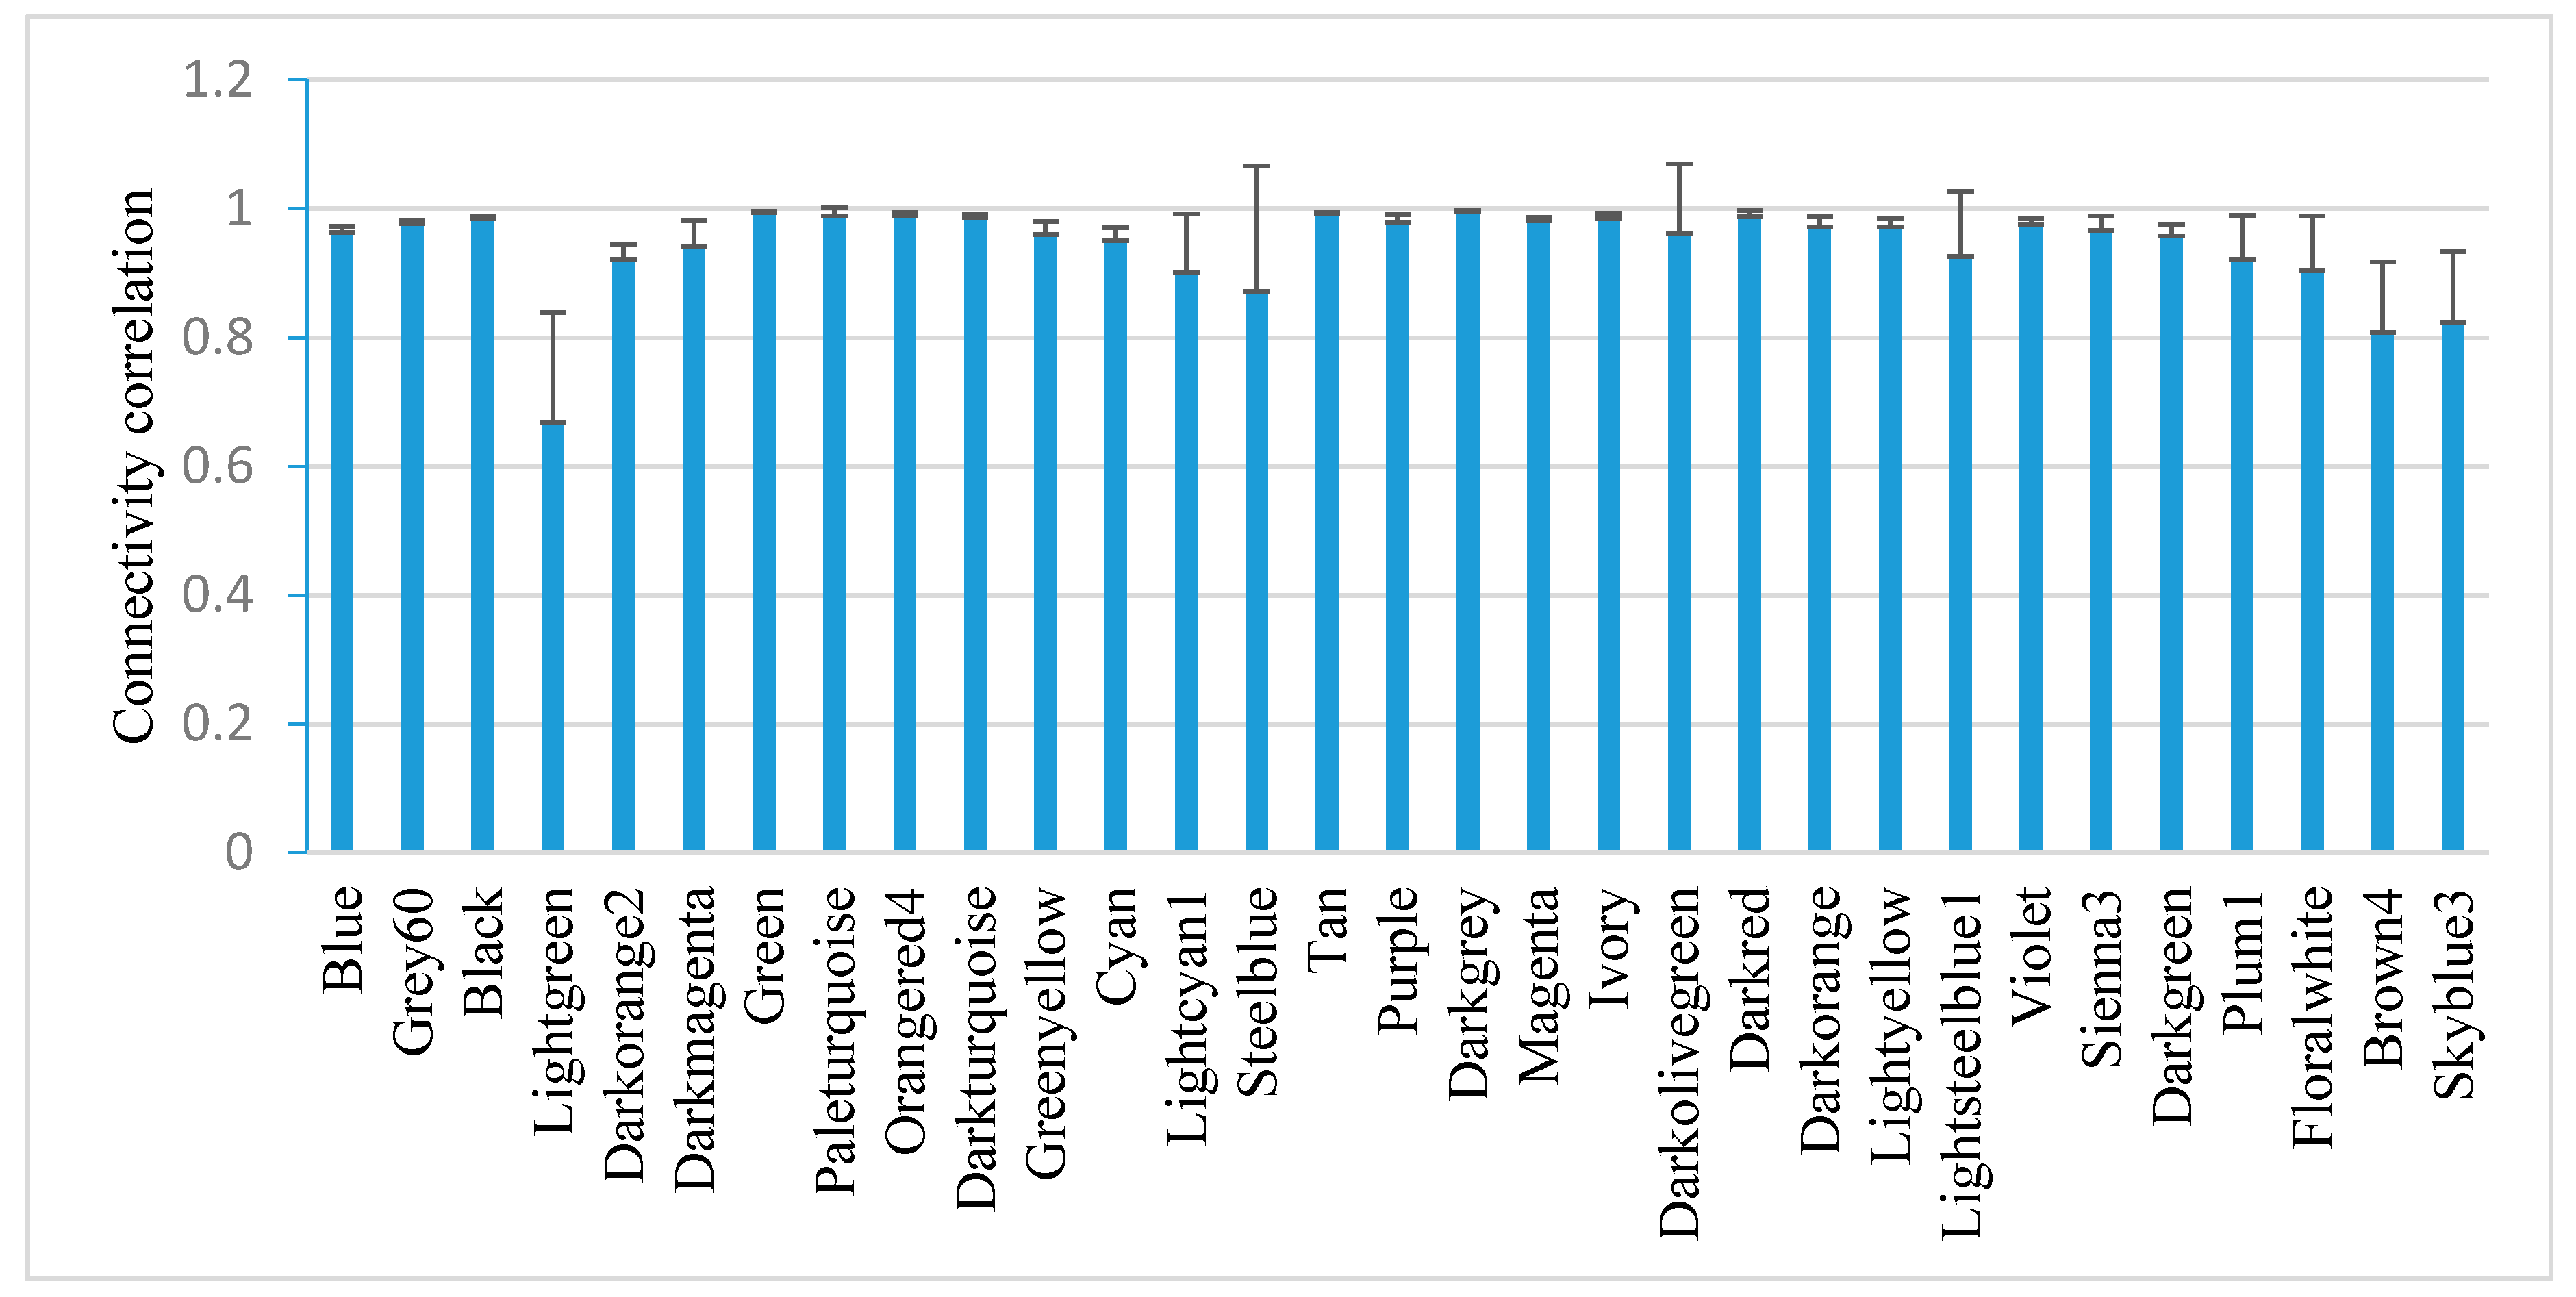
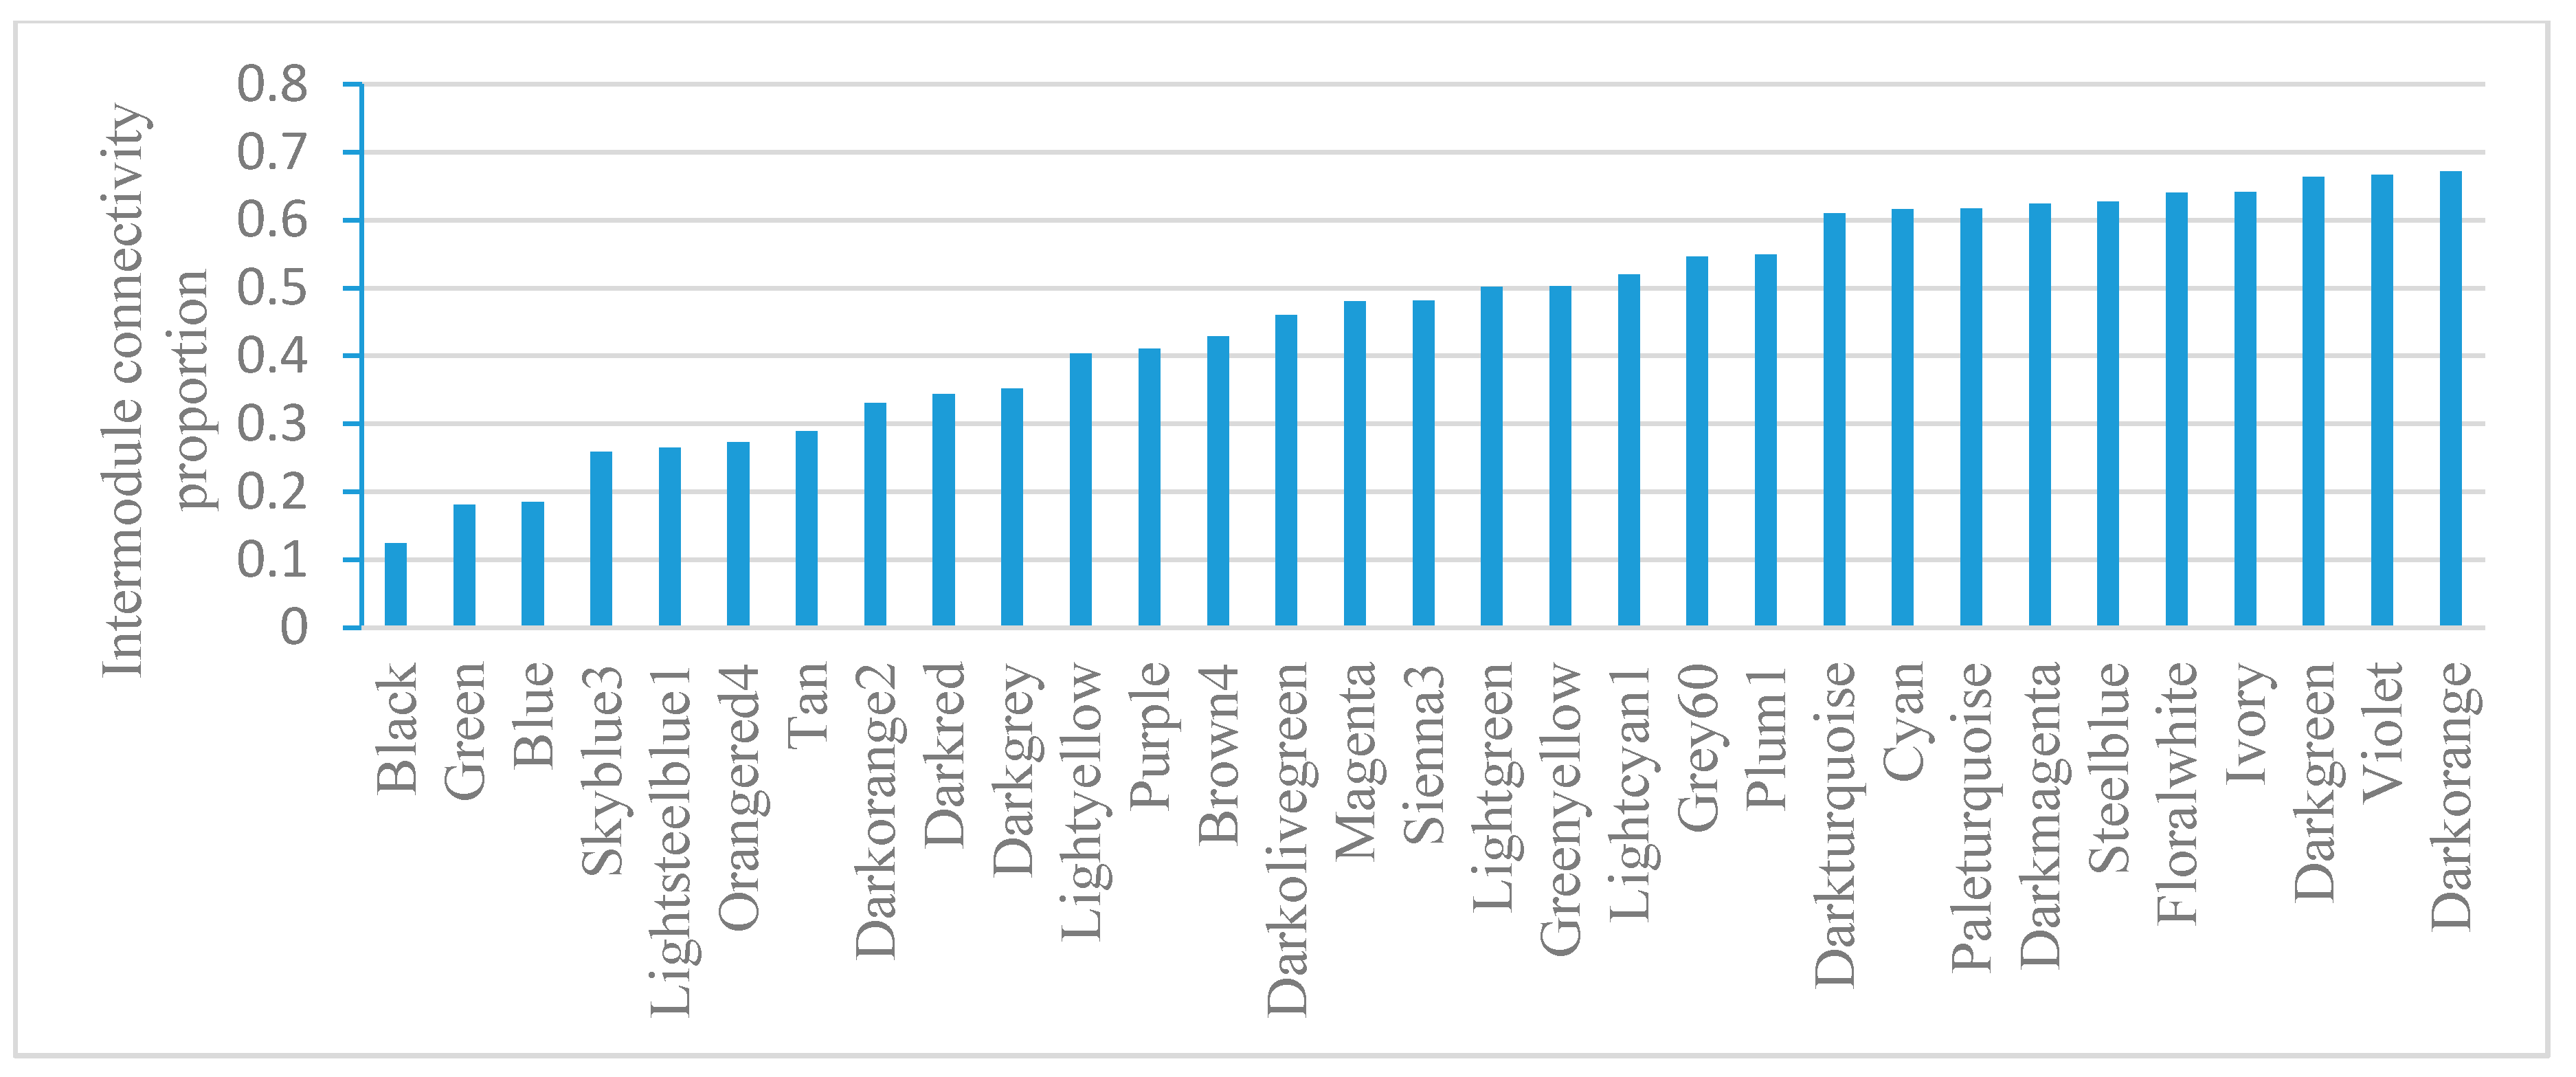
2.5. Module-Based Analysis of Gene Connectivity
2.6. Modules That Correlate with Experimental Conditions
2.7. Comparison with Previous E. coli Networks
3. Discussion
4. Materials and Methods
4.1. Data Preparation
4.2. Weighted Gene Co-Expression Network Analysis (WGCNA)
4.3. Module-Based Qualitative and Quantitative analysis
4.4. Comparison of Gene Prediction Using Published Data
Supplementary Materials
Acknowledgments
Author Contributions
Conflicts of Interest
References
- Barrett, T.; Troup, D.B.; Wilhite, S.E.; Ledoux, P.; Rudnev, D.; Evangelista, C.; Kim, I.F.; Soboleva, A.; Tomashevsky, M.; Edgar, R. NCBI GEO: Mining tens of millions of expression profiles—Database and tools update. Nucl. Acids Res. 2007, 35, D760–D765. [Google Scholar] [CrossRef] [PubMed]
- Zhu, J.; Zhang, B.; Smith, E.N.; Drees, B.; Brem, R.B.; Kruglyak, L.; Bumgarner, R.E.; Schadt, E.E. Integrating large-scale functional genomic data to dissect the complexity of yeast regulatory networks. Nat. Genet. 2008, 40, 854–861. [Google Scholar] [CrossRef] [PubMed]
- Orth, J.D.; Conrad, T.M.; Na, J.; Lerman, J.A.; Nam, H.; Feist, A.M.; Palsson, B.O. A comprehensive genome-scale reconstruction of Escherichia coli metabolism-2011. Mol. Syst. Biol. 2011, 7, 535. [Google Scholar] [CrossRef] [PubMed]
- Wang, J.; Chen, L.; Tian, X.; Gao, L.; Niu, X.; Shi, M.; Zhang, W. Global metabolomic and network analysis of Escherichia coli responses to exogenous biofuels. J. Proteome Res. 2013, 12, 5302–5312. [Google Scholar] [CrossRef] [PubMed]
- Allen, J.D.; Xie, Y.; Chen, M.; Girard, L.; Xiao, G. Comparing statistical methods for constructing large scale gene networks. PLoS ONE 2012, 7, e29348. [Google Scholar] [CrossRef] [PubMed]
- Trevino, S., 3rd; Sun, Y.; Cooper, T.F.; Bassler, K.E. Robust detection of hierarchical communities from Escherichia coli gene expression data. PLoS Comput. Biol. 2012, 8, e1002391. [Google Scholar] [CrossRef] [PubMed]
- Fang, X.; Sastry, A.; Mih, N.; Kim, D.; Tan, J.; Yurkovich, J.T.; Lloyd, C.J.; Gao, Y.; Yang, L.; Palsson, B.O. Global transcriptional regulatory network for Escherichia coli robustly connects gene expression to transcription factor activities. Proc. Natl. Acad. Sci. USA 2017, 114, 10286–10291. [Google Scholar] [CrossRef] [PubMed]
- Gutierrez-Rios, R.M.; Rosenblueth, D.A.; Loza, J.A.; Huerta, A.M.; Glasner, J.D.; Blattner, F.R.; Collado-Vides, J. Regulatory network of Escherichia coli: Consistency between literature knowledge and microarray profiles. Genome Res. 2003, 13, 2435–2443. [Google Scholar] [CrossRef] [PubMed]
- Faith, J.J.; Hayete, B.; Thaden, J.T.; Mogno, I.; Wierzbowski, J.; Cottarel, G.; Kasif, S.; Collins, J.J.; Gardner, T.S. Large-scale mapping and validation of Escherichia coli transcriptional regulation from a compendium of expression profiles. PLoS Biol. 2007, 5, e8. [Google Scholar] [CrossRef] [PubMed]
- Kim, H.; Shim, J.E.; Shin, J.; Lee, I. EcoliNet: A Database of Cofunctional Gene Network for Escherichia Coli; Database: Oxford, UK, 2015; Volume 2015. [Google Scholar]
- Zhang, B.; Horvath, S. A general framework for weighted gene co-expression network analysis. Stat. Appl. Genet. Mol. Biol. 2005, 4, 1128. [Google Scholar] [CrossRef] [PubMed]
- Langfelder, P.; Mischel, P.S.; Horvath, S. When is hub gene selection better than standard meta-analysis? PLoS ONE 2013, 8, e61505. [Google Scholar] [CrossRef] [PubMed]
- Chekabab, S.M.; Jubelin, G.; Dozois, C.M.; Harel, J. PhoB activates Escherichia coli O157:H7 virulence factors in response to inorganic phosphate limitation. PLoS ONE 2014, 9, e94285. [Google Scholar] [CrossRef] [PubMed]
- Paton, A.W.; Paton, J.C. Detection and characterization of Shiga toxigenic Escherichia coli by using multiplex PCR assays for stx1, stx2, eaeA, enterohemorrhagic E. coli hlyA, rfbO111, and rfbO157. J. Clin. Microbiol. 1998, 36, 598–602. [Google Scholar] [PubMed]
- Kashyap, D.R.; Kuzma, M.; Kowalczyk, D.A.; Gupta, D.; Dziarski, R. Bactericidal peptidoglycan recognition protein induces oxidative stress in Escherichia coli through a block in respiratory chain and increase in central carbon catabolism. Mol. Microbiol. 2017, 105, 755–776. [Google Scholar] [CrossRef] [PubMed]
- Oldham, M.C.; Konopka, G.; Iwamoto, K.; Langfelder, P.; Kato, T.; Horvath, S.; Geschwind, D.H. Functional organization of the transcriptome in human brain. Nat. Neurosci. 2008, 11, 1271–1282. [Google Scholar] [CrossRef] [PubMed]
- Zhan, J.; Thakare, D.; Ma, C.; Lloyd, A.; Nixon, N.M.; Arakaki, A.M.; Burnett, W.J.; Logan, K.O.; Wang, D.; Wang, X. RNA sequencing of laser-capture microdissected compartments of the maize kernel identifies regulatory modules associated with endosperm cell differentiation. Plant Cell 2015, 27, 513–531. [Google Scholar] [CrossRef] [PubMed]
- Liu, W.; Li, L.; Ye, H.; Tu, W. Weighted gene co-expression network analysis in biomedicine research. Sheng Wu Gong Cheng Xue Bao 2017, 33, 1791–1801. [Google Scholar] [PubMed]
- Deng, W.; Li, Y.; Hardwidge, P.R.; Frey, E.A.; Pfuetzner, R.A.; Lee, S.; Gruenheid, S.; Strynakda, N.C.; Puente, J.L.; Finlay, B.B. Regulation of type III secretion hierarchy of translocators and effectors in attaching and effacing bacterial pathogens. Infect. Immun. 2005, 73, 2135–2146. [Google Scholar] [CrossRef] [PubMed]
- Langfelder, P.; Horvath, S. WGCNA: an R package for weighted correlation network analysis. BMC Bioinform. 2008, 9, 559. [Google Scholar] [CrossRef] [PubMed]
- Langfelder, P.; Zhang, B.; Horvath, S. Defining clusters from a hierarchical cluster tree: The Dynamic Tree Cut package for R. Bioinformatics 2008, 24, 719–720. [Google Scholar] [CrossRef] [PubMed]
- Huang, D.W.; Sherman, B.T.; Lempicki, R.A.; Wang, J.T.; Ramage, D.; Amin, N.; Schwikowski, B.; Ideker, T. Systematic and integrative analysis of large gene lists using DAVID bioinformatics resources. Nat. Protoc. 2009, 4, 44–57. [Google Scholar] [CrossRef] [PubMed]
- Shannon, P.; Markiel, A.; Ozier, O.; Baliga, N.S.; Wang, J.T.; Ramage, D.; Amin, N.; Schwikowski, B.; Ideker, T. Cytoscape: A software environment for integrated models of biomolecular interaction networks. Genome Res. 2003, 13, 2498–2504. [Google Scholar] [CrossRef] [PubMed]
| Module (No. Probes) | GO Term (Benjamini-Adjusted p-Value) | KEGG (Adjusted p-Value) | ||
|---|---|---|---|---|
| Biological Process | Cellular Component | Molecular Function | ||
| Black (3608) | Carbohydrate catabolic process (8.5 × 10⁻¹²) | Plasma membrane (4.9 × 10⁻³⁰) | Cation binding (6.8 × 10⁻⁴) | Two-component system (3.7 × 10⁻³¹) |
| Blue (1215) | Biological adhesion (3.6 × 10⁻²) | External encapsulation structure part (2.7 × 10⁻²) | — | Bacterial secretion system (3.4 × 10⁻¹⁷) |
| Brown4 (30) | Siderophore metabolic process (3.1 × 10⁻⁵) | — | Iron transmembrane transporter activity (6.5 × 10⁻⁶) | Lysine degradation (4.5 × 10⁻⁴) |
| Cyan (193) | Oxidation-reduction (9.3 × 10⁻⁴) | Anchored to membrane (2.9 × 10⁻²) | — | — |
| Darkgreen (154) | — | — | Purine nucleoside binding (1.9 × 10⁻³) | Lipopolysaccharide biosynthesis (1.8 × 10⁻⁴) |
| Darkgrey (78) | Lipopolysaccharide biosynthetic process (5.4 × 10⁻²³) | Organelle inner membrane (8.3 × 10⁻³) | Cell surface antigen activity, host-interacting (8.5 × 10⁻²⁹) | Lipopolysaccharide biosynthesis (1.2 × 10⁻¹¹) |
| Darkmagenta (48) | — | Viral capsid (2.0 × 10⁻⁵) | — | — |
| Darkolivegreen (49) | Sulfate metabolic process (2.3 × 10⁻³³) | — | Sulfate transmembrane transporter activity (2.1 × 10⁻⁵) | Sulfur metabolism (5.4 × 10⁻¹²) |
| Darkorange (74) | Pathogenesis (2.1 × 10⁻⁵) | — | — | Pathogenic E. coli infection (6.7 × 10⁻⁹) |
| Darkorange2 (999) | Phosphonate transport (2.5 × 10⁻⁶) | Peptidoglycan-based cell wall (5.9 × 10⁻¹¹) | — | ABC transporters (3.8 × 10⁻¹⁵) |
| Darkred (87) | Behavior (2.1 × 10−63) | Flagellum (4.1 × 10−51) | Motor activity (3.3 × 10⁻³²) | Flagellar assembly (1.4 × 10−67) |
| Darkturquoise (79) | Cellular amino acid biosynthetic process (1.4 × 10−66) | External encapsulating structure (1.2 × 10⁻²) | Acetolactate synthase activity (1.4 × 10⁻⁶) | Valine, leucine, and isoleucine biosynthesis (2.5 × 10⁻¹¹) |
| Green (678) | Translation (2.6 × 10−64) | Ribosome (2.4 × 10−59) | Structural constituent of ribosome (5.8 × 10−61) | Ribosome (2.4 × 10−56) |
| Greenyellow (258) | peptidoglycan-based cell wall (2.1 × 10⁻²) | |||
| Grey60 (101) | Iron ion transport (4.5 × 10⁻²) | — | Nucleoside binding (4.5 × 10⁻³) | ABC transporters (1.8 × 10⁻²) |
| Ivory (35) | Transition metal ion transport (1.4 × 10⁻¹⁴) | — | Iron ion binding (2.5 × 10⁻¹⁰) | Biosynthesis of siderophore group nonribosomal peptides (3.4 × 10⁻¹⁰) |
| Lightcyan1 (36) | Protein folding (4.2 × 10⁻⁶) | Zinc ion binding (9.2 × 10⁻⁴) | — | |
| Lightyellow (93) | Fatty acid oxidation (1.7 × 10⁻²) | Peptidoglycan-based cell wall (2.3 × 10⁻²) | Acyl carrier activity (1.5 × 10⁻¹⁰) | Benzoate degradation via CoA ligation (3.0 × 10⁻²) |
| Magenta (483) | Amine biosynthetic process (9.9 × 10⁻¹²) | Peptidoglycan-based cell wall (2.4 × 10⁻³) | Nucleoside binding (2.0 × 10⁻⁴) | Glycine, serine and threonine metabolism (1.2 × 10⁻⁴) |
| Orangered4 (38) | Nitrogen compound biosynthetic process (2.8 × 10⁻²⁴) | — | Anthranilate synthase activity (1.7 × 10⁻²) | Thiamine metabolism (4.4 × 10⁻¹⁰) |
| Paleturquoise (56) | Glycerol metabolic process (6.3 × 10⁻⁷) | — | Glycerol-3-phosphate dehydrogenase activity (8.0 × 10⁻⁵) | Glycerophospholipid metabolism (1.4 × 10⁻³) |
| Plum1 (40) | Anaerobic respiration (1.3 × 10⁻²) | Nitrate reductase complex (3.8 × 10⁻²) | — | — |
| Sienna3 (46) | Anaerobic respiration (1.1 × 10⁻²) | — | Metal cluster binding (2.2 × 10⁻⁶) | Butanoate metabolism (1.5 × 10⁻⁵) |
| Tan (295) | ncRNA metabolic process (4.3 × 10⁻¹³) | Plasma membrane (3.5 × 10⁻⁶) | RNA methyltransferase activity (7.1 × 10⁻⁵) | Mismatch repair (3.8 × 10⁻⁵) |
| Module | Gene | Encoding Protein |
|---|---|---|
| Black | Z4148 | Hypothetical protein |
| Blue | ECs1057 | Hypothetical protein |
| Brown4 | fhuF | Ferric iron reductase protein |
| Cyan | ECs2033 | Hypothetical protein |
| Darkgreen | elaA | Hypothetical protein |
| Darkgrey | rfbB | dTDP-glucose 4,6 dehydratase, NAD(P)-binding |
| Darkmagenta | c1590 | Tail component of prophage |
| Darkolivegreen | ssuC | Alkanesulfonate transporter permease |
| Darkorange | ECs4574 | SepD |
| Darkorange2 | c4484 | Aldolase |
| Darkred | ECs2660 | Flagella biosynthesis protein FliZ |
| Darkturquoise | ECs5231 | Ornithine carbamoyltransferase subunit I |
| Green | rpsN | 30S ribosomal protein S14 |
| Greenyellow | c0944 | Hypothetical protein |
| Grey60 | ECs1840 | Hypothetical protein |
| Ivory | fecR | Anti-sigma transmembrane signal transducer for ferric citrate transport; periplasmic FecA-bound ferric citrate sensor and cytoplasmic FecI ECF sigma factor activator |
| Lightcyan1 | ECs3950 | RNA polymerase sigma factor RpoD |
| Lightyellow | pepN | Aminopeptidase |
| Magenta | usg | Semialdehyde dehydrogenase |
| Orangered4 | ECs1854 | OMP decarboxylase |
| Paleturquoise | yagF | CP4-6 prophage |
| Plum1 | yebT | MCE domain protein |
| Sienna3 | ECs2379 | Hypothetical protein |
| Tan | ECs4128 | Acetyl-CoA carboxylase biotin carboxylase subunit |
© 2018 by the authors. Licensee MDPI, Basel, Switzerland. This article is an open access article distributed under the terms and conditions of the Creative Commons Attribution (CC BY) license (http://creativecommons.org/licenses/by/4.0/).
Share and Cite
Liu, W.; Li, L.; Long, X.; You, W.; Zhong, Y.; Wang, M.; Tao, H.; Lin, S.; He, H. Construction and Analysis of Gene Co-Expression Networks in Escherichia coli. Cells 2018, 7, 19. https://doi.org/10.3390/cells7030019
Liu W, Li L, Long X, You W, Zhong Y, Wang M, Tao H, Lin S, He H. Construction and Analysis of Gene Co-Expression Networks in Escherichia coli. Cells. 2018; 7(3):19. https://doi.org/10.3390/cells7030019
Chicago/Turabian StyleLiu, Wei, Li Li, Xuhe Long, Weixin You, Yuexian Zhong, Menglin Wang, Huan Tao, Shoukai Lin, and Huaqin He. 2018. "Construction and Analysis of Gene Co-Expression Networks in Escherichia coli" Cells 7, no. 3: 19. https://doi.org/10.3390/cells7030019
APA StyleLiu, W., Li, L., Long, X., You, W., Zhong, Y., Wang, M., Tao, H., Lin, S., & He, H. (2018). Construction and Analysis of Gene Co-Expression Networks in Escherichia coli. Cells, 7(3), 19. https://doi.org/10.3390/cells7030019


