Article

Mesenchymal Stromal Cells Improve Islet β-Cell Functional Survival: Analysis of Extracellular Vesicle-Trafficked Proteins and miRNAs


1
Department of Diabetes, School of Cardiovascular and Metabolic Medicine & Sciences, King’s College London, London SE1 1UL, UK
2
William Harvey Research Institute, Barts and the London School of Medicine and Dentistry, Queen Mary University of London, London EC1M 6BQ, UK
3
Institute of Clinical Sciences, Faculty of Medicine, Imperial College London, London W12 0HS, UK
4
UCL Institute of Ophthalmology, University College London, London EC1V 9EL, UK
*
Authors to whom correspondence should be addressed.
Cells 2026, 15(11), 992; https://doi.org/10.3390/cells15110992
Submission received: 17 April 2026 / Revised: 12 May 2026 / Accepted: 22 May 2026 / Published: 28 May 2026

Abstract

Type 1 diabetes is caused by autoimmune destruction of insulin-secreting β-cells within islets of Langerhans. Transplantation of donor islets can improve glycaemic control, but current clinical islet transplantation protocols are compromised by extensive loss of β-cell functional mass soon after implantation. Co-incubation in vitro or co-transplantation in vivo of mesenchymal stromal cells (MSCs) with isolated islets improves their functional survival, although the underlying mechanisms remain obscure. Here, we show that MSC-derived extracellular vesicles (MSC-EVs) are alone sufficient to recapitulate many of the beneficial effects of MSCs on islet functional survival, offering the possibility of simple cell-free treatments to improve the outcomes of islet transplantation. We used LC- analysis and small RNA sequencing to analyse the protein and microRNA (miRNA) molecular cargos of MSC-EVs. Proteomic analysis identified >100 proteins from the Uniprot Mouse Database, including β-cell G protein-coupled receptor (GPCR) agonists which we have previously shown to enhance β-cell functional survival. MSC-EVs contained ~300 distinct miRNAs and we identified five highly enriched miRNAs that were significantly upregulated in MSC-EV-treated islets, notably miR-21a-5p. MSC-EV treatment also altered the expression of a distinct set of islet mRNAs known to be involved in islet metabolism and function. These observations may enable the further simplification of the islet pretreatment strategy by focusing on defined GMP-grade biologically active molecules rather than whole heterogeneous EV populations.

1. Introduction

Islet transplantation has the potential to cure type 1 diabetes (T1D) and the clinical outcomes for islet graft recipients have been improving year-on-year. However, the function of isolated human islets is severely compromised by the islet isolation process, and transplanted islets are further compromised by the hypoxic, inflammatory host environment, with consequent deleterious effects on graft survival and clinical outcomes [1,2]. Improving islet survival and function pre- and post-transplantation will improve clinical outcomes for graft recipients. Mesenchymal stromal cells (MSCs) have regenerative and supportive roles in many different tissues and pathologies [3], and our previous experimental studies have demonstrated that co-transplanting MSCs with mouse islets improved graft functional survival [4,5]. However, the clinical co-transplantation of MSCs with islets is not currently feasible because of problems associated with localising MSCs to islets after intraportal delivery. In addition, it is undesirable because of the regulatory and clinical hurdles, such as immune load, associated with transplanting additional and different cells along with the human islets. We have therefore been focusing on understanding the mechanism(s) through which MSCs influence islet function with the aim of using this knowledge to enable scalable, cell-free pre-transplantation treatment of islet graft material to improve the functional survival of human islet grafts.
Our recent work has shown that a simple pretreatment of mouse or human islets with a defined cocktail of MSC-secreted bioactive peptides protected them against cytokine-induced apoptosis and enhanced insulin secretion in vitro and this approach had beneficial effects on glycaemic control in a mouse model of diabetes in vivo [4,5,6]. However, cocktails of MSC-derived molecules have so far failed to recapitulate entirely the effects of MSC-coculture or pretreatment on β-cell function, suggesting the existence of other mechanisms. Membrane-bound extracellular vesicles (EVs) are an alternative mechanism for cell–cell communication by delivering a variety of biologically active cargos between cells, and a recent publication has implicated MSC-derived EVs (MSC-EVs) as an important route of communication between MSCs and islet cells [7].
EVs are a heterogeneous population of secreted vesicles with molecular cargos that include biologically active peptides and proteins, and microRNAs (miRNAs) [8,9]: small non-coding RNA molecules that regulate the transcription and translation of specific gene networks and which have been implicated in β-cell function. In this study, we investigated the active cargo components of MSC-EVs, with a focus on peptides/proteins and miRNAs that may be involved in the regulation of islet function. Identification of novel molecules that recapitulate the effects of MSCs and/or MSC-EVs should lead to fully defined, simple pretreatment of islet grafts without the requirement for MSCs or MSC-EVs.

2. Materials and Methods

2.1. Materials

Culture medium (DMEM and supplements), LIVE/DEAD viability assay and Total Exosome isolation kits were supplied by Thermo Fisher Scientific (Loughborough, UK) RPMI 1640 medium, collagenase type XI, and histopaque-1077 were supplied by Sigma Aldrich (Gillingham, UK). Matrigel was supplied by Corning (Amsterdam, The Netherlands). Mouse bone marrow-derived MSCs were supplied by Abbexa (Cambridge, UK). CD1 mice were from Charles River (Kent, UK). Interleukin 1-beta, interferon-gamma and tumour necrosis factor-alpha were from Peprotech (London, UK). Total RNA was extracted with the miRNeasy Mini Kit (Qiagen, Hilden, Germany). The Seahorse XFe96 extracellular flux reagent, XF basal medium and Seahorse XF Mito Stress Test kit were from Agilent Technologies (Santa Clara, CA, USA). The Caspase-Glo assay was supplied by Promega (Southampton, UK).

2.2. MSC Culture and Mouse Islet Isolation

Mouse bone marrow (bm) MSCs, which we have characterised previously [6], were maintained in culture (37 °C/5% CO2) in DMEM supplemented with 1% penicillin/streptomycin solution and 10% FBS. Mouse islets were isolated from 10- to 16-week-old male CD1 mice by collagenase digestion of pancreases as previously described [4]. Briefly, pancreases were perfused with 1 mg/mL collagenase in RPMI 1640 medium via injection through the bile duct, then digested at 37 °C for 10 min and islets were separated using Histopaque-1077 density gradients. Islets were washed in RPMI 1640 medium supplemented with 10% FBS and 1% penicillin/streptomycin before maintenance in culture overnight (37 °C/5% CO2).

2.3. Total EV Isolation

20 mL of conditioned medium (CM) was collected from 32 × 106 mouse bone marrow mesenchymal stromal cells (bmMSCs) in 4xT75 flasks after 48 h incubation in DMEM. The medium was sequentially centrifuged for 10 min at 300× g then 2000× g to remove cellular debris. MSC-derived EVs were purified from CM using a Total Exosome isolation kit (Thermo Fisher Scientific, Loughborough, UK) according to the manufacturer’s instructions. Precipitated EV samples were centrifuged at 16,000× g for 1 h at 4 °C. EV pellets were resuspended in 100 µL PBS and stored at −80 °C prior to characterisation and analysis.

2.4. Nanoparticle Tracking Analysis (NTA)

A NanoSight LM10 Nanoparticle Characterisation System (Malvern, Worcestershire, UK) fitted with an electron multiplication charge-coupled device camera, and a 635 nm laser were used to determine the concentration and size distributions of isolated MSC-EVs. EVs derived from 32 × 106 bmMSCs were diluted 1:1000 with PBS to a final volume of 1 mL and infused at room temperature on a syringe driver pump at a flow rate of 25 µL/s. The camera level was set to 7, gain to 1 with a detection threshold of 5–6. At least 3 videos were recorded for each sample using static mode. All EV samples passed the QC of >5 × 10⁹ particles/mL prior to cargo analyses.

2.5. Transmission Electron Microscopy

MSC-EVs (2 × 10⁹ particles/mL) in 100 µL PBS suspension were pipetted onto electron microscopy grids coated with formvar and left for 30 min at room temperature. 4% paraformaldehyde was added to the grids for 20 min before incubating with 20 mM glycine for 5 min at room temperature. The EVs were further fixed by placing in 1% glutaraldehyde in cacodylate buffer for 30 min and stained with UA-Zero for 1 min. Images were acquired using a JEOL 1400+ transmission electron microscope (Tokyo, Japan) fitted with an Advanced Microscopy Technologies (AMT) NanoSprint12 camera (Woburn, MA, USA).

2.6. Glucose-Stimulated Insulin Secretion

For quantification of glucose-stimulated insulin secretion, mouse islets were preincubated for 2 h in a physiological salt solution containing 2 mM glucose, 2 mM CaCl2, and 0.5 mg/mL BSA (Gey and Gey buffer [10]) to establish basal levels of insulin secretion. Groups of five islets were then incubated for 1 h at 37 °C in Gey and Gey buffer supplemented with either 2 or 20 mM glucose, then supernatants were retrieved for quantification of insulin secretion by radioimmunoassay, as previously described [11].

2.7. Islet Apoptosis and Viability

Induction of islet apoptosis by inflammatory cytokines was assessed by measuring caspase 3/7 activities using a Caspase-Glo assay, as previously described [11]. Briefly, mouse islets were pre-cultured alone or with MSC-derived EVs for 72 h. For the final 20 h of the culture period, half of the islets were exposed to 50 U/mL IL-1beta, 1000 U/mL interferon-gamma and 1000 U/mL tumour necrosis factor-alpha. Groups of five islets were hand-picked into 96-well plates before Caspase-Glo 3/7 reagent was added. After 1 h incubation at 37 °C, light emission was detected using a Turner Biosystems Veritas microplate luminometer (San Jose, CA, USA).
Islet cell viability was visualised using a LIVE/DEAD viability assay (Thermo Fisher Scientific, Loughborough, UK) according to the manufacturer’s recommendations. Briefly, isolated mouse islets were washed with PBS and incubated with staining solution containing calcein-AM and ethidium homodimer-1. Samples were incubated in the dark at room temperature for 30 min, excess dye was removed by washing with PBS and then fluorescence signals were detected using a confocal microscope (AXR with NSPARC). Viable cells were identified by intracellular green fluorescence resulting from calcein-AM cleavage by intracellular esterases, whereas dead or membrane-compromised cells exhibited red fluorescence due to ethidium homodimer-1 binding to nucleic acids.

2.8. Islet Mitochondrial Bioenergetics

Mouse islet oxygen consumption rate (OCR) was assessed using a Seahorse XFe96 Extracellular Flux Analyzer (Agilent Technologies, Santa Clara, CA, USA). For the assay, approximately 20–40 islets with basal OCR values ranging from 50 to 150 pmol/min were picked into Matrigel-coated Seahorse XF96 microplates (Agilent Technologies, Santa Clara, CA, USA) and maintained overnight in RPMI 1640 medium to allow attachment. Islets were then incubated for 1 h in XF basal medium containing 2 mM glucose to permit metabolic equilibration, and mitochondrial respiration was monitored by measuring OCR at 2 mM glucose and 20 mM glucose. Mitochondrial function was evaluated in the presence of 1.5 µM oligomycin, to inhibit ATP synthase, 2µM carbonyl cyanide-4-(trifluoromethoxy) phenylhydrazone (FCCP), to uncouple mitochondrial respiration, and 0.5 µM rotenone, to block complex I of the electron transport chain. All compounds were prepared in XF basal medium. The resulting Seahorse data were processed and analysed using Wave software (Agilent, version 2.6).

2.9. Proteomic Analysis

MSC-EVs (50 ng, n = 4) in 200 µL PBS suspension were sent for proteomic analysis by the King’s College London Proteomics Facility. Cysteine residues of proteins within the EVs were reduced with dithiothreitol and derivatised by treatment with iodoacetamide to form stable carbamidomethyl derivatives. Trypsin digestion was conducted overnight at 37 °C and chromatographic separation of 1 µg of extracted peptide samples was performed using a U3000 UHPLC NanoLC system (Thermo Fisher Scientific, Loughborough, UK). Peptides were resolved by reversed-phase chromatography on a 75 µm C18 Pepmap 50 cm column using a three-step linear gradient of 80% acetonitrile in 0.1% formic acid. The gradient was delivered to elute the peptides at a flow rate of 250 nL/min over 60 min starting at 5% B, then 7% B at 3 min and 40% B at 40 min, followed by a hydrophilic wash at 90% B (40.1–45 min) and an equilibration step at 5% B (45.1–60 min). The eluate was ionised by electrospray ionisation using an Orbitrap Eclipse Tribrid (Thermo Fisher Scientific, Loughborough, UK) operating under Xcalibur v4.7. The instrument was first programmed to acquire using an Orbitrap-Ion Trap method by defining a 3 s cycle time between a full MS scan and MS/MS fragmentation by collision-induced dissociation. Orbitrap spectra (FTMS1) were collected at a resolution of 120,000 over a scan range of m/z 350–1600 with an automatic gain control (AGC) setting of 4 × 10⁵ (100%) with a maximum injection time of 50 ms. Monoisotopic precursor ions were filtered using charge state (+2 to +7) with an intensity threshold set between 5 × 10³ and 1 × 10²⁰ and a dynamic exclusion window of 35 s ± 10 ppm. MS2 precursor ions were isolated in the quadrupole set to a mass width filter of 1.6 m/z. Ion trap fragmentation spectra (ITMS2) were collected with an AGC target setting of 1 × 10⁴ (100%), with a maximum injection time of 35 ms and CID collision energy set at 35%.
Raw mass spectrometry data were processed into peak list files using Proteome Discoverer (Thermo Scientific; v2.5). The raw data file was processed and searched using the Sequest search algorithm [12] against entries in the Uniprot Mouse Taxonomy database. Database searching was performed at a stringency of 1% false discovery rate (FDR) including a decoy search. Post-translational modifications for carbamidomethylation (C; static) and oxidation (M; variable) were included in the database search.

2.10. RNA Analysis of bmMSC-EVs and Mouse Islets

Total RNA was extracted by TAmiRNA (Vienna, Austria) from groups of 5 × 10⁹ particles/mL bmMSC-EVs (in 500 µL PBS) and 100 mouse islets using the miRNeasy Mini Kit according to the manufacturer’s instructions. Total RNA eluted from miRNeasy mini columns in 30 µL nuclease-free water was stored at −80 °C. RNA quality and concentration were analysed with an Agilent Fragment Analyzer (Santa Clara, CA, USA).

2.11. Small RNA Sequencing Analysis

1 µL of miND spike-in standards (TAmiRNA, Vienna, Austria) was added to total RNAs isolated from EV and islet samples prior to small RNA library preparation using the RealSeq Biofluids library preparation kit (RealSeq Biosciences (Santa Cruz, CA, USA)/BioCat Cat. 600-00048-SOM, Heidelberg, Germany). Adapter-ligated libraries were amplified using barcoded Illumina reverse primers in combination with the Illumina forward primer. Library quality control was performed using a Small Fragment Kit (Agilent Technologies, Santa Clara, CA, USA). An equimolar pool consisting of all sequencing libraries was prepared and sequenced in single read mode with 100 cycles on an Illumina NextSeq 2000 P2 Flowcell (San Diego, CA, USA).

2.12. mRNA Sequencing Analysis

The QuantSeq 3′ mRNA-Seq V2 Library Prep Kit FWD with Unique Dual Indices (Lexogen, Vienna, Austria) was used for library preparation, with an input of 50 ng per sample. Briefly, after reverse transcription, the resulting cDNA was purified using magnetic beads, amplified with 14 PCR cycles, then purified again to remove any remaining contaminants. The quality of the prepared libraries was assessed using a High Sensitivity NGS Fragment Kit (Agilent Technologies, Santa Clara, CA, USA). Sequencing of an equimolar pool of all libraries was performed in single-read mode with 100 cycles on an Illumina NextSeq 2000 P2 Flowcell (San Diego, CA, USA).

2.13. Bioinformatics

2.13.1. Small RNA-Sequencing (miND)

Overall quality of the next-generation sequencing (NGS) data was evaluated automatically and manually with fastQC v0.12 [13] and multiQC v1.14 [14]. Reads from all passing samples were adapter trimmed and quality filtered using cutadapt v3.3 [15] and filtered for a minimum length of 17 nt. Mapping steps were performed with bowtie v1.3.0 [16] and miRDeep2 v2.0.1.2 [17], whereas reads were mapped first against the genomic reference GRCm38.p6 provided by Ensembl [18] allowing for two mismatches and subsequently miRBase v22.1 [19], filtered for miRNAs of the reference only, allowing for one mismatch. For a general RNA composition overview, non-miRNA-mapped reads were mapped against RNAcentral v23.0 [20] and then assigned to various RNA species of interest. Statistical analysis of preprocessed NGS data was done with R v4.0 and the packages pheatmap vNA, pcaMethods v1.82 and genefilter v1.72. Differential expression analysis with edgeR v3.32 [21] used the quasi-likelihood negative binomial generalised log-linear model functions provided by the package. The independent filtering method of DESeq2 [22] was adapted for use with edgeR to remove low abundance miRNAs and thus optimise the FDR correction. Additional NGS QC and absolute quantification of miRNAs was done using miND® spike-ins [23] based on a linear regression model.

2.13.2. mRNA-Sequencing (meND)

For mRNA sequencing analysis reads from all passing samples were adapter trimmed and quality filtered using bbduk from the bbmap package v38.69 [24] and filtered for a minimum length of 17 nt and phred quality of 30. Alignment steps were performed with STAR v2.7 [25] using samtools v1.9 [26] for indexing, whereas reads were mapped against the genomic reference GRCm38.p6 provided by Ensembl [18]. Assignment of features to the mapped reads was done with htseq-count v0.13 [27]. Differential expression analysis with edgeR v3.40 [21] used the quasi-likelihood negative binomial generalised log-linear model functions provided by the package. The independent filtering method of DESeq2 [22] was adapted for use with edgeR to remove low abundance genes and thus optimise the FDR correction.

2.13.3. miRNA-mRNA Interaction Analysis

Target genes of the most abundant EV miRNAs as well as differentially expressed miRNAs were identified using miRNAtap v1.42.0 [28]. This tool integrates five miRNA–mRNA interaction databases: DIANA [29], Miranda [30], PicTar [31], TargetScan [32] and miRDB [33]. Only target genes predicted by at least three of the five databases were retained for downstream analysis. To identify potential functional miRNA–mRNA interactions, the miRNA results were integrated with differential expression data from mRNA sequencing. The interactions were visualised as chord diagrams using the R package chorddiag v0.1.3.

2.14. Statistical Analysis

Statistical analysis was carried out using Student’s t-test to compare two groups or one way analysis of variance (ANOVA) test for multi-group comparisons, and p < 0.05 was considered statistically significant. All data are expressed as means ± SEM.

3. Results

3.1. Isolation and Characterisation of bmMSC-EVs

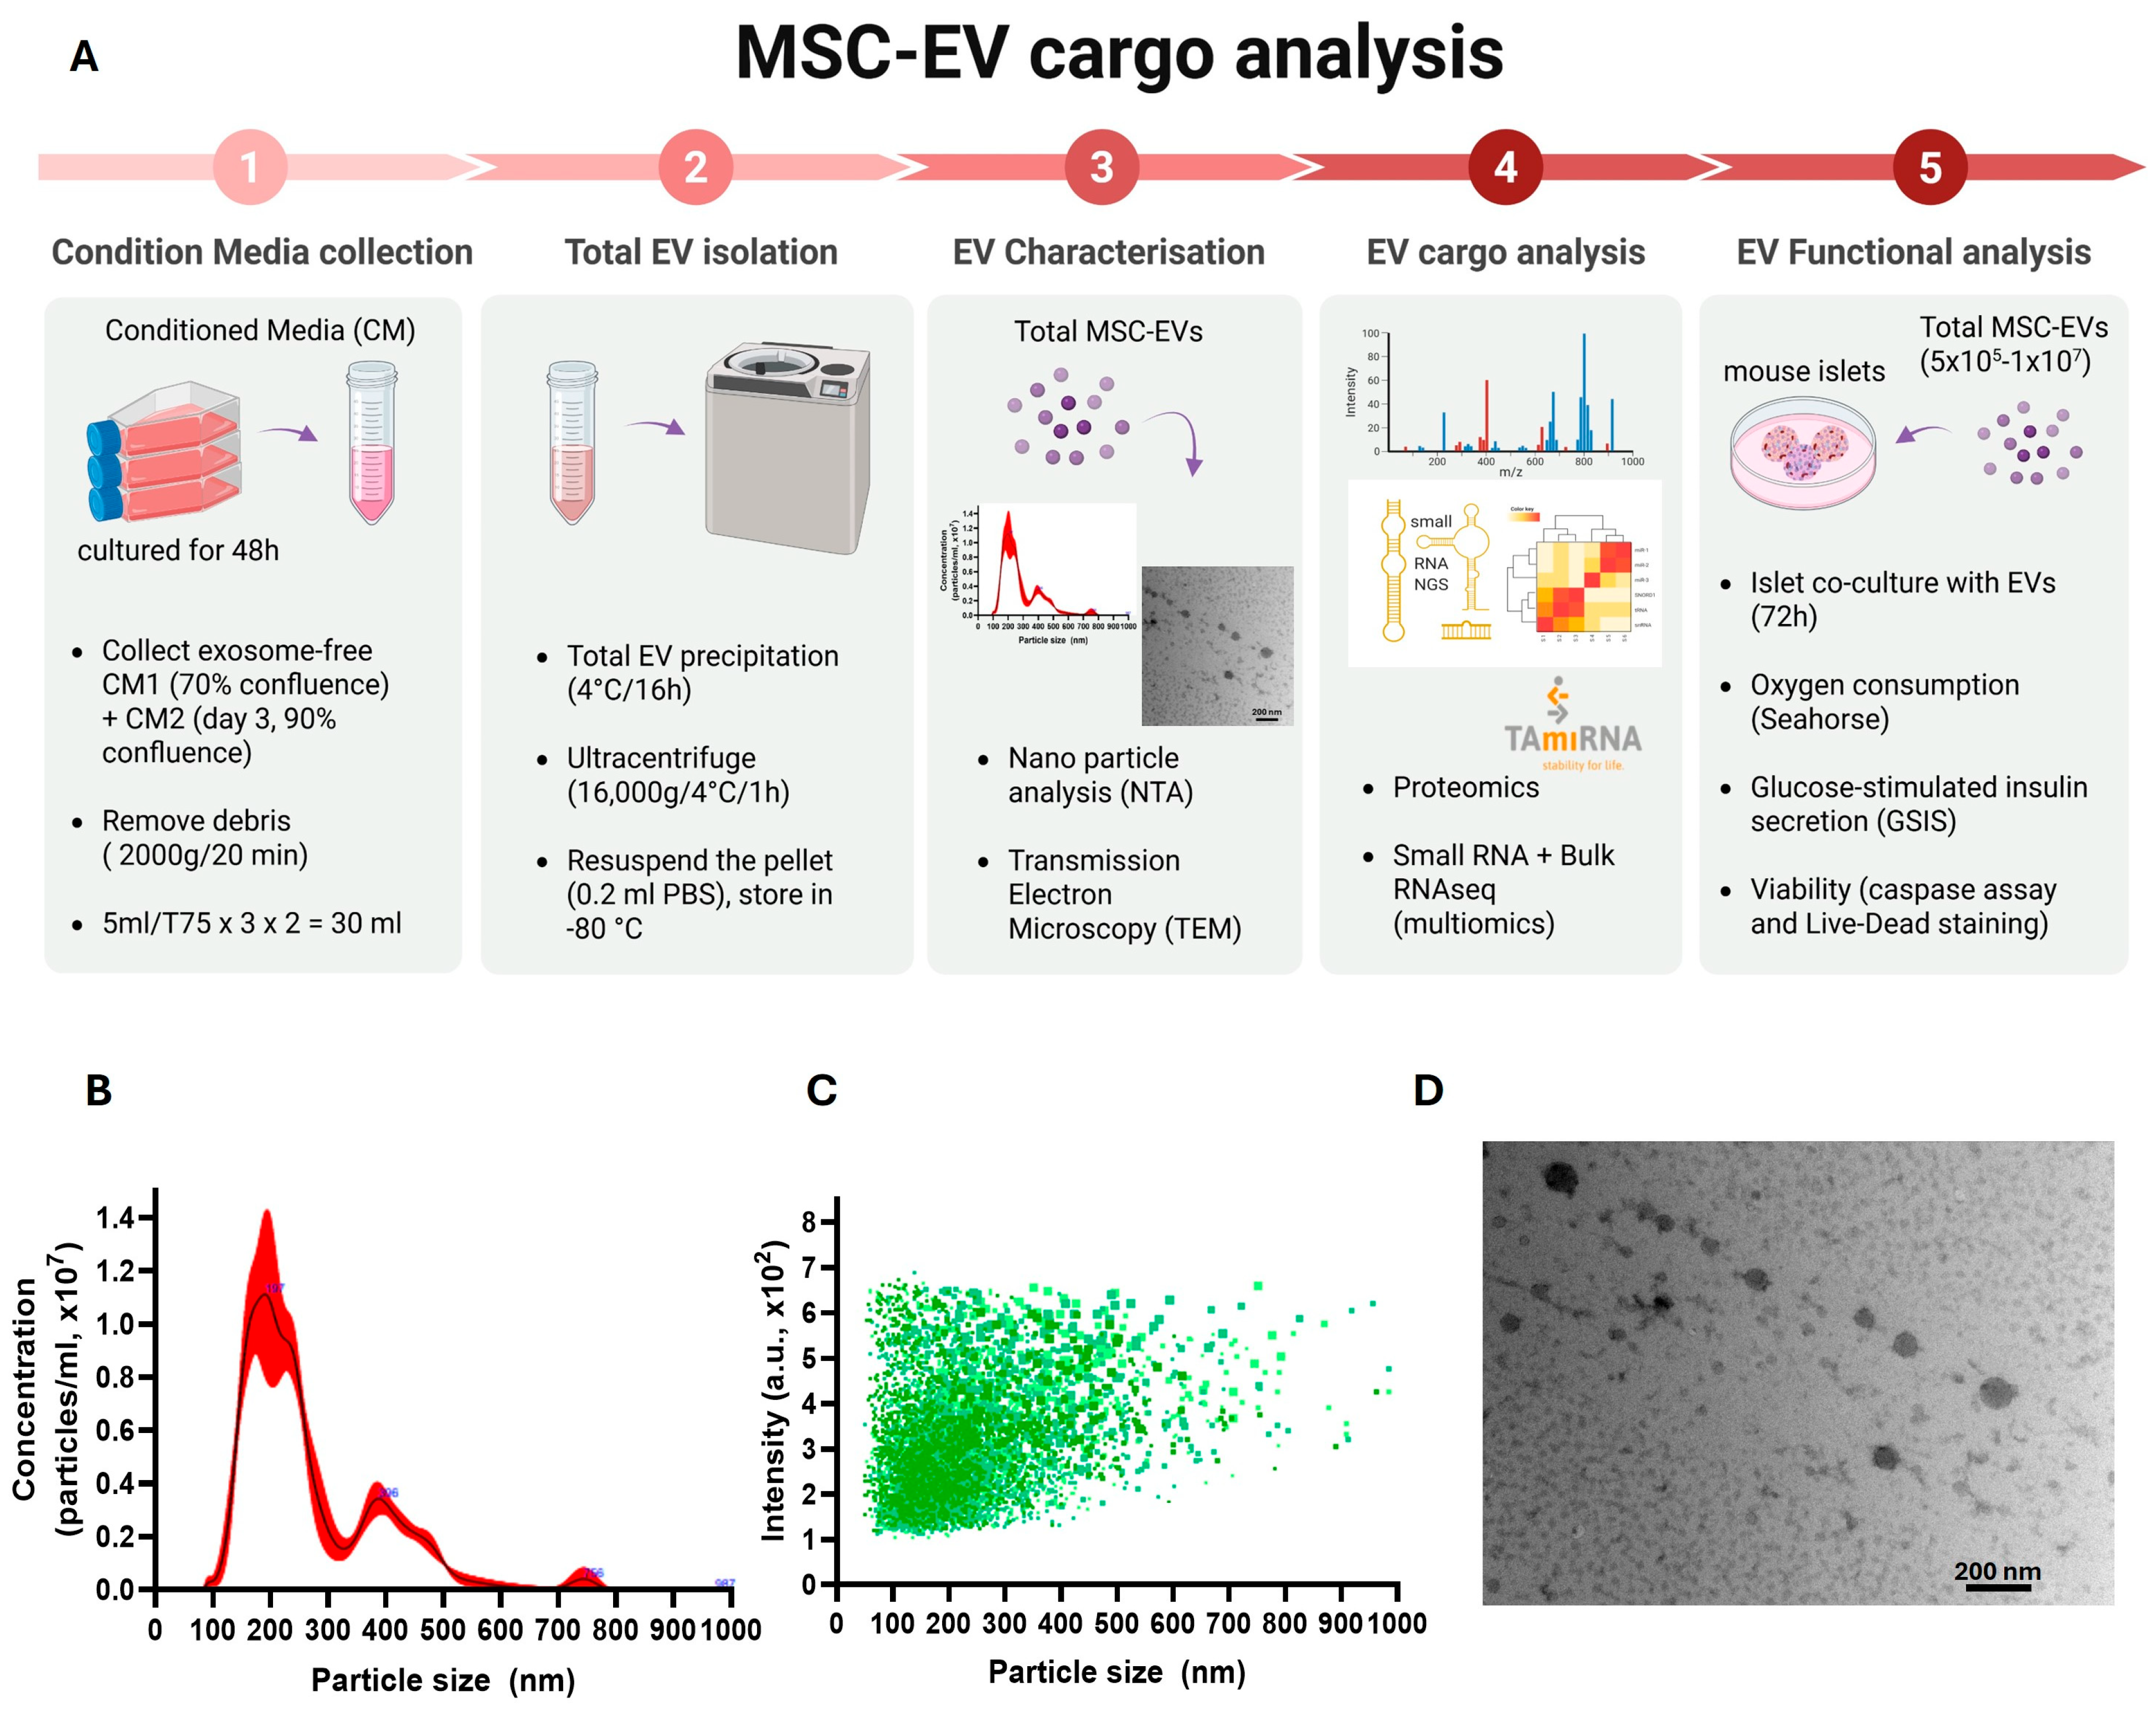
Total EVs were isolated from mouse bmMSCs (passages 8–14) using a total EV isolation kit (Figure 1A), then characterised with nanoparticle tracking analysis (NTA; Figure 1B,C) and transmission electron microscopy (TEM; Figure 1D). NTA revealed a heterogeneous population of particles with a predominant size distribution in the ~100–300 nm range, with a smaller proportion of larger particles extending beyond 400 nm (Figure 1B). Repeated measurements from three samples prepared from separate MSC populations showed comparable size profiles, indicating good consistency between samples. Scatter plots of particle size versus scattering intensity demonstrated a broad distribution of intensities at similar particle sizes (Figure 1C), reflecting heterogeneity in particle composition and optical properties within the sample. TEM analysis further confirmed the presence of vesicle-like structures, revealing round to cup-shaped particles with variable diameters, consistent with EV morphology (Figure 1D). Together, these data confirmed the successful isolation of a heterogeneous population of MSC-EVs.

3.2. Effects of MSC-EV Treatment on Mouse Islet Function

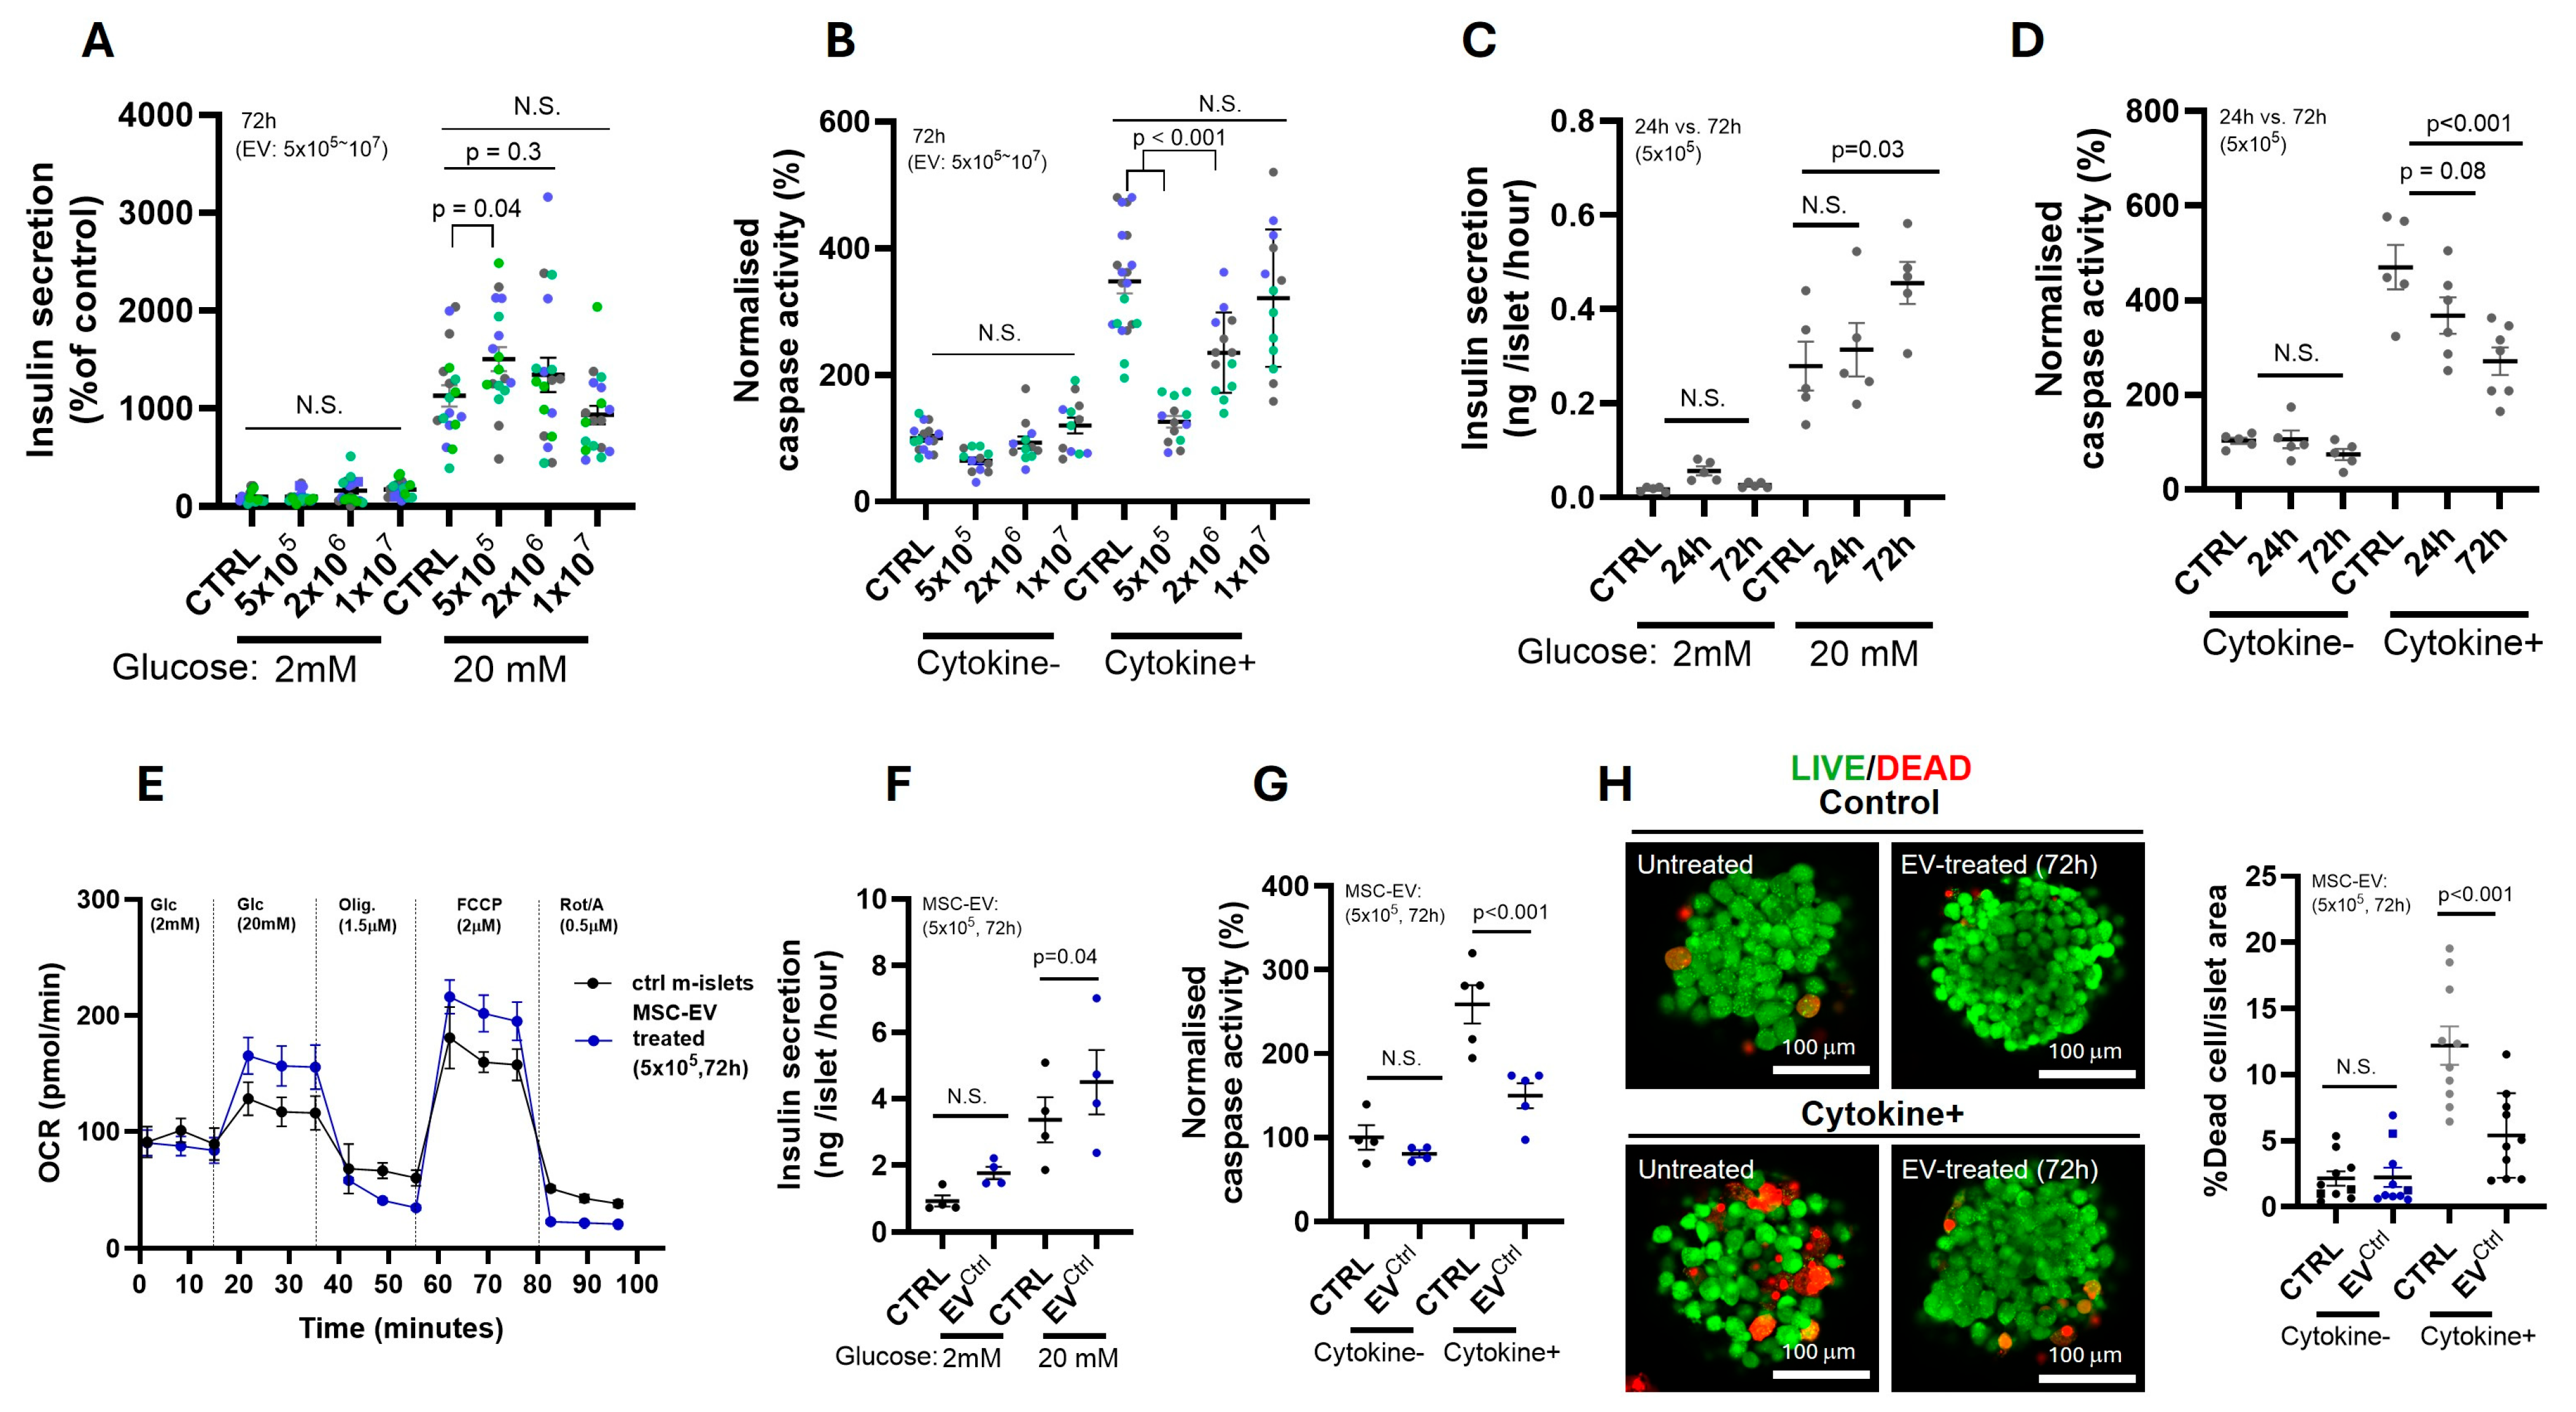
The effects of MSC-EVs on islet function were assessed in vitro. Dose-dependent experiments with three separate preparations of MSC-EVs were initially carried out to determine the most appropriate MSC-EV concentrations for subsequent experimental use. For these determinations, mouse islets were incubated with 5 × 10⁵ to 1 × 10⁷ particles/mL of MSC-EVs for 72 h after which quantifications of insulin secretion were carried out. Figure 2A shows that MSC-EVs had no effect on basal insulin secretion at 2 mM glucose. However, treatment with 5 × 10⁵ particles/mL of MSC-EVs significantly enhanced 20 mM glucose-stimulated insulin secretion, an effect that was not observed with either 2 × 10⁶ or 1 × 10⁷ particles/mL (Figure 2A). Similarly, MSC-EV treatments had no effect on basal levels of mouse islet apoptosis, but 5 × 10⁵ and 2 × 10⁶ particles/mL MSC-EV treatment significantly protected islets against cytokine-induced apoptosis (Figure 2B). In contrast, 1 × 10⁷ particles/mL of MSC-EVs did not significantly affect cytokine-stimulated mouse islet apoptosis. Furthermore, the time course experiments showed that reducing the time of exposure of islets to MSC-EVs from 72 h to 24 h did not lead to an improvement in insulin secretion (Figure 2C), nor to reduced cytokine-induced apoptosis (Figure 2D). Since treatment of islets with 5 × 10⁵ particles/mL of MSC-EVs for 72 h had consistent beneficial effects on islet functional survival (Figure 2A–D), all further functional, proteomics and miRNA analysis experiments used this pretreatment regimen (Figure 2E–H).
Insulin secretion is critically dependent on β-cell mitochondrial activity, so we assessed the effects of MSC-EVs on mouse islet mitochondrial respiration using a Seahorse XFe96 Extracellular Flux Analyzer. Exposure of mouse islets to 5 × 10⁵ particles/mL of MSC-EVs for 72 h increased both glucose-stimulated OCR (15–35 min, Figure 2E) and maximal respiratory capacity induced by FCCP (55–80 min, Figure 2E). This batch of MSC-EVs also significantly potentiated glucose-induced insulin secretion from mouse islets (Figure 2F) and reduced islet caspase activity after challenge with cytokines (Figure 2G), consistent with the data in Figure 2A–D. Visualisation of islet cell viability with LIVE/DEAD staining confirmed the protective effect of incubating islets with 5 × 10⁵ particles/mL of MSC-EVs for 72 h against cytokine-induced islet cell death (Figure 2H).

3.3. Proteomics Analysis of MSC-EVs

We next focused on analysing the cargos of MSC-EVs that might be responsible for these biological effects, using the same batch of MSC-EVs that had been used for the functional experiments shown in Figure 2E–H. For proteomics analysis, MSC-EVs underwent in-solution reduction, alkylation and trypsin digestion in preparation for LC-MS analysis, then label-free quantitation was performed to rank relative protein abundance. Comparison of the proteomics data against the Uniprot Mouse Database confidently identified 105 proteins within bmMSC-EVs. The top 60 most abundant proteins are shown in Table 1 ranked by their abundance, which indicates a preponderance of extracellular matrix (ECM) proteins (e.g., fibronectin, fibulins and collagen alpha chains), scaffolding proteins (e.g., filamins, myosin-9, actin, tubulin alpha chain) and ECM regulators (e.g., thrombospondins). In addition, the proteomics analysis identified that MSC-EVs contain complement 3, the parent protein of the biologically active peptide C3a, and annexin A1 (highlighted in bold in Table 1), two peptides that we have previously shown to improve islet function in vitro and in vivo [11], suggesting that MSC-EVs carry functional peptides that may contribute to the beneficial effects of MSCs on islets.

3.4. Differential miRNA Expression in MSC-EV-Treated Islets

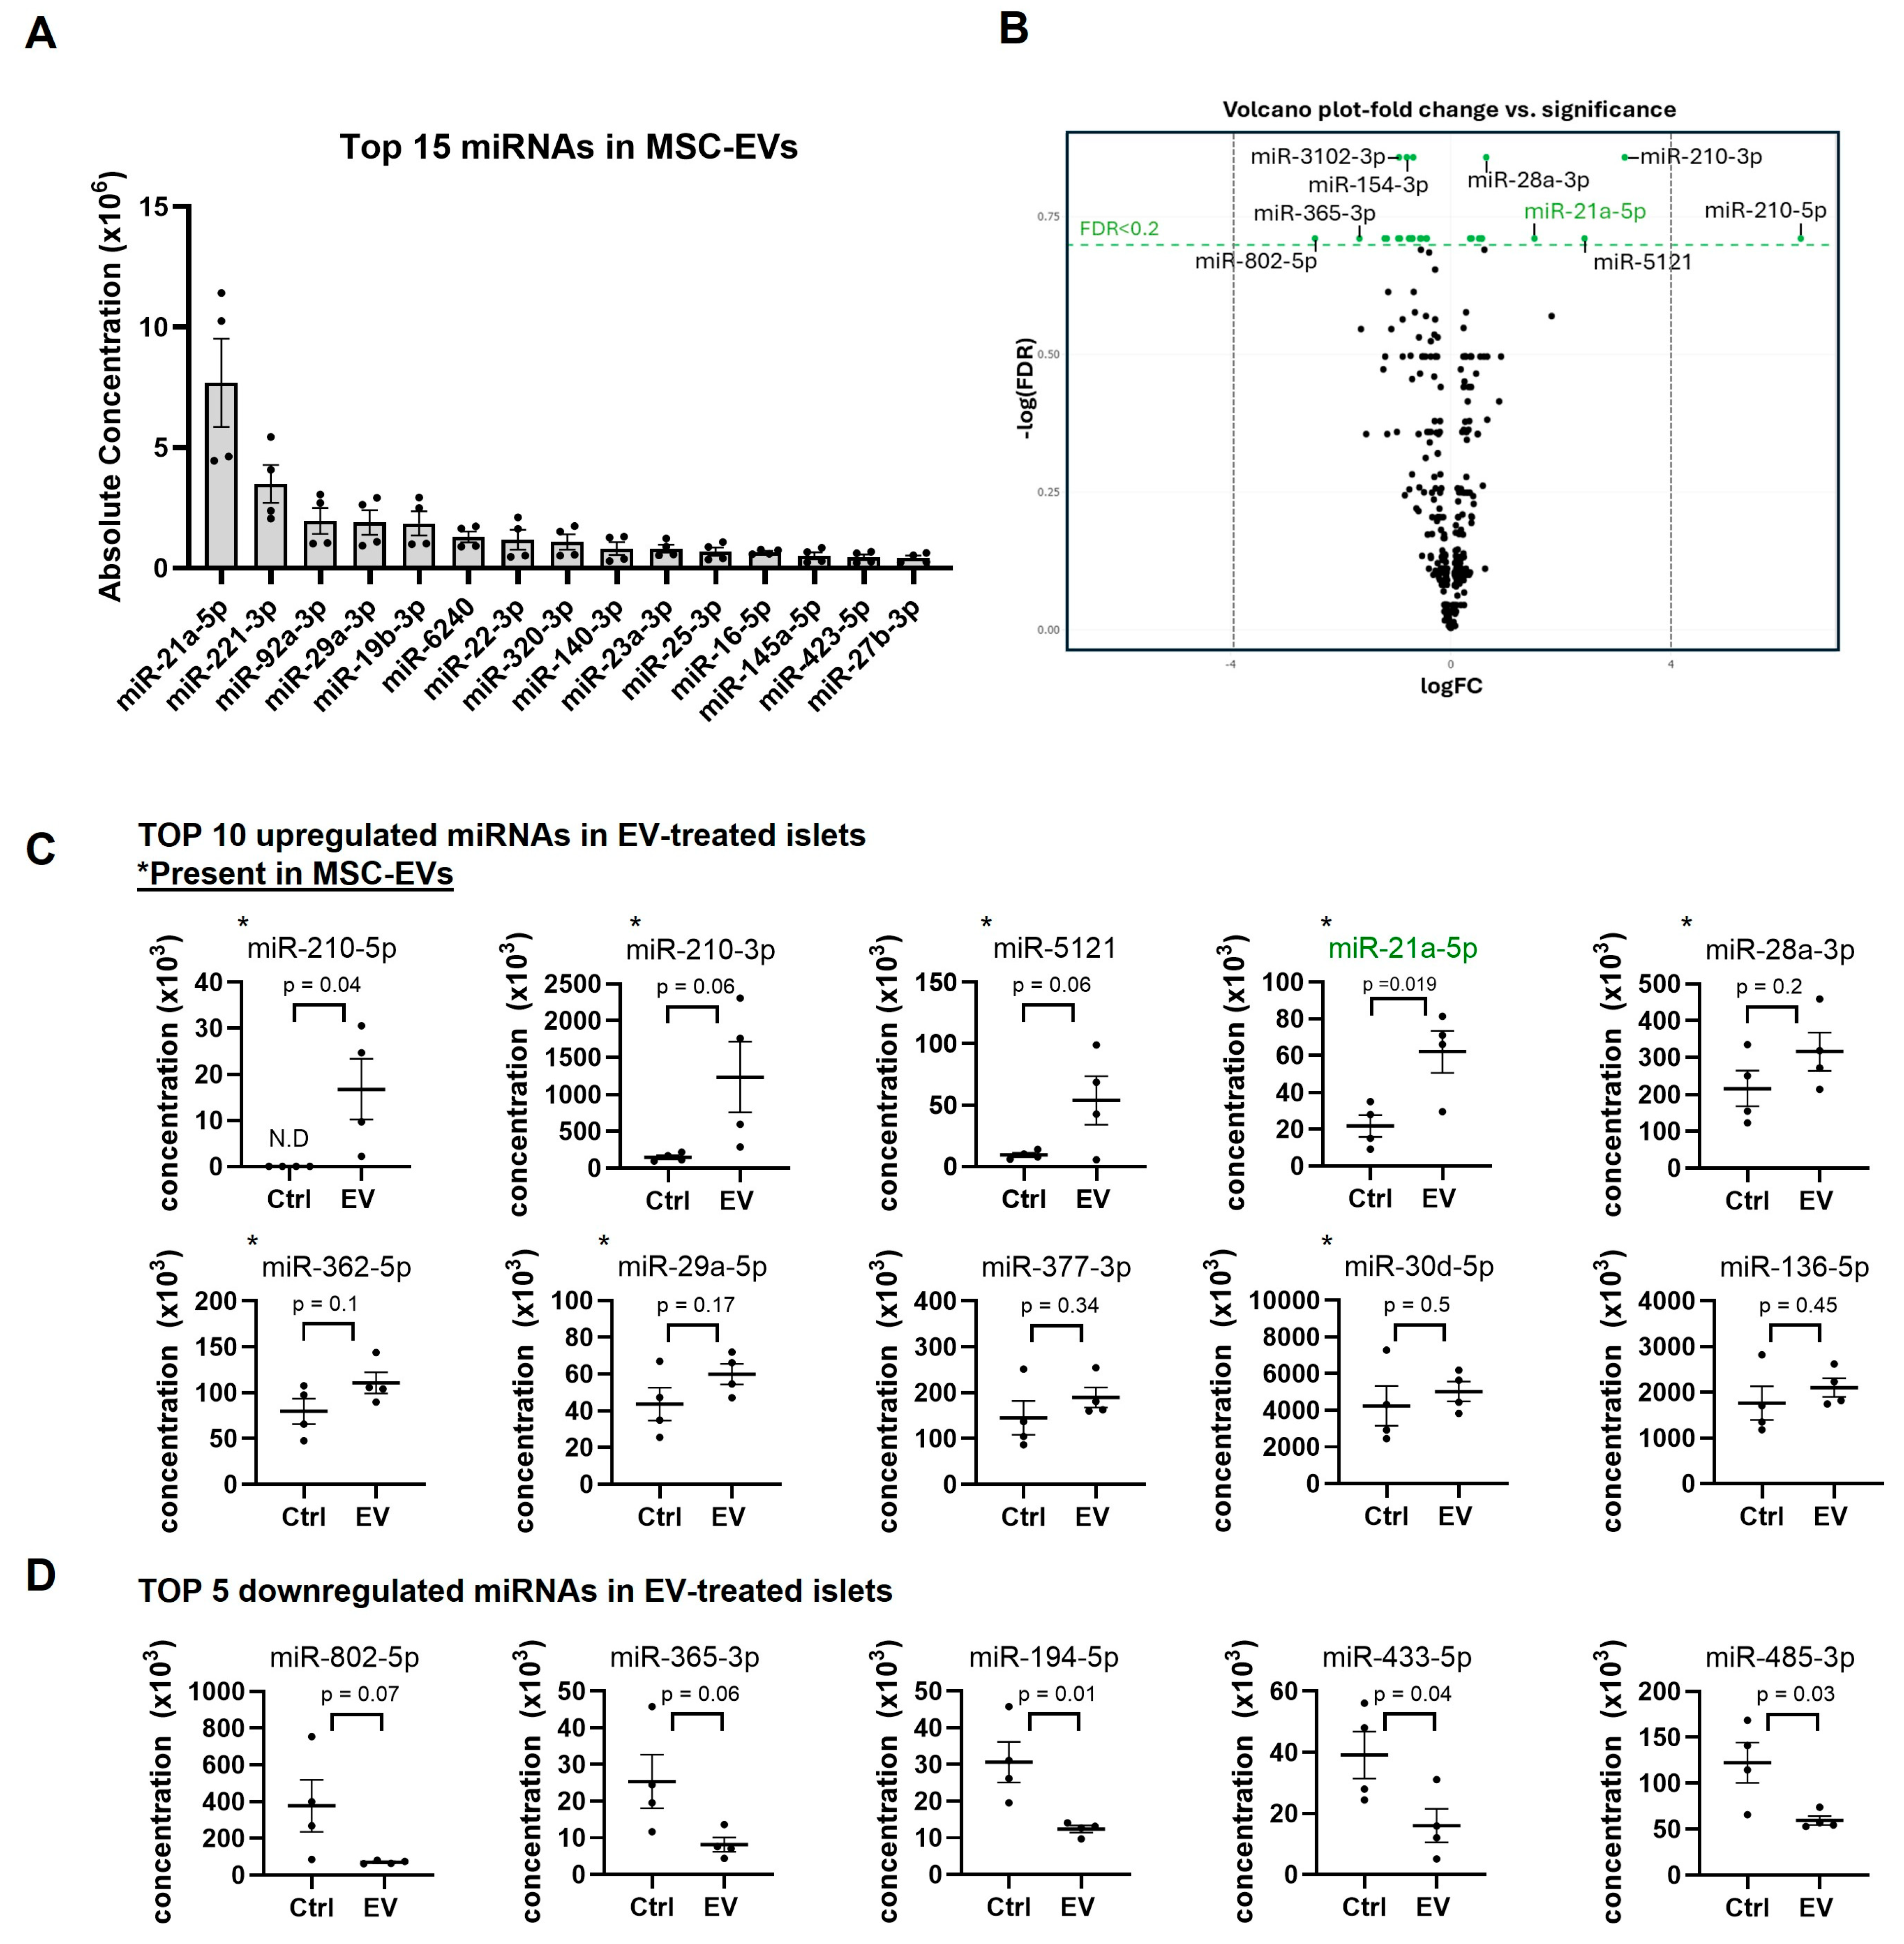
Since miRNAs are one of the most common regulatory cargos trafficked by EVs [34], we also carried out small RNA sequencing in MSC-EVs, and also in islets that had been incubated for 72 h in the absence or presence of MSC-EVs (5 × 10⁵ particles/mL), to identify whether modification of islet miRNA expression in response to MSC-EV treatment could be responsible for improved islet function and survival. Analysis of the small RNA sequencing data showed distinct read composition profiles in the MSC-EVs and mouse islets (Figure S1). Thus, in the MSC-EV samples (Figure S1A) at least 60% of the reads were unmapped and the mapped reads largely corresponded to various small RNA species, the most abundant of which were rRNAs, which are essential for protein synthesis. Overall, miRNAs represented a minority population within the MSC-EV small RNA annotated reads, but it was possible to detect 322 miRNAs in MSC-EVs. The 15 most abundant miRNAs identified in MSC-EVs are shown in Figure 3A, while Figure S2A shows a broader profile that includes the 60 most highly expressed miRNAs. Expression of the most abundant MSC-EV miRNA, miR-21a-5p, was approximately two-fold that of the second highest miRNA, miR-221-3p. These data confirmed that bmMSC-EVs contain a range of quantifiable small RNAs and miRNAs.
Mouse islets also contained a range of small RNAs and, similar to MSC-EVs, rRNAs were the predominant RNA species identified (Figure S1B). There was some variability between the four samples of control islets and four samples of MSC-EV-treated islets, but the relative proportions of RNA biotypes were consistent within the experimental groups (Figure S1B), indicating reproducible library compositions. More than 500 miRNAs were detected in both control and EV-treated islets and Figure S2B,C show the 60 most highly expressed miRNAs in these groups of islets. It is clear that MSV-EVs (Figure S2A) have a different miRNA profile to mouse islets, where miR-375-3p and miR-148a-3p, two well-studied islet miRNAs [35,36], were the most abundant miRNAs in islets both before and after MSC-EV treatment. However, differential expression analysis revealed distinct changes in miRNA profiles between control islets and those that had been exposed to MSC-EVs for 72 h (Figure 3B–D). Volcano plot analysis identified multiple miRNAs that were significantly upregulated or downregulated following MSC-EV treatment based on log2 fold change and FDR < 0.2 (Figure 3B). The greatest increases in expression were seen in miR-210-5p, miR-210-3p, miR-5121, miR-21a-5p and miR-28a-3p (Figure 3B,C), whereas a subset of miRNAs showed significant downregulation (Figure 3B,D). The majority of the top 10 miRNAs upregulated in islets after MSC-EV treatment (Figure 3C) were also present in MSC-EVs, which might reflect transfer of miRNAs from MSC-EVs (miR-210-3p, miR-5121, miR-21a-5p, miR-28a-3p, miR-362-5p, miR-29a-5p, miR-30d-5p). Consistent with this, miR-21a-5p, the most abundant miRNA in MSC-EVs (Figure S2A), was the tenth most highly expressed miRNA in control islets (Figure S2B) but the third most abundant in MSC-EV-treated islets (Figure S2C).

3.5. Transcriptomic Changes and Functional Enrichment in MSC-EV-Treated Islets

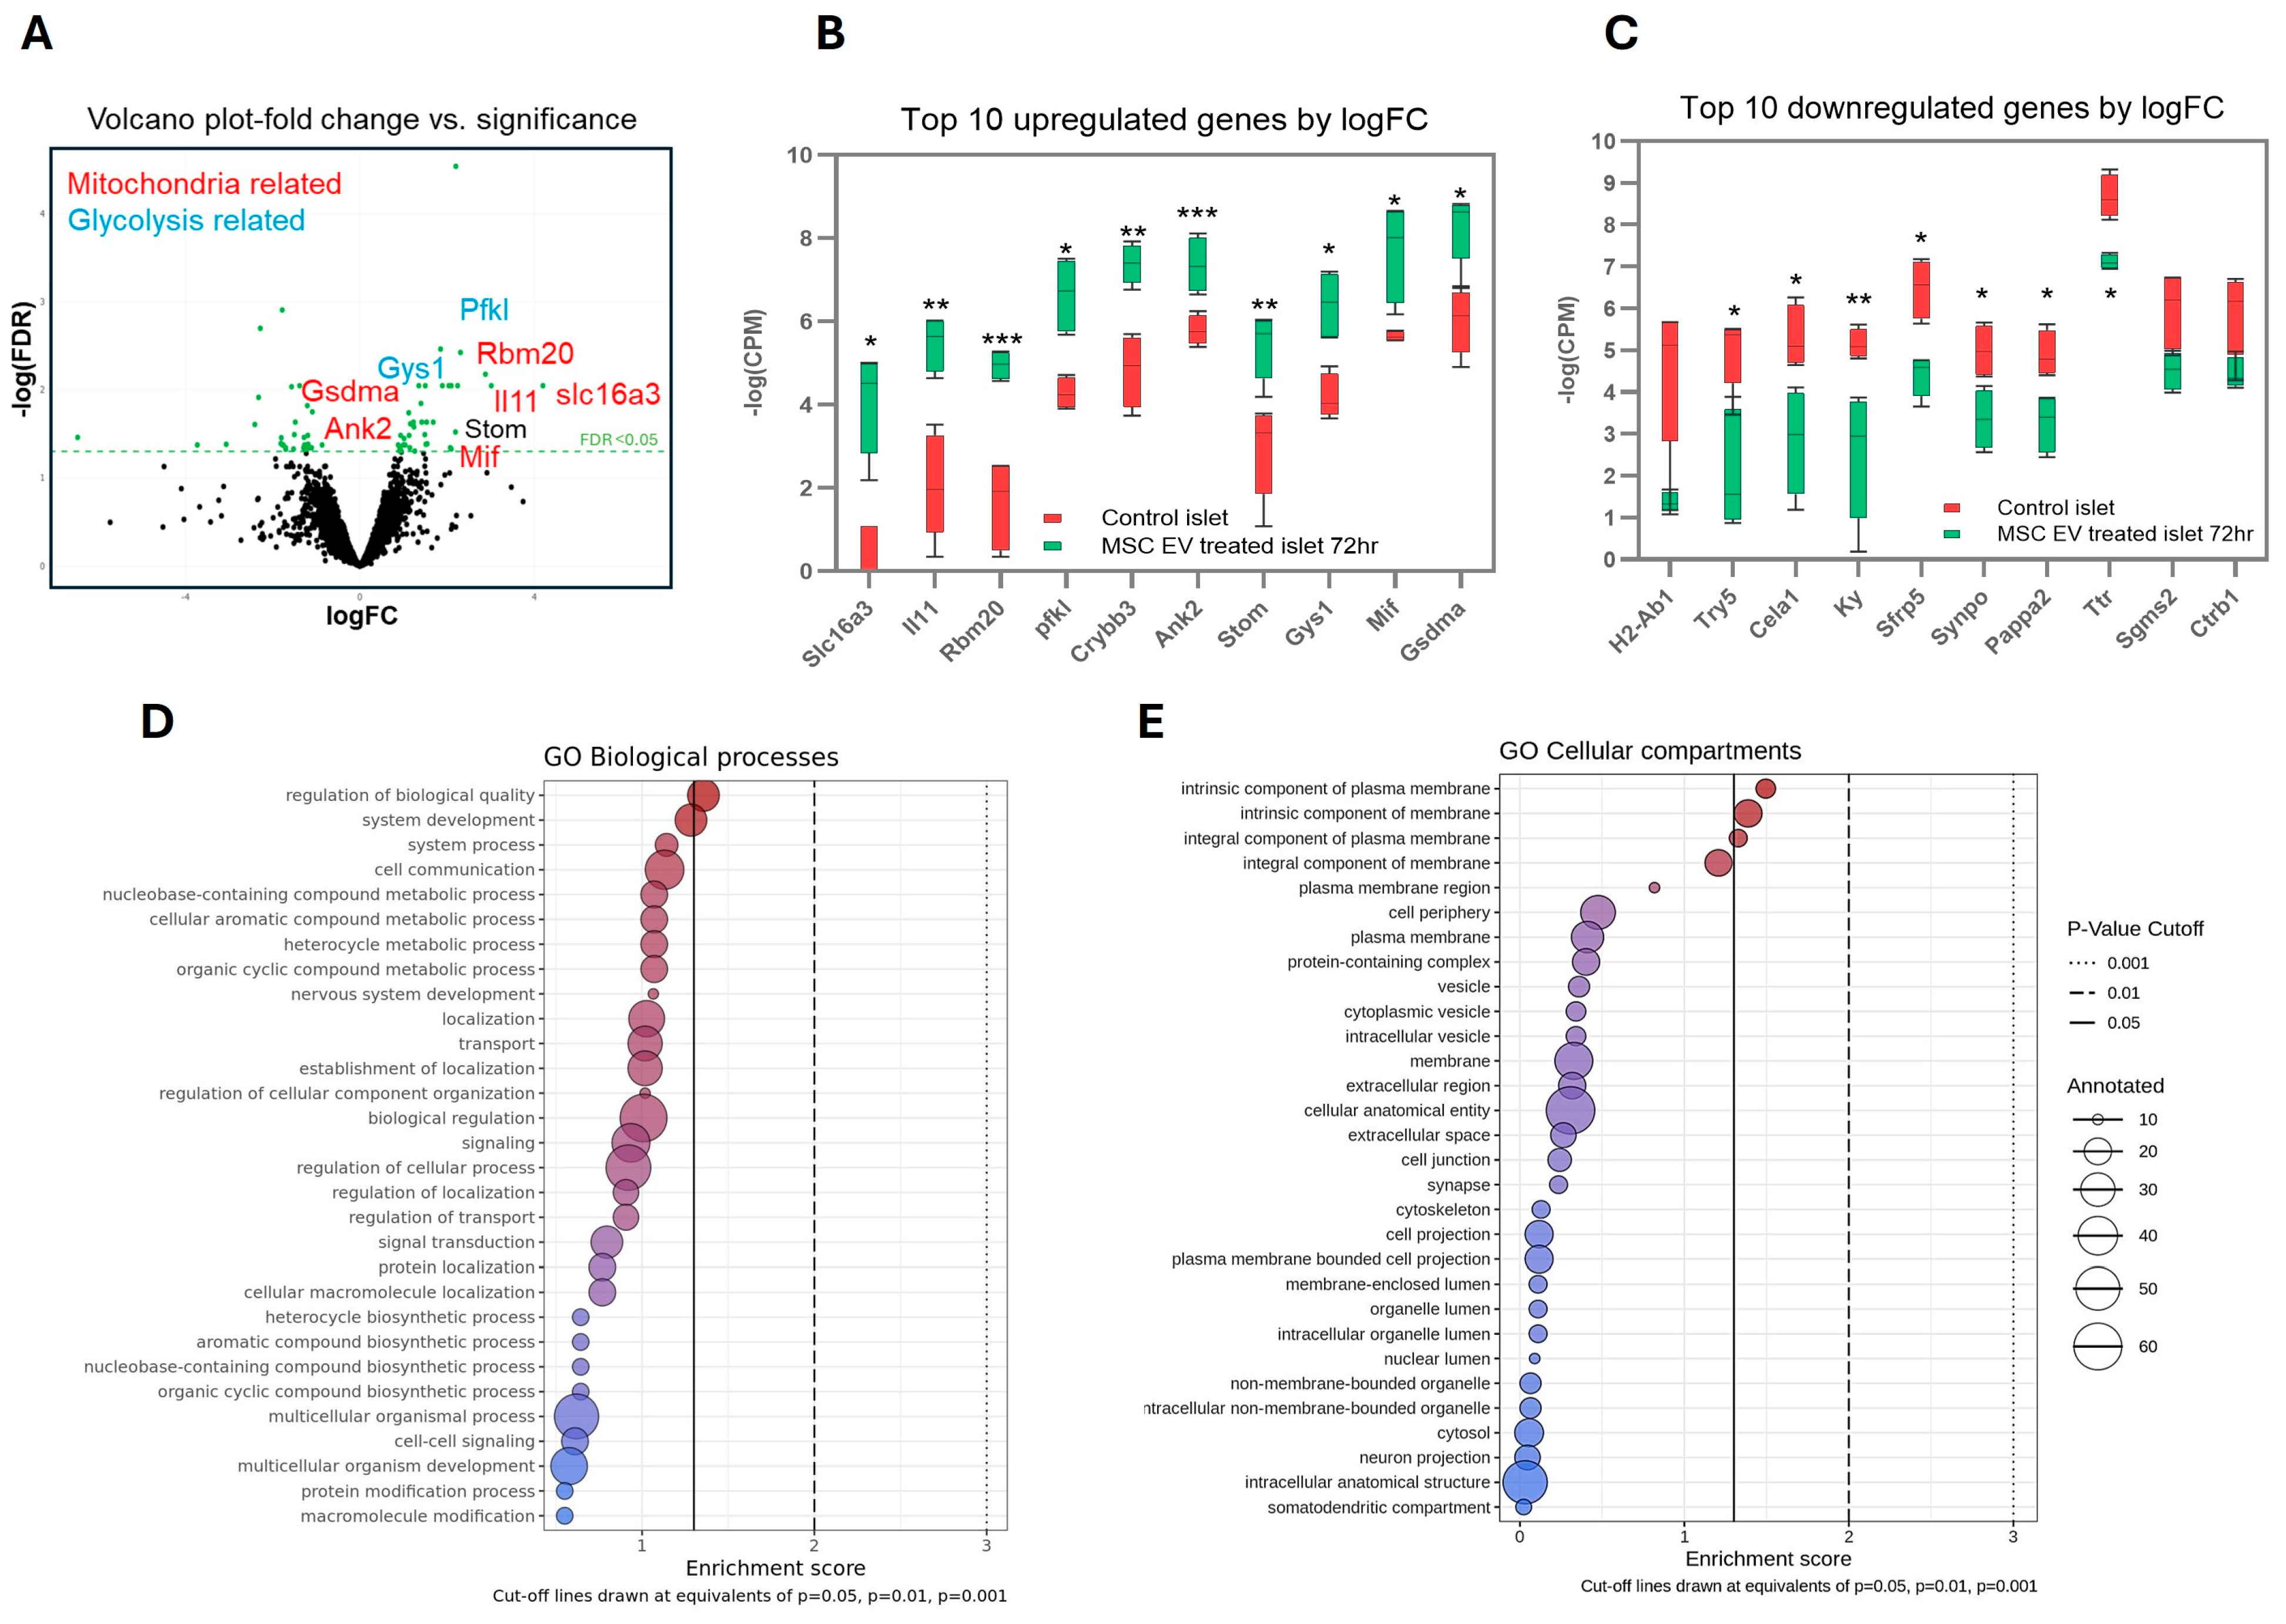
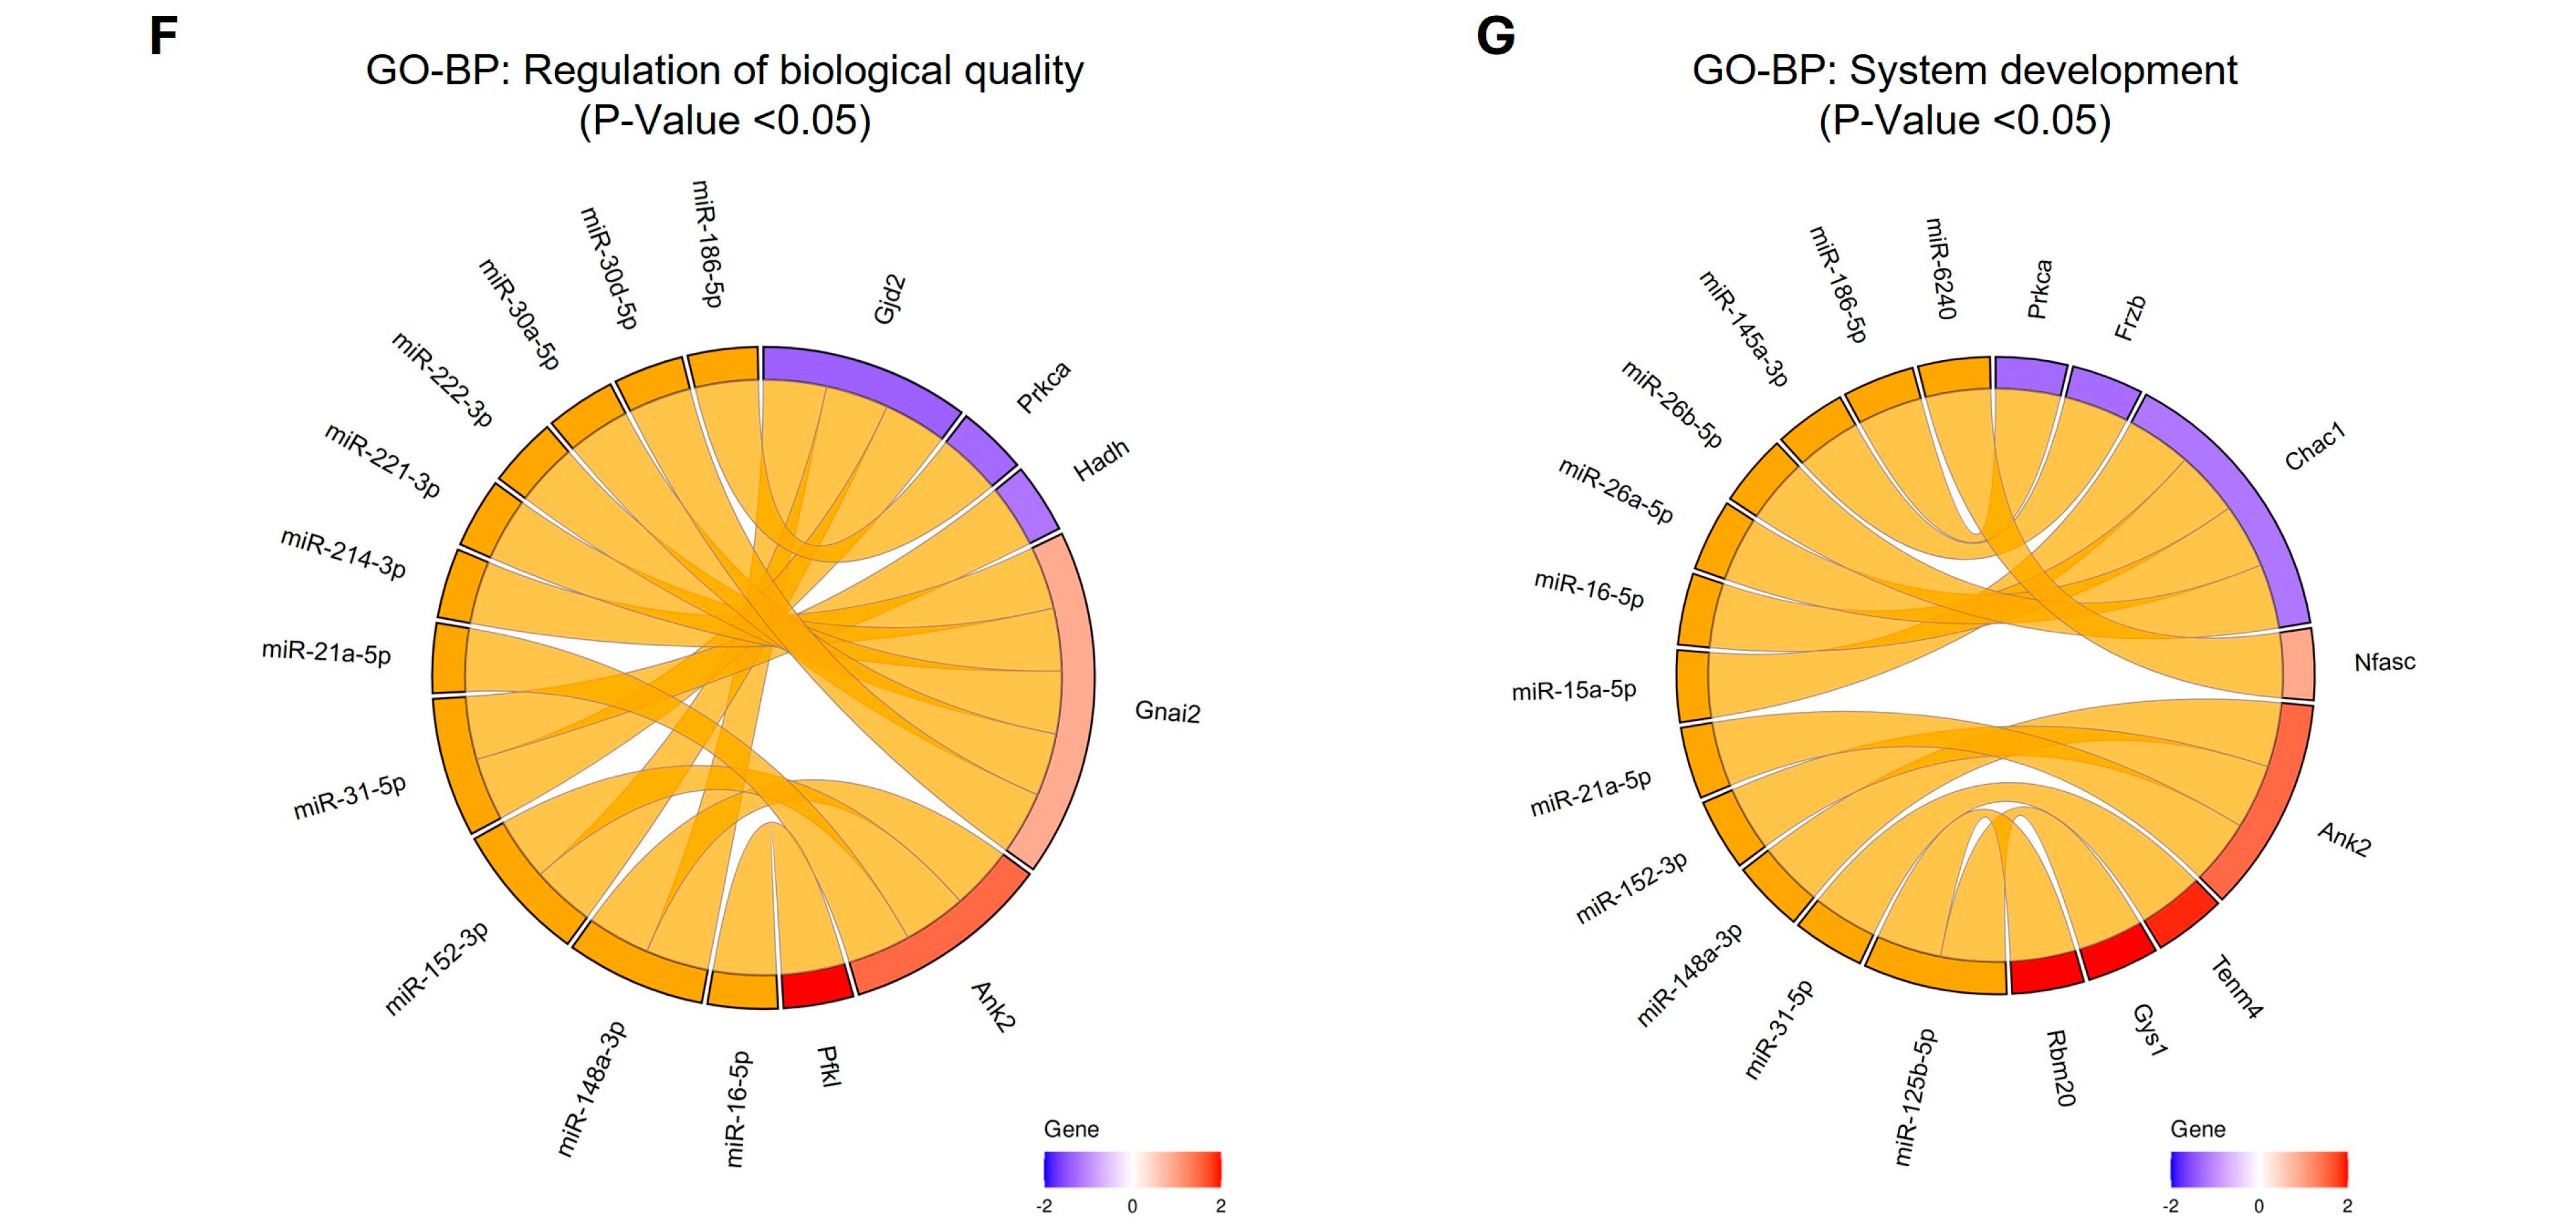
miRNAs play key roles in regulating cellular mRNA levels, by inhibiting translation or inducing mRNA degradation [37], so we performed bulk RNAseq on both control islets and those that had been treated with MSC-EVs for 72 h to identify MSC-EV-dependent changes in islet mRNA levels. Differential gene expression analysis identified a distinct set of mRNAs that were significantly altered in MSC-EV-treated islets (Figure 4). Volcano plot analysis revealed both upregulated and downregulated transcripts based on log2 fold change and statistical significance of p < 0.05 (Figure 4A), including genes associated with glycolysis (blue text) or mitochondrial function (red text). Expression patterns of the top 10 upregulated (Figure 4B) or downregulated (Figure 4C) genes demonstrated consistent changes within the four control and MSC-EV-treated islet samples. Gene Ontology (GO) enrichment analysis of differentially expressed islet genes indicated significant enrichment of biological processes (GOBP, Figure 4D) related to cellular and metabolic regulation (regulation of biological quality), system development and process, cell communication, signalling, and response to stimulus. In addition, enriched cellular component categories (GOCC, Figure 4E) included plasma membrane, intracellular organelles and extracellular regions, suggesting broad alterations in islet cellular organisation and function following exposure to MSC-EVs. The predicted mRNA targets from the miRNAtap analysis were used in a functional pathway enrichment analysis based on an FDR cutoff < 0.05. Enriched biological processes were identified using the Kolmogorov–Smirnov test [38,39], and the enriched GOBP terms included regulation of biological quality and system development, consistent with the data generated from the bulk RNAseq analysis (Figure 4D). Chord diagrams were used to visualise the complex regulatory interactions between MSC-EV miRNAs and islet target genes involved in both regulation of biological quality (Figure 4F) and system development (Figure 4G) pathways, indicating their potential roles in post-transcriptional regulation mechanisms. Overall, these data indicated that MSC-EV treatment of islets resulted in coordinated transcriptional and functional changes. Our analysis of MSC-EV miRNA cargo and islet gene expression therefore offers a number of potential targets for future functional studies.

4. Discussion

EVs, particularly those derived from MSCs (MSC-EVs), have gained significant attention in recent years because of their remarkable regenerative and immunomodulatory properties [34,40]. EVs are nano-sized, membrane-bound particles that mediate intercellular communication by transferring bioactive molecules, such as proteins, lipids, and nucleic acids, to recipient cells. MSC-EVs have been shown to recapitulate many of the therapeutic effects of their parent cells, including promotion of tissue repair, angiogenesis, and modulation of inflammatory responses [41,42], while avoiding several limitations associated with cell-based therapies, such as immune rejection, tumorigenicity, and poor engraftment [43]. Due to their stability, low immunogenicity, and ability to cross biological barriers, MSC-EVs represent a promising cell-free therapeutic strategy for regenerative medicine, including improved therapies for T1D.
Our previous studies have shown that co-culture of isolated mouse or human islets with MSCs improved their functional survival by protecting them from inflammatory cytokine attack and enhancing glucose-induced insulin secretion [4,6], with consequent improvements in islet graft function in animal models of T1D [6]. In this study, we combined biophysical, ultrastructural, proteomic and transcriptomic analyses to characterise mouse bone marrow-derived MSC-EVs, and to assess their effects on gene expression and the functional survival of isolated mouse islets. In accordance with MISEV2023 recommendations for EV characterisation [44], our nanoparticle tracking analysis and transmission electron microscopy confirmed that the particles isolated from MSCs exhibited size distributions and morphologies consistent with heterogeneous EV populations, with a predominant vesicle size in the small EV range. The in vitro functional studies presented here demonstrated that treatment of isolated mouse islets with MSC-EVs was alone sufficient to recapitulate many of the beneficial effects of MSCs over a similar effective time course of 48–72 h, consistent with long-term effects via modulation of gene and/or protein expression. The effects of MSC-EV treatment on islet function were not dose-related, with lower concentrations proving more effective at enhancing glucose-induced insulin secretion and reducing cytokine-induced apoptosis than the higher concentrations used in our experiments. This may reflect potential inhibitory or non-specific toxic effects induced by the higher concentrations of MSC-EVs, so we standardised our experimental MSC-EV treatments to the lower, more effective concentration. The constraints of scalability, heterogeneity and regulatory hurdles to using MSCs to deliver therapeutic benefits to islet grafts also apply, albeit to a lesser extent, to MSC-EVs. The current study therefore aimed to identify components of the MSC-EV cargo involved in their effects on islet function to facilitate cell-free, fully defined molecular treatments of islet graft material to enhance their post-transplantation functional survival.
There are several potential mechanisms through which MSCs or MSC-derived EVs could influence islet function in vitro. We have previously used non-biassed qPCR screening to quantify G protein-coupled receptor (GPCR) expression in islets [45] and GPCR agonist expression in MSC populations [46] and demonstrated that biologically active proteins/peptides released by MSCs have beneficial effects on islet function via GPCR activation. We have further reported that a “cocktail” of these molecules enhanced insulin secretion and protected against inflammatory cytokines, and thus improved the outcomes of islet transplantation in a mouse model of T1D [11,46,47,48]. EVs are well known to transport biologically active peptides and proteins [8,9] so we here hypothesised that MSC-EVs act as a delivery system through which endogenous MSC-derived peptides and proteins influenced islet cell function in islet/MSC co-cultures. Our proteomic analysis confirmed that MSC-EVs contained all three molecules in our previous experimental “cocktail” (C3, ANXA1 and SDF1/CXCL12) with C3 and ANXA1 being in the top 60 most abundant proteins, consistent with EV-mediated delivery of these therapeutic molecules. Our proteomic analysis also highlighted the abundance of ECM-associated proteins in MSC-EVs, again consistent with our previous observations that acellularised MSC-ECM had beneficial effects on isolated mouse and human islet function [47], and with previous studies showing effects of MSC-ECM on other cell and tissue types [49,50]. Our current proteomic analysis of MSC-EVs therefore offers candidate molecules for further screening studies on islet function, and future deeper proteomic analysis of MSC-EVs may widen this potential candidate pool.
EVs are well known to traffic small RNAs, including miRNAs, between adjacent cells [34] so we also focused on the small RNA cargo molecules in our MSC-EV populations. Our sequencing analysis showed that EVs were enriched for small RNA species, in accordance with previous reports demonstrating selective loading of miRNAs into EVs [35]. Isolated islets expressed an abundance of ribosomal RNAs, as would be expected for highly active protein hormone-synthesising microorgans, in addition to a range of miRNA species. Our analysis of expression levels of miRNAs broadly agreed with previous studies. Thus, according to the online data base miRNA TissueAtlas 2025 almost 50% of miRNAs detected in our mouse bmMSC-EVs were also found in human bmMSC-EVs, and half of the most abundant miRNAs detected in our mouse bmMSC-EVs (miR-21a-5p, miR-221-3p, miR-92a-3p, miR-19b-3p, miR-320-3p) were also in the top ten most abundant miRNAs in human bmMSC-EVs, suggesting that cell-specific miRNA expression in EVs is conserved across species. Our analysis of mouse islet miRNA expression identified miR-375-3p as by far the most abundant miRNA. This miRNA was the first to be identified in mouse islets [35] where it is crucial for β-cell proliferation and function [51]. Our analysis of islet miRNA content before and after MSC-EV treatment also supported miRNA transfer from MSC-EVs to islet cells. For example, the most abundant miRNA in MSC-EVs, miR-21a-5p, was also detected in control islets but its abundance was increased by approximately five-fold after MSC-EV treatment: in islet β-cells miR-21a-5p is reported to promote glucose uptake, glucose metabolism and insulin secretion [52], and to reduce apoptosis and enhance cell survival in various tissues [53,54], making it a prime candidate for further transcriptional and functional studies in islets.
Our RNAseq analysis of the effects of MSC-EV treatment on islet mRNA expression suggests that the miRNA cargo within MSC-EVs influenced islet cell gene expression. Treatment of mouse islets with MSC-EVs induced a reproducible upregulation in a distinct set of islet mRNAs, with a concomitant downregulation of a separate set of mRNAs. A number of islet transcripts influenced by MSC-EV treatment are known to be involved in glycolysis or the regulation of mitochondrial function or metabolism, consistent with the MSC-EV-dependent changes in islet glucose metabolism, as assessed by OCR. Overall, enrichment analysis of differentially expressed mRNAs identified alterations in transcripts involved in a broad range of cellular organisation and function, which is consistent with the phenotypic changes induced in islets by prior MSC-EV treatment. Bioinformatic analysis using chord diagrams to visualise potential interactions between selected miRNA cargo molecules in MSC-EVs against their predicted mRNA targets in islets offers the further possibility of identifying key pathways through which miRNAs transferred via EVs regulate islet transcriptome expression to transduce some of the beneficial effects of MSCs on islet function.
These observations cannot alone establish causal links between specific EV-derived miRNAs and mRNA targets, but the parallel alterations in miRNA and mRNA profiles are consistent with regulatory interactions between these control mechanisms to regulate the functional responses of islet cells to MSC-EVs. Although beyond the scope of the present study, causal links between MSC-EV-induced alterations in islet miRNAs and mRNA expression can be assessed by mimicking or blocking the effects of candidate miRNAs using synthetic agomirs or antagomirs, respectively [55]. Similarly, the functional consequences of miRNA-induced modifications in islet mRNA expression can be assessed by manipulating candidate mRNA species by transient over- or under-expression using sense or antisense constructs, respectively [55,56]. Our previous studies using MSC-derived GPCR ligands demonstrated additive or synergistic effects on islet function [46,48] so it seems likely that effective treatments may require the use of several MSC-EV cargo molecules in combination for optimal effectiveness. Overall, identifying MSC-EV cargo component(s) which mimic the beneficial effects of MSC-treatment on islet functional survival [4,6] may offer a cell-free, fully defined intervention for improving the outcomes of islet transplantation as a therapy for T1D.

5. Conclusions

In summary, the aims of the current study were to assess the effects of MSC-EVs on islet function, and to identify MSC-EV cargo components that may be involved in changes in islet function. We have shown that MSC-EVs have beneficial effects on islet function in vitro and have identified both protein and miRNA candidates in the MSC-EV cargo with the potential to mediate these beneficial effects. These observations offer a foundation for future work to assess the potential of individual MSC-EV components to improve the functional survival of islet grafts in transplantation therapy for T1D.

Supplementary Materials

The following supporting information can be downloaded at: https://www.mdpi.com/article/10.3390/cells15110992/s1, Figure S1: Quality Control for quantification of miRNA content of MSC-EVs and MSC-EV-treated islets; Figure S2: Quantification of miRNA expression in MSC-EVs, control islets and MSC-EV-treated islets.

Author Contributions

T.-W.H. and P.M.J. conceived and planned the experiments. T.-W.H. performed most of the experiments. S.C. and T.B. performed some of the experiments to characterise the MSC-EVs. T.-W.H., R.S., R.A., S.C., L.F.D.G. and A.L. performed islet functional experiments. T.-W.H., R.S., R.A., T.-C.H., L.F.D.G. and Z.L. analysed the results. T.-W.H., S.J.P. and P.M.J. wrote the manuscript in consultation with A.J.F.K. and S.C. All authors have read and agreed to the published version of the manuscript.

Funding

This study was funded by a King’s Health Partners Diabetes and Endocrinology Diabetes (KHP-DEO) Seed Research Grant to T.-W.H.

Institutional Review Board Statement

Not applicable.

Informed Consent Statement

Not applicable.

Data Availability Statement

The original contributions presented in this study are included in the article/Supplementary Material. Further inquiries can be directed to the corresponding author(s).

Acknowledgments

We thank the King’s College London Proteomics Facility for their assistance with the preparation and analysis of the MSC-EV proteome and TAmiRNA GmbH (Vienna, Austria) for analysis of islet and MSC-EV miRNA content and islet RNAseq analysis.

Conflicts of Interest

The authors declare no conflicts of interest.

References

  1. Barra, J.M.; Tse, H.M. Redox-Dependent Inflammation in Islet Transplantation Rejection. Front. Endocrinol. 2018, 9, 175. [Google Scholar] [CrossRef] [PubMed]
  2. Langlois, A.; Pinget, M.; Kessler, L.; Bouzakri, K. Islet Transplantation: Current Limitations and Challenges for Successful Outcomes. Cells 2024, 13, 1783. [Google Scholar] [CrossRef]
  3. Vasanthan, J.; Gurusamy, N.; Rajasingh, S.; Sigamani, V.; Kirankumar, S.; Thomas, E.L.; Rajasingh, J. Role of Human Mesenchymal Stem Cells in Regenerative Therapy. Cells 2020, 10, 54. [Google Scholar] [CrossRef]
  4. Rackham, C.L.; Dhadda, P.K.; Chagastelles, P.C.; Simpson, S.J.S.; Dattani, A.A.; Bowe, J.E.; Jones, P.M.; King, A.J.F. Pre-culturing islets with mesenchymal stromal cells using a direct contact configuration is beneficial for transplantation outcome in diabetic mice. Cytotherapy 2013, 15, 449–459. [Google Scholar] [CrossRef] [PubMed]
  5. Kerby, A.; Jones, E.S.; Jones, P.M.; King, A.J. Co-transplantation of islets with mesenchymal stem cells in microcapsules demonstrates graft outcome can be improved in an isolated-graft model of islet transplantation in mice. Cytotherapy 2013, 15, 192–200. [Google Scholar]
  6. Arzouni, A.A.; Vargas-Seymour, A.; Dhadda, P.K.; Rackham, C.L.; Huang, G.-C.; Choudhary, P.; King, A.J.F.; Jones, P.M. Characterization of the Effects of Mesenchymal Stromal Cells on Mouse and Human Islet Function. Stem Cells Transl. Med. 2019, 8, 935–944. [Google Scholar]
  7. Lee, E.; Ha, S.; Kim, G.; Kim, J.H.; Jin, S.-M. Extracellular Vesicles Derived from Three-Dimensional-Cultured Human Umbilical Cord Blood Mesenchymal Stem Cells Prevent Inflammation and Dedifferentiation in Pancreatic Islets. Stem Cells Int. 2023, 2023, 5475212. [Google Scholar] [PubMed]
  8. Martin-Rufino, J.D.; Espinosa-Lara, N.; Osugui, L.; Sanchez-Guijo, F. Targeting the Immune System with Mesenchymal Stromal Cell-Derived Extracellular Vesicles: What Is the Cargo’s Mechanism of Action? Front. Bioeng. Biotechnol. 2019, 7, 308. [Google Scholar] [CrossRef]
  9. Zeng, E.Z.; Chen, I.; Chen, X.; Yuan, X. Exosomal MicroRNAs as Novel Cell-Free Therapeutics in Tissue Engineering and Regenerative Medicine. Biomedicines 2022, 10, 2485. [Google Scholar]
  10. Gey, G.O.; Gey, M.K. The Maintenance of Human Normal Cells and Tumor Cells in Continuous Culture: I. Preliminary Report: Cultivation of Mesoblastic Tumors and Normal Tissue and Notes on Methods of Cultivation. Am. J. Cancer 1936, 27, 45–76. [Google Scholar] [CrossRef]
  11. Hong, T.; Caxaria, S.; Daniels Gatward, L.F.; Hussain, S.; Zhao, M.; King, A.J.F.; Rackham, C.L.; Jones, P.M. Mesenchymal stromal cell secretory molecules improve the functional survival of human islets. Diabet. Med. 2023, 40, e15227. [Google Scholar] [CrossRef]
  12. Eng, J.K.; McCormack, A.L.; Yates, J.R. An approach to correlate tandem mass spectral data of peptides with amino acid sequences in a protein database. J. Am. Soc. Mass Spectrom. 1994, 5, 976–989. [Google Scholar] [CrossRef]
  13. Simon, A. FastQC: A Quality Control Tool for High Throughput Sequence Data 2010. Available online: https://www.bioinformatics.babraham.ac.uk/projects/fastqc/ (accessed on 12 May 2026).
  14. Ewels, P.; Magnusson, M.; Lundin, S.; Käller, M. MultiQC: Summarize analysis results for multiple tools and samples in a single report. Bioinformatics 2016, 32, 3047–3048. [Google Scholar] [CrossRef]
  15. Martin, M. Cutadapt removes adapter sequences from high-throughput sequencing reads. EMBnet J. 2011, 17, 10. [Google Scholar] [CrossRef]
  16. Langmead, B.; Trapnell, C.; Pop, M.; Salzberg, S.L. Ultrafast and memory-efficient alignment of short DNA sequences to the human genome. Genome Biol. 2009, 10, R25. [Google Scholar] [CrossRef]
  17. Friedländer, M.R.; Mackowiak, S.D.; Li, N.; Chen, W.; Rajewsky, N. miRDeep2 accurately identifies known and hundreds of novel microRNA genes in seven animal clades. Nucleic Acids Res. 2012, 40, 37–52. [Google Scholar] [CrossRef]
  18. Zerbino, D.R.; Achuthan, P.; Akanni, W.; Amode, M.R.; Barrell, D.; Bhai, J.; Billis, K.; Cummins, C.; Gall, A.; Girón, C.G.; et al. Ensembl 2018. Nucleic Acids Res. 2018, 46, D754–D761. [Google Scholar] [CrossRef]
  19. Griffiths-Jones, S. The microRNA Registry. Nucleic Acids Res. 2004, 32, D109–D111. [Google Scholar] [CrossRef]
  20. The RNAcentral Consortium; Sweeney, B.A.; Petrov, A.I.; Burkov, B.; Finn, R.D.; Bateman, A.; Szymanski, M.; Karlowski, W.M.; Gorodkin, J.; Seemann, S.E.; et al. RNAcentral: A hub of information for non-coding RNA sequences. Nucleic Acids Res. 2019, 47, D221–D229. [Google Scholar]
  21. Robinson, M.D.; McCarthy, D.J.; Smyth, G.K. edgeR: A Bioconductor package for differential expression analysis of digital gene expression data. Bioinformatics 2010, 26, 139–140. [Google Scholar]
  22. Love, M.I.; Huber, W.; Anders, S. Moderated estimation of fold change and dispersion for RNA-seq data with DESeq2. Genome Biol. 2014, 15, 550. [Google Scholar] [CrossRef]
  23. Khamina, K.; Diendorfer, A.B.; Skalicky, S.; Weigl, M.; Pultar, M.; Krammer, T.L.; Fournier, C.A.; Schofield, A.L.; Otto, C.; Smith, A.T.; et al. A MicroRNA Next-Generation-Sequencing Discovery Assay (miND) for Genome-Scale Analysis and Absolute Quantitation of Circulating MicroRNA Biomarkers. Int. J. Mol. Sci. 2022, 23, 1226. [Google Scholar] [CrossRef]
  24. Bushnell, B. bbmap Package, v38.69. 2015. Available online: https://sourceforge.net/projects/bbmap/ (accessed on 12 May 2026).
  25. Dobin, A.; Davis, C.A.; Schlesinger, F.; Drenkow, J.; Zaleski, C.; Jha, S.; Batut, P.; Chaisson, M.; Gingeras, T.R. STAR: Ultrafast universal RNA-seq aligner. Bioinformatics 2013, 29, 15–21. [Google Scholar] [CrossRef]
  26. Li, H.; Handsaker, B.; Wysoker, A.; Fennell, T.; Ruan, J.; Homer, N.; Marth, G.; Abecasis, G.; Durbin, R. 1000 Genome Project Data Processing Subgroup The Sequence Alignment/Map format and SAMtools. Bioinformatics 2009, 25, 2078–2079. [Google Scholar] [CrossRef]
  27. Anders, S.; Pyl, P.T.; Huber, W. HTSeq—A Python framework to work with high-throughput sequencing data. Bioinformatics 2015, 31, 166–169. [Google Scholar] [CrossRef]
  28. Maciej Pajak, T.I.S. miRNAtap, version 1.42.0; Bioconductor: Boston, MA, USA, 2017. [Google Scholar] [CrossRef]
  29. Maragkakis, M.; Reczko, M.; Simossis, V.A.; Alexiou, P.; Papadopoulos, G.L.; Dalamagas, T.; Giannopoulos, G.; Goumas, G.; Koukis, E.; Kourtis, K.; et al. DIANA-microT web server: Elucidating microRNA functions through target prediction. Nucleic Acids Res. 2009, 37, W273–W276. [Google Scholar] [CrossRef]
  30. Enright, A.J.; John, B.; Gaul, U.; Tuschl, T.; Sander, C.; Marks, D.S. MicroRNA targets in Drosophila. Genome Biol. 2003, 5, R1. [Google Scholar] [CrossRef]
  31. Lall, S.; Grün, D.; Krek, A.; Chen, K.; Wang, Y.-L.; Dewey, C.N.; Sood, P.; Colombo, T.; Bray, N.; MacMenamin, P.; et al. A Genome-Wide Map of Conserved MicroRNA Targets in C. elegans. Curr. Biol. 2006, 16, 460–471. [Google Scholar] [CrossRef]
  32. Friedman, R.C.; Farh, K.K.-H.; Burge, C.B.; Bartel, D.P. Most mammalian mRNAs are conserved targets of microRNAs. Genome Res. 2009, 19, 92–105. [Google Scholar] [CrossRef]
  33. Wong, N.; Wang, X. miRDB: An online resource for microRNA target prediction and functional annotations. Nucleic Acids Res. 2015, 43, D146–D152. [Google Scholar] [CrossRef]
  34. Dos Santos, C.C.; Lopes-Pacheco, M.; English, K.; Rolandsson Enes, S.; Krasnodembskaya, A.; Rocco, P.R.M. The MSC-EV-microRNAome: A Perspective on Therapeutic Mechanisms of Action in Sepsis and ARDS. Cells 2024, 13, 122. [Google Scholar] [CrossRef]
  35. Sun, G.; Qi, M.; Kim, A.S.; Lizhar, E.M.; Sun, O.W.; Al-Abdullah, I.H.; Riggs, A.D. Reassessing the Abundance of miRNAs in the Human Pancreas and Rodent Cell Lines and Its Implication. Non-Coding RNA 2023, 9, 20. [Google Scholar] [CrossRef]
  36. Ledesma-Pacheco, S.J.; Uriostegui-Pena, A.G.; Rodriguez-Jacinto, E.; Gomez-Hernandez, E.; Estrada-Meza, C.; Banerjee, A.; Pathak, S.; Ruiz-Manriquez, L.M.; Duttaroy, A.K.; Paul, S. Regulatory mechanisms of microRNAs in endocrine disorders and their therapeutic potential. Front. Genet. 2023, 14, 1137017. [Google Scholar] [CrossRef]
  37. Wilczynska, A.; Bushell, M. The complexity of miRNA-mediated repression. Cell Death Differ. 2015, 22, 22–33. [Google Scholar] [CrossRef]
  38. Lu, T.-P.; Tsai, M.-H.; Lee, J.-M.; Hsu, C.-P.; Chen, P.-C.; Lin, C.-W.; Shih, J.-Y.; Yang, P.-C.; Hsiao, C.K.; Lai, L.-C.; et al. Identification of a Novel Biomarker, SEMA5A, for Non–Small Cell Lung Carcinoma in Nonsmoking Women. Cancer Epidemiol. Biomark. Prev. 2010, 19, 2590–2597. [Google Scholar]
  39. Massey, F.J. The Kolmogorov-Smirnov Test for Goodness of Fit. J. Am. Stat. Assoc. 1951, 46, 68–78. [Google Scholar] [CrossRef]
  40. Zhao, A.G.; Shah, K.; Cromer, B.; Sumer, H. Mesenchymal Stem Cell-Derived Extracellular Vesicles and Their Therapeutic Potential. Stem Cells Int. 2020, 2020, 8825771. [Google Scholar] [CrossRef]
  41. Jiang, X.; Yang, J.; Lin, Y.; Liu, F.; Tao, J.; Zhang, W.; Xu, J.; Zhang, M. Extracellular vesicles derived from human ESC–MSCs target macrophage and promote anti-inflammation process, angiogenesis, and functional recovery in ACS-induced severe skeletal muscle injury. Stem Cell Res. Ther. 2023, 14, 331. [Google Scholar] [CrossRef]
  42. Zhang, N.; Fan, M.; Zhao, Y.; Hu, X.; Zhu, Q.; Jiao, X.; Lv, Q.; Li, D.; Huang, Z.; Fu, G.; et al. Biomimetic and NOS-Responsive Nanomotor Deeply Delivery a Combination of MSC-EV and Mitochondrial ROS Scavenger and Promote Heart Repair and Regeneration. Adv. Sci. Weinh. Baden 2023, 10, e2301440. [Google Scholar] [CrossRef]
  43. Hussen, B.M.; Taheri, M.; Yashooa, R.K.; Abdullah, G.H.; Abdullah, S.R.; Kheder, R.K.; Mustafa, S.A. Revolutionizing medicine: Recent developments and future prospects in stem-cell therapy. Int. J. Surg. 2024, 110, 8002–8024. [Google Scholar] [CrossRef]
  44. Upadhya, D.; Shetty, A.K. MISEV2023 provides an updated and key reference for researchers studying the basic biology and applications of extracellular vesicles. Stem Cells Transl. Med. 2024, 13, 848–850. [Google Scholar] [CrossRef]
  45. Amisten, S.; Salehi, A.; Rorsman, P.; Jones, P.M.; Persaud, S.J. An atlas and functional analysis of G-protein coupled receptors in human islets of Langerhans. Pharmacol. Ther. 2013, 139, 359–391. [Google Scholar] [CrossRef]
  46. Rackham, C.L.; Vargas, A.E.; Hawkes, R.G.; Amisten, S.; Persaud, S.J.; Austin, A.L.F.; King, A.J.F.; Jones, P.M. Annexin A1 Is a Key Modulator of Mesenchymal Stromal Cell–Mediated Improvements in Islet Function. Diabetes 2016, 65, 129–139. [Google Scholar] [CrossRef]
  47. Arzouni, A.A.; Vargas-Seymour, A.; Rackham, C.L.; Dhadda, P.; Huang, G.-C.; Choudhary, P.; Nardi, N.; King, A.J.F.; Jones, P.M. Mesenchymal stromal cells improve human islet function through released products and extracellular matrix. Clin. Sci. 2017, 131, 2835–2845. [Google Scholar] [CrossRef]
  48. Rackham, C.L.; Amisten, S.; Persaud, S.J.; King, A.J.F.; Jones, P.M. Mesenchymal stromal cell secretory factors induce sustained improvements in islet function pre- and post-transplantation. Cytotherapy 2018, 20, 1427–1436. [Google Scholar] [CrossRef]
  49. Lv, S.; Wang, J.; Chen, J.; Yu, Y.; Huang, X.; Zhao, G.; Zhou, X.; Xu, Y. Mesenchymal stem cell-derived extracellular matrix for musculoskeletal tissue regeneration. Commun. Biol. 2026, 9, 147. [Google Scholar] [CrossRef]
  50. Novoseletskaya, E.; Grigorieva, O.; Nimiritsky, P.; Basalova, N.; Eremichev, R.; Milovskaya, I.; Kulebyakin, K.; Kulebyakina, M.; Rodionov, S.; Omelyanenko, N.; et al. Mesenchymal Stromal Cell-Produced Components of Extracellular Matrix Potentiate Multipotent Stem Cell Response to Differentiation Stimuli. Front. Cell Dev. Biol. 2020, 8, 555378. [Google Scholar] [CrossRef]
  51. Pierantoni, M.; Dell’Aira, M.; Grassilli, S.; Brugnoli, F.; Bertagnolo, V. MicroRNA 375 and diabetes: A key regulator of β cell function and a promising non-invasive biomarker. World J. Diabetes 2025, 16, 110097. [Google Scholar] [CrossRef]
  52. Liu, R.; Liu, C.; He, X.; Sun, P.; Zhang, B.; Yang, H.; Shi, W.; Ruan, Q. MicroRNA-21 promotes pancreatic β cell function through modulating glucose uptake. Nat. Commun. 2022, 13, 3545. [Google Scholar] [CrossRef]
  53. Yan, X.; Liu, Y.; Kong, X.; Ji, J.; Zhu, H.; Zhang, Z.; Fu, T.; Yang, J.; Zhang, Z.; Liu, F.; et al. MicroRNA-21-5p are involved in apoptosis and invasion of fibroblast-like synoviocytes through PTEN/PI3K/AKT signal. Cytotechnology 2019, 71, 317–328. [Google Scholar] [CrossRef]
  54. Luther, K.M.; Haar, L.; McGuinness, M.; Wang, Y.; Lynch Iv, T.L.; Phan, A.; Song, Y.; Shen, Z.; Gardner, G.; Kuffel, G.; et al. Exosomal miR-21a-5p mediates cardioprotection by mesenchymal stem cells. J. Mol. Cell. Cardiol. 2018, 119, 125–137. [Google Scholar] [CrossRef]
  55. Wang, P.; Zhou, Y.; Richards, A.M. Effective tools for RNA-derived therapeutics: siRNA interference or miRNA mimicry. Theranostics 2021, 11, 8771–8796. [Google Scholar] [CrossRef]
  56. Hu, B.; Zhong, L.; Weng, Y.; Peng, L.; Huang, Y.; Zhao, Y.; Liang, X.-J. Therapeutic siRNA: State of the art. Signal Transduct. Target. Ther. 2020, 5, 101. [Google Scholar] [CrossRef]
Figure 1. Experimental design of cargo analysis and characterisation of MSC-derived EVs. (A) Experimental design for the generation and characterisation of MSC-derived EVs, for cargo analysis, and for assessment of their effects on mouse islet function. (B) Size distribution of NTA profiles from 3 independent MSC-EV preparations showing particle concentration (particles/mL) as a function of diameter (nm) for three independent measurements on the same sample. Curves represent NTA-derived distributions. (C) Representative NTA scatter plot showing individual particle tracks plotted as particle size (nm) versus scattering intensity (a.u.). Each point corresponds to a single tracked particle, illustrating the heterogeneity in vesicle size and optical intensity within the sample. (D) Representative TEM image showing MSC-EVs with characteristic round to cup-shaped morphology and diameters consistent with nanoscale vesicles.
Cells 15 00992 g001
Figure 2. Functional effects of MSC-derived EVs on mouse islets. (A): MSC-EV treatment (72 h) had no effect on basal (2 mM glucose) insulin secretion. In contrast, treatment with 5 × 10⁵ particles/mL significantly enhanced 20 mM glucose-stimulated insulin secretion, an effect that was not observed with either 2 × 10⁶ or 1 × 10⁷ particles/mL. (B): MSC-EV treatment (5 × 10⁵ to 1 × 10⁷ particle/mL) had no effect on basal caspase activity versus control untreated islets (CTRL), but cytokine treatment significantly increased caspase activity. MSC-EV treatment (5 × 10⁵ and 2 × 10⁶ particles/mL) significantly reduced cytokine-induced caspase activity but 1 × 10⁷ particles/mL had no effect. (C): MSC-EV treatment (5 × 10⁵ particles/mL) had no effect on 20 mM glucose-stimulated insulin secretion after 24 h, but significantly enhanced secretion after 72 h treatment. Basal (2 mM glucose) insulin secretion was unaffected at either time point. (D): MSC-EV treatment (5 × 10⁵ particles/mL) had a small but not significant (p = 0.08) effect to reduce cytokine-induced caspase activity after 24 h, but significantly reduced caspase activity after 72 h treatment. Basal caspase activity was unaffected at either time point. (E): MSC-EV treatment (5 × 10⁵ particles/mL; 72 h) increased both 20 mM glucose-stimulated OCR and maximal respiratory capacity induced by 2 µM FCCP. (F): The batch of MSC-EVs used in (E) also significantly enhanced 20 mM glucose-stimulated insulin secretion from mouse islets, consistent with (A,C). (G): Similarly, the batch of MSC-EVs used in (E) significantly reduced cytokine-induced caspase activity, consistent with (B,D). (H): Cytokine treatment increased cell death in control islets as visualised by Live (green)/Dead (red) staining, and cell death was significantly reduced by MSC-EV treatment. Quantification of micrograph images is shown in the right-hand panel (AH). Quantitative data are presented as mean ± SEM from independent experiments as shown in different colour, where scatter plots show individual data points representing independent biological replicates. For (A,B) N = 3; (C,D): N = 1; (EH): N = 1 (same batch of EVs for sequencing) with technical replicates n = 4–7.
Cells 15 00992 g002
Figure 3. Quantification of miRNAs in MSC-EVs and MSC-EV-treated islets. (A): The histogram shows the 15 most abundant miRNAs detected in MSC-EVs (mean ± SEM from 4 preparations). (B): Volcano plot showing differential expression of miRNAs between control and EV-treated islets (5 × 10⁵ particles/mL; 72 h). Individual miRNAs shown in green indicate FDR < 0.2. (C): Top 10 upregulated; and (D): Top 5 downregulated miRNAs quantified in MSC-EV-treated islets. miRNAs are ordered by logFC (FDR < 0.2) starting with the greatest effects on the top left of each panel (mean ± SEM from 4 preparations, unpaired T-test).
Cells 15 00992 g003
Figure 4. Effects of MSC-EV treatment on mRNA expression. (A): Volcano plot of differential expression of mRNAs between control and MSC-EV-treated islets (5 × 10⁵ particles/mL; 72 h; mean ± SEM from 4 preparations). Significantly up- or down-regulated transcripts are shown as green dots (FDR < 0.05). (B): Top 10 upregulated. (C): Top 10 downregulated mRNA species between control (red) and MSC-EV-treated (green) islets (5 × 10⁵ particles/mL, 72 h; mean ± SEM from 4 preparations. * p < 0.05; ** p < 0.01; *** p < 0.001, unpaired T-test). (D,E): Differentially expressed mRNAs based on an FDR < 0.05 were used in GO-term enrichment analysis. Enriched biological processes (D) and cellular compartments (E) were identified using the Kolmogorov–Smirnov test [38,39]. (F,G): Chord diagrams visualising interactions between miRNA cargo in MSC-EVs and some of their predicted mRNA targets in mouse islets reveal potential functional significance of differentially expressed mRNAs in MSC-EV-treated islets: regulation of biological quality (F) system development (G). Log2 fold change (logFC) is colour-coded according to the legend displayed (range −2 to +2).
Cells 15 00992 g004aCells 15 00992 g004b
Table 1. Proteomic analysis of MSC-EVs. The table shows the top 60 most abundant proteins/peptides quantified in MSC-EVs, ranked top to bottom from most abundant to least abundant. Analysis is based on four separate EV preparations, and proteins highlighted in bold* have been identified previously as elements of an MSC-derived “cocktail” of molecules which enhances mouse and human islet functional survival in vitro and in vivo [9,11].
#DescriptionAccession Number Alternative ID Molecular Weight Abundances (Log2, %)
1FibronectinP11276Fn1273 kDa34.8
2Thrombospondin-2Q03350Thbs2130 kDa31.4
3Filamin-AQ8BTM8Flna281 kDa31.4
4Fibulin-2P37889Fbln2132 kDa31.3
5Collagen alpha-2(I) chainQ01149Col1a2130 kDa30.9
6Collagen alpha-1(I) chainP11087Col1a1138 kDa30.9
7NucleophosminQ61937Npm133 kDa30.5
8Thrombospondin-1P35441Thbs1130 kDa30.3
9Fibulin-1Q08879Fbln178 kDa30.2
10Adipocyte enhancer-binding protein 1Q640N1Aebp1128 kDa29.7
11Myosin-9Q8VDD5Myh9226 kDa29.3
12Complement C1r-A subcomponentQ8CG16C1ra80 kDa29.3
13Prolow-density lipoprotein receptor-related protein 1Q91ZX7Lrp1505 kDa29.3
14T-complex protein 1 subunit gammaP80318Cct361 kDa29.2
15Complement C3*P01027C3186 kDa28.6
16Pentraxin-related protein PTX3P48759Ptx342 kDa28
17Complement factor HP06909Cfh139 kDa27.8
18Glyceraldehyde-3-phosphate dehydrogenaseP16858Gapdh36 kDa27.8
19Bone morphogenetic protein 1P98063Bmp1112 kDa27.8
20Fibrillin-1 Q61554Fbn1312 kDa27.6
21Histone H4 P62806H4c111 kDa27.5
22Procollagen C-endopeptidase enhancer 1Q61398Pcolce50 kDa27.4
23Actin, cytoplasmic 2P63260Actg142 kDa27.2
24Pyruvate kinase PKMP52480Pkm58 kDa27.2
25Collagen alpha-2(V) chainQ3U962Col5a2145 kDa27.1
26Transitional endoplasmic reticulum ATPaseQ01853Vcp89 kDa26.9
27Actin, alpha skeletal muscleP68134Acta142 kDa26.8
28Collagen alpha-1(III) chainP08121Col3a1139 kDa26.7
29PlectinQ9QXS1Plec534 kDa26.6
30Annexin A2P07356Anxa239 kDa26.6
31Complement C4-BP01029C4b193 kDa26.6
32Tenascin Q80YX1Tnc232 kDa26.6
33Filamin-BQ80X90Flnb278 kDa26.5
34Nidogen-2O88322Nid2154 kDa26.4
35Collagen alpha-1(XII) chainQ60847Col12a1340 kDa26.3
36Basement membrane-specific heparan sulfate proteoglycan core proteinQ05793Hspg2398 kDa26.3
37EGF-containing fibulin-like extracellular matrix protein 2Q9WVJ9Efemp249 kDa26.1
38Thrombospondin-4Q9Z1T2Thbs4106 kDa26
39Heat shock protein HSP 90-alphaP07901Hsp90aa185 kDa26
40AlbuminP07724Alb69 kDa25.9
41Nidogen-1P10493Nid1137 kDa25.9
42Elongation factor 2P58252Eef295 kDa25.8
43Collagen alpha-1(VI) chainQ04857Col6a1108 kDa25.8
44Latent-transforming growth factor beta-binding protein 4Q8K4G1Ltbp4179 kDa25.7
45Prelamin-A/CP48678Lmna74 kDa25.7
46Heat shock protein HSP 90-betaP11499Hsp90ab183 kDa25.6
47Serine protease HTRA1Q9R118Htra151 kDa25.6
48Galectin-3-binding proteinQ07797Lgals3bp64 kDa25.5
49Tubulin alpha-1B chainP05213Tuba1b50 kDa25.4
50BiglycanP28653Bgn42 kDa24.8
51Complement C1s-1 subcomponentQ8CG14C1s177 kDa24.7
52Histone H2A type 1-KQ8CGP7H2ac1514 kDa24.7
53Procollagen-lysine,2-oxoglutarate 5-dioxygenase 1Q9R0E2Plod184 kDa24.6
54Fibulin-5Q9WVH9Fbln550 kDa24.5
55Inter-alpha-trypsin inhibitor heavy chain H3Q61704Itih399 kDa24.3
56Cartilage oligomeric matrix proteinQ9R0G6Comp82 kDa24.2
57Heat shock cognate 71 kDa proteinP63017Hspa871 kDa24.2
58Annexin A1*P10107Anxa139 kDa24
59EMILIN-1Q99K41Emilin1108 kDa23.8
60Protein disulfide-isomerase A3P27773Pdia357 kDa22.7
* Peptides with confirmed beneficial effects on islet function [9,11].
Disclaimer/Publisher’s Note: The statements, opinions and data contained in all publications are solely those of the individual author(s) and contributor(s) and not of MDPI and/or the editor(s). MDPI and/or the editor(s) disclaim responsibility for any injury to people or property resulting from any ideas, methods, instructions or products referred to in the content.