
Experimental and Mathematical Model of Platelet Hemostasis Kinetics
 , , ,
, , ,  ,
,  and
and 
Abstract
1. Introduction
2. Materials and Methods
2.1. Ethics Approval
2.2. Reagents and Working Buffers
2.3. Platelet Preparation
2.4. Flow Cytometry
Analysis of Platelet Integrin αIIbβ3 Activation
2.5. Laser Diffraction Method
2.5.1. Analysis of Shape Change and Aggregation
2.5.2. Analysis of Platelet Ca2+ Mobilization
2.5.3. Desensitization of Platelets from the Shape Change State
2.5.4. Desensitization of Platelets from the State of Activated Integrins
2.5.5. Time-Dependent Inhibition of Platelet Activation by Cyclic Nucleotide Pathways
2.5.6. Platelet Disaggregation Mediated by Cyclic Nucleotide Pathways
2.5.7. Dose-Dependent Inhibition of Platelet Activation by Cyclic Nucleotide Pathways
2.6. Data Processing and Analysis
3. Results
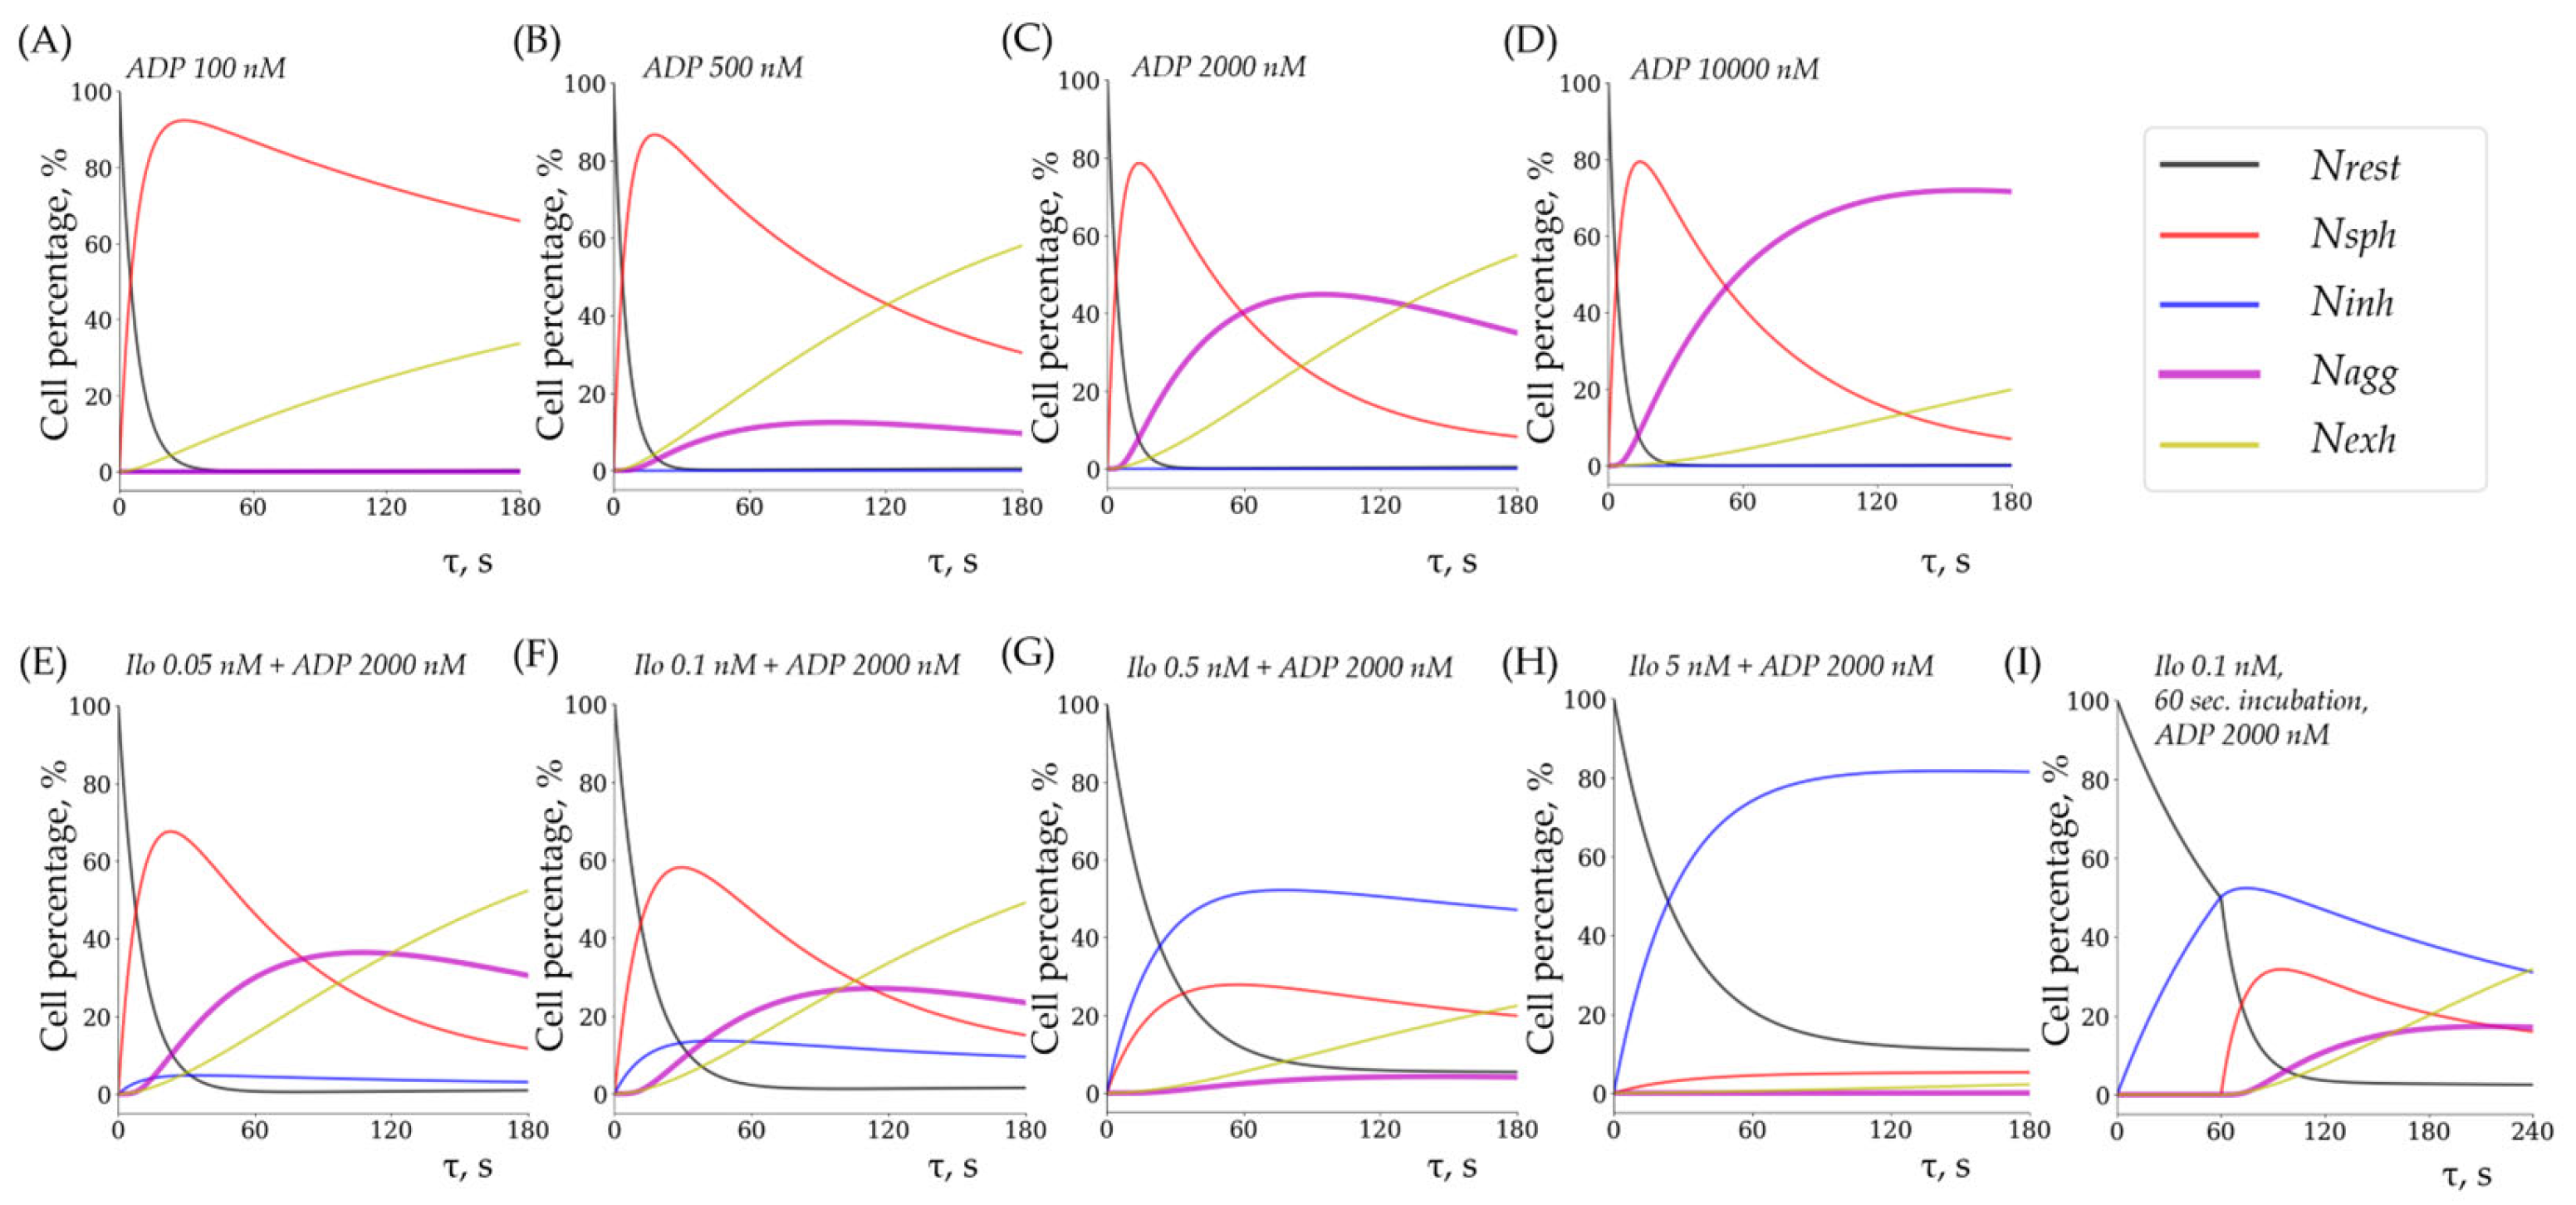
3.1. Kinetic Model of Platelet Hemostasis
3.1.1. Schematic Representation of the Model
3.1.2. The Mathematical Framework of the Model
3.2. Experimental Parameters for Hemostasis Kinetics Analysis
3.2.1. Identification of Optimal Platelet Concentration for the Laser Diffraction Method
3.2.2. Aggregation Is Dependent on the Calcium Concentration in the Medium
3.2.3. Aggregation Is Not Affected by pH Within Physiological Ranges
3.2.4. Fibrinogen Concentration Is Not a Limiting Factor of Platelet Aggregation
3.3. Rate Constants of Key Hemostatic Reactions and Dose–Response Relationships
3.3.1. Quantitative Characterization of Shape Change and Aggregation Reactions
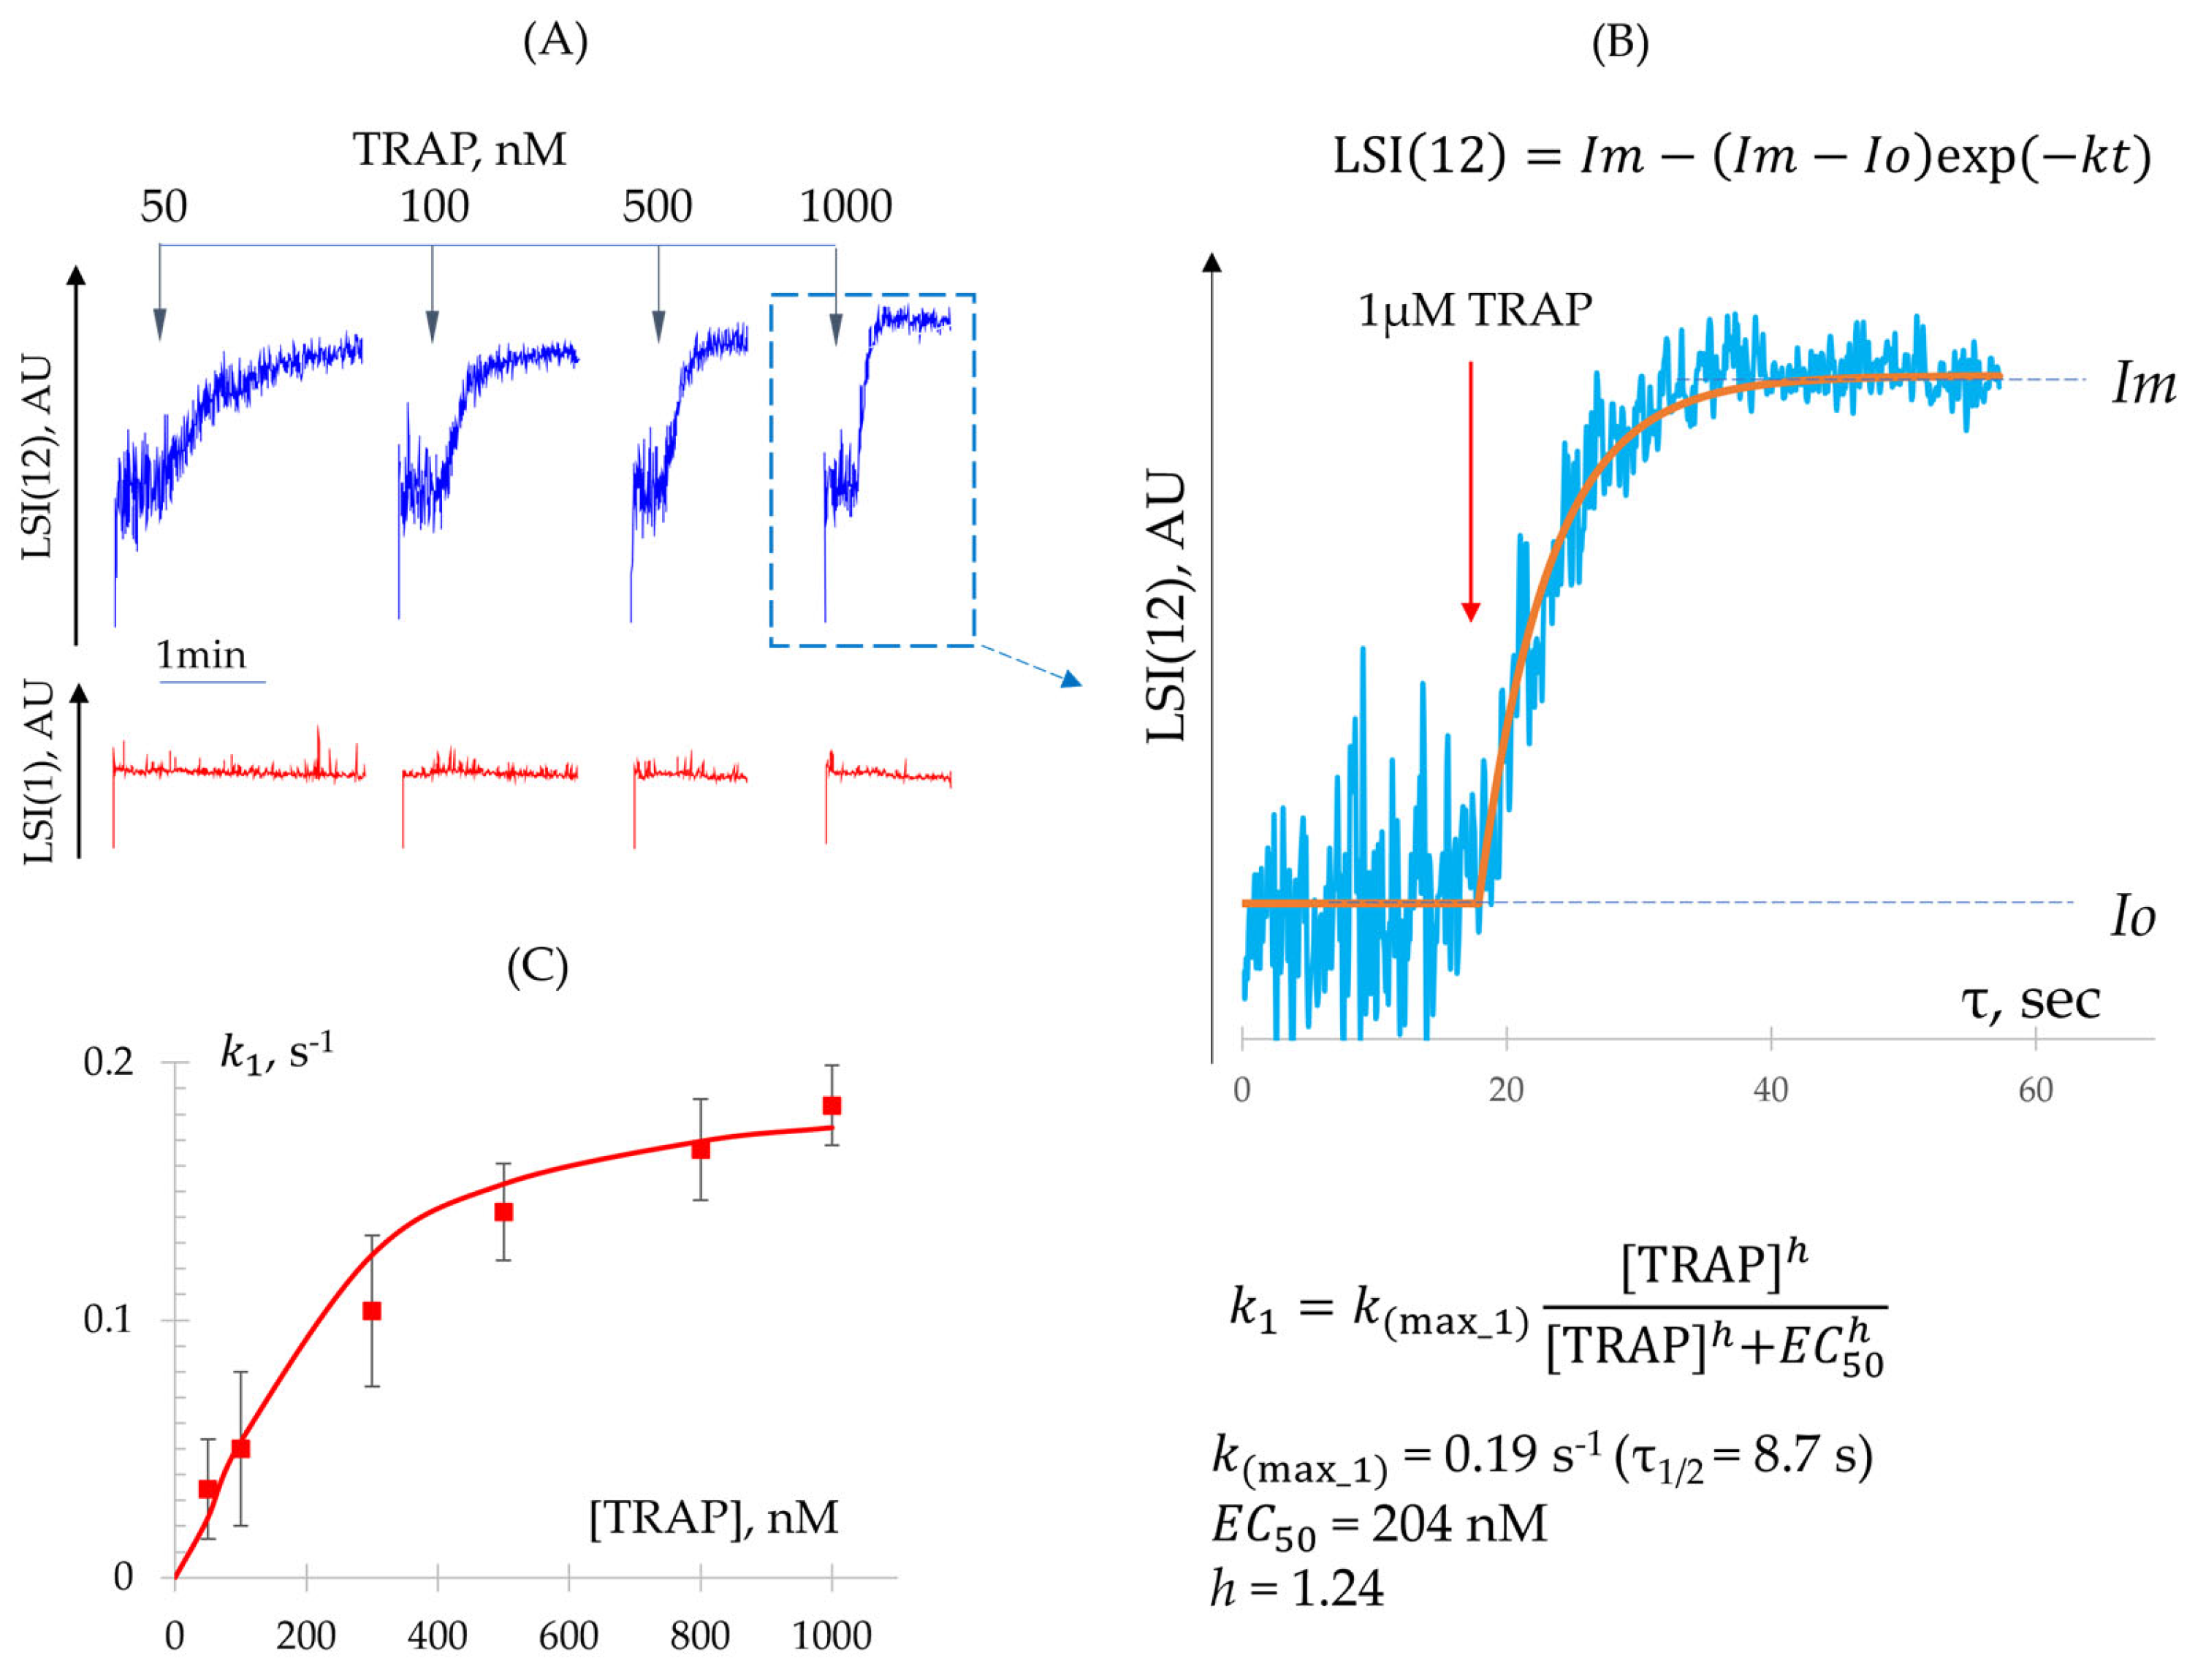
- Determination of Constant (Shape Change Reaction)
- Determination of − Constants (Integrin Activation and Platelet Aggregation)
3.3.2. Quantitative Characterization of Platelet Desensitization Reactions
- Determination of (Desensitization from Shape Change State)
- Determination of (Desensitization from Integrin Activation State)
3.3.3. Determination of (Quantitative Characterization of Platelet Inhibition Reactions)
3.4. Experimental and Theoretical (Modeled) Data Are Closely Related
4. Discussion
Limitations of This Study
5. Conclusions
Supplementary Materials
Author Contributions
Funding
Institutional Review Board Statement
Informed Consent Statement
Data Availability Statement
Acknowledgments
Conflicts of Interest
References
- Paul, B.Z.; Daniel, J.L.; Kunapuli, S.P. Platelet Shape Change Is Mediated by Both Calcium-Dependent and -Independent Signaling Pathways. Role of P160 Rho-Associated Coiled-Coil-Containing Protein Kinase in Platelet Shape Change. J. Biol. Chem. 1999, 274, 28293–28300. [Google Scholar] [CrossRef] [PubMed]
- Offermanns, S. Activation of Platelet Function through G Protein-Coupled Receptors. Circ. Res. 2006, 99, 1293–1304. [Google Scholar] [CrossRef] [PubMed]
- Jackson, S.P. The Growing Complexity of Platelet Aggregation. Blood 2007, 109, 5087–5095. [Google Scholar] [CrossRef]
- Mattheij, N.J.A.; Gilio, K.; van Kruchten, R.; Jobe, S.M.; Wieschhaus, A.J.; Chishti, A.H.; Collins, P.; Heemskerk, J.W.M.; Cosemans, J.M.E.M. Dual Mechanism of Integrin αIIbβ3 Closure in Procoagulant Platelets. J. Biol. Chem. 2013, 288, 13325–13336. [Google Scholar] [CrossRef]
- Simone, I.D.; Baaten, C.C.F.M.J.; Gibbins, J.M.; Cate, H.T.; Heemskerk, J.W.M.; Jones, C.I.; van der Meijden, P.E.J. Repeated Platelet Activation and the Potential of Previously Activated Platelets to Contribute to Thrombus Formation. J. Thromb. Haemost. 2023, 21, 1289–1306. [Google Scholar] [CrossRef]
- Podolnikova, N.P.; Yakovlev, S.; Yakubenko, V.P.; Wang, X.; Gorkun, O.V.; Ugarova, T.P. The Interaction of Integrin αIIbβ3 with Fibrin Occurs through Multiple Binding Sites in the αIIb β-Propeller Domain. J. Biol. Chem. 2014, 289, 2371–2383. [Google Scholar] [CrossRef]
- Montague, S.J.; Andrews, R.K.; Gardiner, E.E. Mechanisms of Receptor Shedding in Platelets. Blood 2018, 132, 2535–2545. [Google Scholar] [CrossRef]
- Baaten, C.C.F.M.J.; Ten Cate, H.; van der Meijden, P.E.J.; Heemskerk, J.W.M. Platelet Populations and Priming in Hematological Diseases. Blood Rev. 2017, 31, 389–399. [Google Scholar] [CrossRef]
- Lee, E.C.; Cameron, S.J. Cancer and Thrombotic Risk: The Platelet Paradigm. Front. Cardiovasc. Med. 2017, 4, 67. [Google Scholar] [CrossRef]
- Lebas, H.; Yahiaoui, K.; Martos, R.; Boulaftali, Y. Platelets Are at the Nexus of Vascular Diseases. Front. Cardiovasc. Med. 2019, 6, 132. [Google Scholar] [CrossRef]
- van der Meijden, P.E.J.; Heemskerk, J.W.M. Platelet Biology and Functions: New Concepts and Clinical Perspectives. Nat. Rev. Cardiol. 2019, 16, 166–179. [Google Scholar] [CrossRef] [PubMed]
- Aslan, J.E. Platelet Proteomes, Pathways, and Phenotypes as Informants of Vascular Wellness and Disease. Arterioscler. Thromb. Vasc. Biol. 2021, 41, 999–1011. [Google Scholar] [CrossRef] [PubMed]
- Allan, H.E.; Vadgama, A.; Armstrong, P.C.; Warner, T.D. What Can We Learn from Senescent Platelets, Their Transcriptomes and Proteomes? Platelets 2023, 34, 2200838. [Google Scholar] [CrossRef]
- Qureshi, A.H.; Chaoji, V.; Maiguel, D.; Faridi, M.H.; Barth, C.J.; Salem, S.M.; Singhal, M.; Stoub, D.; Krastins, B.; Ogihara, M.; et al. Proteomic and Phospho-Proteomic Profile of Human Platelets in Basal, Resting State: Insights into Integrin Signaling. PLoS ONE 2009, 4, e7627. [Google Scholar] [CrossRef]
- Hamad, M.A.; Krauel, K.; Schanze, N.; Gauchel, N.; Stachon, P.; Nuehrenberg, T.; Zurek, M.; Duerschmied, D. Platelet Subtypes in Inflammatory Settings. Front. Cardiovasc. Med. 2022, 9, 823549. [Google Scholar] [CrossRef]
- Dale, G.L. Coated-Platelets: An Emerging Component of the Procoagulant Response. J. Thromb. Haemost. 2005, 3, 2185–2192. [Google Scholar] [CrossRef]
- Carminita, E.; Tourn, J.; Crescence, L.; Brouilly, N.; Merrill-Skoloff, G.; Mazharian, A.; Dubois, C.; Panicot-Dubois, L. A Thrombus Is Formed by a Gradient of Platelet Activation and Procoagulant Endothelium. Res. Pract. Thromb. Haemost. 2023, 7, 102209. [Google Scholar] [CrossRef]
- Soma, P.; Swanepoel, A.C.; du Plooy, J.N.; Mqoco, T.; Pretorius, E. Flow Cytometric Analysis of Platelets Type 2 Diabetes Mellitus Reveals “angry” Platelets. Cardiovasc. Diabetol. 2016, 15, 52. [Google Scholar] [CrossRef]
- Stasko, J.; Holly, P.; Kubisz, P. A New Decade Awaits Sticky Platelet Syndrome: Where Are We Now, How Do We Manage and What Are the Complications? Expert. Rev. Hematol. 2022, 15, 53–63. [Google Scholar] [CrossRef]
- Sloos, P.H.; Vulliamy, P.; van ’t Veer, C.; Gupta, A.S.; Neal, M.D.; Brohi, K.; Juffermans, N.P.; Kleinveld, D.J.B. Platelet Dysfunction after Trauma: From Mechanisms to Targeted Treatment. Transfusion 2022, 62, S281–S300. [Google Scholar] [CrossRef]
- Belyaev, A.V.; Dunster, J.L.; Gibbins, J.M.; Panteleev, M.A.; Volpert, V. Modeling Thrombosis in Silico: Frontiers, Challenges, Unresolved Problems and Milestones. Phys. Life Rev. 2018, 26–27, 57–95. [Google Scholar] [CrossRef] [PubMed]
- Nechipurenko, D.Y.; Shibeko, A.M.; Sveshnikova, A.N.; Panteleev, M.A. In Silico Hemostasis Modeling and Prediction. Hamostaseologie 2020, 40, 524–535. [Google Scholar] [CrossRef] [PubMed]
- Owen, M.J.; Wright, J.R.; Tuddenham, E.G.D.; King, J.R.; Goodall, A.H.; Dunster, J.L. Mathematical Models of Coagulation—Are We There Yet? J. Thromb. Haemost. 2024, 22, 1689–1703. [Google Scholar] [CrossRef]
- Ye, T.; Shi, H.; Phan-Thien, N.; Lim, C.T. The Key Events of Thrombus Formation: Platelet Adhesion and Aggregation. Biomech. Model. Mechanobiol. 2020, 19, 943–955. [Google Scholar] [CrossRef]
- Kaneva, V.N.; Dunster, J.L.; Volpert, V.; Ataullahanov, F.; Panteleev, M.A.; Nechipurenko, D.Y. Modeling Thrombus Shell: Linking Adhesion Receptor Properties and Macroscopic Dynamics. Biophys. J. 2021, 120, 334–351. [Google Scholar] [CrossRef]
- Vasilev, G.A.; Filkova, A.A.; Sveshnikova, A.N. Study of Reversible Platelet Aggregation Model by Nonlinear Dynamics. Mathematics 2021, 9, 759. [Google Scholar] [CrossRef]
- Filkova, A.A.; Martyanov, A.A.; Garzon Dasgupta, A.K.; Panteleev, M.A.; Sveshnikova, A.N. Quantitative Dynamics of Reversible Platelet Aggregation: Mathematical Modelling and Experiments. Sci. Rep. 2019, 9, 6217. [Google Scholar] [CrossRef]
- Stalker, T.J.; Welsh, J.D.; Tomaiuolo, M.; Wu, J.; Colace, T.V.; Diamond, S.L.; Brass, L.F. A Systems Approach to Hemostasis: 3. Thrombus Consolidation Regulates Intrathrombus Solute Transport and Local Thrombin Activity. Blood 2014, 124, 1824–1831. [Google Scholar] [CrossRef]
- Yusuf, M.Z.; Raslan, Z.; Atkinson, L.; Aburima, A.; Thomas, S.G.; Naseem, K.M.; Calaminus, S.D.J. Prostacyclin Reverses Platelet Stress Fibre Formation Causing Platelet Aggregate Instability. Sci. Rep. 2017, 7, 5582. [Google Scholar] [CrossRef]
- Kleppe, R.; Jonassen, I.; Døskeland, S.O.; Selheim, F. Mathematical Modelling of Nitric Oxide/Cyclic GMP/Cyclic AMP Signalling in Platelets. Int. J. Mol. Sci. 2018, 19, 612. [Google Scholar] [CrossRef]
- Wangorsch, G.; Butt, E.; Mark, R.; Hubertus, K.; Geiger, J.; Dandekar, T.; Dittrich, M. Time-Resolved in Silico Modeling of Fine-Tuned cAMP Signaling in Platelets: Feedback Loops, Titrated Phosphorylations and Pharmacological Modulation. BMC Syst. Biol. 2011, 5, 178. [Google Scholar] [CrossRef] [PubMed]
- Patel, K.B.; Bergmeier, W.; Fogelson, A.L. Modeling Platelet P2Y1/12 Pathway to Integrin Activation. Biophys. J. 2025. In Press. [Google Scholar] [CrossRef] [PubMed]
- Zou, J.; Swieringa, F.; de Laat, B.; de Groot, P.G.; Roest, M.; Heemskerk, J.W.M. Reversible Platelet Integrin αIIbβ3 Activation and Thrombus Instability. Int. J. Mol. Sci. 2022, 23, 12512. [Google Scholar] [CrossRef]
- Mindukshev, I.; Gambaryan, S.; Kehrer, L.; Schuetz, C.; Kobsar, A.; Rukoyatkina, N.; Nikolaev, V.O.; Krivchenko, A.; Watson, S.P.; Walter, U.; et al. Low Angle Light Scattering Analysis: A Novel Quantitative Method for Functional Characterization of Human and Murine Platelet Receptors. Clin. Chem. Lab. Med. 2012, 50, 1253–1262. [Google Scholar] [CrossRef]
- Mikhailova, D.M.; Sudnitsyna, J.; Kovgan, P.; Naida, L.; Kharazova, A.; Mindukshev, I.; Gambaryan, S. Analysis of Ferric Protoporphyrin IX Effects on Human Platelets: Hematin Is a More Potent Agonist than Hemin. Cells 2025, 14, 255. [Google Scholar] [CrossRef]
- Zhu, J.; Zhu, J.; Springer, T.A. Complete Integrin Headpiece Opening in Eight Steps. J. Cell Biol. 2013, 201, 1053–1068. [Google Scholar] [CrossRef]
- Mindukshev, I.; Fock, E.; Dobrylko, I.; Sudnitsyna, J.; Gambaryan, S.; Panteleev, M.A. Platelet Hemostasis Reactions at Different Temperatures Correlate with Intracellular Calcium Concentration. Int. J. Mol. Sci. 2022, 23, 10667. [Google Scholar] [CrossRef]
- Altszyler, E.; Ventura, A.C.; Colman-Lerner, A.; Chernomoretz, A. Ultrasensitivity in Signaling Cascades Revisited: Linking Local and Global Ultrasensitivity Estimations. PLoS ONE 2017, 12, e0180083. [Google Scholar] [CrossRef]
- Zhang, Q.; Bhattacharya, S.; Andersen, M.E. Ultrasensitive Response Motifs: Basic Amplifiers in Molecular Signalling Networks. Open Biol. 2013, 3, 130031. [Google Scholar] [CrossRef]
- Ferrell, J.E.; Ha, S.H. Ultrasensitivity Part I: Michaelian Responses and Zero-Order Ultrasensitivity. Trends Biochem. Sci. 2014, 39, 496–503. [Google Scholar] [CrossRef]
- Ferrell, J.E.; Ha, S.H. Ultrasensitivity Part II: Multisite Phosphorylation, Stoichiometric Inhibitors, and Positive Feedback. Trends Biochem. Sci. 2014, 39, 556–569. [Google Scholar] [CrossRef] [PubMed]
- Smoluchowski, M.V. Mathematical Theory of the Kinetics of the Coagulation of Colloidal Solutions. Z. Phys. Chem. 1917, 92, 129–168. [Google Scholar]
- Zhang, K.; Chen, J. The Regulation of Integrin Function by Divalent Cations. Cell Adh Migr. 2012, 6, 20–29. [Google Scholar] [CrossRef]
- Naseem, K.M.; Roberts, W. Nitric Oxide at a Glance. Platelets 2011, 22, 148–152. [Google Scholar] [CrossRef]
- Smolenski, A. Novel Roles of cAMP/cGMP-Dependent Signaling in Platelets. J. Thromb. Haemost. 2012, 10, 167–176. [Google Scholar] [CrossRef]
- Hamad, M.A.; Schanze, N.; Schommer, N.; Nührenberg, T.; Duerschmied, D. Reticulated Platelets-Which Functions Have Been Established by In Vivo and In Vitro Data? Cells 2021, 10, 1172. [Google Scholar] [CrossRef]
- Sveshnikova, A.N.; Panteleev, M.A. Signal Transduction and Transformation by the Platelet Activation Cascade: Systems Biology Insights. Hamostaseologie 2025, 45, 49–62. [Google Scholar] [CrossRef]
- Kumar, N.; Cramer, G.M.; Dahaj, S.A.Z.; Sundaram, B.; Celli, J.P.; Kulkarni, R.V. Stochastic Modeling of Phenotypic Switching and Chemoresistance in Cancer Cell Populations. Sci. Rep. 2019, 9, 10845. [Google Scholar] [CrossRef]
- De Boer, R.J.; Yates, A.J. Modeling T Cell Fate. Annu. Rev. Immunol. 2023, 41, 513–532. [Google Scholar] [CrossRef]
- Ferrell, J.E.; Ha, S.H. Ultrasensitivity Part III: Cascades, Bistable Switches, and Oscillators. Trends Biochem. Sci. 2014, 39, 612–618. [Google Scholar] [CrossRef]
- Huang, C.Y.; Ferrell, J.E. Ultrasensitivity in the Mitogen-Activated Protein Kinase Cascade. Proc. Natl. Acad. Sci. USA 1996, 93, 10078–10083. [Google Scholar] [CrossRef] [PubMed]
- De Boeck, J.; Rombouts, J.; Gelens, L. A Modular Approach for Modeling the Cell Cycle Based on Functional Response Curves. PLoS Comput. Biol. 2021, 17, e1009008. [Google Scholar] [CrossRef] [PubMed]
- Schwarz, U.R.; Walter, U.; Eigenthaler, M. Taming Platelets with Cyclic Nucleotides. Biochem. Pharmacol. 2001, 62, 1153–1161. [Google Scholar] [CrossRef] [PubMed]
- Cosemans, J.M.E.M.; Munnix, I.C.A.; Wetzker, R.; Heller, R.; Jackson, S.P.; Heemskerk, J.W.M. Continuous Signaling via PI3K Isoforms Beta and Gamma Is Required for Platelet ADP Receptor Function in Dynamic Thrombus Stabilization. Blood 2006, 108, 3045–3052. [Google Scholar] [CrossRef]
- Zou, J.; Wu, J.; Roest, M.; Heemskerk, J.W.M. Long-Term Platelet Priming after Glycoprotein VI Stimulation in Comparison to Protease-Activating Receptor (PAR) Stimulation. PLoS ONE 2021, 16, e0247425. [Google Scholar] [CrossRef]
- Beck, F.; Geiger, J.; Gambaryan, S.; Solari, F.A.; Dell’Aica, M.; Loroch, S.; Mattheij, N.J.; Mindukshev, I.; Pötz, O.; Jurk, K.; et al. Temporal Quantitative Phosphoproteomics of ADP Stimulation Reveals Novel Central Nodes in Platelet Activation and Inhibition. Blood 2017, 129, e1–e12. [Google Scholar] [CrossRef]
- Beck, F.; Geiger, J.; Gambaryan, S.; Veit, J.; Vaudel, M.; Nollau, P.; Kohlbacher, O.; Martens, L.; Walter, U.; Sickmann, A.; et al. Time-Resolved Characterization of cAMP/PKA-Dependent Signaling Reveals That Platelet Inhibition Is a Concerted Process Involving Multiple Signaling Pathways. Blood 2014, 123, e1–e10. [Google Scholar] [CrossRef]
- Lemmens, T.P.; Coenen, D.M.; Swieringa, F.; Niessen, I.C.L.; Coort, S.L.M.; Koenen, R.R.; Kutmon, M.; Cosemans, J.M.E.M. Finding the “Switch” in Platelet Activation: Prediction of Key Mediators Involved in Reversal of Platelet Activation Using a Novel Network Biology Approach. J. Proteom. 2022, 261, 104577. [Google Scholar] [CrossRef]


| ADP | TRAP | |
|---|---|---|
| , nM | 46.8 ± 7.3 | 204.0 ± 18.7 |
| (Hill) | 1.27 ± 0.08 | 1.24 ± 0.10 |
| n | 8 | 6 |
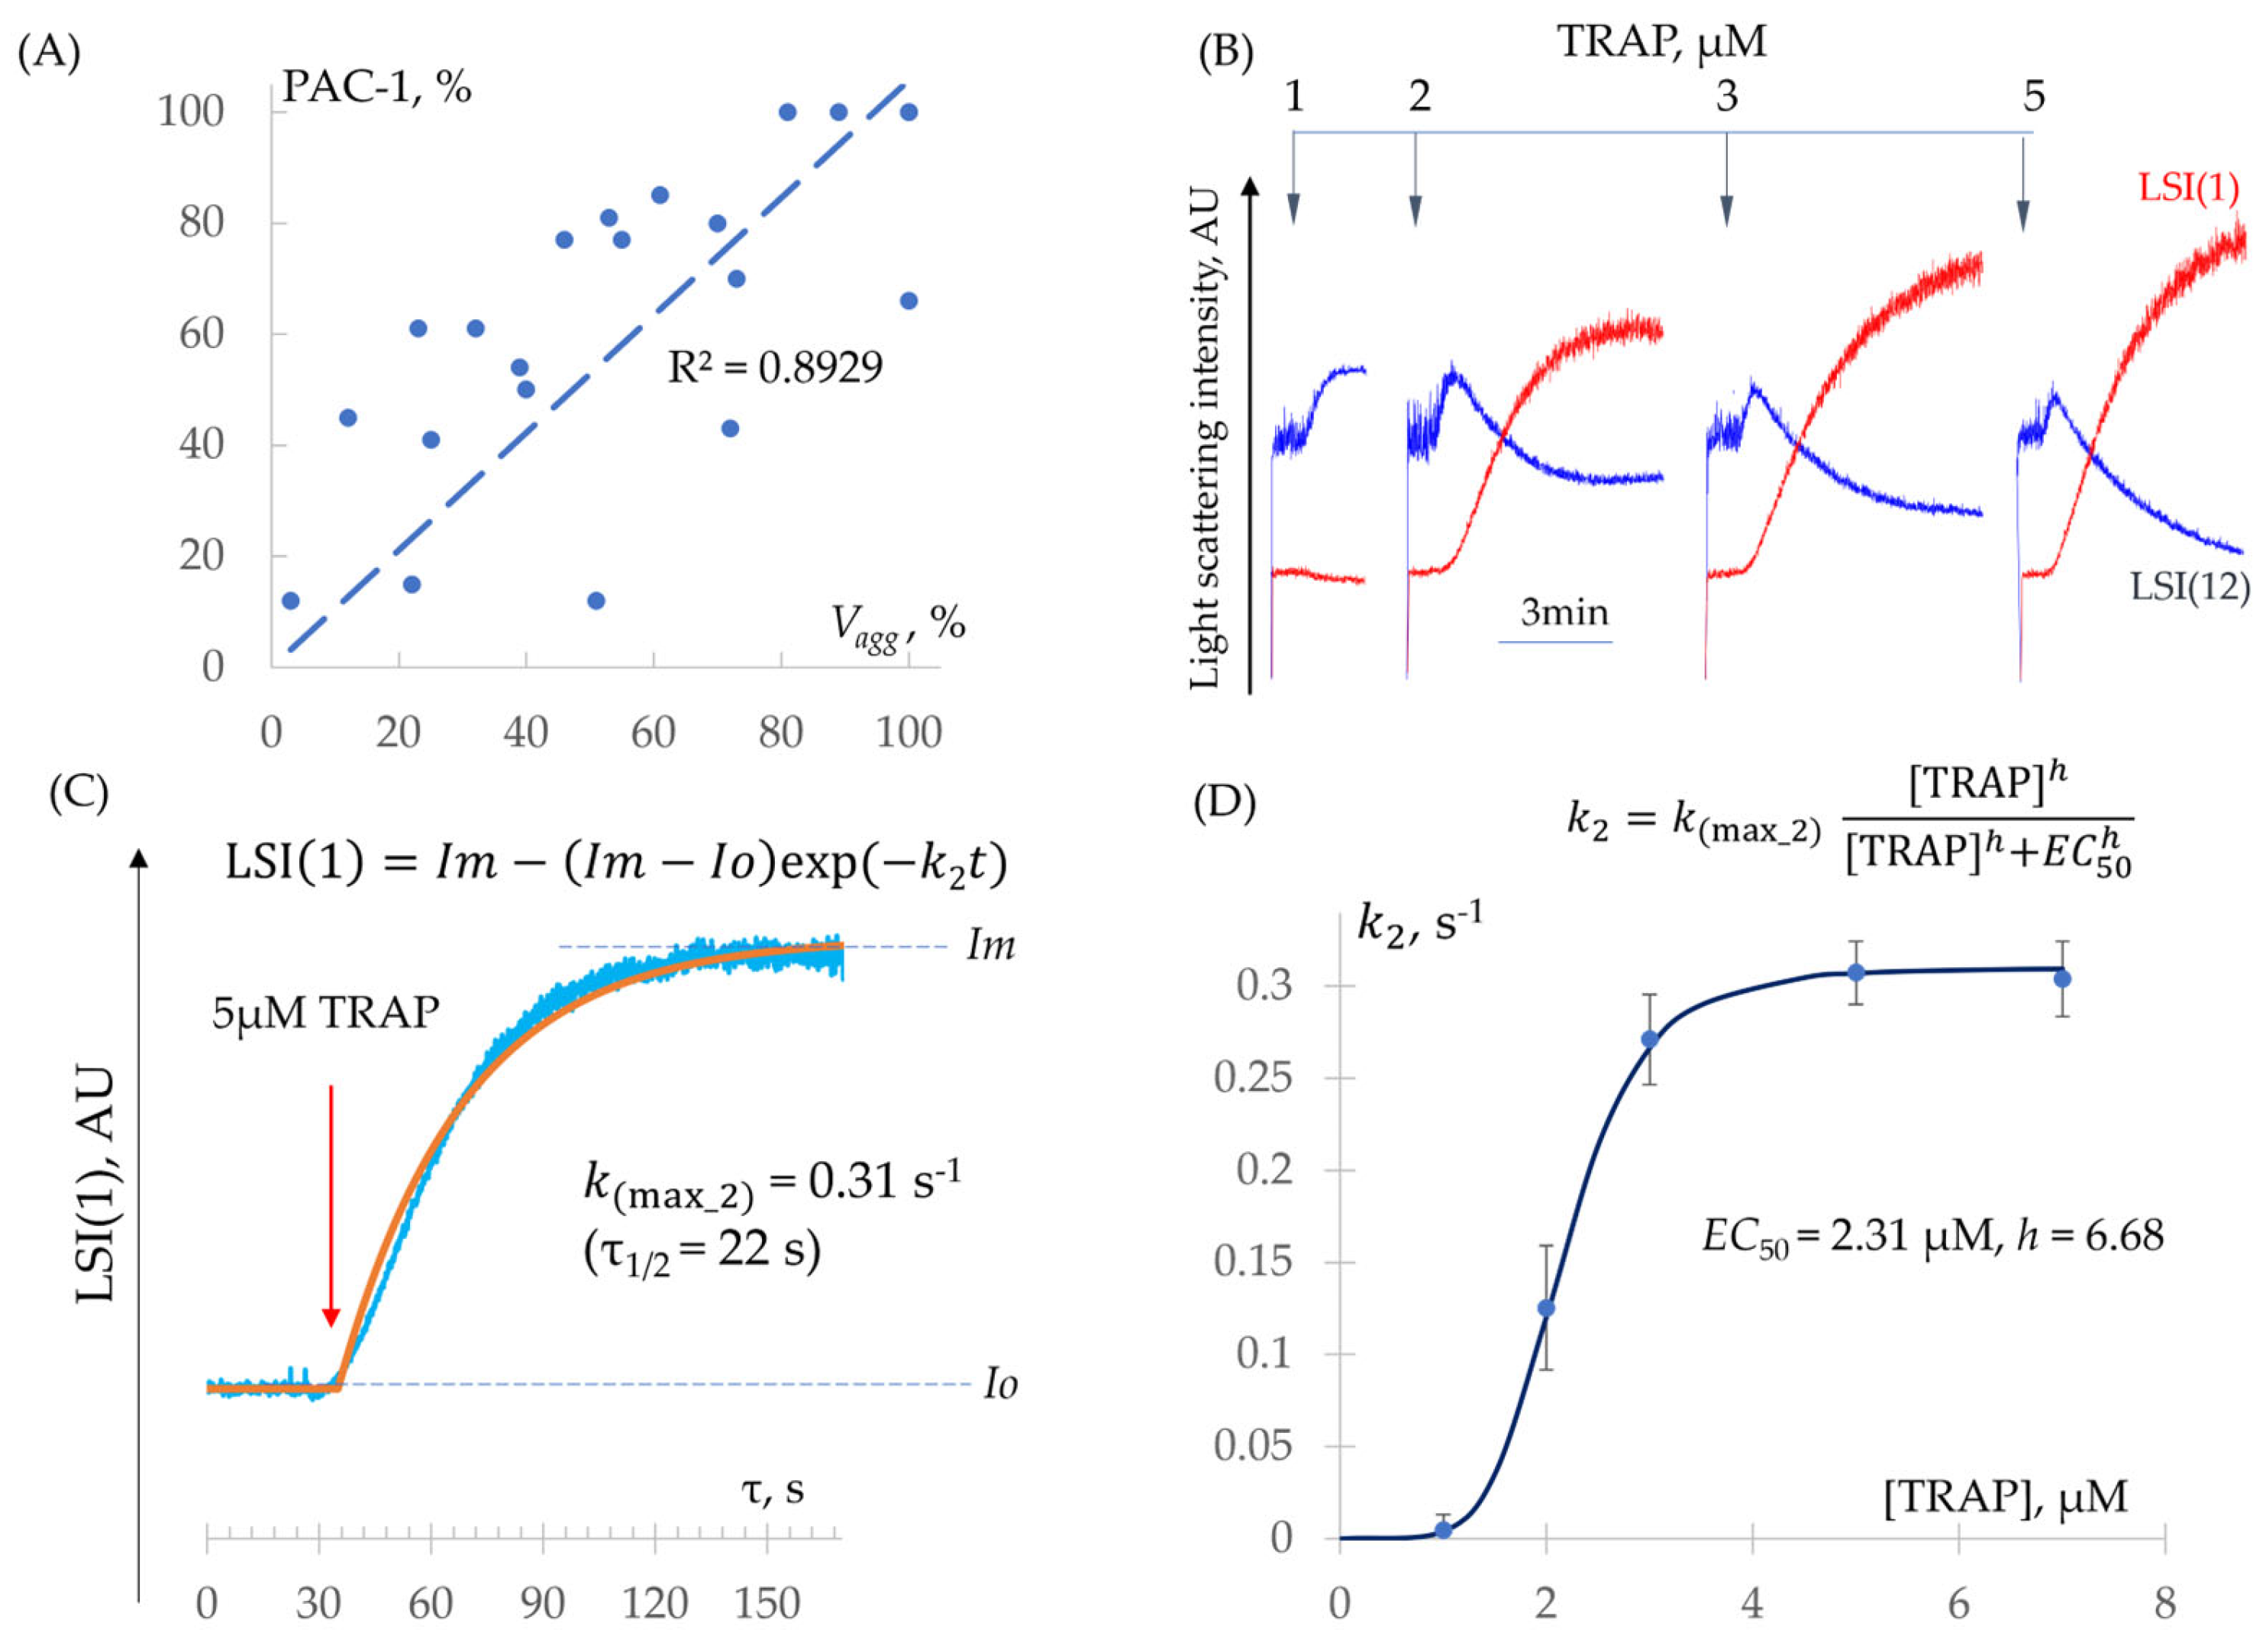
| ADP | TRAP | |
|---|---|---|
| , nM | 589.8 ± 9.3 | 2309 ± 233 |
| (Hill) | 3.92 ± 0.61 | 6.68 ± 0.49 |
| n | 10 | 6 |
| ADP, nM | 1000 | 2000 | 5000 |
|---|---|---|---|
| , 1/s | 0.0019 | 0.0013 | 0.0005 |
| τ1/2, s | 364 | 554 | 1280 |
| n | 5 | 5 | 5 |
| ADP, nM | 1000 | 2000 | 5000 |
|---|---|---|---|
| , 1/s | 0.0279 | 0.0092 | 0.0026 |
| τ1/2, s | 25 | 76 | 270 |
| n | 5 | 5 | 5 |
| Shape Change | Aggregation | [Ca2+]i | |
|---|---|---|---|
| , 1/s | 0.31 ± 0.04 | 0.31 ± 0.10 | 0.085 ± 0.041 |
| τ1/2, s | 31.28 | 2.51 | 18.20 |
| n | 7 | 4 | 5 |
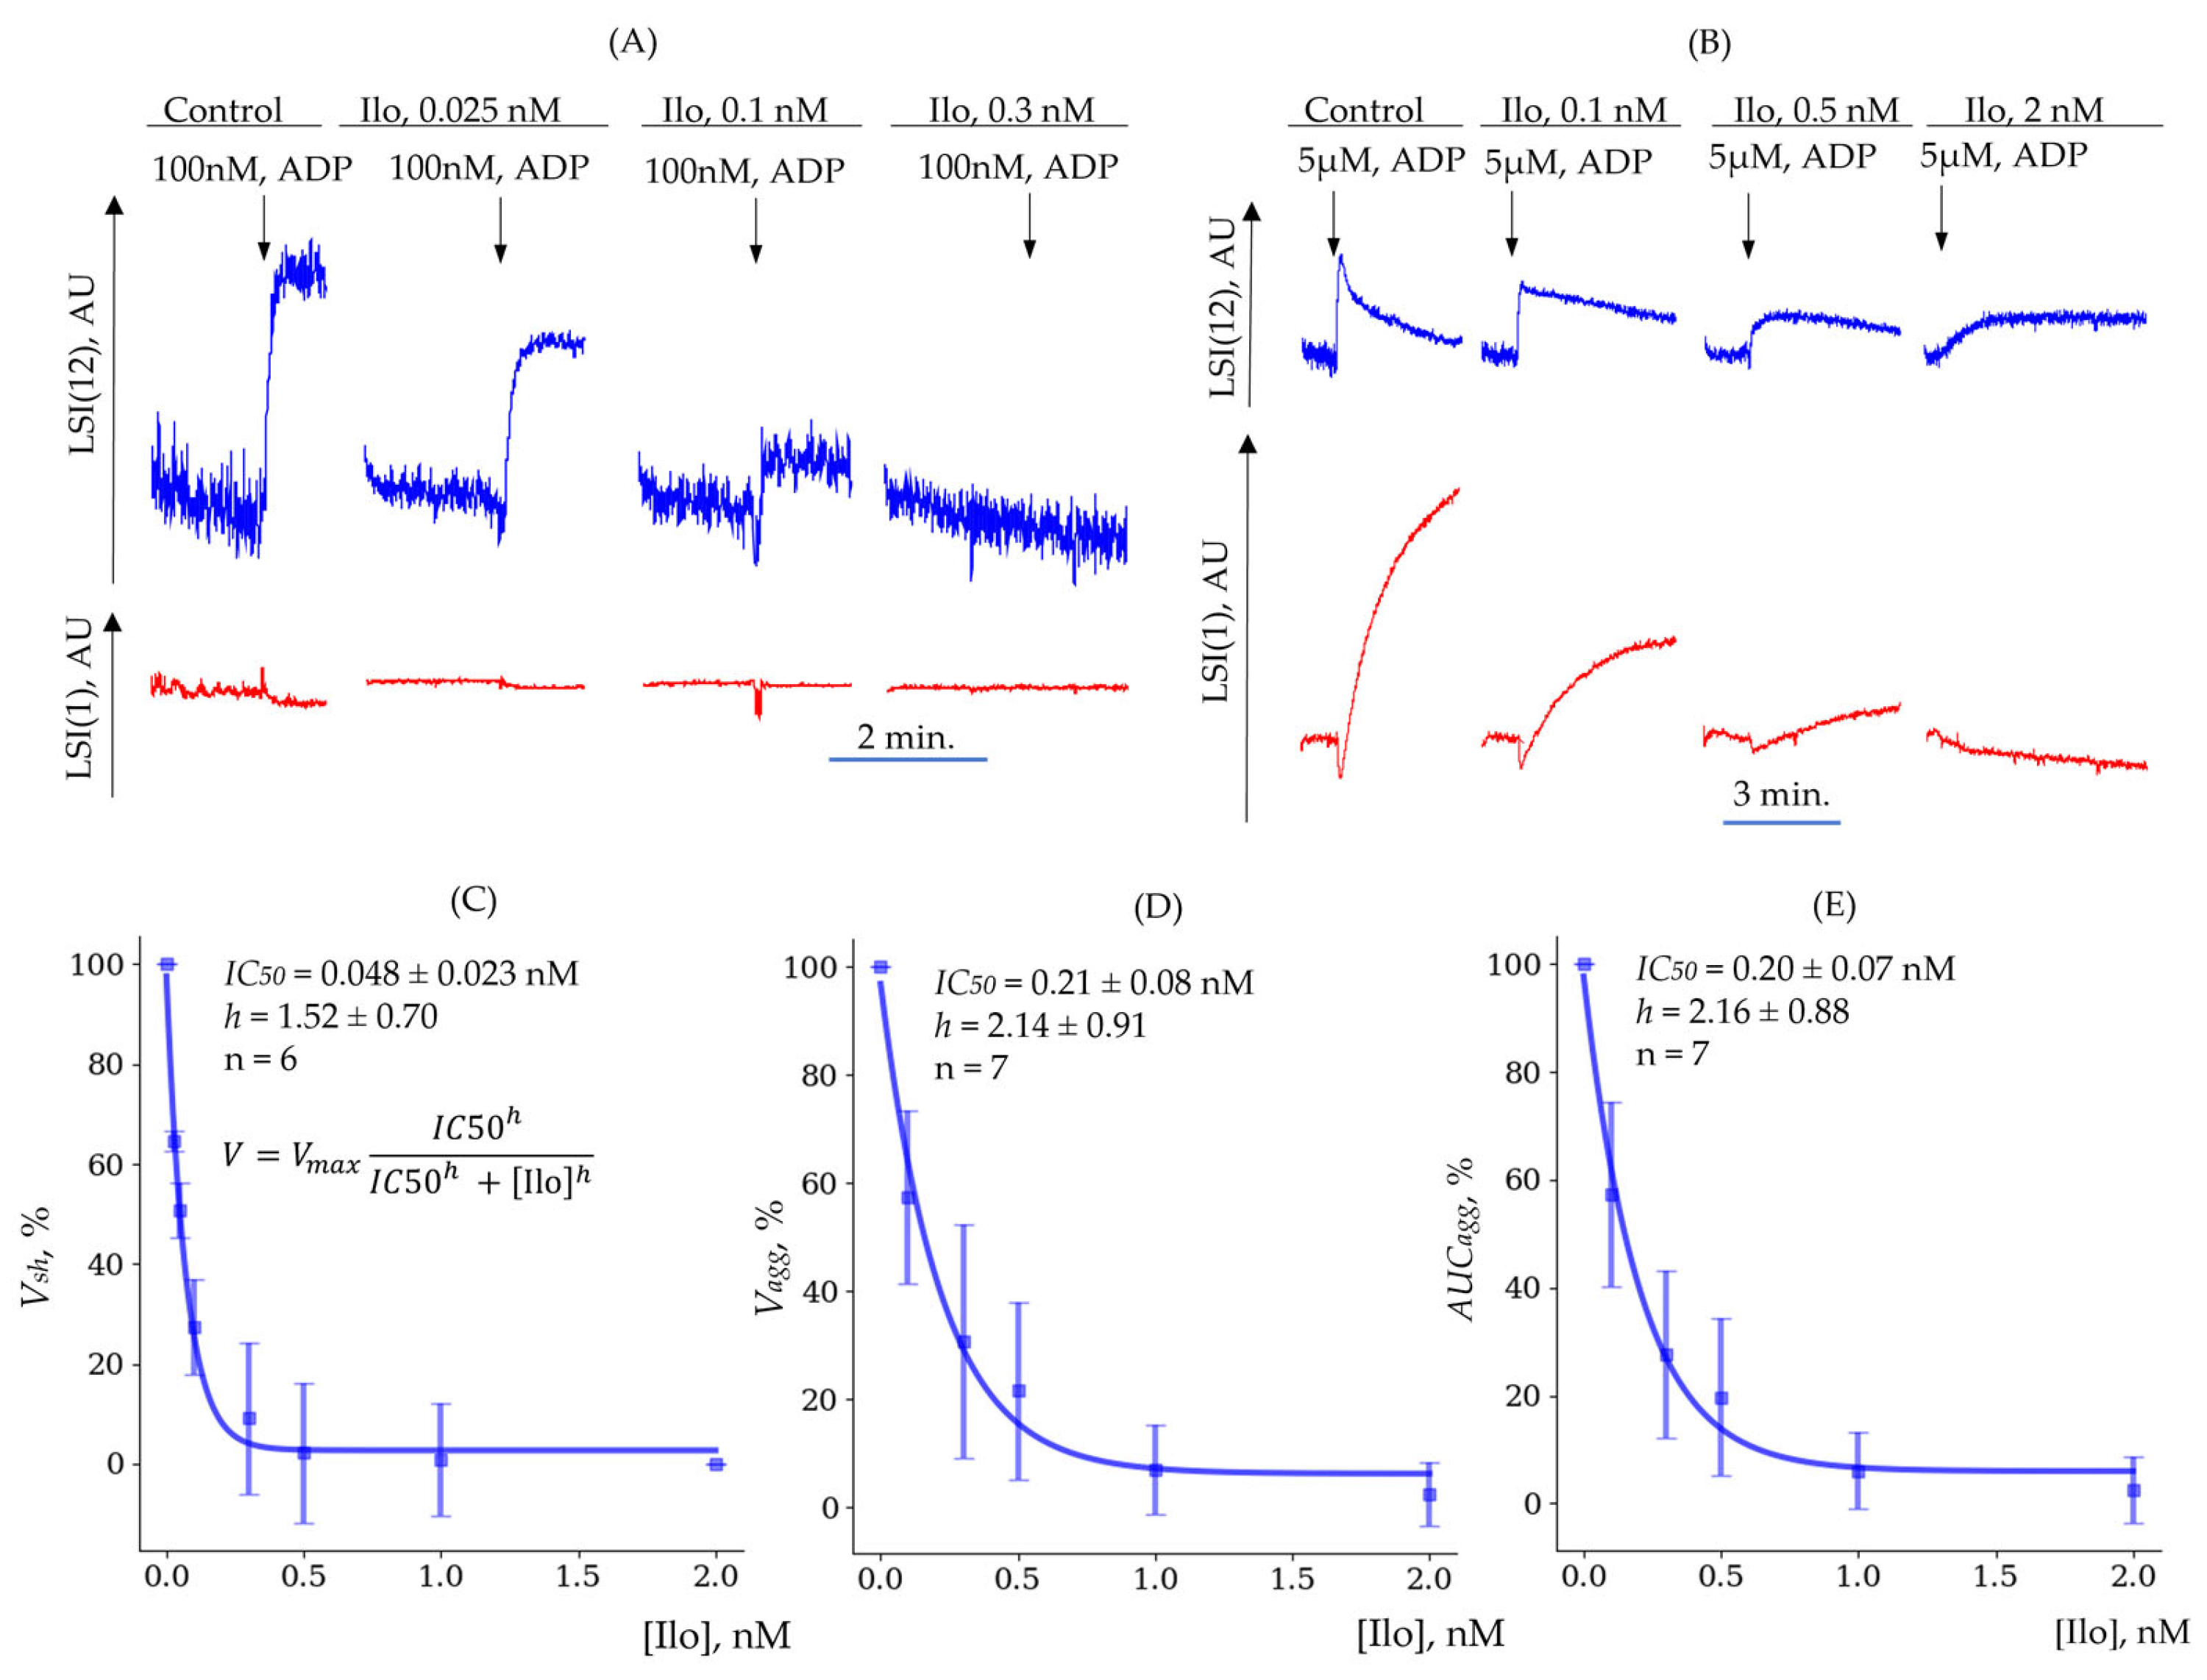
| Shape Change () | Aggregation () | Aggregation () | |
|---|---|---|---|
| , nM | 0.048 ± 0.023 | 0.21 ± 0.08 | 0.20 ± 0.07 |
| 1.52 ± 0.70 | 2.14 ± 0.91 | 2.16 ± 0.88 | |
| n | 6 | 7 | 7 |
Disclaimer/Publisher’s Note: The statements, opinions and data contained in all publications are solely those of the individual author(s) and contributor(s) and not of MDPI and/or the editor(s). MDPI and/or the editor(s) disclaim responsibility for any injury to people or property resulting from any ideas, methods, instructions or products referred to in the content. |
© 2025 by the authors. Licensee MDPI, Basel, Switzerland. This article is an open access article distributed under the terms and conditions of the Creative Commons Attribution (CC BY) license (https://creativecommons.org/licenses/by/4.0/).
Share and Cite
Gerda, B.; Volkova, A.; Dobrylko, I.; Andreyeva, A.Y.; Dandekar, T.; Panteleev, M.A.; Gambaryan, S.; Mindukshev, I. Experimental and Mathematical Model of Platelet Hemostasis Kinetics. Cells 2025, 14, 677. https://doi.org/10.3390/cells14090677
Gerda B, Volkova A, Dobrylko I, Andreyeva AY, Dandekar T, Panteleev MA, Gambaryan S, Mindukshev I. Experimental and Mathematical Model of Platelet Hemostasis Kinetics. Cells. 2025; 14(9):677. https://doi.org/10.3390/cells14090677
Chicago/Turabian StyleGerda, Bogdan, Anastasiya Volkova, Irina Dobrylko, Aleksandra Yu. Andreyeva, Thomas Dandekar, Mikhail A. Panteleev, Stepan Gambaryan, and Igor Mindukshev. 2025. "Experimental and Mathematical Model of Platelet Hemostasis Kinetics" Cells 14, no. 9: 677. https://doi.org/10.3390/cells14090677
APA StyleGerda, B., Volkova, A., Dobrylko, I., Andreyeva, A. Y., Dandekar, T., Panteleev, M. A., Gambaryan, S., & Mindukshev, I. (2025). Experimental and Mathematical Model of Platelet Hemostasis Kinetics. Cells, 14(9), 677. https://doi.org/10.3390/cells14090677