
Nardostachys jatamansi Extract and Nardosinone Exert Neuroprotective Effects by Suppressing Glucose Metabolic Reprogramming and Modulating T Cell Infiltration

Abstract

1. Introduction
2. Materials and Methods
2.1. Animals
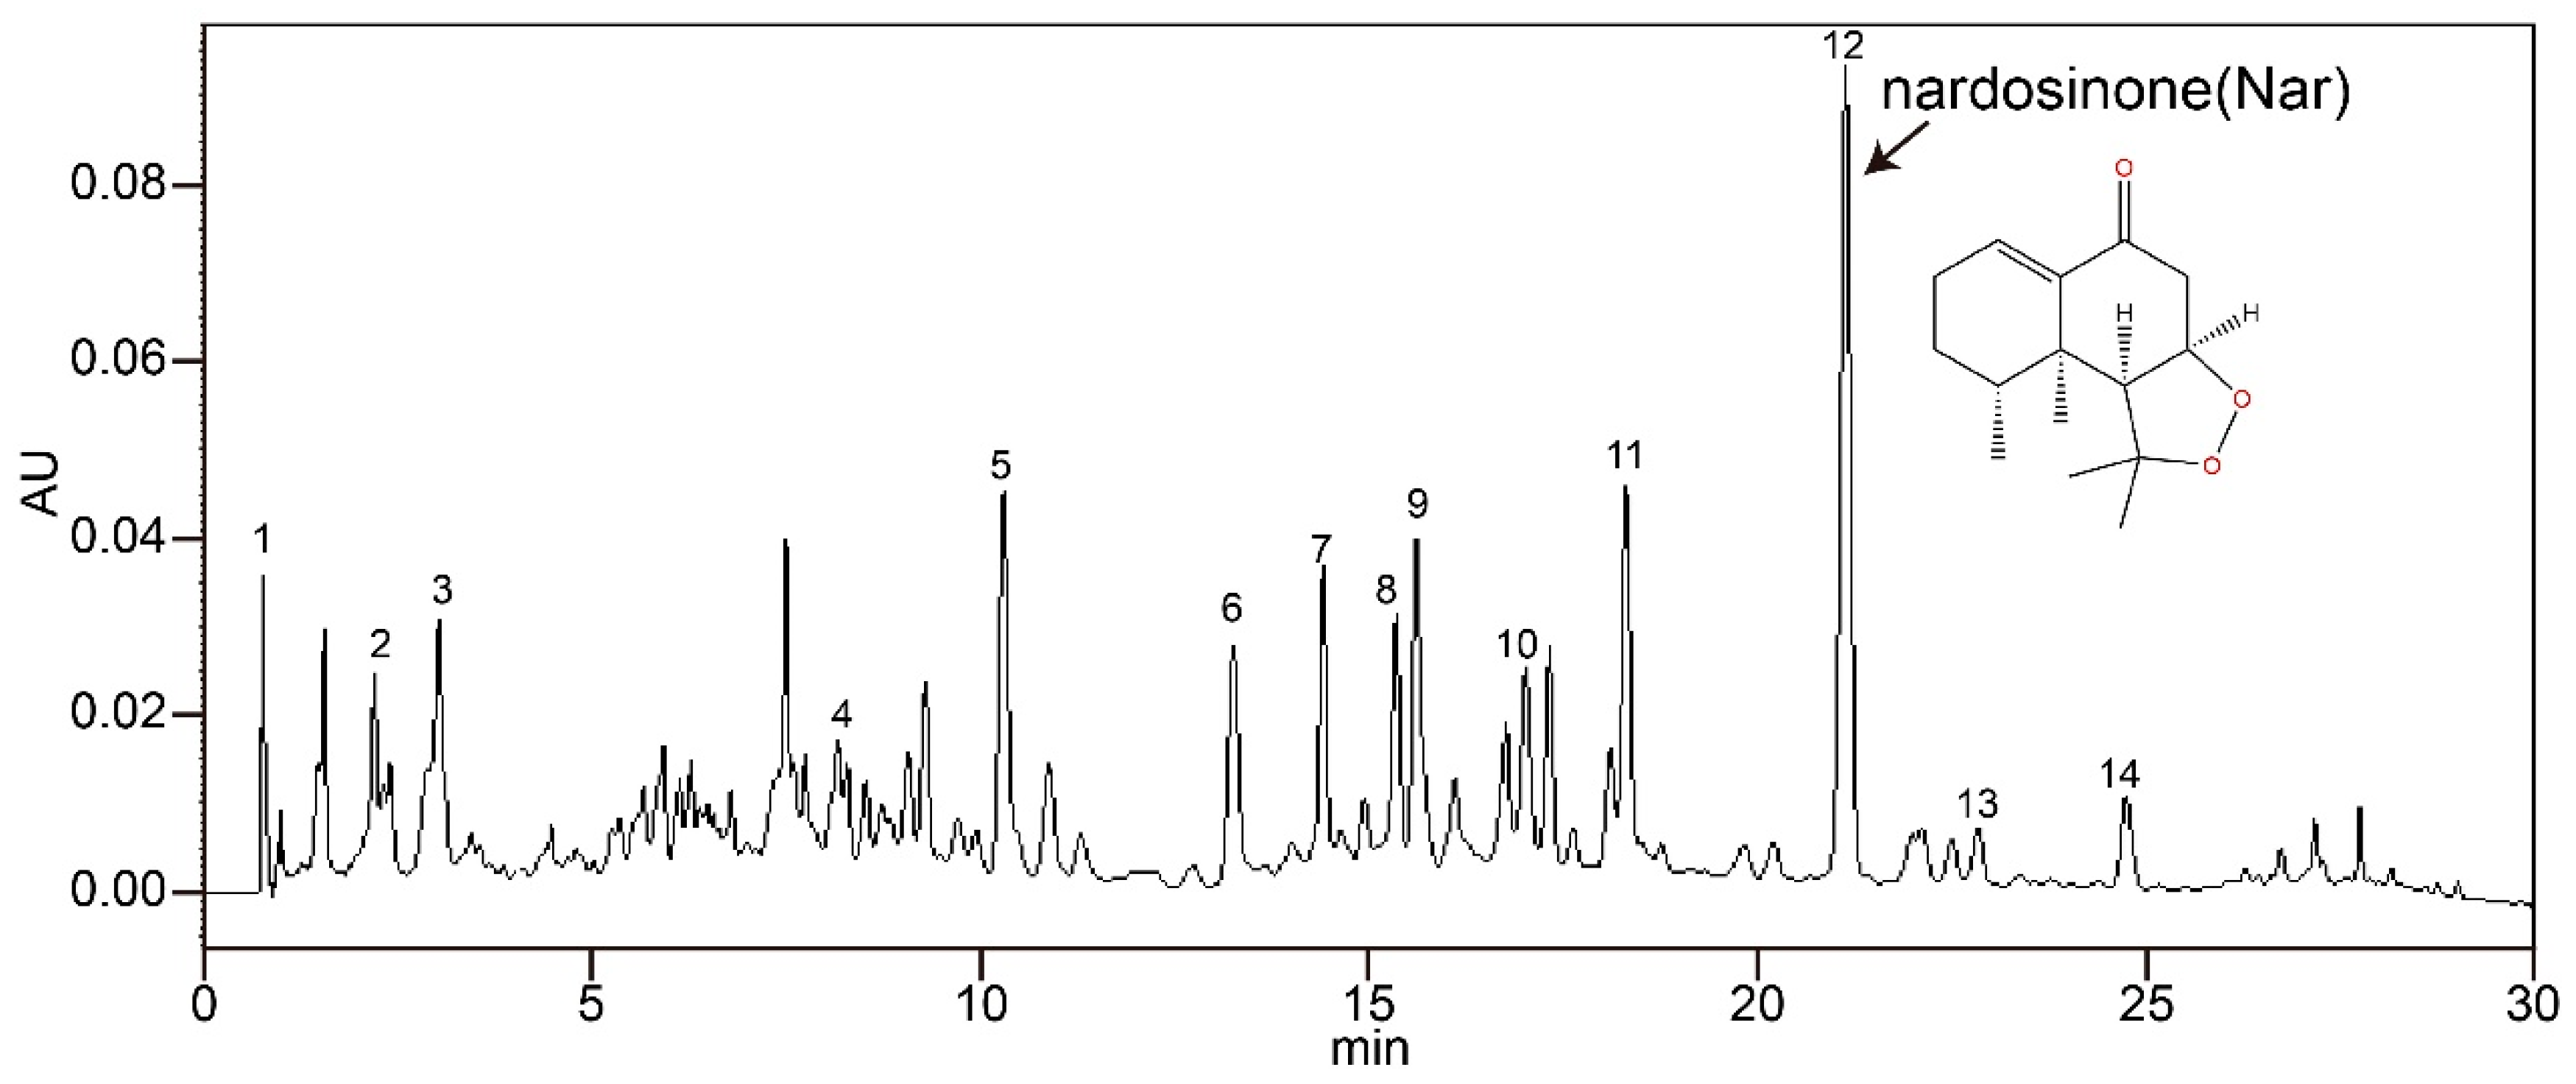
2.2. NJ-1A and Nar
2.3. Cell Culture and Treatment
2.4. Cell Viability Assay and Detection of Nitric Oxide and Cytokines
2.5. Real-Time Reverse Transcription-Polymerase Chain Reaction (Real-Time RT-PCR)
2.6. Reactive Oxygen Species (ROS)
2.7. EACR and OCR
2.8. Western Blot
2.9. The Effect of Conditioned Medium on Migration of CTLL-2 Cells
2.10. MPTP/p-Induced Chronic Mouse Parkinson Model and Treatment
2.11. Immunohistochemistry and Immunofluorescence
2.12. Rotarod
2.13. Statistical Analysis
3. Results
3.1. NJ-1A and Nar Can Inhibit the Production of Pro-Inflammatory Factors in BV-2 Cells Induced by LPS
3.2. NJ-1A and Nar Inhibit the Release of Reactive Oxygen Species (ROS) in Microglia Induced by LPS
3.3. NJ-1A and Nar Inhibit the Phosphorylation Levels of IκB-α and NF-κB p65
3.4. NJ-1A and Nar Can Inhibit the Glycolytic Process of LPS-Induced BV-2 Cells and Promote Oxidative Phosphorylation
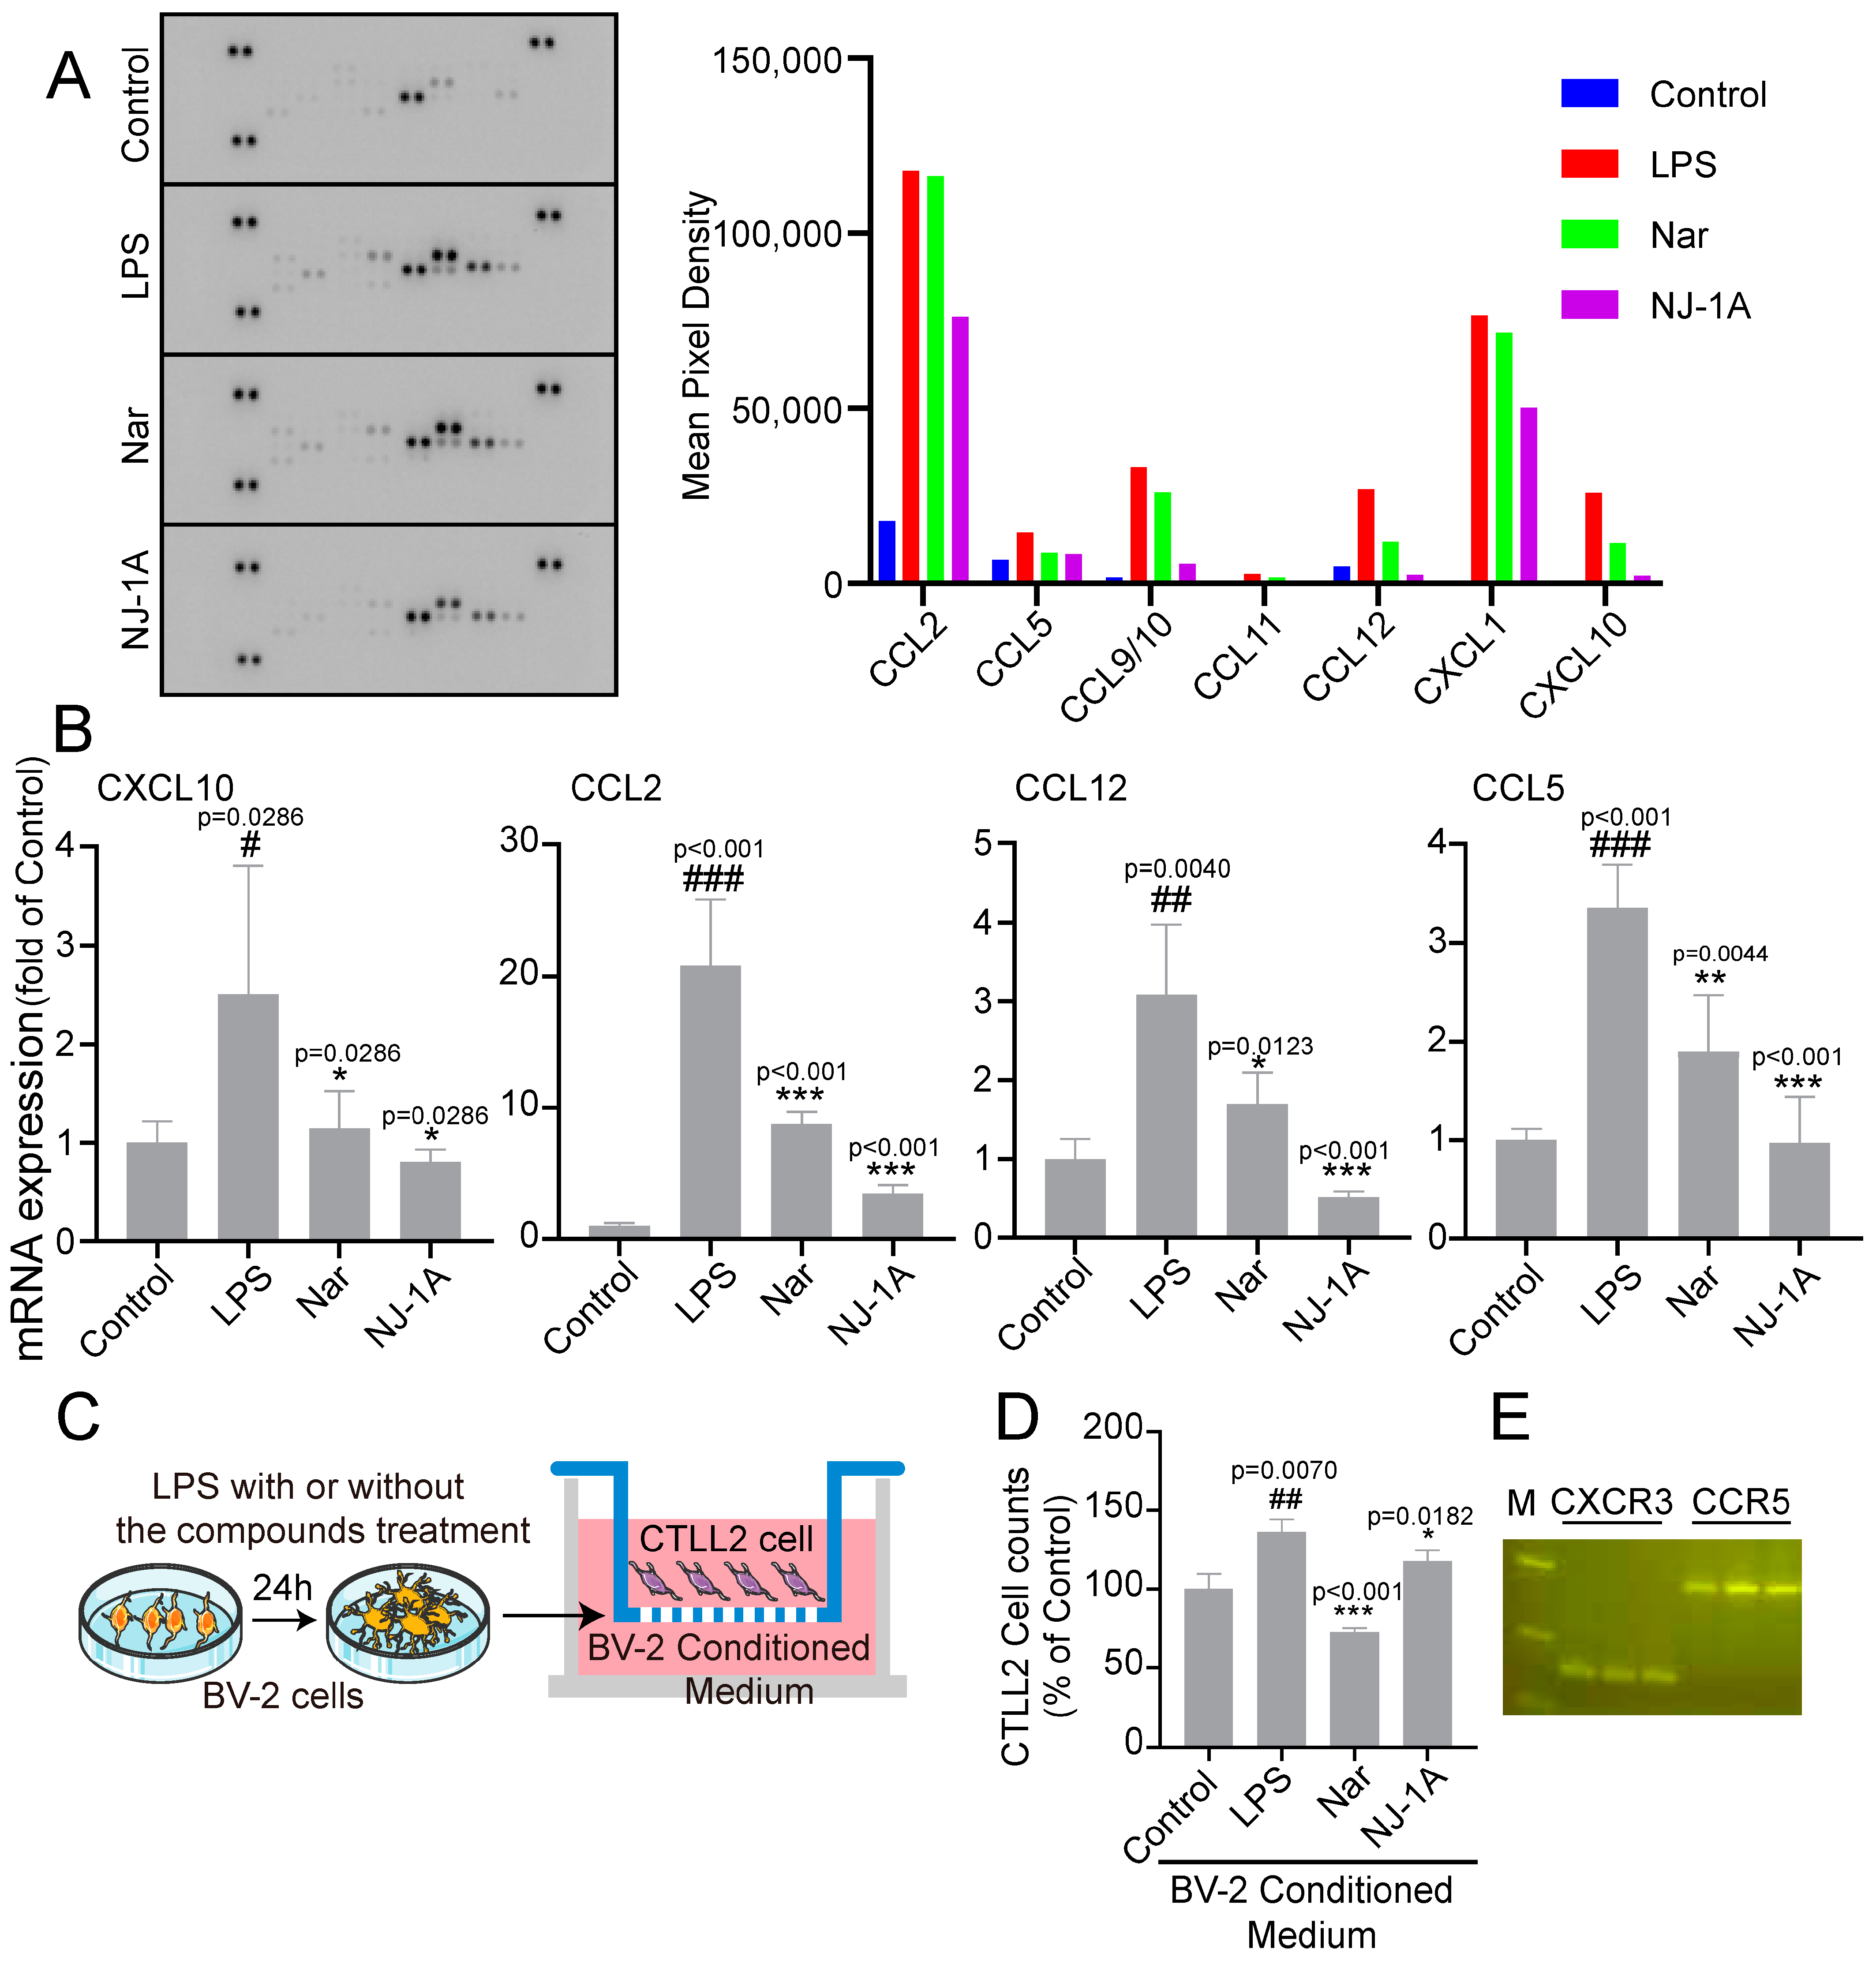
3.5. NJ-1A and Nar Can Suppress the Production of Chemokines in LPS-Induced BV-2 Cells and Further Inhibit the Migration of CTLL-2 Cells
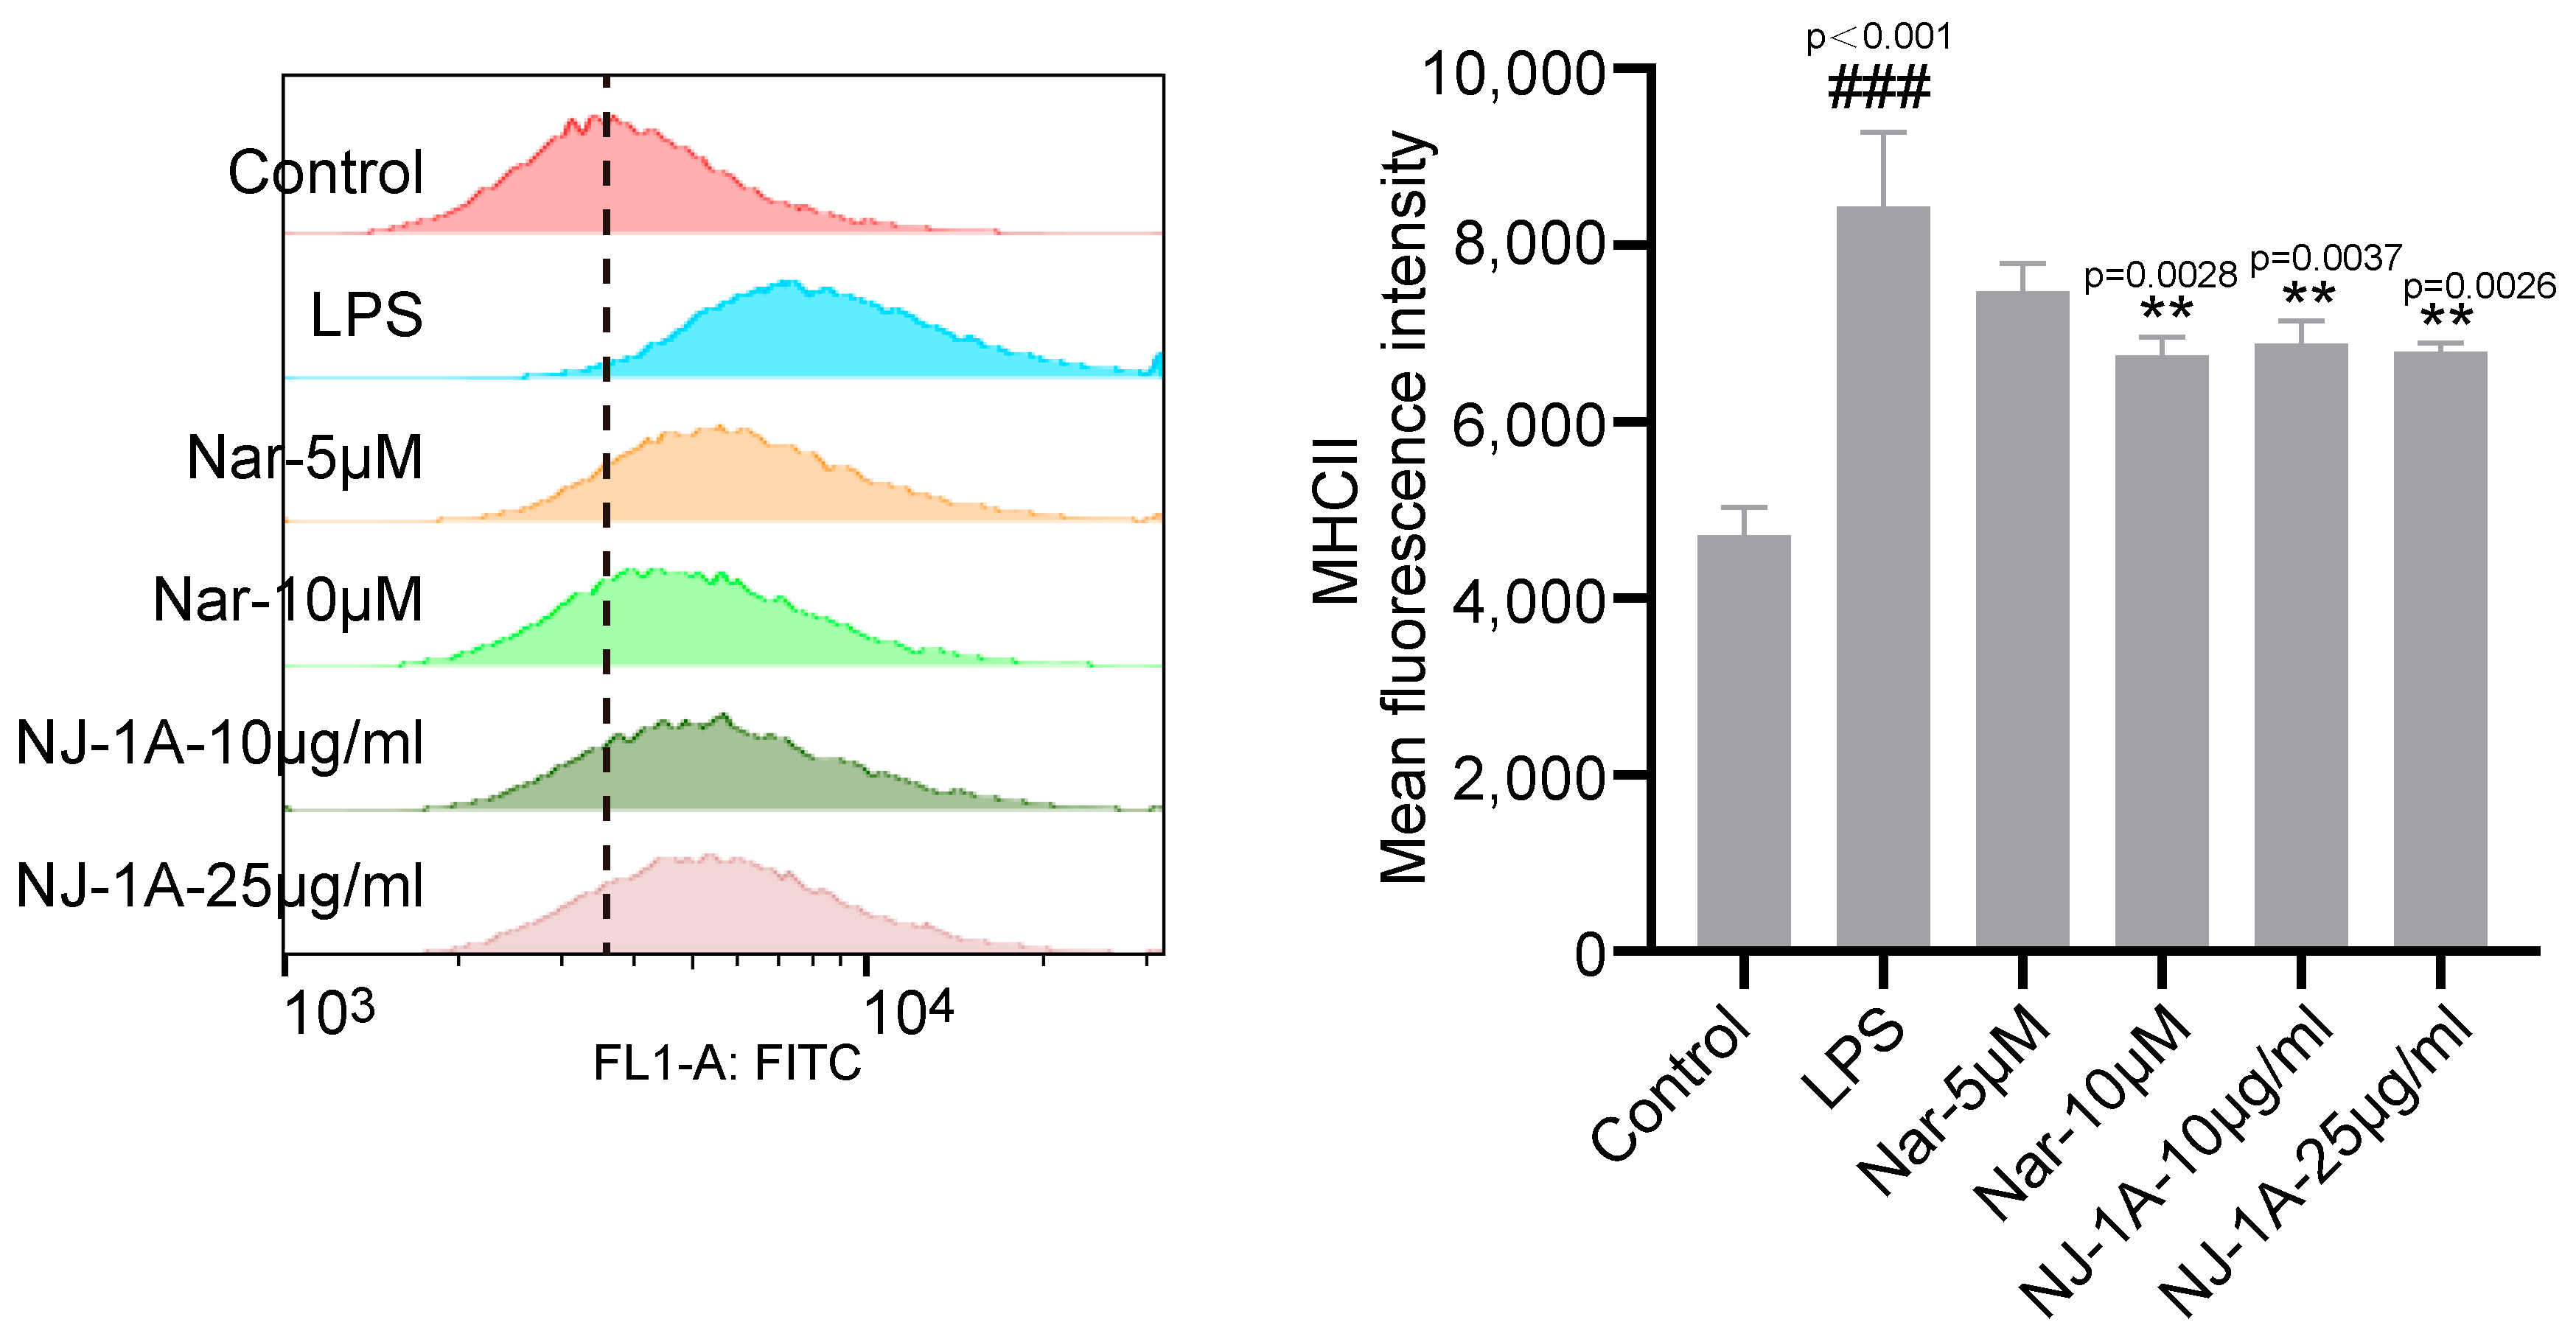
3.6. NJ-1A and Nar Can Inhibit the Expression of MHCII in LPS-Induced BV-2 Cells
3.7. NJ-1A and Nar Can Inhibit the Secretion of Chemokines and Inflammatory Factors in Activated BV-2 Cells Through the AKT/mTOR Signaling Pathway
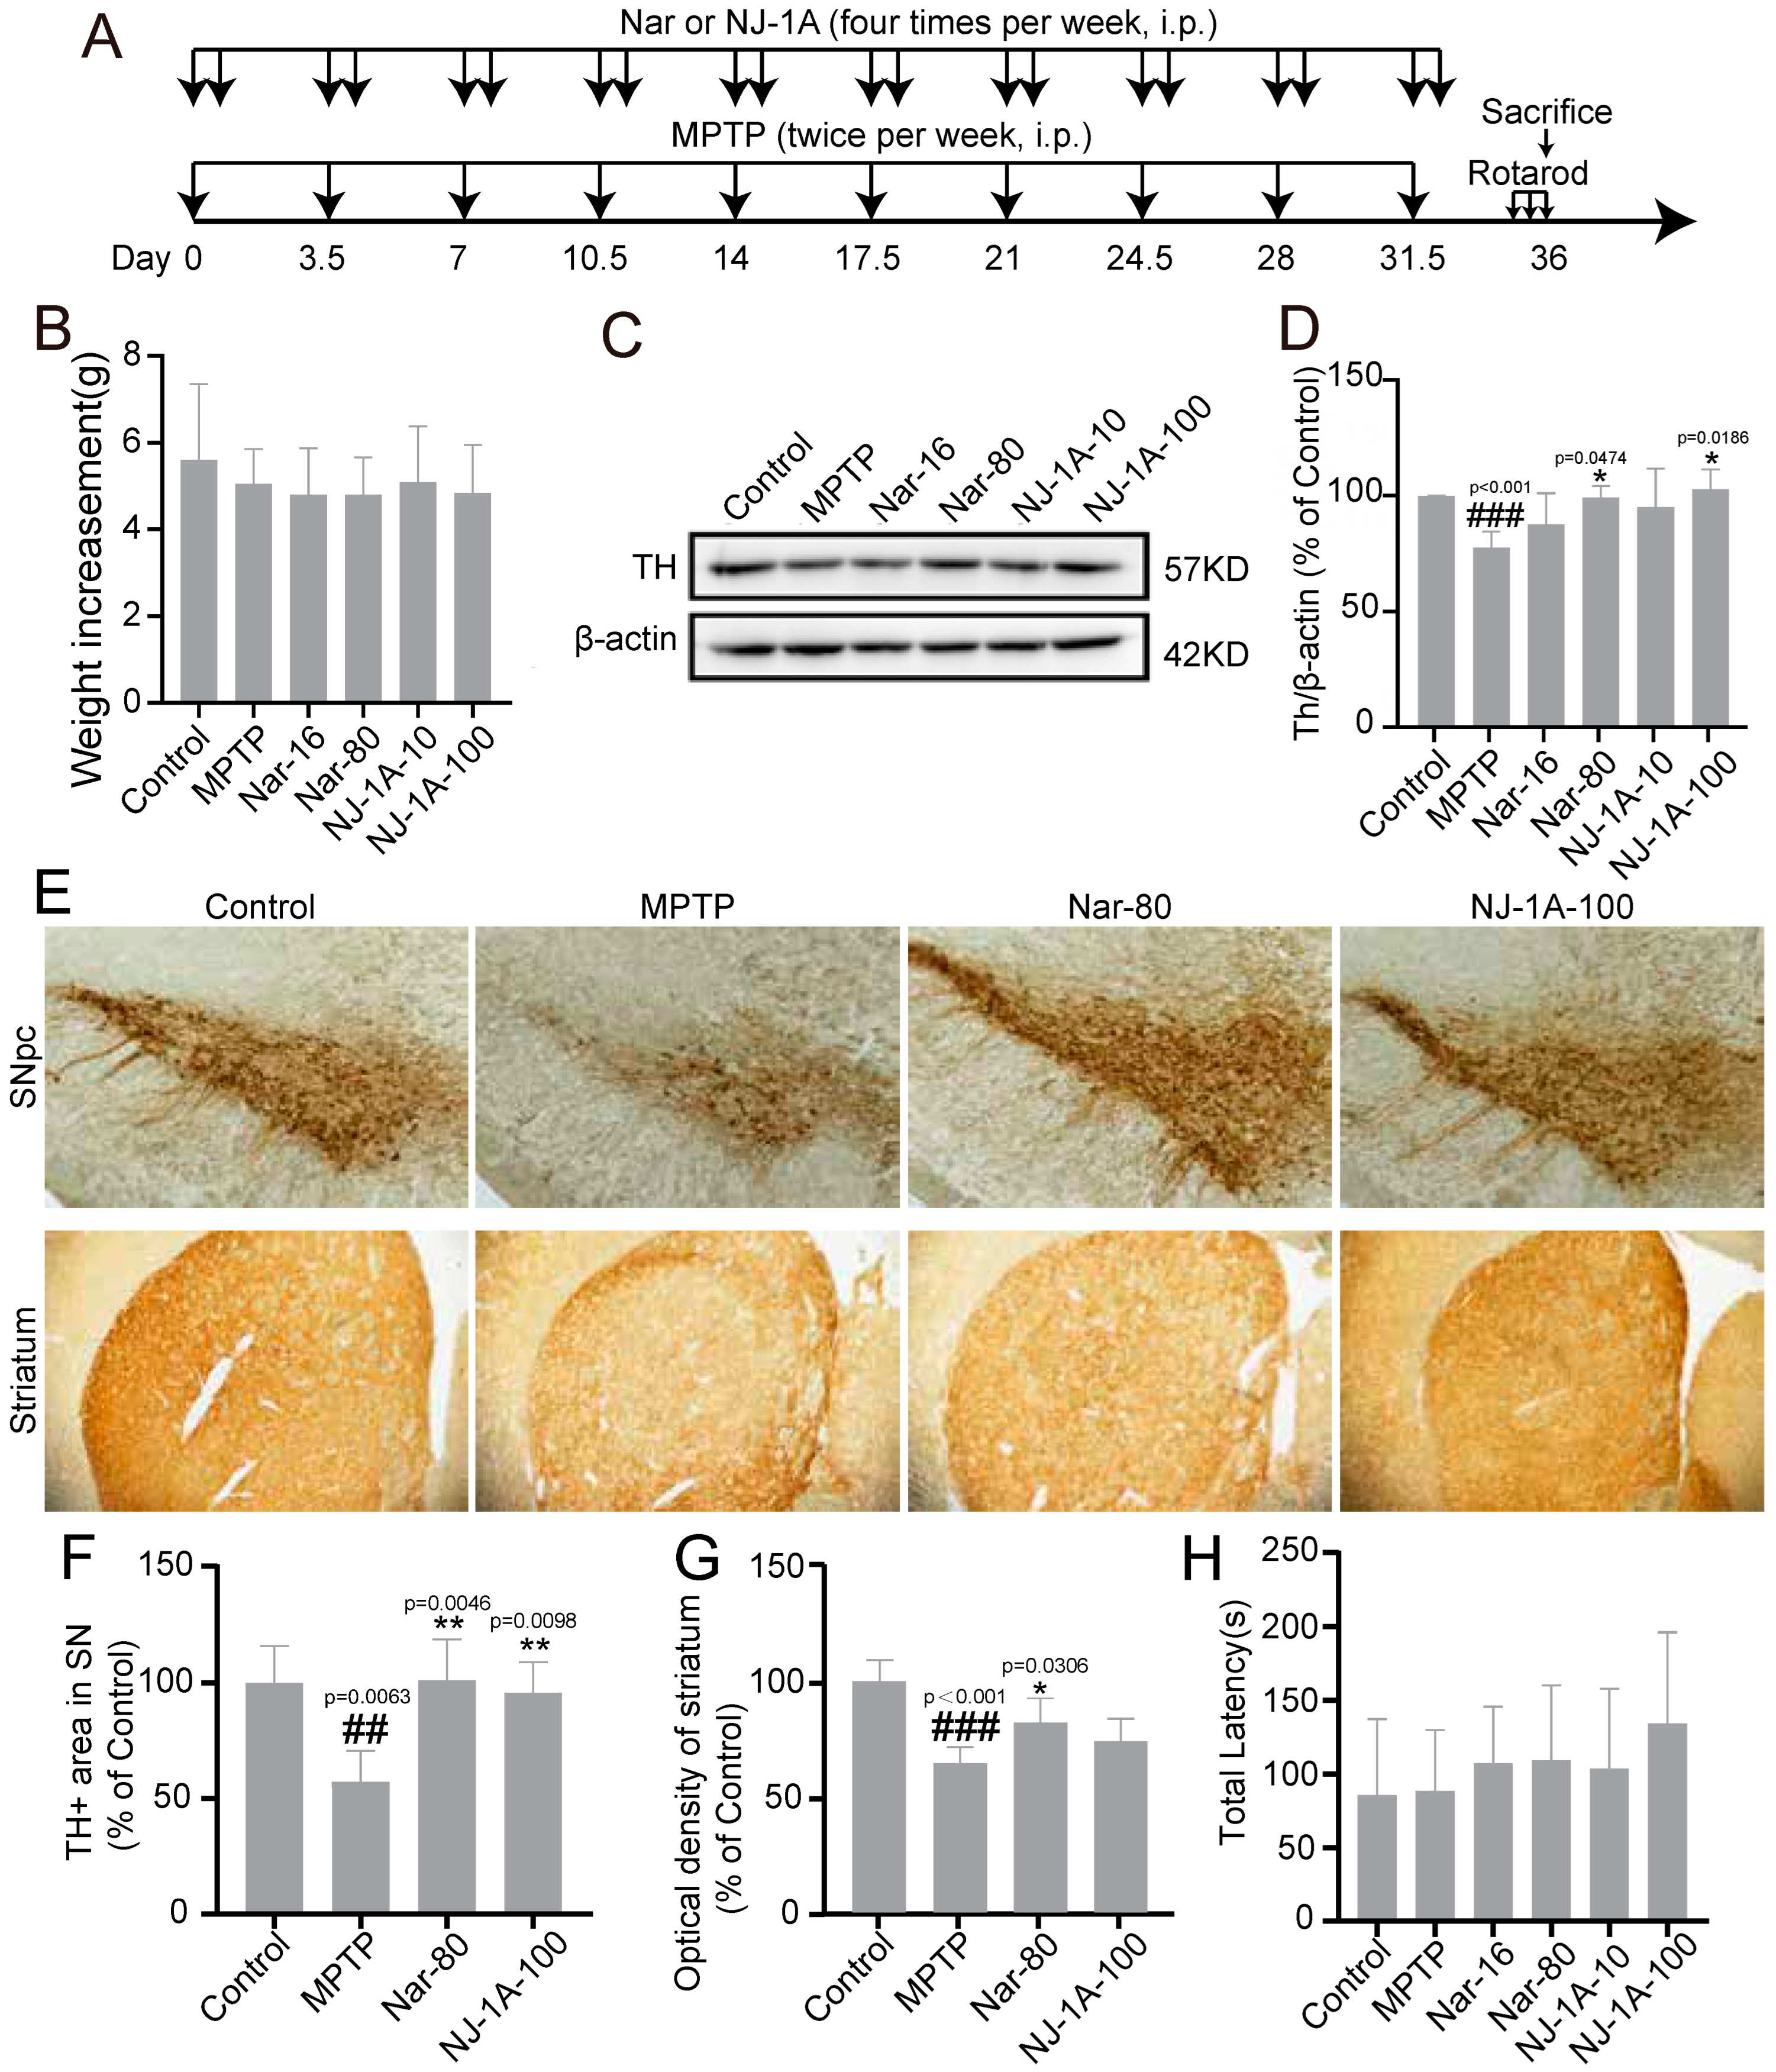
3.8. NJ-1A and Nar Can Ameliorate the Damage of Dopaminergic Neurons
3.9. NJ-1A and Nar Can Inhibit the Activation of Microglia in the Brains of Mouse Models of Parkinson’s Disease
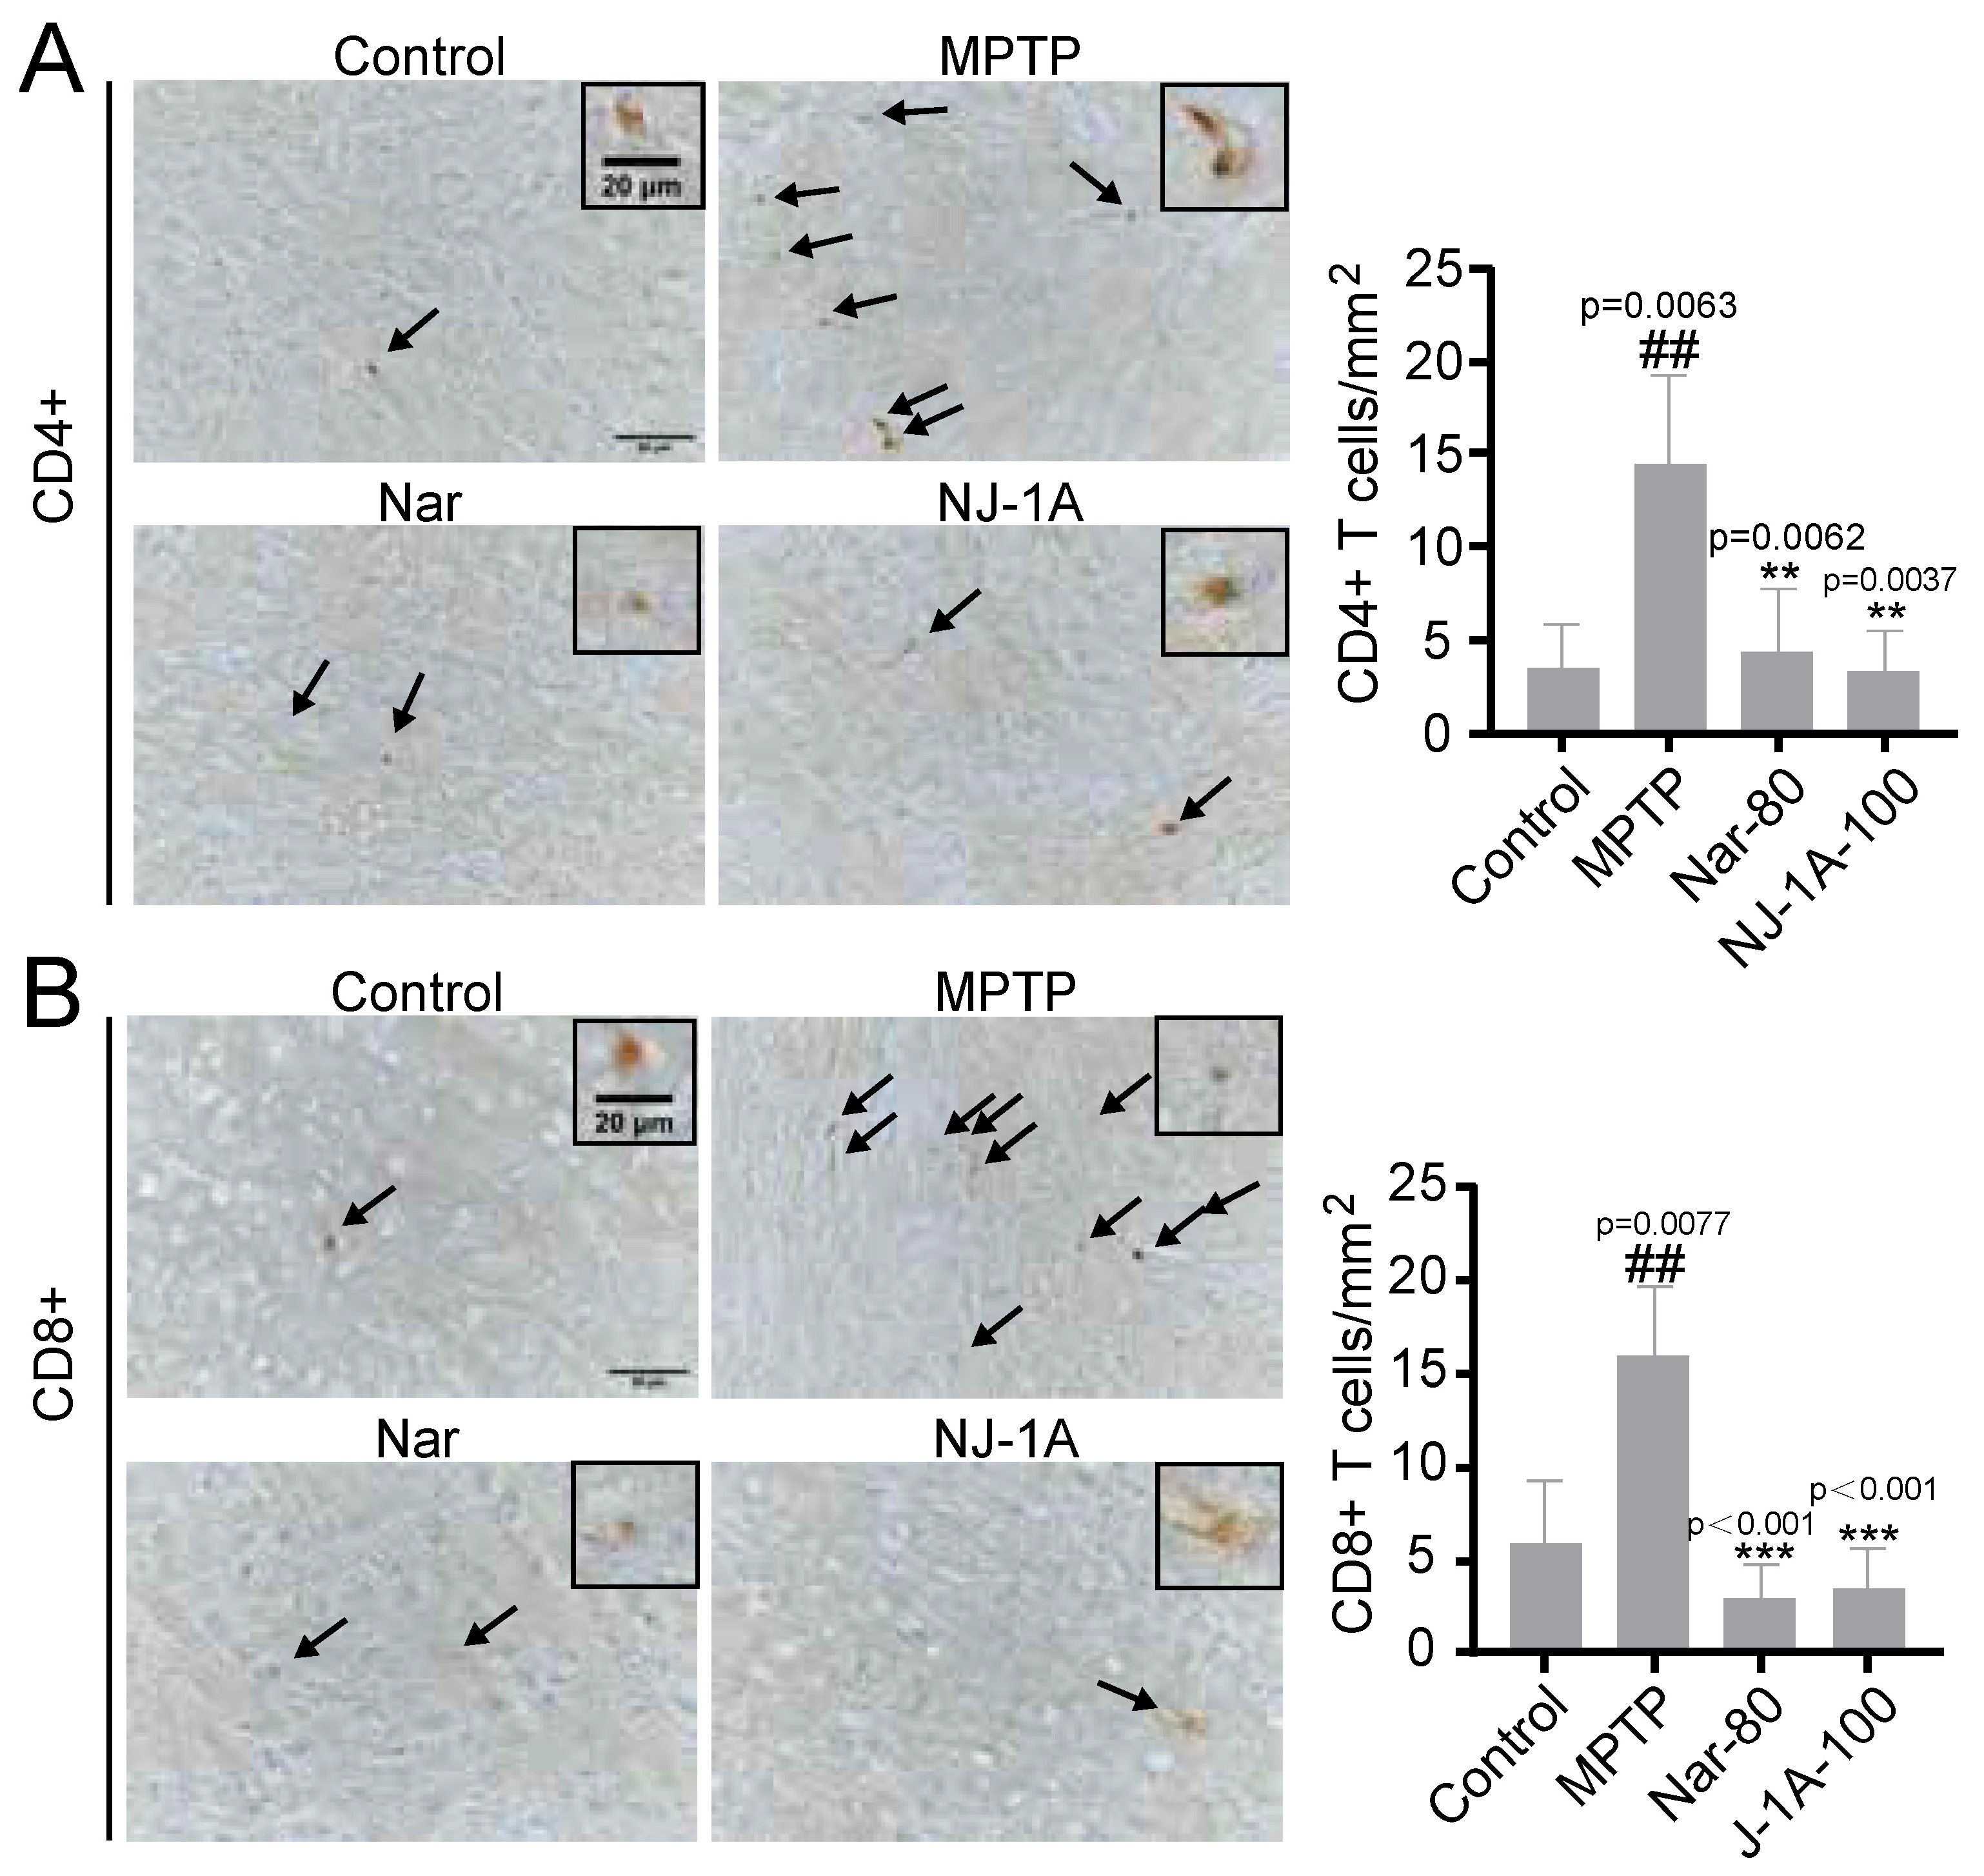
3.10. NJ-1A and Nar Can Inhibit the Infiltration of T Cells in the Brains of Mice in Models of Parkinson’s Disease
4. Discussion
5. Conclusions
Supplementary Materials
Author Contributions
Funding
Institutional Review Board Statement
Informed Consent Statement
Data Availability Statement
Conflicts of Interest
Abbreviations
| CCL | C-C motif chemokine ligand |
| CXCL | C-X-C motif chemokine ligan |
| CXCR | CXC chemokine receptor |
| CCR | C-C motif chemokine receptor |
| ECAR | extracellular acidification rate |
| GLUT1 | glucose transporter 1 |
| HK2 | hexokinase 2 |
| iNOS | inducible nitric oxide synthase |
| LPS | lipopolysaccharide |
| mTOR | mammalian target of rapamycin |
| MPTP | methyl-4-phenyl-1,2,3,6-tetrahydropyridine |
| NO | nitric oxide |
| OCR | oxygen consumption rate |
| PKM2 | pyruvate kinase M2 |
| ROS | reactive oxygen species |
| Real-time RT-PCR | Real-time reverse transcription-polymerase chain reaction |
| TNF-α | tumor necrosis factor-α |
| TH | tyrosine hydroxylase |
| IBA-1 | ionized calcium binding adaptor molecule 1 |
| PD | Parkinson’s disease |
References
- Merighi, S.; Nigro, M.; Travagli, A.; Gessi, S. Microglia and Alzheimer’s Disease. Int. J. Mol. Sci. 2022, 23, 12990. [Google Scholar] [CrossRef] [PubMed]
- Guo, S.; Wang, H.; Yin, Y. Microglia Polarization from M1 to M2 in Neurodegenerative Diseases. Front. Aging Neurosci. 2022, 14, 815347. [Google Scholar] [CrossRef] [PubMed]
- Mehla, K.; Singh, P.K. Metabolic Regulation of Macrophage Polarization in Cancer. Trends Cancer 2019, 5, 822–834. [Google Scholar] [CrossRef]
- Yang, S.; Qin, C.; Hu, Z.W.; Zhou, L.Q.; Yu, H.H.; Chen, M.; Bosco, D.B.; Wang, W.; Wu, L.J.; Tian, D.S. Microglia reprogram metabolic profiles for phenotype and function changes in central nervous system. Neurobiol. Dis. 2021, 152, 105290. [Google Scholar] [CrossRef]
- Takeda, H.; Yamaguchi, T.; Yano, H.; Tanaka, J. Microglial metabolic disturbances and neuroinflammation in cerebral infarction. J. Pharmacol. Sci. 2021, 145, 130–139. [Google Scholar] [CrossRef] [PubMed]
- Herst, P.M.; Grasso, C.; Berridge, M.V. Metabolic reprogramming of mitochondrial respiration in metastatic cancer. Cancer Metastasis Rev. 2018, 37, 643–653. [Google Scholar] [CrossRef]
- Wang, H.; Liu, S.; Sun, Y.; Chen, C.; Hu, Z.; Li, Q.; Long, J.; Yan, Q.; Liang, J.; Lin, Y.; et al. Target modulation of glycolytic pathways as a new strategy for the treatment of neuroinflammatory diseases. Ageing Res. Rev. 2024, 101, 102472. [Google Scholar] [CrossRef]
- Zhang, S.; Lachance, B.B.; Mattson, M.P.; Jia, X. Glucose metabolic crosstalk and regulation in brain function and diseases. Prog. Neurobiol. 2021, 204, 102089. [Google Scholar] [CrossRef]
- Wang, L.; Pavlou, S.; Du, X.; Bhuckory, M.; Xu, H.; Chen, M. Glucose transporter 1 critically controls microglial activation through facilitating glycolysis. Mol. Neurodegener. 2019, 14, 2. [Google Scholar] [CrossRef]
- Meng, F.; Yu, W.; Duan, W.; Wang, T.; Liu, Y. Dexmedetomidine attenuates LPS-mediated BV2 microglia cells inflammation via inhibition of glycolysis. Fundam. Clin. Pharmacol. 2020, 34, 313–320. [Google Scholar] [CrossRef]
- Machhi, J.; Kevadiya, B.D.; Muhammad, I.K.; Herskovitz, J.; Olson, K.E.; Mosley, R.L.; Gendelman, H.E. Harnessing regulatory T cell neuroprotective activities for treatment of neurodegenerative disorders. Mol. Neurodegener. 2020, 15, 32. [Google Scholar] [CrossRef] [PubMed]
- Kouli, A.; Camacho, M.; Allinson, K.; Williams-Gray, C.H. Neuroinflammation and protein pathology in Parkinson’s disease dementia. Acta Neuropathol. Commun. 2020, 8, 211. [Google Scholar] [CrossRef] [PubMed]
- Wang, J.; Wu, Y.; Chen, J.; Zhang, Q.; Liu, Y.; Long, H.; Yu, J.; Wu, Q.; Feng, L. Th1/Th2 Imbalance in Peripheral Blood Echoes Microglia State Dynamics in CNS During TLE Progression. Adv. Sci. 2024, 11, e2405346. [Google Scholar] [CrossRef] [PubMed]
- Tan, E.K.; Chao, Y.X.; West, A.; Chan, L.L.; Poewe, W.; Jankovic, J. Parkinson disease and the immune system—Associations, mechanisms and therapeutics. Nature reviews. Neurology 2020, 16, 303–318. [Google Scholar] [CrossRef]
- Chen, J.; Liu, X.; Zhong, Y. Interleukin-17A: The Key Cytokine in Neurodegenerative Diseases. Front. Aging Neurosci. 2020, 12, 566922. [Google Scholar] [CrossRef]
- Williams, G.P.; Schonhoff, A.M.; Jurkuvenaite, A.; Gallups, N.J.; Standaert, D.G.; Harms, A.S. CD4 T cells mediate brain inflammation and neurodegeneration in a mouse model of Parkinson’s disease. Brain 2021, 144, 2047–2059. [Google Scholar] [CrossRef]
- Hosking, M.P.; Flynn, C.T.; Whitton, J.L. Antigen-specific naive CD8+ T cells produce a single pulse of IFN-γ in vivo within hours of infection, but without antiviral effect. J. Immunol. 2014, 193, 1873–1885. [Google Scholar] [CrossRef]
- Bhat, P.; Leggatt, G.; Waterhouse, N.; Frazer, I.H. Interferon-γ derived from cytotoxic lymphocytes directly enhances their motility and cytotoxicity. Cell Death Dis. 2017, 8, e2836. [Google Scholar] [CrossRef]
- Wagner, C.A.; Roqué, P.J.; Mileur, T.R.; Liggitt, D.; Goverman, J.M. Myelin-specific CD8+ T cells exacerbate brain inflammation in CNS autoimmunity. J. Clin. Investig. 2020, 130, 203–213. [Google Scholar] [CrossRef]
- Xue, B.X.; Yang, T.T.; He, R.S.; Gao, W.K.; Lai, J.X.; Liu, S.X.; Duan, C.Y.; Wang, S.X.; Yu, H.J.; Yang, W.Z.; et al. Degradation Profiling of Nardosinone at High Temperature and in Simulated Gastric and Intestinal Fluids. Molecules 2023, 28, 5382. [Google Scholar] [CrossRef]
- Li, J.; Yu, J.; Guo, J.; Liu, J.; Wan, G.; Wei, X.; Yang, X.; Shi, J. Nardostachys jatamansi and levodopa combination alleviates Parkinson’s disease symptoms in rats through activation of Nrf2 and inhibition of NLRP3 signaling pathways. Pharm. Biol. 2023, 61, 1175–1185. [Google Scholar] [CrossRef] [PubMed]
- Shah, A.J.; Dar, M.Y.; Adnan, M.; Varma, T.; Agarwal, D.; Garg, P.; Mir, R.H.; Meena, R.; Masoodi, M.H. Integration of phytochemical profiling and computational approaches to evaluate the neuroprotective potential of Nardostachys jatamansi in Alzheimer’s disease. Biotechnol. Rep. 2025, 45, e00881. [Google Scholar] [CrossRef] [PubMed]
- Hu, L.; Luo, D.; Zhang, H.; He, L. Nardosinone suppresses monoiodoacetate-induced osteoarthritis in rats: The key role of the miR-218-5p/NUMB axis. Chem. Biol. Drug Des. 2023, 101, 120–130. [Google Scholar] [CrossRef]
- Bian, L.H.; Yao, Z.W.; Zhao, C.B.; Li, Q.Y.; Shi, J.L.; Guo, J.Y. Nardosinone Alleviates Parkinson’s Disease Symptoms in Mice by Regulating Dopamine D2 Receptor. Evid. Based Complement. Altern. Med. eCAM 2021, 2021, 6686965. [Google Scholar] [CrossRef]
- Bian, L.H.; Yao, Z.W.; Wang, Z.Y.; Wang, X.M.; Li, Q.Y.; Yang, X.; Li, J.Y.; Wei, X.J.; Wan, G.H.; Wang, Y.Q.; et al. Nardosinone regulates the slc38a2 gene to alleviate Parkinson’s symptoms in rats through the GABAergic synaptic and cAMP pathways. Biomed. Pharmacother. 2022, 153, 113269. [Google Scholar] [CrossRef] [PubMed]
- Liu, M.; Xue, J.; Cao, Y.; Hao, Z.; Wang, Y.; Li, J.; Jiang, T.; Shi, J. The effects of Nardosinone on levodopa intervention in the treatment of Parkinson’s disease. Biomed. Pharmacother. 2024, 174, 116448. [Google Scholar] [CrossRef]
- Yang, W.; Hao, W.; Meng, Z.; Ding, S.; Li, X.; Zhang, T.; Huang, W.; Xu, L.; Zhang, Y.; Yang, J.; et al. Molecular Regulatory Mechanism and Toxicology of Neurodegenerative Processes in MPTP/Probenecid-Induced Progressive Parkinson’s Disease Mice Model Revealed by Transcriptome. Mol. Neurobiol. 2021, 58, 603–616. [Google Scholar] [CrossRef]
- Gaber, T.; Strehl, C.; Buttgereit, F. Metabolic regulation of inflammation. Nat. Reviews. Rheumatol. 2017, 13, 267–279. [Google Scholar] [CrossRef]
- Dionísio, P.A.; Amaral, J.D.; Rodrigues, C.M.P. Oxidative stress and regulated cell death in Parkinson’s disease. Ageing Res. Rev. 2021, 67, 101263. [Google Scholar] [CrossRef]
- Shi, Z.; Yu, P.; Lin, W.J.; Chen, S.; Hu, X.; Chen, S.; Cheng, J.; Liu, Q.; Yang, Y.; Li, S.; et al. Microglia drive transient insult-induced brain injury by chemotactic recruitment of CD8+ T lymphocytes. Neuron 2023, 111, 696–710.e699. [Google Scholar] [CrossRef]
- Zhang, Y.; Xiang, Y.; Wang, X.; Zhu, L.; Li, H.; Wang, S.; Pan, X.; Zhao, H. Cerebral dopamine neurotrophic factor protects microglia by combining with AKT and by regulating FoxO1/mTOR signaling during neuroinflammation. Biomed. Pharmacother. 2019, 109, 2278–2284. [Google Scholar] [CrossRef] [PubMed]
- Bloem, B.R.; Okun, M.S.; Klein, C. Parkinson’s disease. Lancet 2021, 397, 2284–2303. [Google Scholar] [CrossRef]
- Foltynie, T.; Bruno, V.; Fox, S.; Kühn, A.A.; Lindop, F.; Lees, A.J. Medical, surgical, and physical treatments for Parkinson’s disease. Lancet 2024, 403, 305–324. [Google Scholar] [CrossRef]
- Xu, L.; He, D.; Bai, Y. Microglia-Mediated Inflammation and Neurodegenerative Disease. Mol. Neurobiol. 2016, 53, 6709–6715. [Google Scholar] [CrossRef]
- Isik, S.; Yeman Kiyak, B.; Akbayir, R.; Seyhali, R.; Arpaci, T. Microglia Mediated Neuroinflammation in Parkinson’s Disease. Cells 2023, 12, 1012. [Google Scholar] [CrossRef] [PubMed]
- Tang, Y.; Le, W. Differential Roles of M1 and M2 Microglia in Neurodegenerative Diseases. Mol. Neurobiol. 2016, 53, 1181–1194. [Google Scholar] [CrossRef] [PubMed]
- Orihuela, R.; McPherson, C.A.; Harry, G.J. Microglial M1/M2 polarization and metabolic states. Br. J. Pharmacol. 2016, 173, 649–665. [Google Scholar] [CrossRef]
- Li, M.; Lu, H.; Wang, X.; Duan, C.; Zhu, X.; Zhang, Y.; Ge, X.; Ji, F.; Wang, X.; Su, J.; et al. Pyruvate kinase M2 (PKM2) interacts with activating transcription factor 2 (ATF2) to bridge glycolysis and pyroptosis in microglia. Mol. Immunol. 2021, 140, 250–266. [Google Scholar] [CrossRef]
- Qiao, H.; He, X.; Zhang, Q.; Yuan, H.; Wang, D.; Li, L.; Hui, Y.; Wu, Z.; Li, W.; Zhang, N. Alpha-synuclein induces microglial migration via PKM2-dependent glycolysis. Int. J. Biol. Macromol. 2019, 129, 601–607. [Google Scholar] [CrossRef]
- Gu, C.; Wang, F.; Zhang, Y.T.; Wei, S.Z.; Liu, J.Y.; Sun, H.Y.; Wang, G.H.; Liu, C.F. Microglial MT1 activation inhibits LPS-induced neuroinflammation via regulation of metabolic reprogramming. Aging Cell 2021, 20, e13375. [Google Scholar] [CrossRef]
- Sommer, A.; Marxreiter, F.; Krach, F.; Fadler, T.; Grosch, J.; Maroni, M.; Graef, D.; Eberhardt, E.; Riemenschneider, M.J.; Yeo, G.W.; et al. Th17 Lymphocytes Induce Neuronal Cell Death in a Human iPSC-Based Model of Parkinson’s Disease. Cell Stem Cell 2018, 23, 123–131.e126. [Google Scholar] [CrossRef] [PubMed]
- Kedia, S.; Ji, H.; Feng, R.; Androvic, P.; Spieth, L.; Liu, L.; Franz, J.; Zdiarstek, H.; Anderson, K.P.; Kaboglu, C.; et al. T cell-mediated microglial activation triggers myelin pathology in a mouse model of amyloidosis. Nat. Neurosci. 2024, 27, 1468–1474. [Google Scholar] [CrossRef]
- Hartnell, I.J.; Woodhouse, D.; Jasper, W.; Mason, L.; Marwaha, P.; Graffeuil, M.; Lau, L.C.; Norman, J.L.; Chatelet, D.S.; Buee, L.; et al. Glial reactivity and T cell infiltration in frontotemporal lobar degeneration with tau pathology. Brain 2024, 147, 590–606. [Google Scholar] [CrossRef] [PubMed]
- Jorfi, M.; Park, J.; Hall, C.K.; Lin, C.J.; Chen, M.; von Maydell, D.; Kruskop, J.M.; Kang, B.; Choi, Y.; Prokopenko, D.; et al. Infiltrating CD8+ T cells exacerbate Alzheimer’s disease pathology in a 3D human neuroimmune axis model. Nat. Neurosci. 2023, 26, 1489–1504. [Google Scholar] [CrossRef] [PubMed]
- Shi, Y.; Wei, B.; Li, L.; Wang, B.; Sun, M. Th17 cells and inflammation in neurological disorders: Possible mechanisms of action. Front. Immunol. 2022, 13, 932152. [Google Scholar] [CrossRef]
- Machhi, J.; Yeapuri, P.; Lu, Y.; Foster, E.; Chikhale, R.; Herskovitz, J.; Namminga, K.L.; Olson, K.E.; Abdelmoaty, M.M.; Gao, J.; et al. CD4+ effector T cells accelerate Alzheimer’s disease in mice. J. Neuroinflamm. 2021, 18, 272. [Google Scholar] [CrossRef]
- Imamura, K.; Hishikawa, N.; Sawada, M.; Nagatsu, T.; Yoshida, M.; Hashizume, Y. Distribution of major histocompatibility complex class II-positive microglia and cytokine profile of Parkinson’s disease brains. Acta Neuropathol. 2003, 106, 518–526. [Google Scholar] [CrossRef]
- Subbarayan, M.S.; Hudson, C.; Moss, L.D.; Nash, K.R.; Bickford, P.C. T cell infiltration and upregulation of MHCII in microglia leads to accelerated neuronal loss in an α-synuclein rat model of Parkinson’s disease. J. Neuroinflamm. 2020, 17, 242. [Google Scholar] [CrossRef]
- Mirarchi, A.; Albi, E.; Arcuri, C. Microglia Signatures: A Cause or Consequence of Microglia-Related Brain Disorders? Int. J. Mol. Sci. 2024, 25, 10951. [Google Scholar] [CrossRef]
- Elyaman, W.; Stern, L.J.; Jiang, N.; Dressman, D.; Bradley, P.; Klatzmann, D.; Bradshaw, E.M.; Farber, D.L.; Kent, S.C.; Chizari, S.; et al. Exploring the role of T cells in Alzheimer’s and other neurodegenerative diseases: Emerging therapeutic insights from the T Cells in the Brain symposium. Alzheimer’s Dement. 2025, 21, e14548. [Google Scholar] [CrossRef]
- Weiner, H.L. Immune mechanisms and shared immune targets in neurodegenerative diseases. Nat. Rev. Neurol. 2025, 21, 67–85. [Google Scholar] [CrossRef]
- Zhang, J.; Lv, Y.; Zhang, J.; Bai, Y.S.; Li, M.Y.; Wang, S.Q.; Wang, L.L.; Liu, G.X.; Xu, F.; Shang, M.Y.; et al. Analysis of In Vivo Existence Forms of Nardosinone in Mice by UHPLC-Q-TOF-MS Technique. Molecules 2022, 27, 7267. [Google Scholar] [CrossRef] [PubMed]
- Ma, Y.; Rong, Q. Effect of Different MPTP Administration Intervals on Mouse Models of Parkinson’s Disease. Contrast Media Mol. Imaging 2022, 2022, 2112146. [Google Scholar] [CrossRef] [PubMed]
- Mustapha, M.; Mat Taib, C.N. MPTP-induced mouse model of Parkinson’s disease: A promising direction of therapeutic strategies. Bosn. J. Basic Med. Sci. 2021, 21, 422–433. [Google Scholar] [CrossRef]
- Novello, S.; Mercatelli, D.; Albanese, F.; Domenicale, C.; Brugnoli, A.; D’Aversa, E.; Vantaggiato, S.; Dovero, S.; Murtaj, V.; Presotto, L.; et al. In vivo susceptibility to energy failure parkinsonism and LRRK2 kinase activity. Neurobiol. Dis. 2022, 162, 105579. [Google Scholar] [CrossRef]
- Poirier, A.A.; Côté, M.; Jarras, H.; Litim, N.; Lamontagne-Proulx, J.; Al-Sweidi, S.; Morissette, M.; Lachhab, A.; Pelletier, M.; Di Paolo, T.; et al. Peripheral Neuroprotective and Immunomodulatory Effects of 5α-Reductase Inhibitors in Parkinson’s Disease Models. Front. Pharmacol. 2022, 13, 898067. [Google Scholar] [CrossRef] [PubMed]
- Ren, Z.; Ding, H.; Zhou, M.; Chan, P. Ganoderma lucidum Modulates Inflammatory Responses following 1-Methyl-4-Phenyl-1,2,3,6-Tetrahydropyridine (MPTP) Administration in Mice. Nutrients 2022, 14, 3872. [Google Scholar] [CrossRef]
- Poirier, A.A.; Côté, M.; Bourque, M.; Jarras, H.; Lamontagne-Proulx, J.; Morissette, M.; Paolo, T.D.; Soulet, D. Differential contribution of estrogen receptors to the intestinal therapeutic effects of 17β-estradiol in a murine model of Parkinson’s disease. Brain Res. Bull. 2022, 187, 85–97. [Google Scholar] [CrossRef]


Disclaimer/Publisher’s Note: The statements, opinions and data contained in all publications are solely those of the individual author(s) and contributor(s) and not of MDPI and/or the editor(s). MDPI and/or the editor(s) disclaim responsibility for any injury to people or property resulting from any ideas, methods, instructions or products referred to in the content. |
© 2025 by the authors. Licensee MDPI, Basel, Switzerland. This article is an open access article distributed under the terms and conditions of the Creative Commons Attribution (CC BY) license (https://creativecommons.org/licenses/by/4.0/).
Share and Cite
Duan, C.; Lin, W.; Zhang, M.; Xue, B.; Sun, W.; Jin, Y.; Zhang, X.; Guo, H.; Yuan, Q.; Yu, M.; et al. Nardostachys jatamansi Extract and Nardosinone Exert Neuroprotective Effects by Suppressing Glucose Metabolic Reprogramming and Modulating T Cell Infiltration. Cells 2025, 14, 644. https://doi.org/10.3390/cells14090644
Duan C, Lin W, Zhang M, Xue B, Sun W, Jin Y, Zhang X, Guo H, Yuan Q, Yu M, et al. Nardostachys jatamansi Extract and Nardosinone Exert Neuroprotective Effects by Suppressing Glucose Metabolic Reprogramming and Modulating T Cell Infiltration. Cells. 2025; 14(9):644. https://doi.org/10.3390/cells14090644
Chicago/Turabian StyleDuan, Congyan, Weifang Lin, Mingjie Zhang, Bianxia Xue, Wangjie Sun, Yang Jin, Xiaoxu Zhang, Hong Guo, Qing Yuan, Mingyu Yu, and et al. 2025. "Nardostachys jatamansi Extract and Nardosinone Exert Neuroprotective Effects by Suppressing Glucose Metabolic Reprogramming and Modulating T Cell Infiltration" Cells 14, no. 9: 644. https://doi.org/10.3390/cells14090644
APA StyleDuan, C., Lin, W., Zhang, M., Xue, B., Sun, W., Jin, Y., Zhang, X., Guo, H., Yuan, Q., Yu, M., Liu, Q., Wang, N., Wang, H., Wu, H., & Wang, S. (2025). Nardostachys jatamansi Extract and Nardosinone Exert Neuroprotective Effects by Suppressing Glucose Metabolic Reprogramming and Modulating T Cell Infiltration. Cells, 14(9), 644. https://doi.org/10.3390/cells14090644