Brief Report

Morphological and Transcriptomic Analyses of the Adrenal Gland in Acomys cahirinus: A Novel Model for Murine Adrenal Physiology

1
Institute of Fundamental Medicine and Biology, Kazan Federal University, 420008 Kazan, Russia
2
National Medical Research Centre of Cardiology Named After Academician E.I. Chazov, 121552 Moscow, Russia
3
Loginov Moscow Clinical Scientific Center, 111123 Moscow, Russia
4
Life Improvement by Future Technologies (LIFT) Center, 121205 Moscow, Russia
5
Intractable Disease Research Center, Graduate School of Medicine, Juntendo University, Tokyo 113-8421, Japan
6
Endocrinology Research Centre, Institute of Personalized Medicine, 117292 Moscow, Russia
7
Genomics and Bioimaging Core Facility, Skolkovo Institute of Science and Technology, 143026 Moscow, Russia
8
Federal State Budgetary Institution «Centre for Strategic Planning and Management of Biomedical Health Risks» of the Federal Medical and Biological Agency (Centre for Strategic Planning, of the Federal Medical and Biological Agency), 119121 Moscow, Russia
9
Faculty of Medicine, Medical Research and Education Institute, Lomonosov Moscow State University, 119991 Moscow, Russia
*
Author to whom correspondence should be addressed.
Cells 2025, 14(18), 1431; https://doi.org/10.3390/cells14181431
Submission received: 30 July 2025 / Revised: 6 September 2025 / Accepted: 11 September 2025 / Published: 12 September 2025

Abstract

This study investigates the adrenal gland structure and gene expression in Acomys cahirinus compared to Mus musculus, aiming to assess its relevance for human adrenal disease modeling. We identified a well-defined zona reticularis in Acomys, resembling the human adrenal cortex. Transcriptomic analysis revealed upregulation of key steroidogenic genes (Cyp17a1, Sult1e1, Hsd3b2, Defb18, Kiss1, H2-Ke6), with validation by qRT-PCR and CAGE-seq. The gene Nupl1 showed discordant results between RNA-seq and CAGE. Pathway analysis highlighted enrichment of steroidogenesis and adrenal metabolism. Notably, a GTEx-based comparison demonstrated that Acomys adrenal gene expression closely mirrors the expression in the human adrenal cortex, whereas Mus musculus samples diverged toward brain-specific signatures. These findings suggest that Acomys cahirinus represents a promising model for adrenal research, though further studies including single-cell transcriptomics and functional assays are warranted to fully establish its translational potential.

1. Introduction

The human adrenal cortex is structured into three concentric layers, recognized as the zona glomerulosa (ZG), zona fasciculata (ZF), and zona reticularis (ZR) [1]. Aldosterone is a mineralocorticoid hormone synthesized in the adrenal cortex. This hormone regulates electrolyte levels by balancing the potassium and sodium concentrations in the blood [2]. The zona fasciculata is located under the zona glomerulosa and is responsible for glucocorticoid synthesis, while minor secretion of androgens is concurrently carried out [3]. The innermost layer of the adrenal cortex, the zona reticularis, responsible for the synthesis of androgens with low biological activity, including dehydroepiandrosterone (DHEA), dehydroepiandrosterone sulfate (DHEA-S), androstenedione, androstenediol, 11β-hydroxyandrostenedione, and small amounts of glucocorticoids, is also present [1].
A widely utilized standard in the experimental study of adrenal diseases is animal models, which employ rodents such as mice and rats [4]. However, these animals have specific adrenal cortex structures without obvious homology in humans [5]. For instance, mice and rats lack the zona reticularis responsible for androgen production. In rodents, a morphologically distinct ZR is not consistently identifiable: in adult mice, it is typically absent, and in rats, its delineation is context-dependent and influenced by the presence of the undifferentiated zone [6]. Functionally, adult mice and rats lack adrenocortical CYP17A1 and therefore do not produce adrenal androgens, in contrast to species with a well-defined, androgen-producing ZR [7]. Consequently, the predominant glucocorticoid in rodents is corticosterone, whereas in humans, it is cortisol [8]. This enzyme also plays a key role in the adrenal biosynthesis of androgens in humans. At the same time, rodents lack this enzymatic activity in their adrenal glands, which makes them unable to produce androgens endogenously in the adrenal cortex [8].
The advancement of gene and cellular treatment approaches for various adrenal diseases requires preclinical investigations involving laboratory animals. Conventionally, laboratory rodents such as mice and rats are used for these studies. However, a pertinent query arises: is their utilization as models for studying adrenal diseases and, moreover, for assessing novel therapies truly justified?
Recently, there has been a growing interest in employing mice of the genus Acomys as novel animal models to study enhanced regenerative capabilities. Spiny mice are the only mammals that are capable of regenerating tissues without fibrosis [9,10,11,12,13]. Additionally, Quinn et al. demonstrated that the adrenal gland of spiny mice can synthesize and secrete DHEA from at least 30 days of gestation, comparable to the human fetus. Their study, which involved dexamethasone treatment and gestational sampling, revealed that spiny mouse adrenals express the active enzyme CYP17A1 in ZR, crucial for cortisol production [5]. Notably, this research employed Acomys as a genus without specifying a particular species. In particular, cortisol and aldosterone were both detected in fetal plasma [14].
This noteworthy discovery opens up the possibility that the spiny mouse may represent a more relevant model for studying adrenal diseases. The primary objective of this research was to compare the morphological structure and gene expression level of the adrenal glands between Balb/c mice (a standard laboratory animal) and one of the species of mice belonging to spiny mice—Acomys cahirinus.

2. Materials and Methods

2.1. Animals and Ethical Issues

The experimental procedures were conducted on sexually mature male Acomys cahirinus mice (n = 6) and Balb/c mice (n = 6) at 11–12 weeks of age. Ethical approval for all the animal studies was obtained from the local Ethics Committee of the Institute of Fundamental Medicine and Biology, Kazan (Volga region) Federal University, under extract No. 40, dated 9 March 2023.
Zoletil 100 was administered as an analgesic at a dosage of 7 mg per kilogram of body weight. Subsequently, the anterior abdominal wall was depilated, and the animal was securely affixed to the surgical table. Surgical access was established in the left lateral region by making an incision in the anterior abdominal wall, positioned 1 cm to the left of the anterior midline. The excised adrenal gland tissues were subsequently earmarked for subsequent morphological investigations and for the analysis of gene expression. The animals were euthanized by decapitation under deep anesthesia induced with Zoletil 100.

2.2. Histological Procedure

Obtained tissue fragments were fixed in 10% neutral formalin in 0.2 M phosphate buffer (pH = 7.4) for 24 h. After fixation, the tissues were processed for paraffin embedding using an automated tissue processor (STP 420 ES, Thermo Scientific, Waltham, MA, USA). The protocol included sequential dehydration in four changes of isopropanol with increasing concentration, followed by two changes of an intermediate isopropanol–mineral oil mixture (3 h total) and then transfer to pure mineral oil. Paraffin infiltration was performed in three changes of paraffin, each for 1 h, after which the tissues were embedded in paraffin blocks. The paraffin blocks were sectioned at 4 µm thickness using a rotary microtome (Microm HM 366S, Thermo Scientific, Waltham, MA, USA). The tissue preparations were stained using Mallory (Ergoprodaction, Biovitrum, Russia) and specific antibodies against tyrosine hydroxylase (Th) (AF6113, Affinity Biosciences, Jiangsu province, China, 1:100), steroidogenic acute regulatory protein (StAR) (DF6192, Affinity Biosciences, Jiangsu province, China, 1:100), HSD3B2 (DF6639, Affinity Biosciences, Jiangsu province, China, 1:100), and Cytochrome P450 17A1 (DF3563, Affinity Biosciences, Jiangsu province, China, 1:100).
Digital histological images were acquired using the NanoZoomer S60 Digital slide scanner (Hamamatsu Photonics, Hamamatsu, Japan). The NDP program.view2 (Hamamatsu, Japan) was utilized for the comprehensive analysis of the digital histological images.

2.3. Immunofluorescence Analysis

Immunofluorescence reactions were conducted in a standard way. The sections were incubated with primary and secondary antibodies to identify the antigen: CYP17A1 (Affinity Biosciences, 1:100) and donkey anti-mouse Alexa Fluor 555 (Thermo Fisher Scientific, Waltham, MA, USA, 1:200). The tissue sections were observed using an LSM 700 confocal microscope (Carl Zeiss, Oberkochen, Germany). Only the cells with nuclei clearly outlined by DAPI (10 µg/mL in PBS, Sigma, St. Louis, MO, USA) were considered. Negative controls were obtained using the same protocol but without the addition of primary or secondary antibodies.

2.4. RNA Sequencing and Analysis

The adrenal gland tissues were obtained from three animals in both groups. RNA was extracted according to the manufacturer’s instructions using a Qiagen RNeasy Mini Kit (Qiagen). The quality of the total RNA was evaluated using a Bioanalyzer 2100 (Agilent Technologies, Santa Clara, CA, USA). The quantity and purity of the RNA were estimated on a NanoPhotometer (Implen, Munich, Germany). A total of 800 ng of RIN ≥ 7 total RNA was used for library construction using the NEBNext® Poly(A) mRNA Magnetic Isolation Module and NEBNext® Ultra II™ Directional RNA Library Prep Kit for Illumina (New England Biolabs) according to the manufacturer’s instructions. The quality of the libraries was verified using the Bioanalyzer 2100 (Agilent Technologies, Santa Clara, CA, USA), and the yield was validated by qPCR. The libraries were then sequenced on a NovaSeq6000 (Illumina, San Diego, CA, USA) with pair-end 65 bp reading and consisted of approximately 42 mln read pairs per sample on average (three replicates for Balb/c and three for Acomys). The reads of Acomys cahirinus were mapped onto the genome downloaded from Elizabeth Dong Nguyen et al.’s report with the hisat2 tool (version 2.2.1) [15]. As for the Balb/c mouse, we used the mouse genome assembly version GRCm39. Hisat2 indices were prepared using files with exons and splice sites created previously from a gtf file (annotation). The mapping statistics were constant and similar between species groups (an approximately 97% overall mapping rate and approximately 88% unambiguous mapping).
The raw counts were then calculated with the htseq count tool (version 2.0.4) [16]. Differential expression analysis was carried out using the edgeR package (version 3.36.0) of R (version 4.2.2).
Gene-set enrichment: Over-representation analysis was performed with gseapy v1.0.3 using the Enrichr GTEx_Tissue_Expression_Up and BioPlanet_2019 libraries. Significance was assessed using two-sided Fisher’s exact tests followed by Benjamini–Hochberg correction; gene sets with adjusted p (FDR) < 0.05 were considered enriched.

2.5. Validation of RNA-Seq Data

Differential expression calls obtained from the bulk RNA-seq were independently validated by two orthogonal approaches.
CAGE-seq libraries were prepared from 5 mg of RIN ≥ 7 total RNA according to a previously described protocol [17]. Libraries were prepared in batches of eight and further sequenced on a NextSeq 550 System (Illumina, USA) with single-end 75 bp reading.
The sequenced CAGE reads were trimmed with the FASTX Toolkit v0.0.14. Reads with N nucleotides, matched to rRNA, or matched to adapters were removed using RNAdust v1.06 and Trimmomatic v0.38. The trimmed reads were then aligned to the mm39 genome assembly for mouse and previously mentioned assembly for A. cahirinus with STAR v2.7.10a. The CAGE transcription start sites, clusters, and active promoters were identified by using PromoterPipeline and TSSClassifier [18,19]. Promoter-to-gene annotation was carried out with the ChIPseeker package v1.40.0 for R, and cross-species differential expression analysis was performed as described in Alam et al. 2020 [19,20].
The gene expression results obtained by the NGS approach were validated by means of real time PCR. RT-qPCR was performed in 96-well plates using Bio-Rad CFX Real-Time PCR equipment (Bio-Rad, Hercules, CA, USA) with a One Step TB Green PrimeScript RT-PCR Kit II (Takara, Japan) according to the manufacturer’s instructions. Each reaction had a final volume of 10 μL and contained the following components: 1 μL of RNA, 5 μL of 2X One Step TB Green RT-PCR Buffer 4, 0.4 μL of PrimeScript 1 step Enzyme Mix 2, 0.4 μL of forward primer (10 μmol/L), 0.4 μL of reverse primer (10 μmol/L), and 2.3 μL of ddH2O. The primer sequences are shown in Supplementary Table S1.
The reaction was conducted at 42 °C for 5 min followed by 95 °C for 10 s, followed by 40 cycles of denaturation at 95 °C for 5 s, annealing at 59 °C for 30 s, and extension at 72 °C for 60 s. Each RT-qPCR involved three biological replicates and three technical replicates. Bio-Rad CFX Maestro software (Bio-Rad, Hercules, CA, USA, latest v. 2.3) was used for the calculation of the Cq values of each amplification. The GAPDH and ACTB genes were used as reference genes.

2.6. Statistical Analysis

Statistical analysis of the experimental results was performed using GraphPad Prism version 9.0. The normality of the distribution was assessed using the Shapiro–Wilk, D’Agostino–Pearson, and Kolmogorov–Smirnov criteria. Unpaired t-tests (parametric) were utilized to determine the statistical significance of the observed differences between the data arrays of the two groups of data. Statistical significance was considered at p < 0.05.

3. Results

3.1. Histological Examination

Upon exposure to standard staining dyes, the adrenal glands of Balb/c mice exhibit discernible features of both the medulla and cortex. The medulla is marked by the presence of elongated clusters of sizable rounded cells, encased within a thin layer of connective tissue. In parallel, the cortex distinctly manifests as two separate and easily distinguishable zones: the outer layer, referred to as the zona glomerulosa, adopts a formation evocative of arched clusters comprising rounded cells, distinguished by a substantial abundance of nuclei; conversely, the inner layer, denoted as the zona fasciculata, presents an organized arrangement of cellular plates that adopt a columnar structure (Figure 1).
Within the Acomys group, two primary zones were identified. The medulla is similarly characterized by the presence of clusters of sizable rounded cells with high amounts of connective tissue. Morphologically, the zona glomerulosa and fasciculata within the cortex do not exhibit a distinction from their counterparts in Balb/c mice. However, an additional region was observed, comprising a substantial quantity of small cells arranged in a random manner, lacking the characteristic formations seen in arches or columns. This distinctive area is presumed to constitute the zona reticularis.
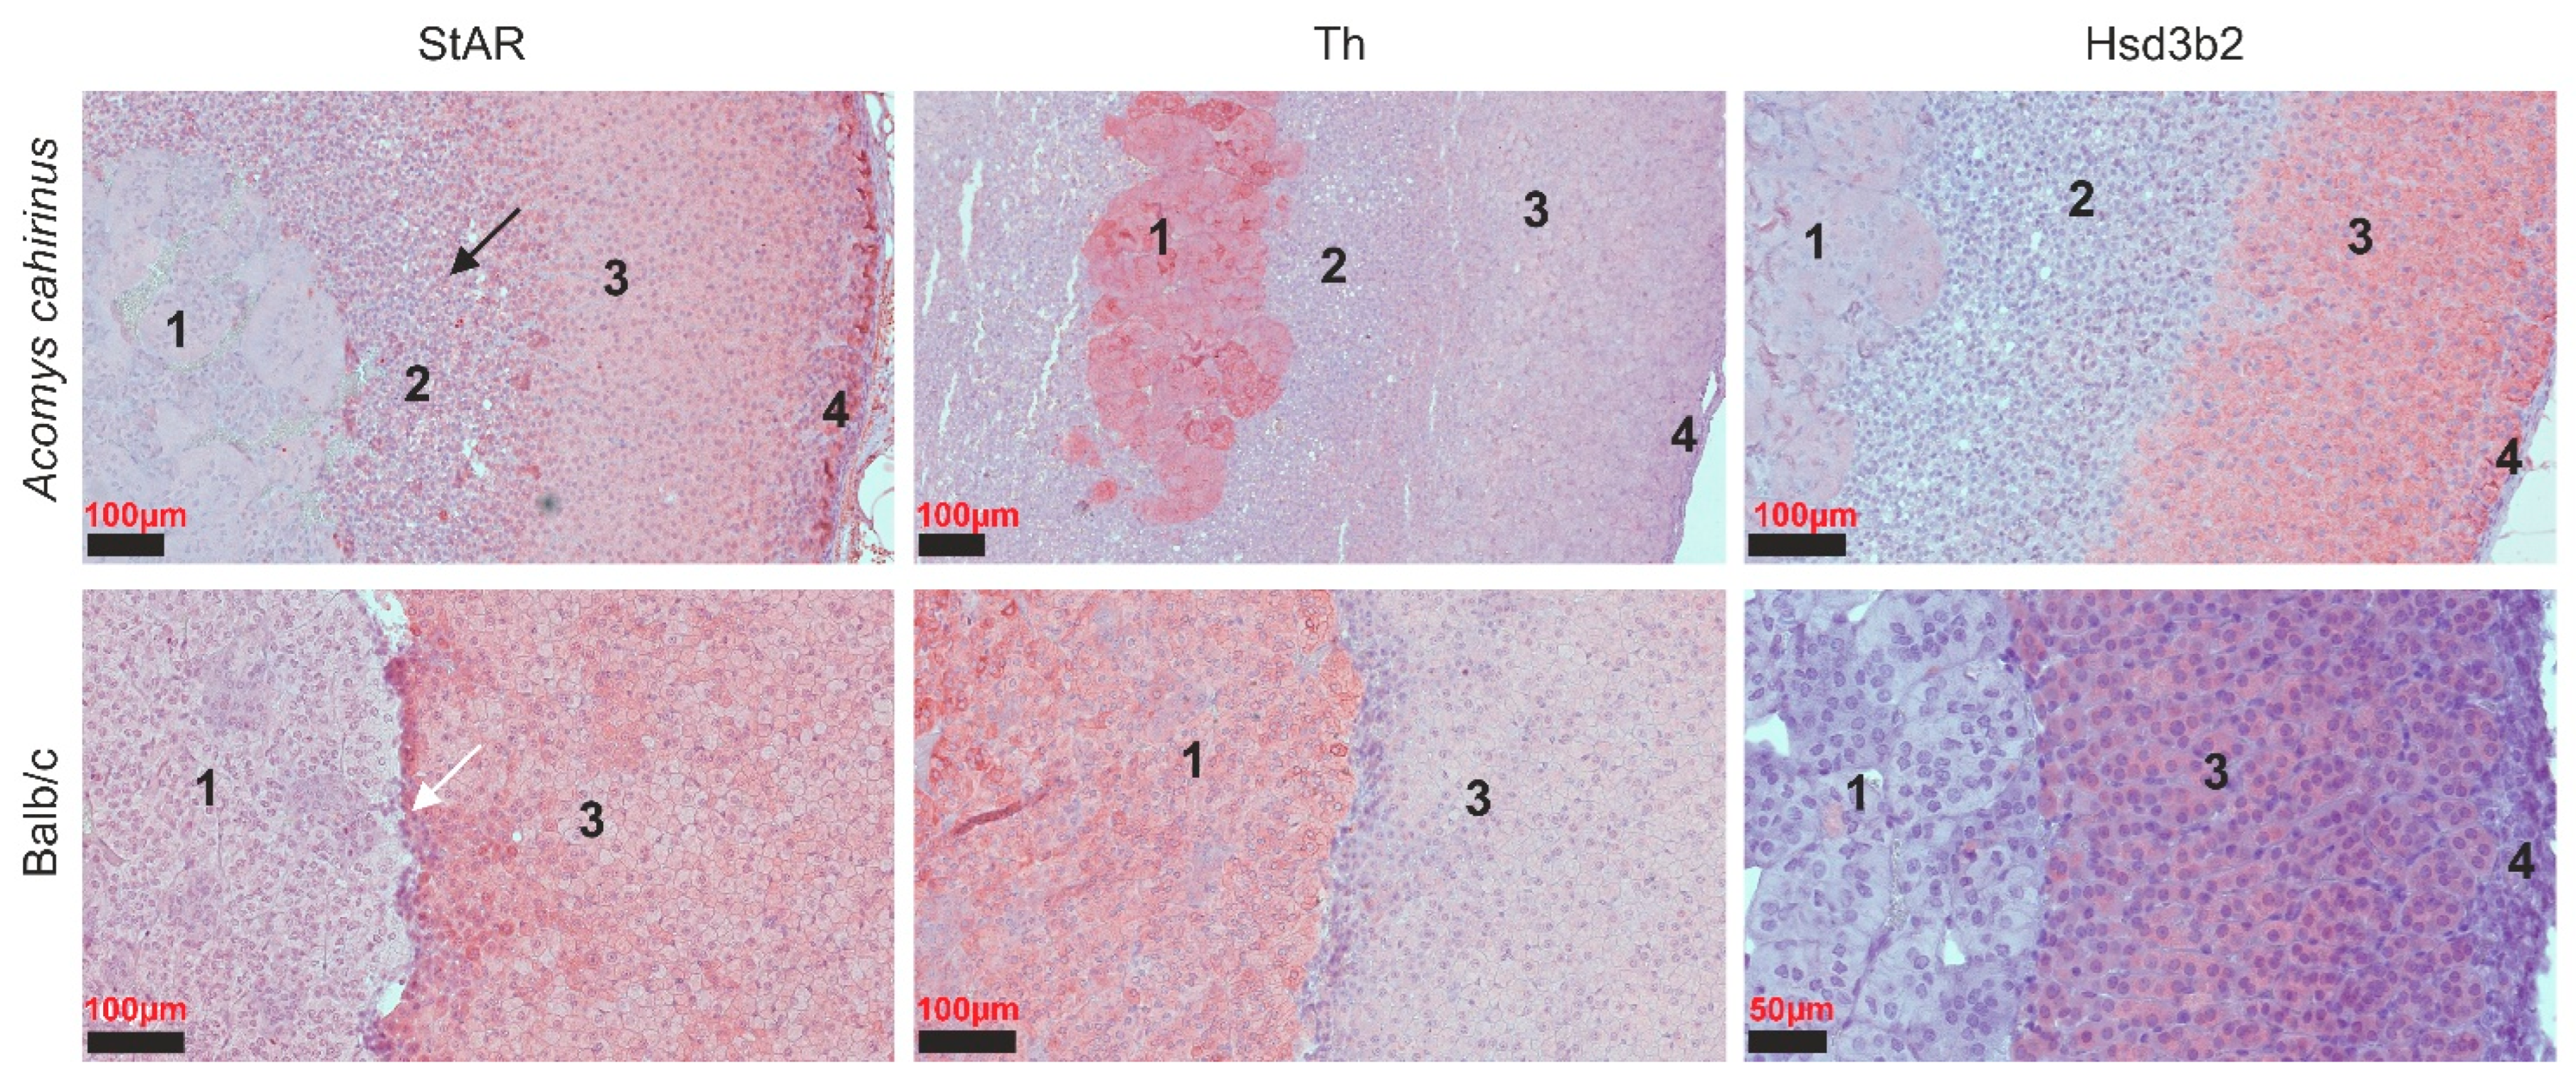
We used antibodies targeting Th and StAR to distinguish the cortex and medulla (Figure 2).
To foster a more comprehensive understanding of the distinctive strengths and constraints inherent in each model, a brief elucidation is warranted of the configuration of human adrenal glands and the process of steroidogenesis before embarking on the discourse surrounding alternative animal models for the examination of congenital adrenal hyperplasia.
Tyrosine hydroxylase is an enzyme that conducts the formation of catecholamines such as epinephrine and norepinephrine. In Acomys and Balb/c mice, the expression of TH is observed within the adrenal medulla.
In Acomys cahirinus, the cortex is stained by StAR protein; however, it is notable that the medulla is located within the thickness of the zona reticularis, lacking a distinct demarcation (Figure 2). In the case of Balb/c mice, cortex staining is also evident due to StAR antibodies, yet the medulla is demarcated from the zona fasciculata of the cortex by an additional thin layer of cells that do not show nonspecific staining of StAR protein. To differentiate the zones of the adrenal cortex, we selected antibodies to the enzyme 3β-hydroxysteroid dehydrogenase (3β-HSD). This enzyme catalyzes the biosynthesis of progesterone from pregnenolone, 17α-hydroxyprogesterone from 17α-hydroxypregnenolone, and androstenedione from DHEA in the adrenal glands [21]. According to the literature, in human adrenal glands, 3β-HSD, unlike zona reticularis, is highly expressed in the zona glomerulosa and the zona fasciculata [22].
In the Acomys group, a positive reaction is observed in the zona glomerulosa and fasciculata, and in the zona reticularis, there is no expression of this enzyme, which is fully correlated with the data of the human adrenal gland [22]. In the group of Balb/c mice, the presence of the enzyme 3β-HSD is observed only in the cortex (zona glomerulosa and zona fasciculata) (Figure 2).
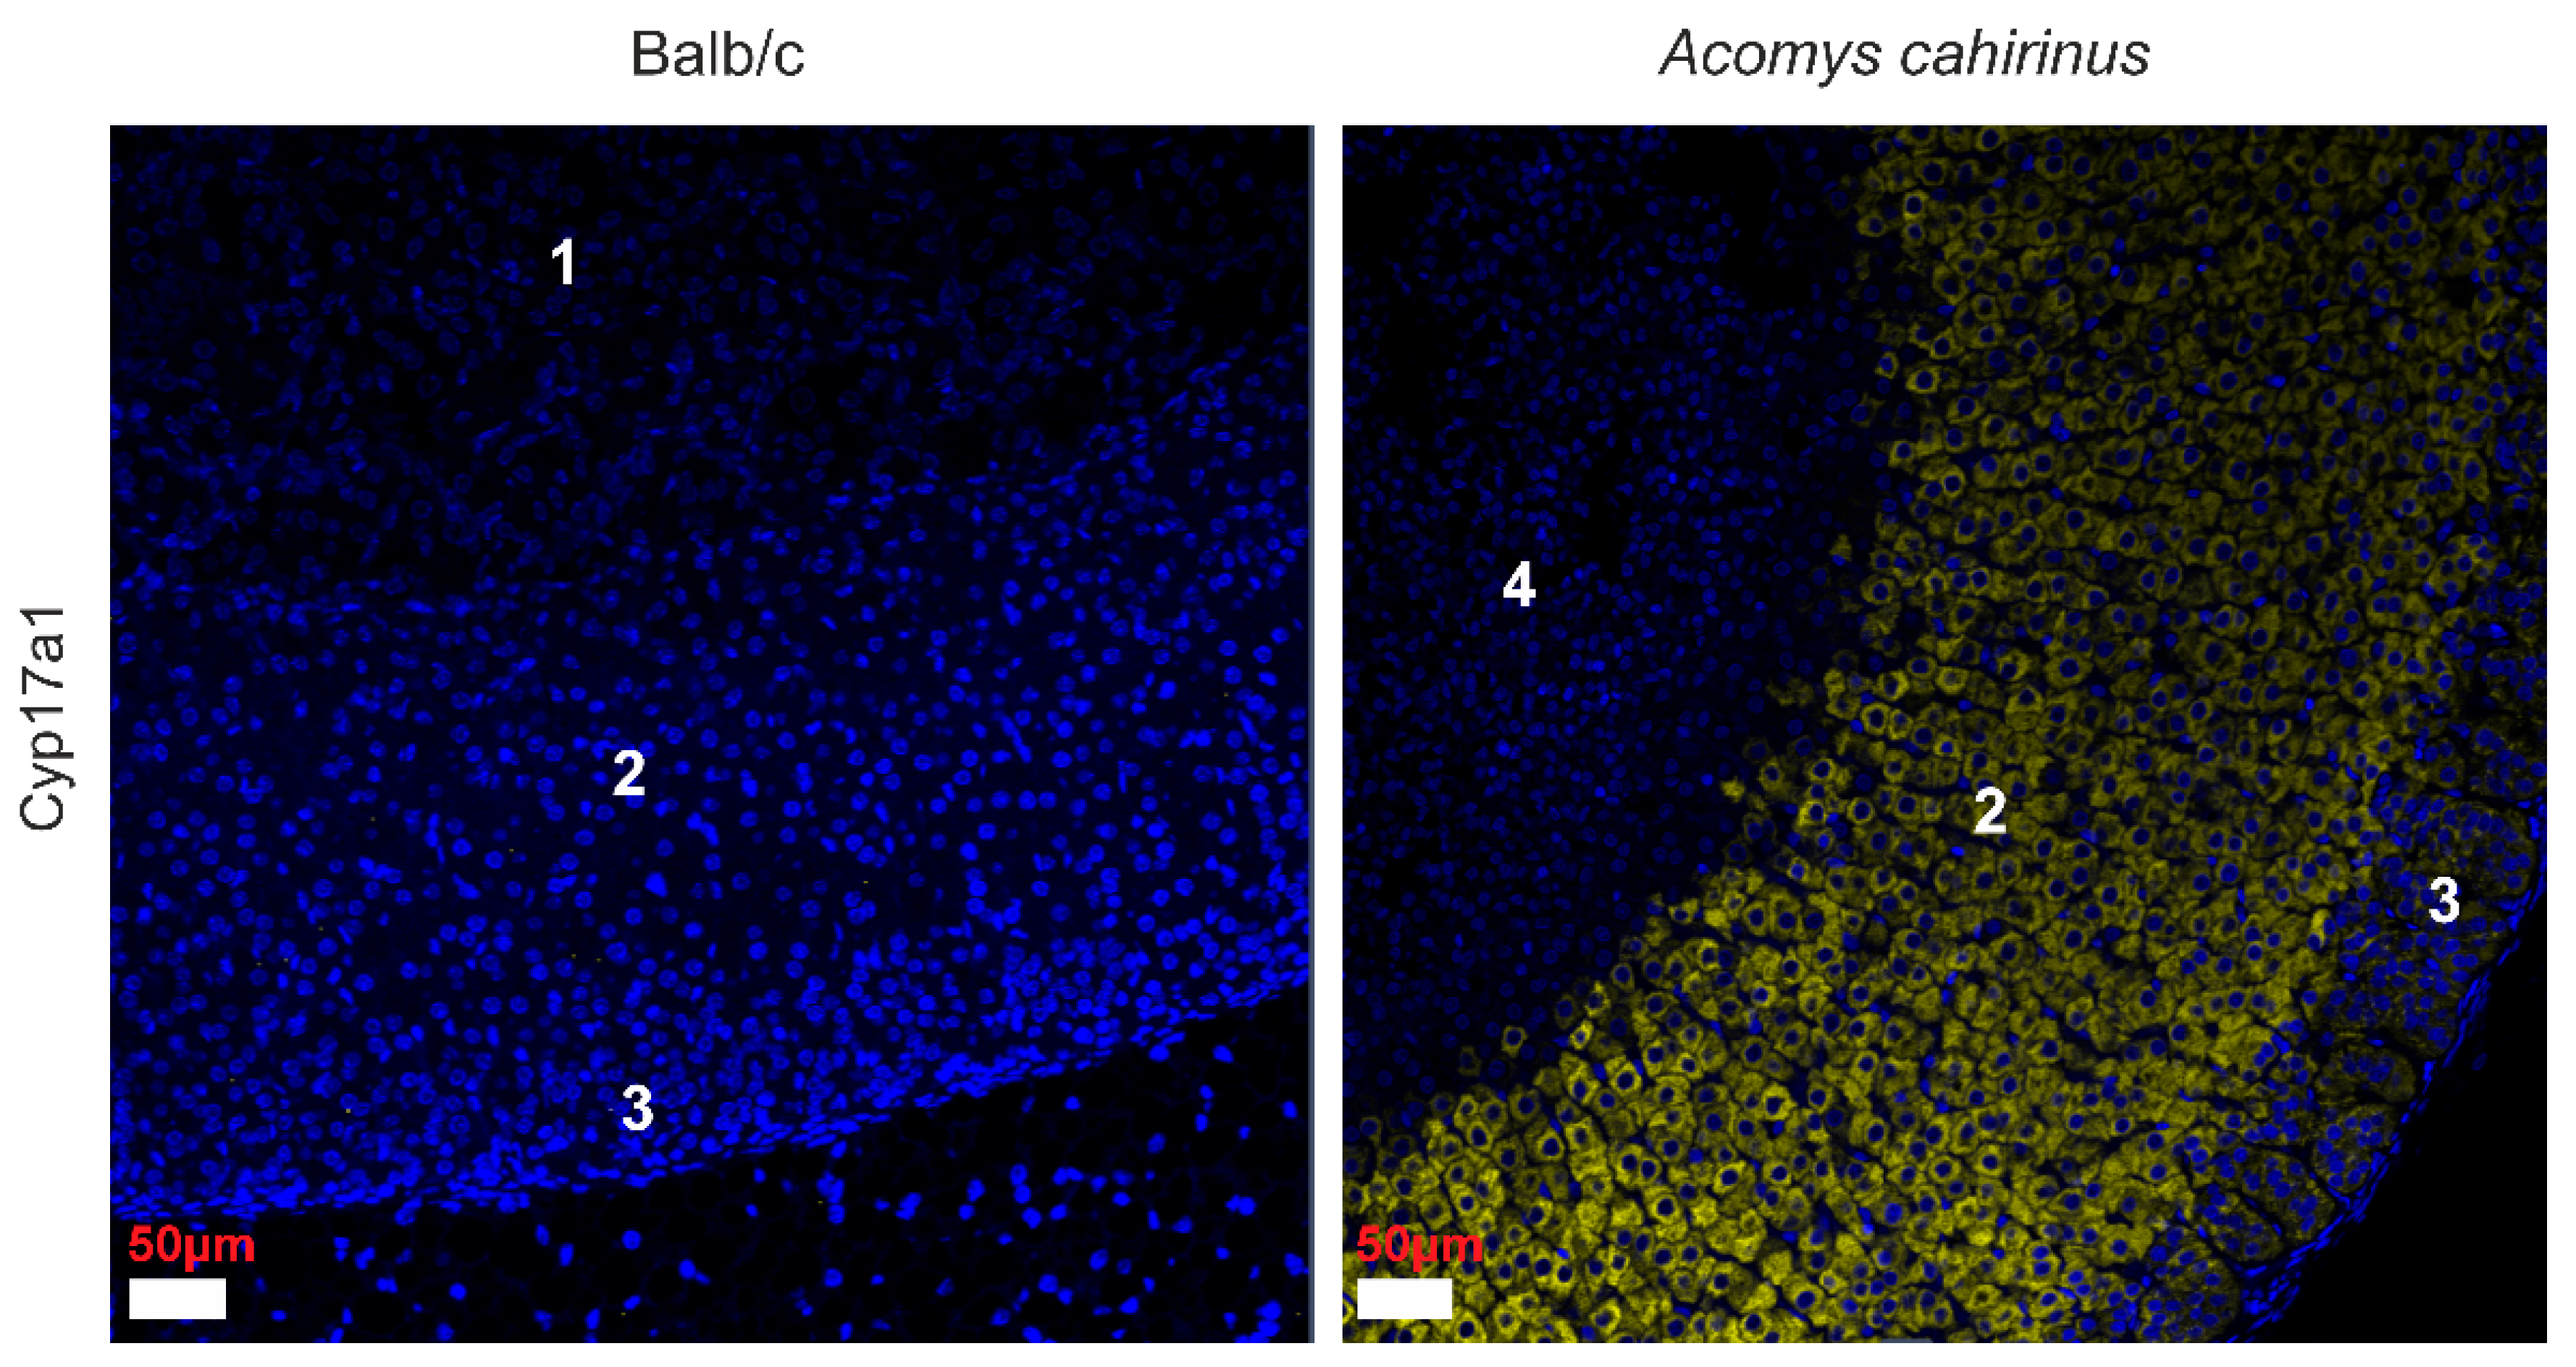
We employed antibodies against Cytochrome P450 17A1 to examine adrenal cortex tissue from Acomys and Balb/c mice. In line with Quinn’s findings, Acomys displayed CYP17A1 expression in all cortical layers except the ZR, while Balb/c mice showed no detectable expression in any adrenal zone, as depicted in Figure 3.

3.2. Differential Gene Expression in the Adrenal Glands of Acomys Cahirinus and Balb/C Mice

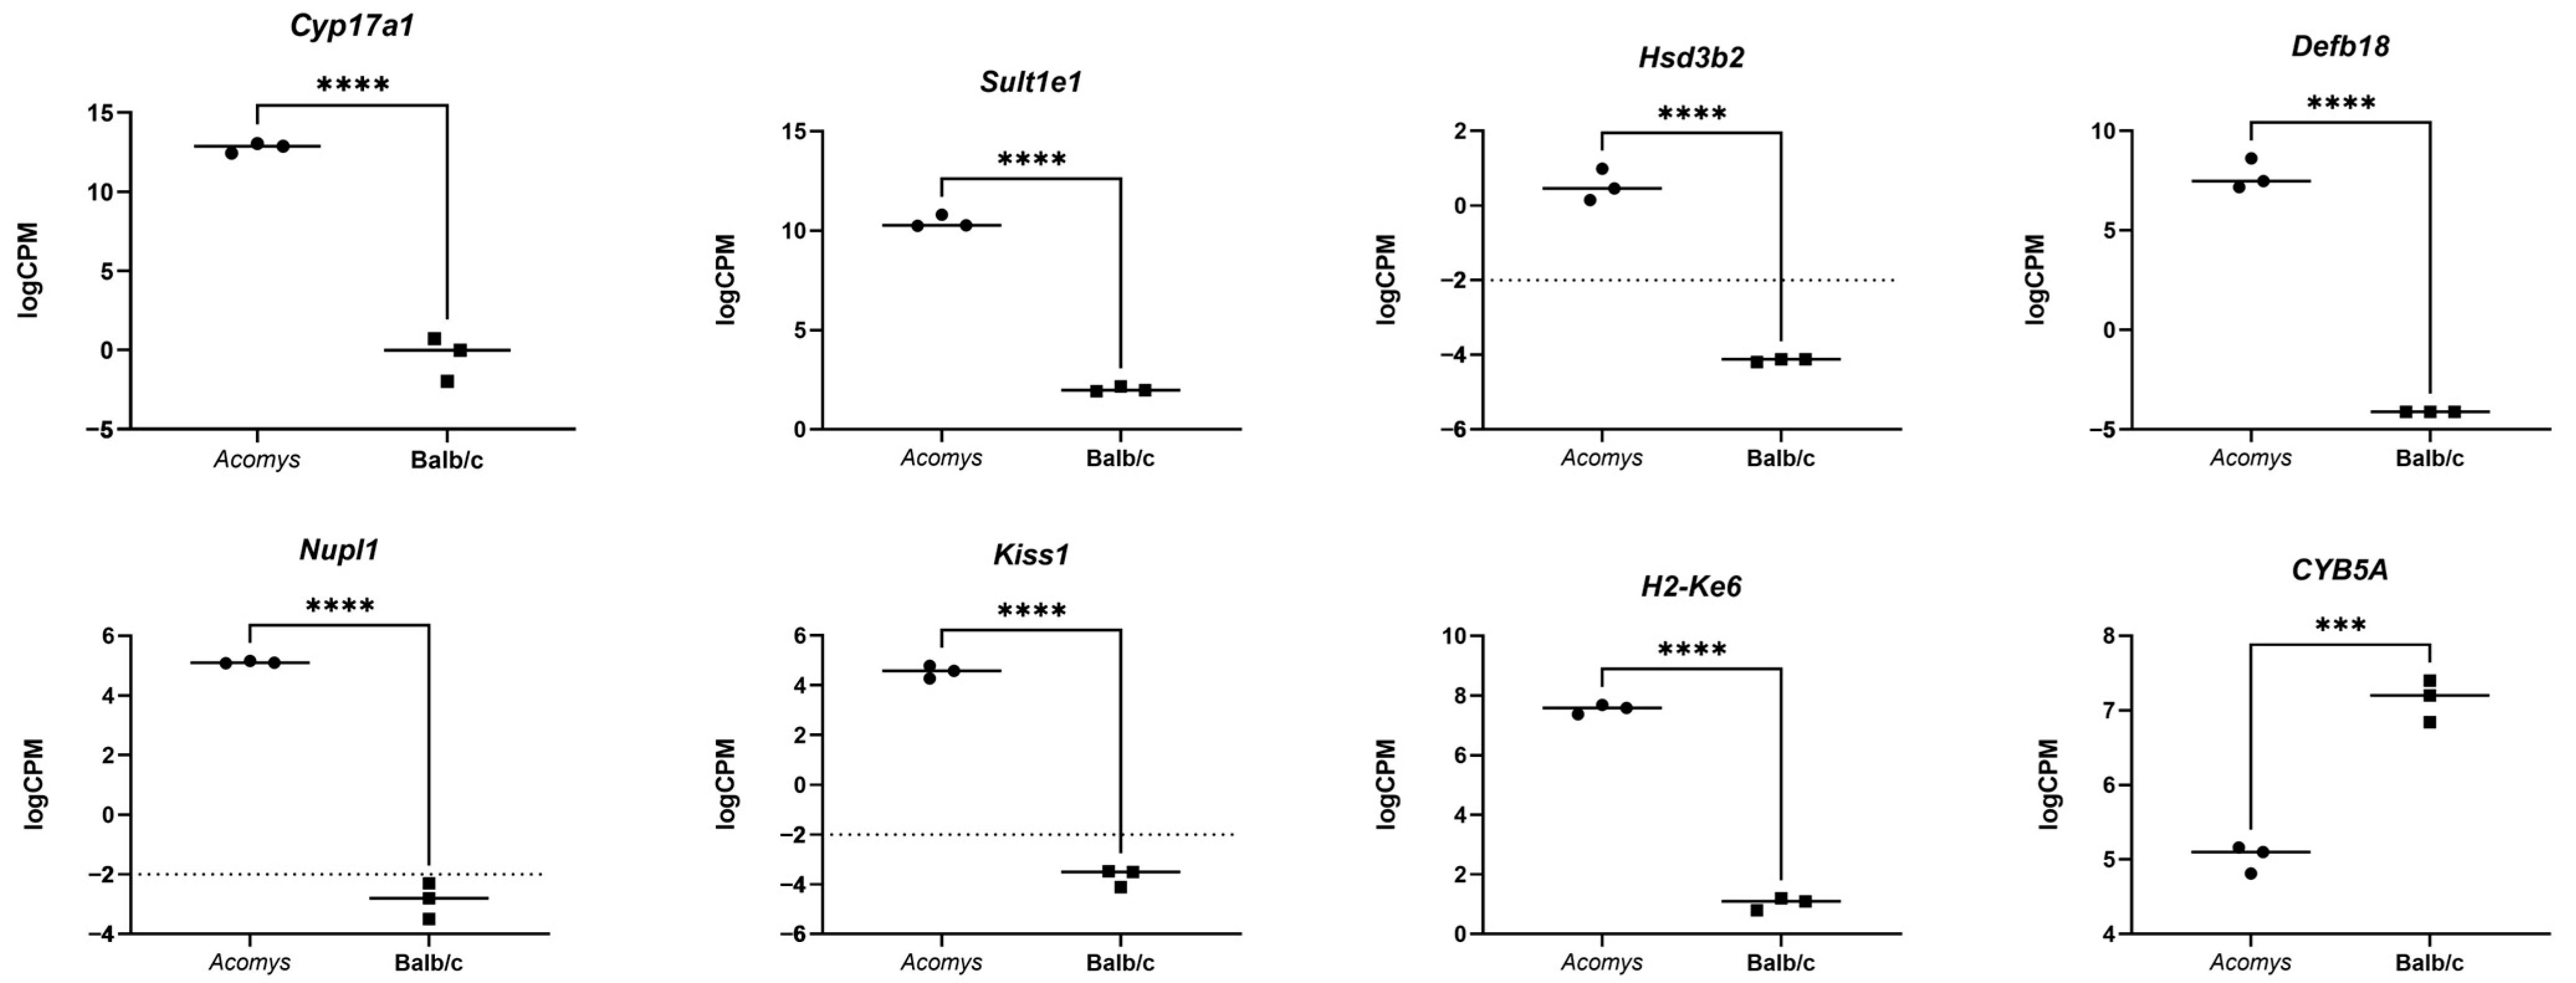
Using RNA sequencing, we identified differential expression gene (DEG) patterns in the adrenal glands of Acomys cahirinus and Balb/c mice (Figure 4). Detailed lists of differentially expressed genes and a Volcano plot are provided in Supplementary Table S2 and in Supplementary Figure S1. Notable differentially expressed genes include Cyp17a1 (17-alpha-hydroxylase, 17,20-lyase), which is essential for cortisol and adrenal androgen synthesis [23]; Sult1e1 (estrogen sulfotransferase), which encodes an enzyme involved in the sulfation of estrogens and other steroids, thus influencing androgen metabolism and regulation [24]; and Hsd3b2 (3-beta-hydroxysteroid dehydrogenase), crucial for the conversion of pregnenolone to progesterone and dehydroepiandrosterone to androstenedione [25]. Furthermore, Nme3 (nucleoside diphosphate kinase 3), Defb18 (defensin beta 18), and Nupl1 (nucleoporin 58) are associated with androgen receptors in adrenal gland function or steroid hormone pathways, suggesting that they play roles in modulating androgen receptor activity and steroid hormone production [26,27]. An elevated expression level of Kiss1 (Kisspeptin1) was also identified; its protein product is known to regulate adrenal steroidogenesis through modulation of the hypothalamic–pituitary–adrenal axis [28,29]. Furthermore, H2-Ke6 (Hsd17b8, hydroxysteroid 17-beta dehydrogenase 8) participates in the conversion of less active steroid hormones to more active forms, such as converting estrone to estradiol [30,31].
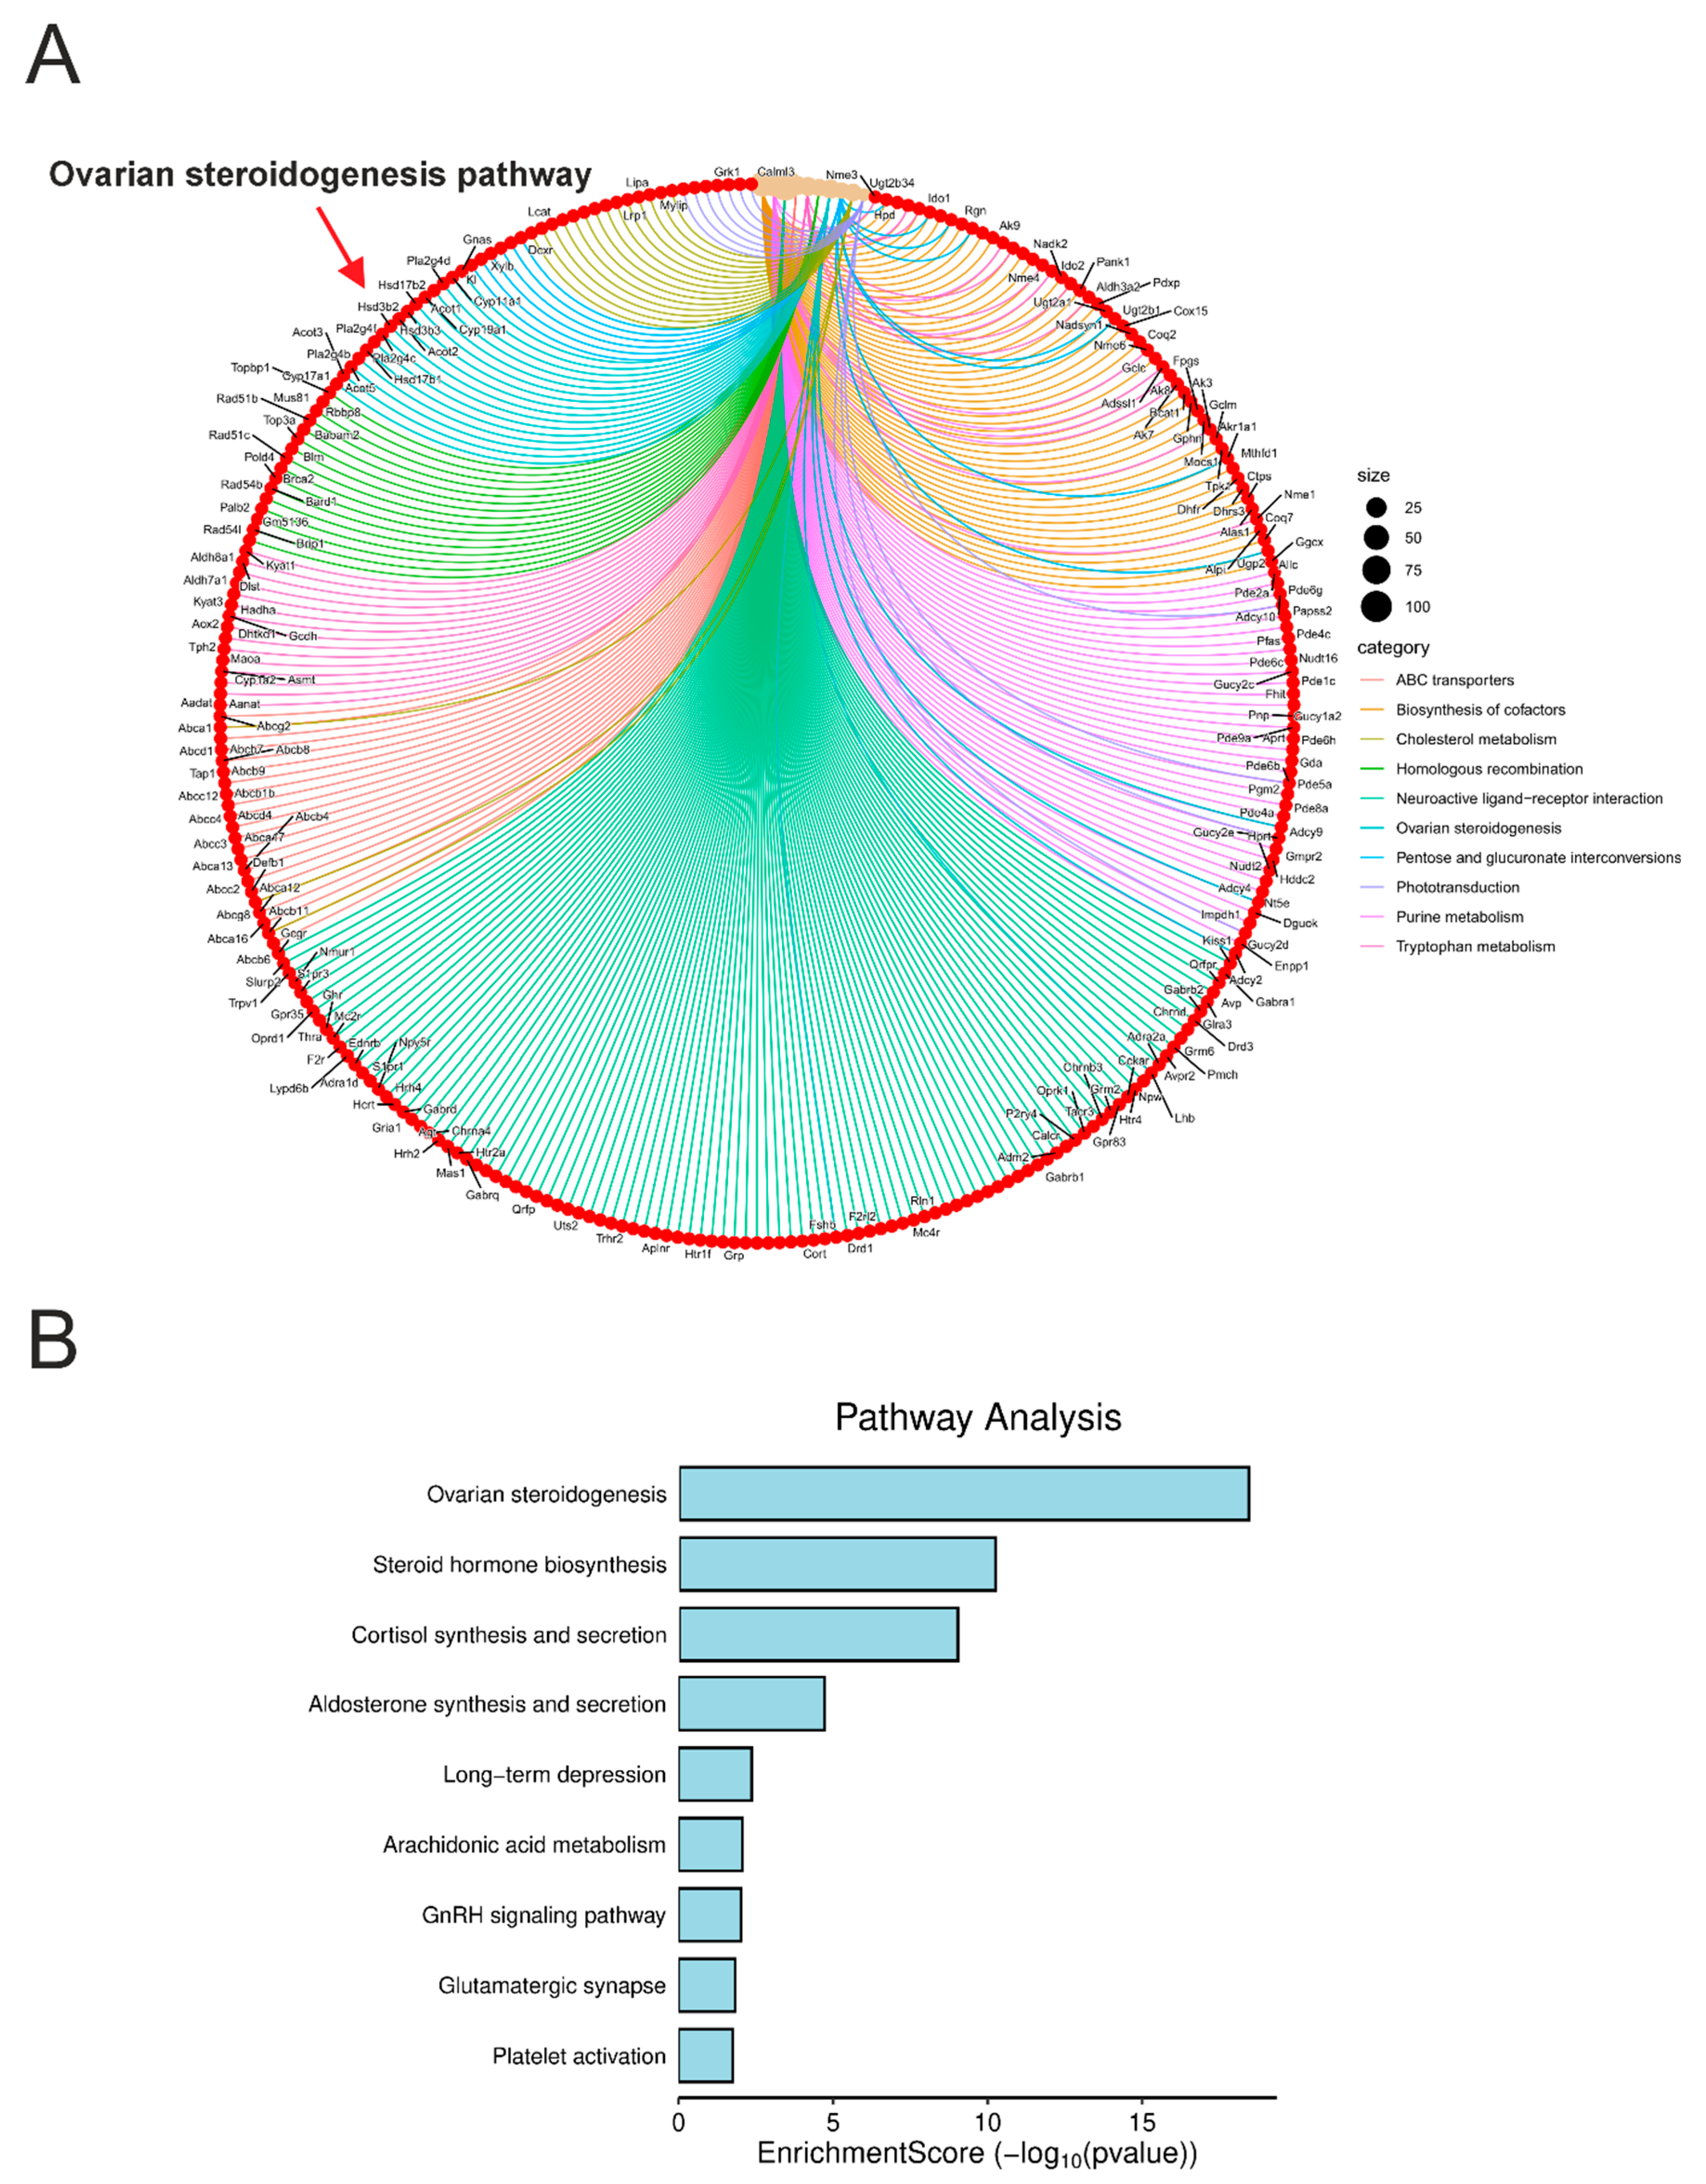
We performed a gene ontology enrichment analysis on differentially expressed genes in Acomys. This analysis revealed significant enrichment of a KEGG pathway annotated as ovarian steroidogenesis (Figure 5A,B). It is important to note that this designation reflects the KEGG database nomenclature, where the pathway (map04913) includes enzymes involved in the production of sex steroids in the ovary. However, these enzymatic steps are largely shared between ovarian and adrenal steroidogenic processes. Therefore, the activation of this pathway in our data likely represents adrenal cortex activity related to androgen biosynthesis, rather than ovary-specific functions.
To explore this pathway further, we included STAR, a gene known to play a central role in steroidogenesis. This led to the identification of additional enriched metabolic routes associated with steroid hormone biosynthesis, as well as cortisol synthesis and secretion (Figure 5B). These findings provide indirect evidence for the existence of a functionally active adrenal steroidogenic pathway in Acomys cahirinus, potentially supporting both androgen and cortisol production.
A notable observation was the decreased expression of Cyb5a in Acomys relative to Balb/c. Additionally, due to the limitations of the preliminary Acomys genome annotation (based on liftover from the mouse genome), we currently lack information on the expression of Sult2a1, a key enzyme for adrenal sex steroid production in humans. The absence (or undetectable expression) of this gene in our dataset may suggest that Acomys utilizes alternative enzymes or metabolic routes for the synthesis and regulation of adrenal steroids.
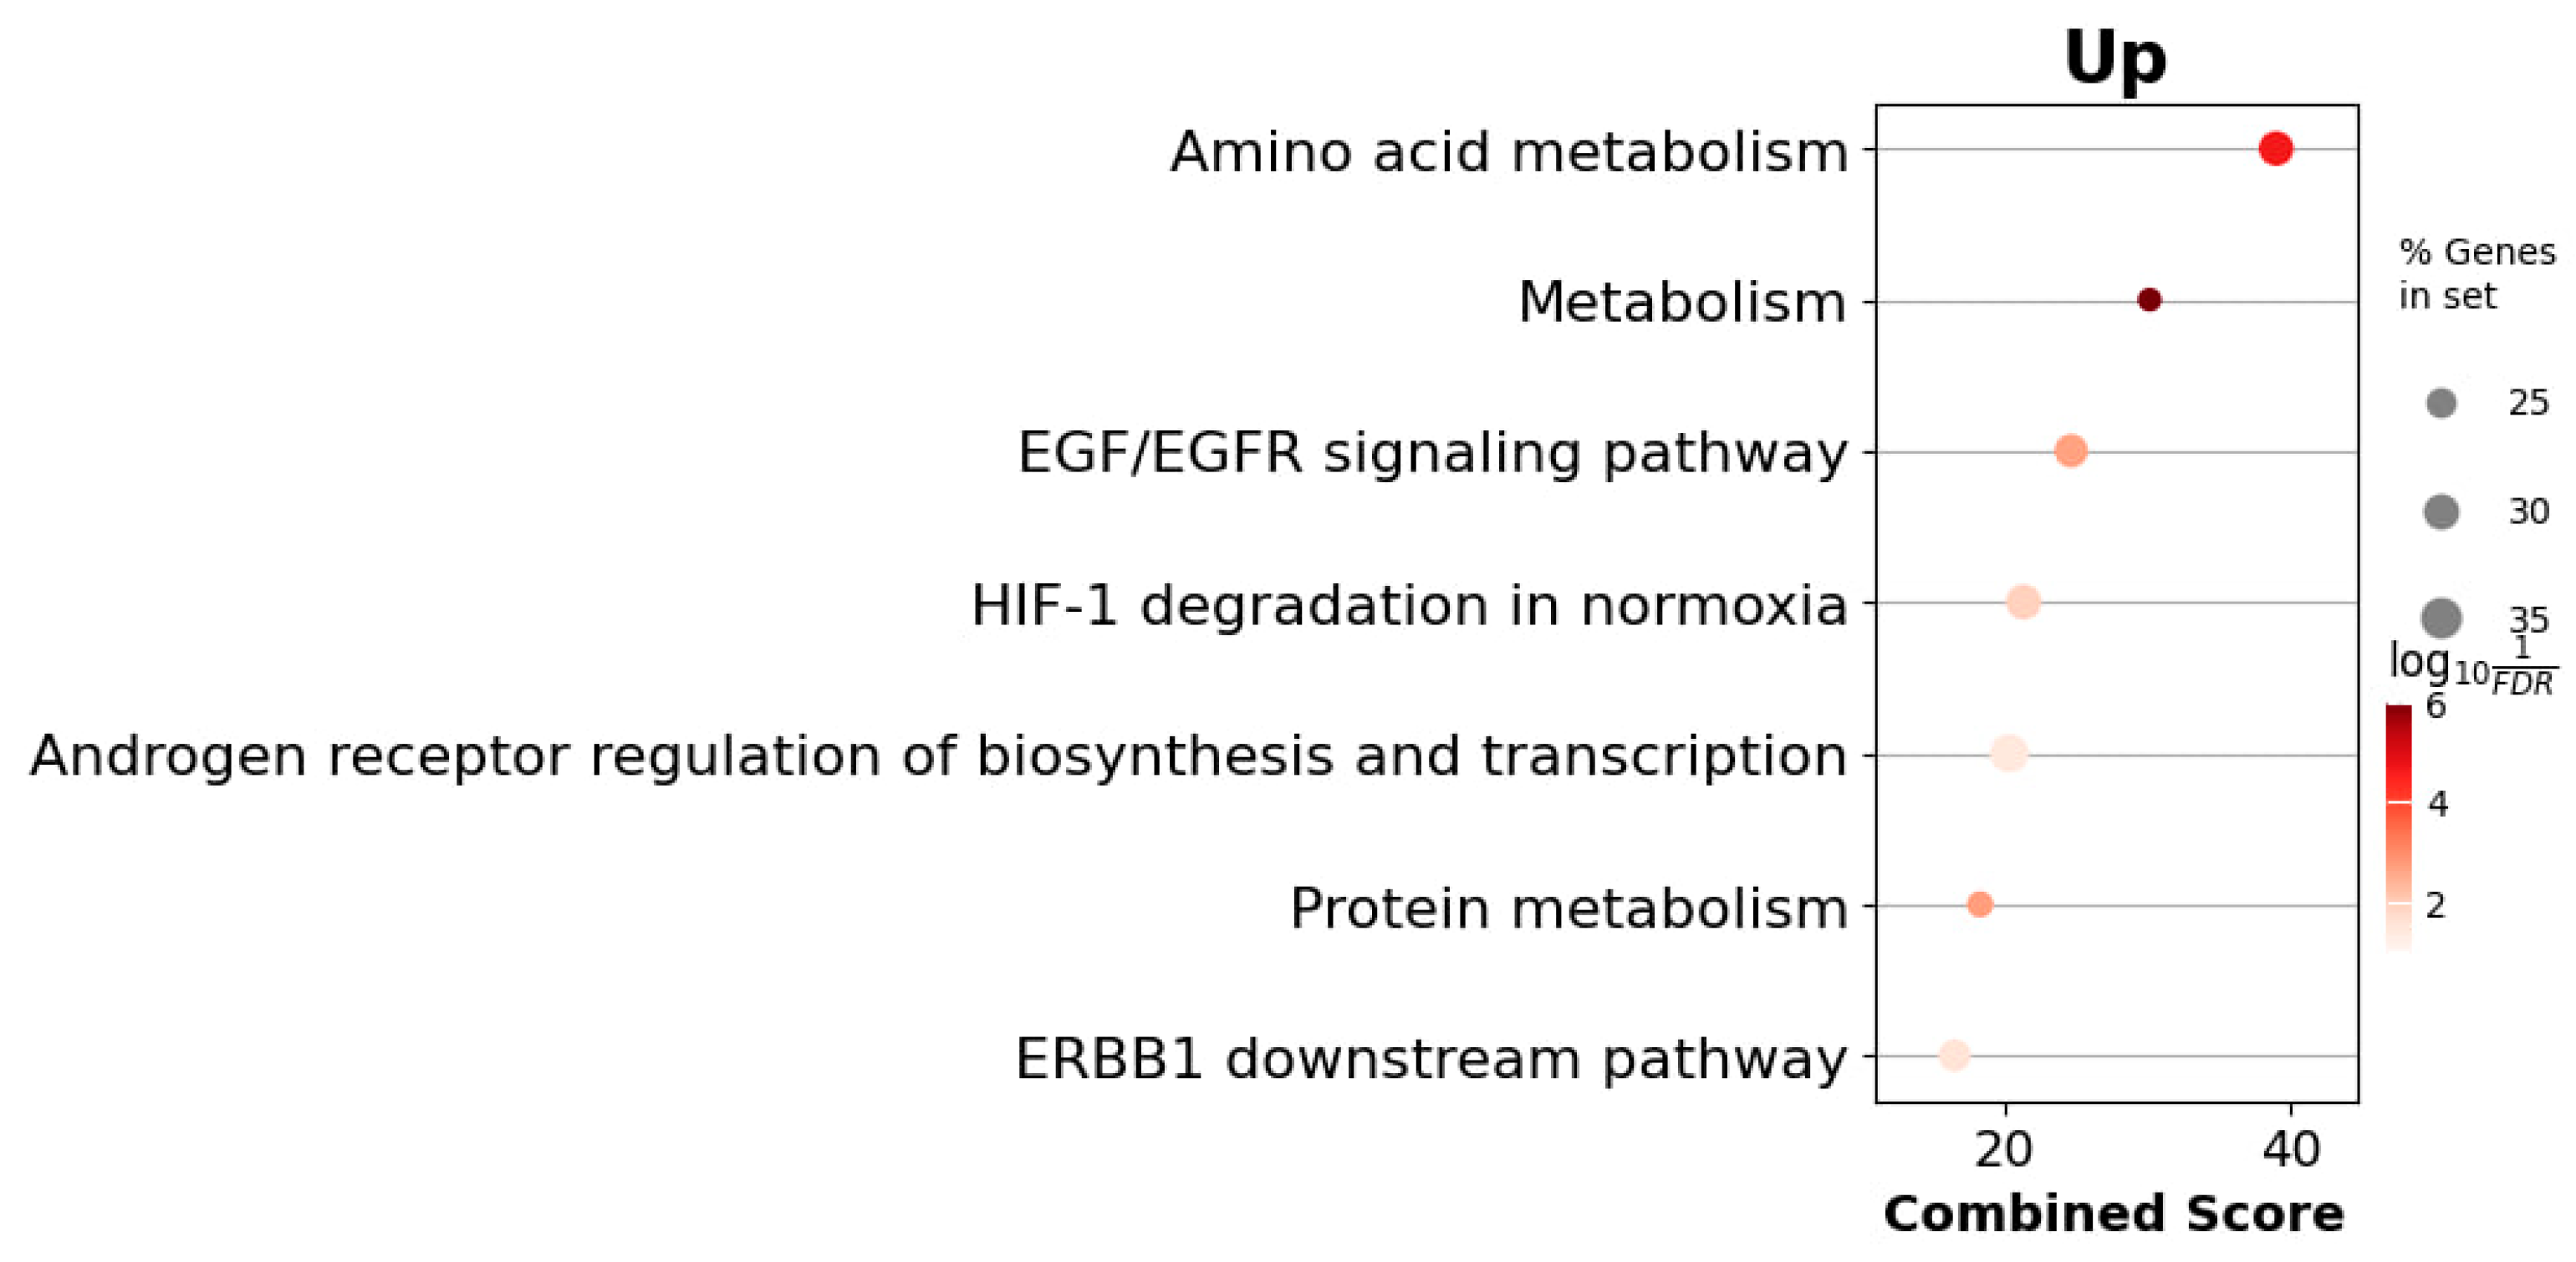
Subsequently, we performed over-representation analysis (ORA) using the gseapy python package and the BioPlanet_2019 gene set collection. (Figure 6) This analysis revealed statistically significant enrichment of pathways and processes closely linked to adrenal gland function and hormone secretion. Specifically, enriched terms such as Metabolism, Amino acid metabolism and Protein metabolism highlight the regulatory role of adrenal hormones like cortisol in metabolic processes. The EGF/EGFR signaling pathway and ERBB1 downstream pathway suggest involvement in the proliferation and survival of adrenal cortical cells. Additionally, the term Androgen receptor regulation of biosynthesis and transcription reflects the adrenal glands’ role in androgen production and signaling, while HIF-1 degradation in normoxia points to the influence of hypoxic and stress conditions on adrenal hormone regulation.
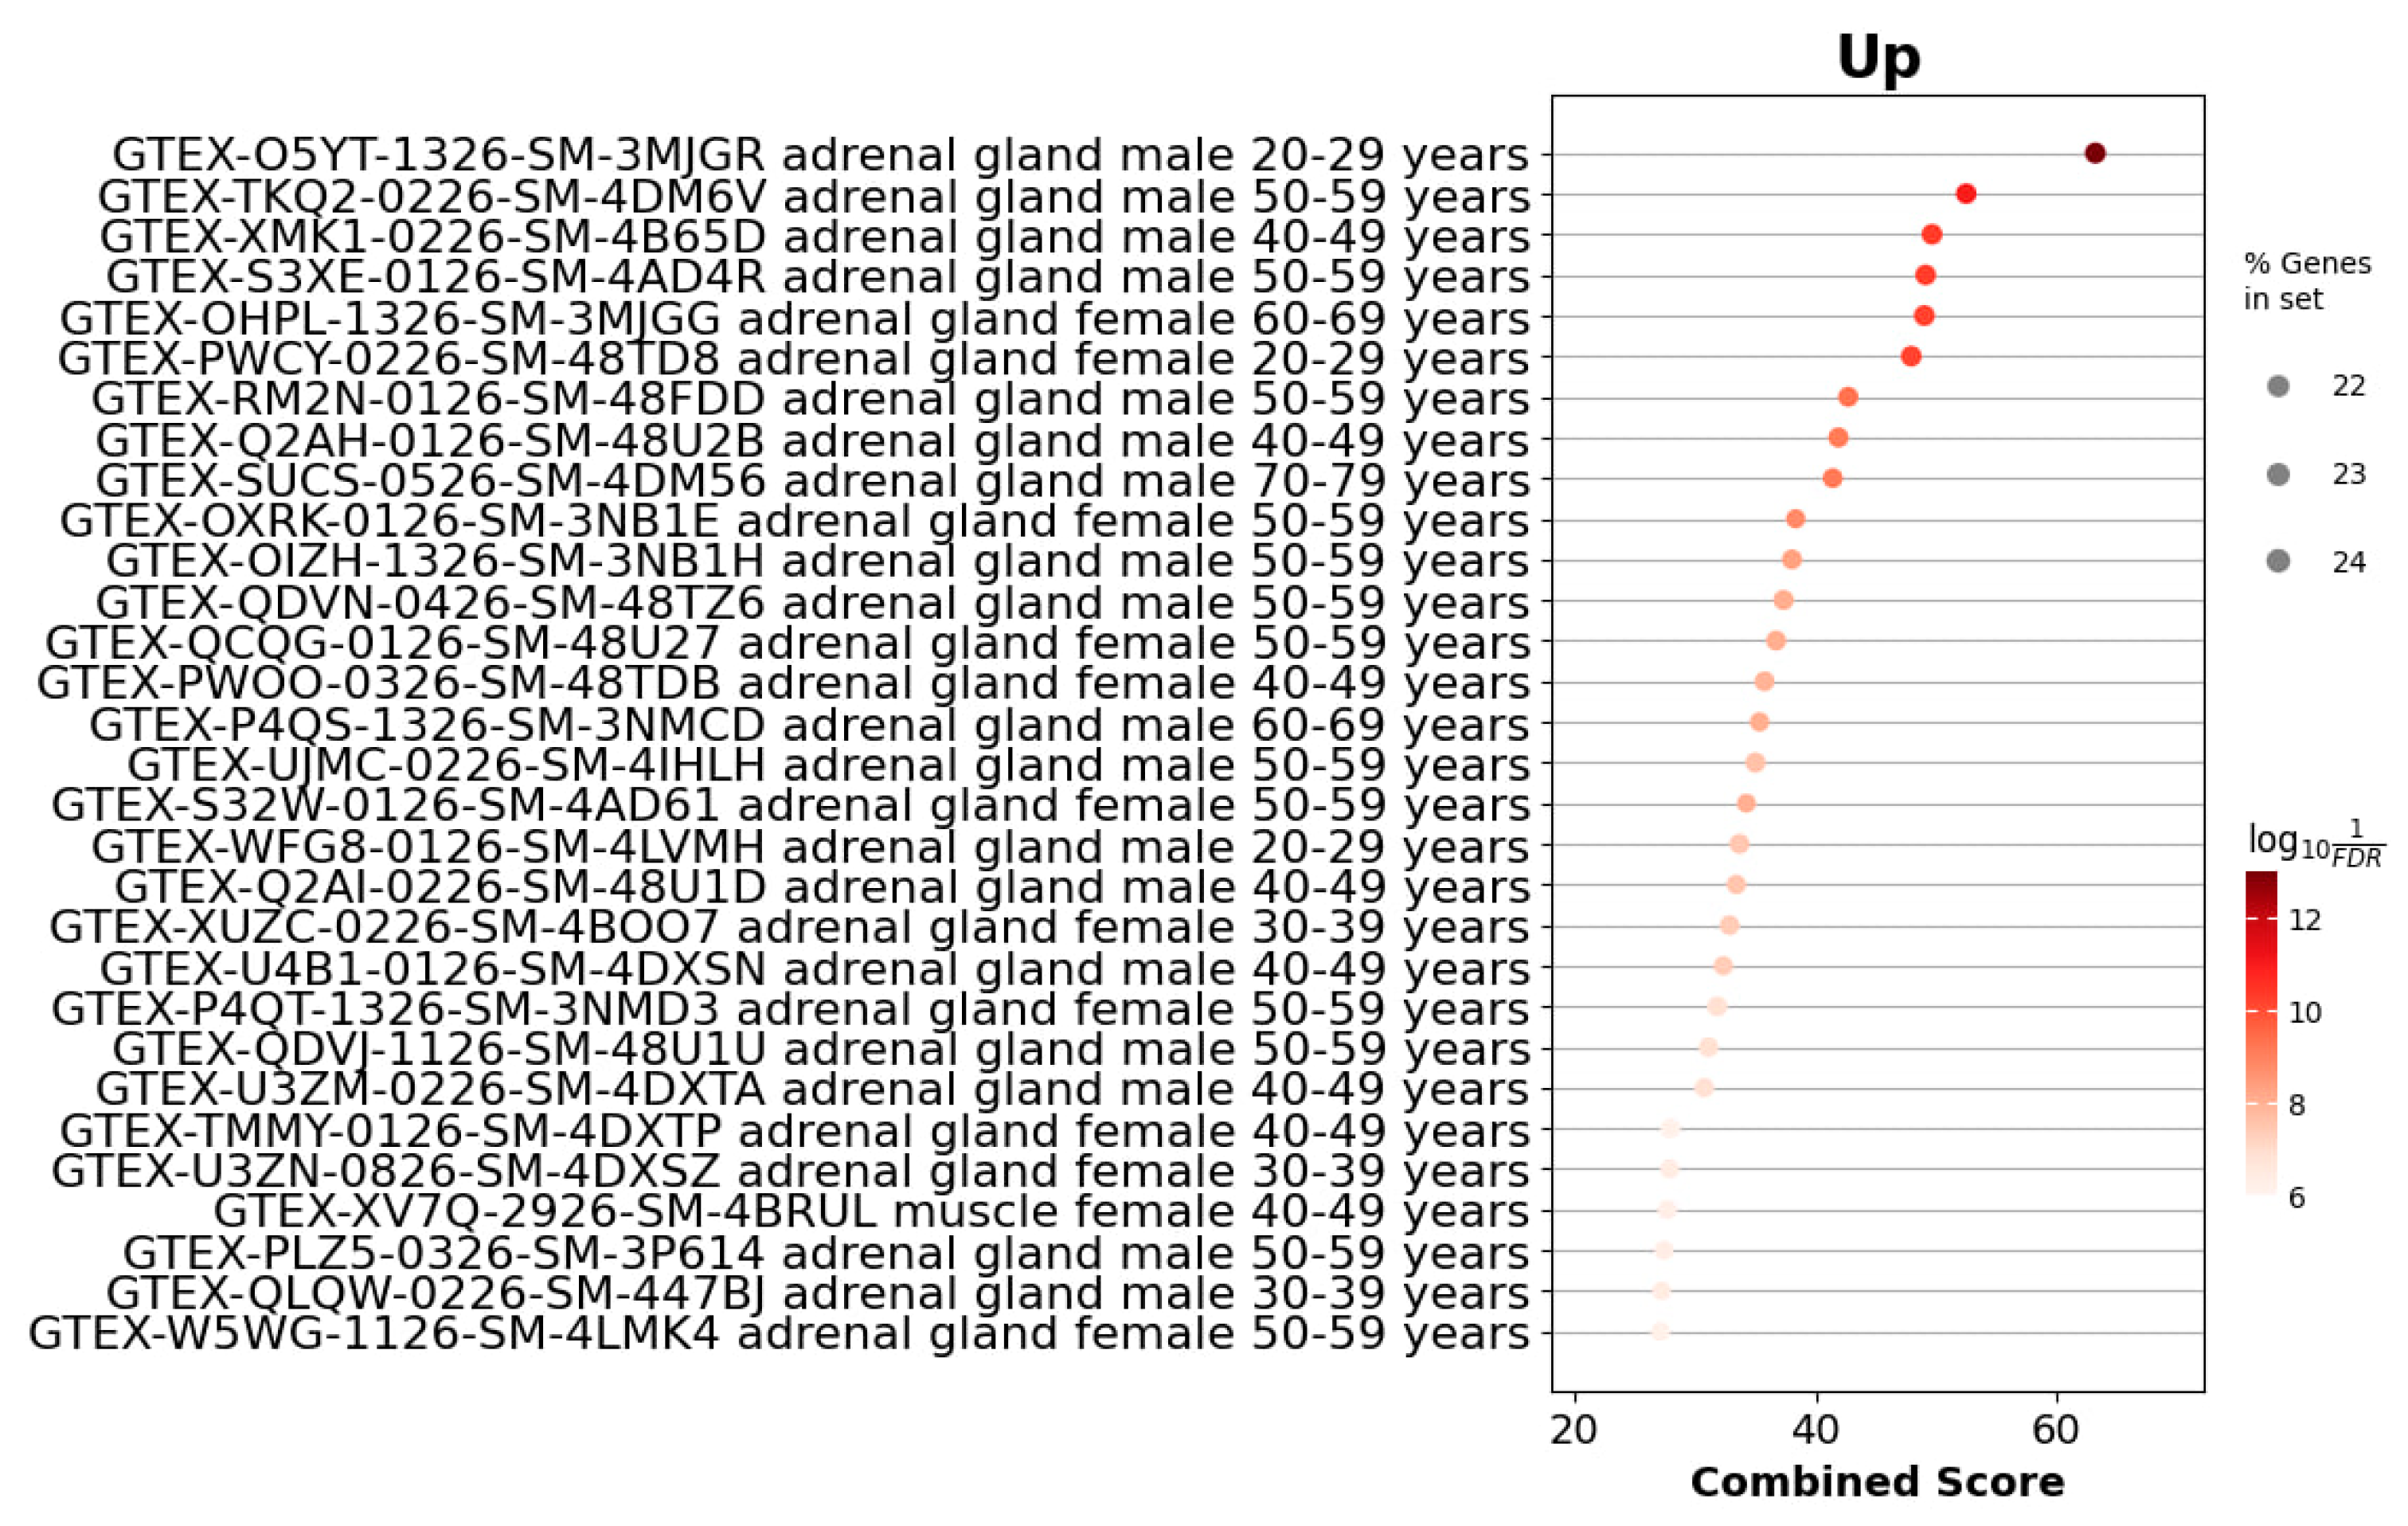
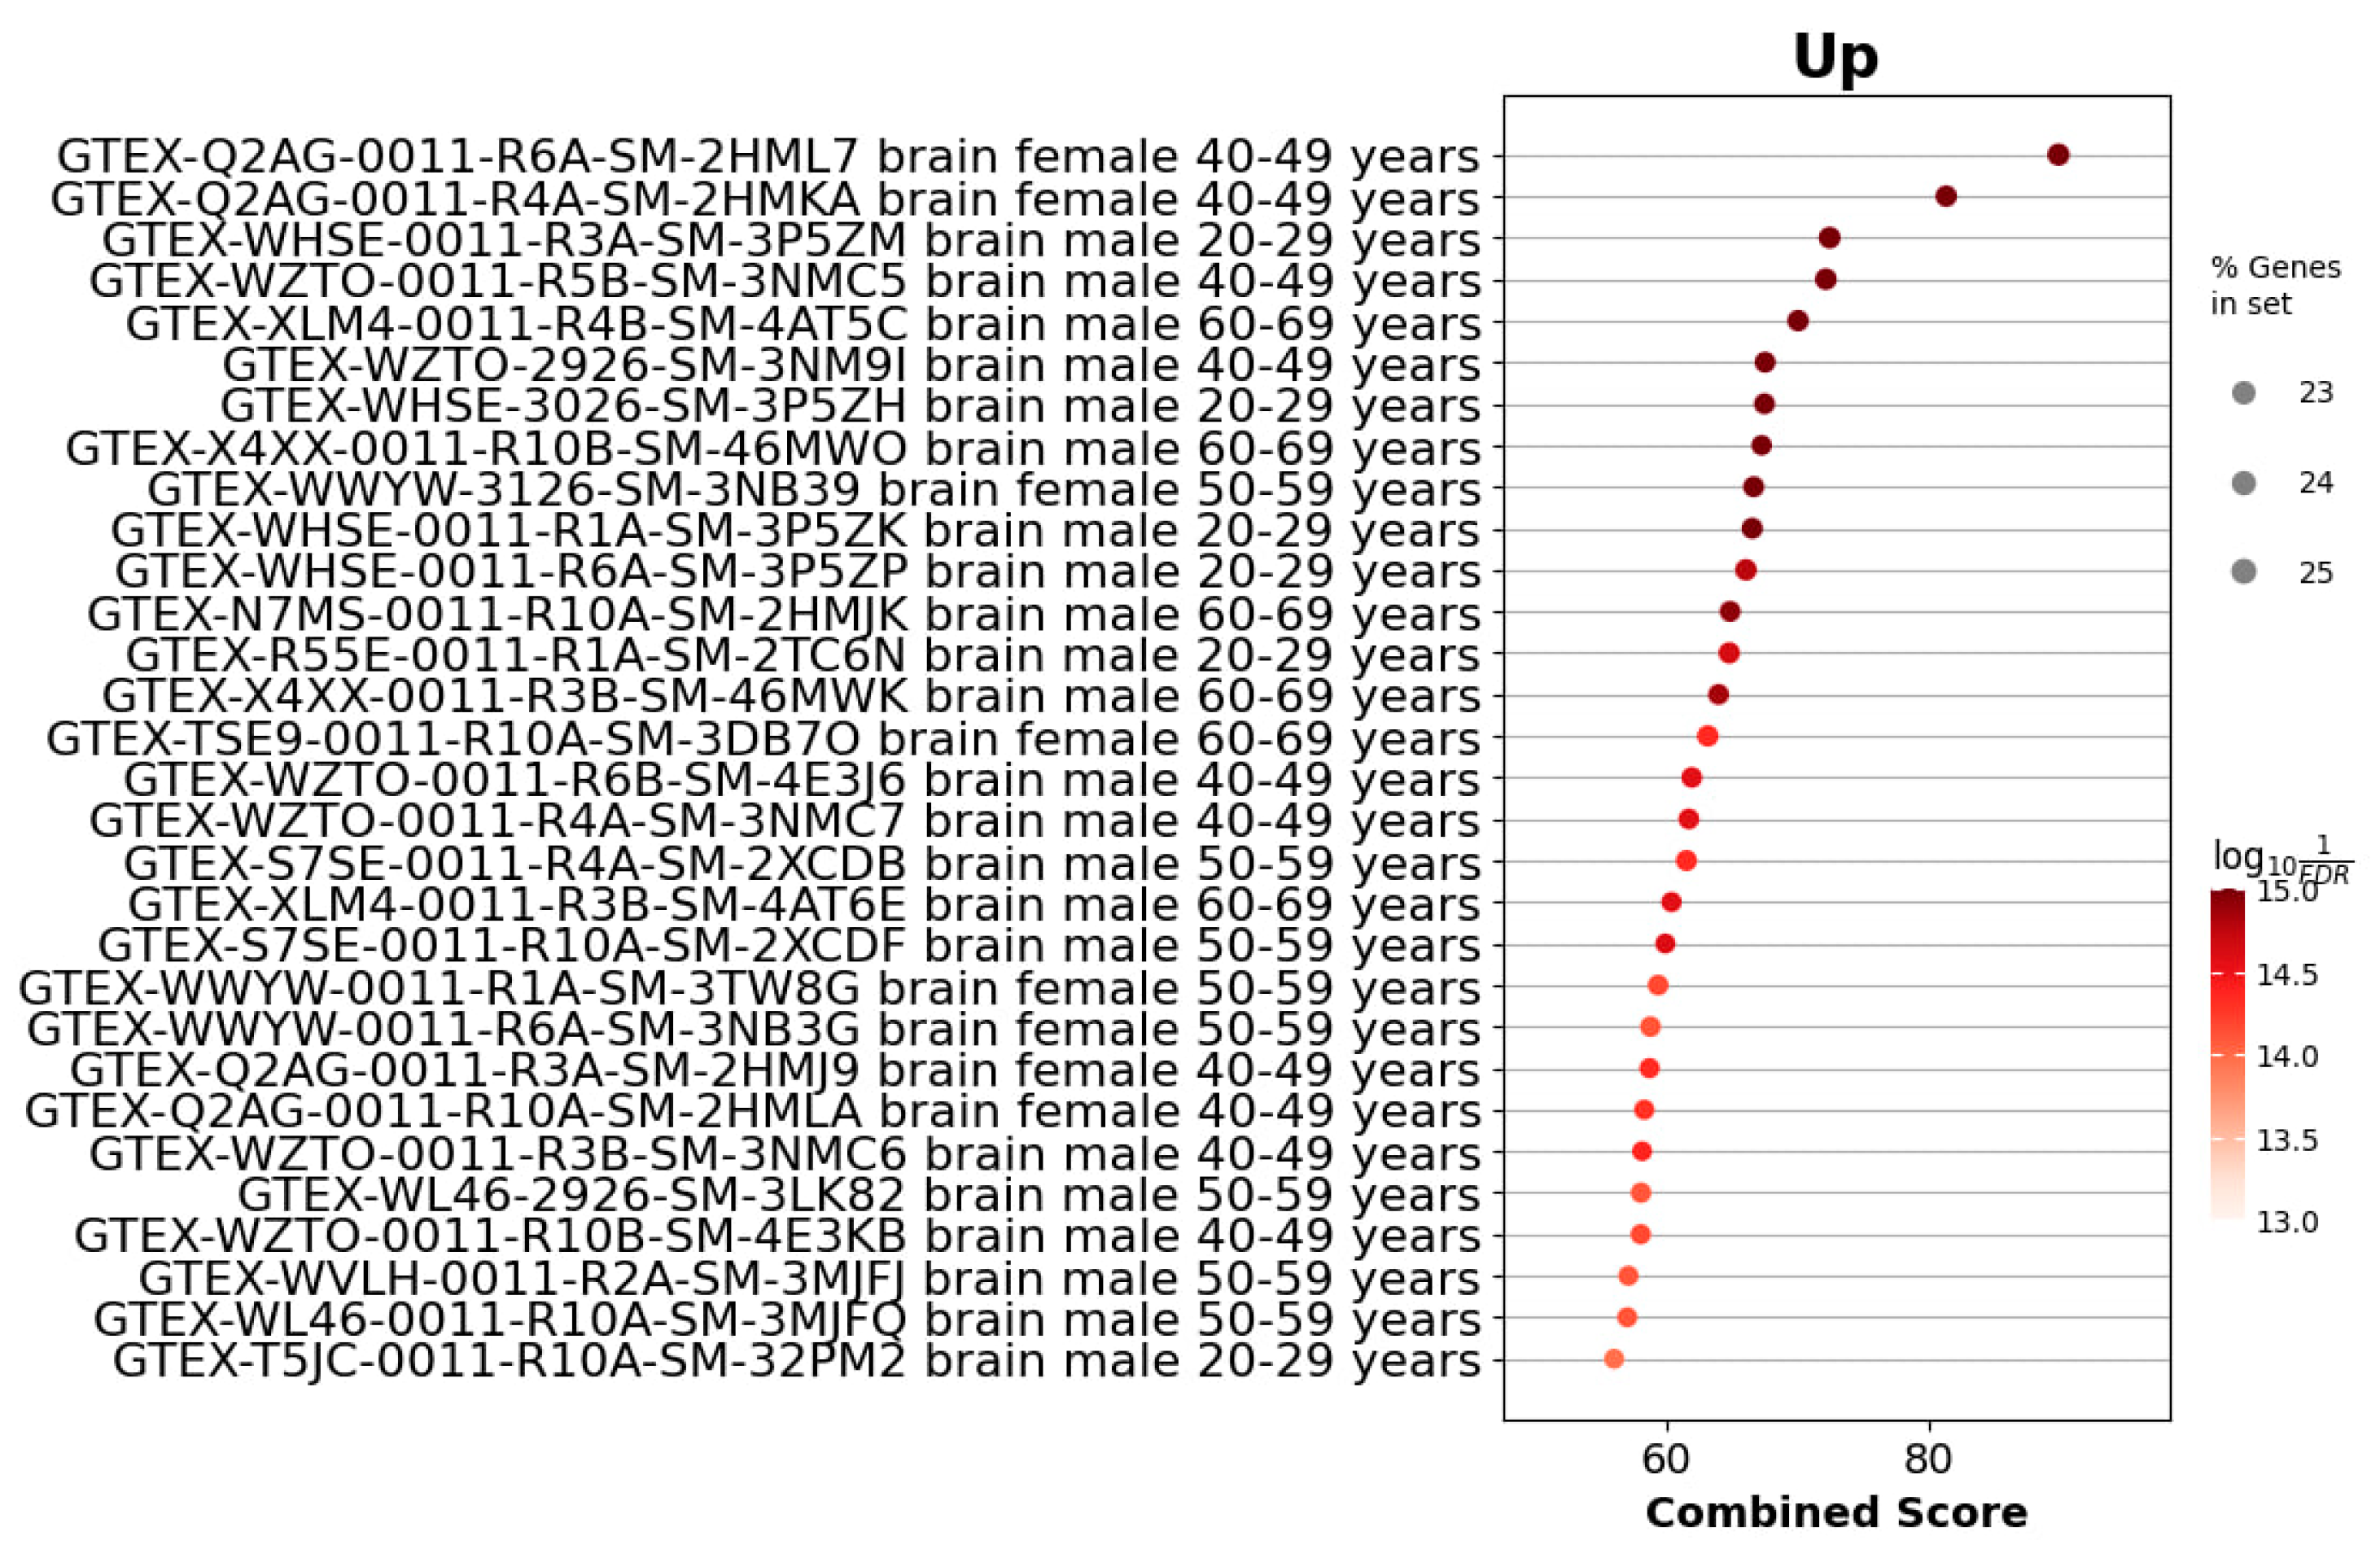
To assess the similarity of Acomys gene expression profiles to those of human tissues, we utilized the Enrirchr GTEx_Tissue_Expression_Up library, which contains gene sets enriched in specific human tissues. Our analysis revealed significant enrichment of gene signatures associated with human adrenal gland tissue, with both statistically significant p-values and high combined scores, suggesting a close resemblance of Acomys tissue specificity to that of the human adrenal gland (Figure 7). However, when we analyzed the differentially expressed genes in mouse samples, we observed a clear off-target shift toward gene expression signatures of a different tissue (Figure 8).
Orthogonal Validation of RNA-seq Findings by qRT-PCR and CAGE-seq
In order to validate the results of the bulk RNA-seq, two orthogonal approaches were employed: quantitative real-time PCR (qRT-PCR) and cap analysis of gene expression (CAGE).
The qRT-PCR assay confirmed the differential expression of three high-abundance genes—Cyp17a1 and Kiss1 were upregulated, whereas Cyb5a was downregulated in Acomys cahirinus relative to Balb/c mice (Figure 9). For five transcripts (Sult1e1, Hsd3b2, Defb18, Nupl1, and H2-Ke6), qRT-PCR did not reproduce the direction of change detected by RNA-seq, likely owing to isoform-specific primer bias and differences in 5′- versus 3′-end coverage between the two methods. To obtain an independent read-out, we analyzed promoter activity with CAGE-seq, which corroborated the RNA-seq directionality for four of these genes.
A comparative analysis of the CAGE transcriptomes for the adrenal glands of Acomys cahirinus and Balb/c is presented in Supplementary Figure S2. CAGE sequencing further corroborated the transcriptional activity of these genes, demonstrating strong concordance between both methods for the majority of targets (Table 1). However, a notable exception was Nupl1, which exhibited discordant expression patterns between the RNA-seq and CAGE datasets. This discrepancy may be indicative of technical differences in transcript detection or potential post-transcriptional regulation of Nupl1, necessitating further investigation.
These validation experiments serve to enhance the reliability of our transcriptomic findings, while simultaneously underscoring the significance of orthogonal verification in the context of genomic studies.

4. Discussion

This study provides strong evidence for the potential of Acomys cahirinus as a valuable model for human adrenal gland research, offering several advantages over the conventional Mus musculus (Balb/c mouse) model. The findings demonstrate substantial structural and molecular similarities between the adrenal glands of Acomys cahirinus and humans, suggesting that this species may serve as a more relevant preclinical model for studying adrenal pathologies and for the development of targeted therapies.
One of the most striking observations in this study is the presence of a well-defined zona reticularis in the adrenal cortex of Acomys cahirinus, a feature that is absent in Balb/c mice but is a key characteristic of the human adrenal gland. This structural similarity suggests that Acomys cahirinus may more accurately recapitulate the functional organization of the human adrenal gland, potentially leading to more translatable research outcomes in studies of adrenal physiology and pathology.
The differential gene expression analysis revealed several genes involved in androgen synthesis and steroid hormone regulation that were upregulated in Acomys cahirinus compared to Balb/c mice. Notably, the increased expression of Cyp17a1, Sult1e1, and Hsd3b2 in Acomys cahirinus suggests a more active steroidogenic pathway, particularly in androgen production. This finding is particularly relevant for studying androgen-related disorders, such as congenital adrenal hyperplasia or adrenal androgen-producing tumors, where Acomys cahirinus may provide a more accurate representation of human pathophysiology.
The gene ontology enrichment analysis further supports the relevance of Acomys cahirinus as a model for human adrenal function. The identification of pathways associated with ovarian steroidogenesis and steroid hormone biosynthesis as well as cortisol synthesis and secretion in Acomys cahirinus indicates the presence of functionally active metabolic pathways that contribute to the production of cortisol and androgens. This finding is particularly significant, as it suggests that Acomys cahirinus may be a suitable model for studying disorders of cortisol production, such as Cushing’s syndrome or adrenal insufficiency.
Over-representation analysis (BioPlanet-2019) highlighted a single pathway of particular interest—“androgen-receptor regulation of biosynthesis and transcription”. The enrichment of this module indicates that steroidogenic output in Acomys adrenals is coupled to active intra-adrenal androgen-receptor signaling. This finding dovetails with our gene-level data for Cyp17a1, Kiss1, and H2-Ke6, collectively supporting the notion that Acomys cahirinus reproduces human-like androgen regulation within the adrenal cortex.
Interestingly, the decreased expression of Cyb5a in Acomys cahirinus compared to Balb/c mice, along with the potential absence of expression of Sult2a1, suggests that this species may utilize alternative enzymes or metabolic routes for the synthesis and regulation of steroid hormones. This observation opens up new avenues for research into novel steroidogenic pathways and could potentially lead to the discovery of alternative therapeutic targets for adrenal disorders.
GTEx-based tissue-signature enrichment revealed that the Acomys adrenal gene set most closely aligns with the human adrenal cortex, whereas Balb/c DEGs shifted toward brain-associated profiles. This result extends earlier morphologic and single-gene evidence, providing a quantitative, genome-wide indication that Acomys captures human-like adrenal tissue specificity better than the standard mouse model. Such proximity is particularly valuable for preclinical studies where off-target transcriptional programs in Mus musculus—as seen here—might confound drug-response or gene-therapy read-outs. The data therefore strengthen the case for adopting Acomys cahirinus as a complementary model in translational adrenal research, especially for disorders in which precise regulation of human-type steroid networks is critical.
While these findings are promising, it is important to acknowledge the limitations of the study. The relatively small sample size and the focus on sexually mature male mice may limit the generalizability of the results. Future studies should aim to include larger sample sizes and investigate both genders across different developmental stages to provide a more comprehensive understanding of adrenal gland function in Acomys cahirinus.
Additionally, the use of bulk RNA sequencing in this study, while informative, does not capture the full complexity and heterogeneity of adrenal gland cell populations. To address this limitation, future research should incorporate single-cell RNA sequencing techniques, which would provide a more detailed transcriptomic profile of the Acomys adrenal glands and allow for the identification of cell type-specific gene expression patterns.

5. Limitations

This study has several limitations. First, only male animals were included. We chose males to minimize endocrine variability when establishing a cross-species baseline, because female Acomys cahirinus exhibit cyclical ovarian hormone fluctuations that can influence adrenal transcription [32]. Nevertheless, this design limits generalizability across sexes. Second, our analyses rely on bulk RNA-seq and promoter-level CAGE-seq, which do not resolve cell-type-specific programs. Single-cell and spatial transcriptomics will be required to assign zone- and cell-specific signals.

6. Conclusions

This study presents evidence for the potential of Acomys cahirinus as a valuable model for human adrenal gland research. The structural and molecular parallels between Acomys and human adrenal glands, particularly the presence of the zona reticularis and the expression of key steroidogenic genes, suggest that this species may offer significant advantages over conventional mouse models in the study of adrenal physiology and pathology.
Moving forward, it will be crucial to further validate and characterize the Acomys cahirinus model through comprehensive transcriptomic profiling at the single-cell level, as well as performing functional studies to confirm the physiological relevance of the observed gene expression patterns. Additionally, investigating the potential of Acomys cahirinus in modeling specific adrenal disorders, such as congenital adrenal hyperplasia or adrenocortical tumors, could provide valuable insights into disease mechanisms and facilitate the development of novel therapeutic approaches.

Supplementary Materials

The following supporting information can be downloaded at: https://www.mdpi.com/article/10.3390/cells14181431/s1. Table S1. Primer sequences used for RT-qPCR; Table S2. Differentially expressed genes; Figure S1. Volcano plot of all DEGs between Acomys and Balb/c adrenal glands; Figure S2. Comparative analysis of CAGE transcriptomes for adrenal glands of Acomys cahirinus and Balb/c.

Author Contributions

Conceptualization, A.B. (Alina Bilyalova), A.B. (Airat Bilyalov) and N.F.; methodology, A.B. (Alina Bilyalova), D.F., G.G., A.T., O.K., A.B. (Andrey Bydanov), Y.M., M.W., R.D. and D.T.; writing—original draft preparation, A.B. (Alina Bilyalova) and A.B. (Airat Bilyalov); writing—review and editing, A.B. (Airat Bilyalov), O.K., E.S. and O.G.; supervision, M.W., A.K. and O.G. All authors have read and agreed to the published version of the manuscript.

Funding

The project was supported by grant 075-15-2025-487 from the Ministry of Science and Higher Education of the Russian Federation.

Institutional Review Board Statement

This study was conducted in accordance with the local Ethics Committee of Kazan Federal University (protocol No. 40, 9 March 2023).

Informed Consent Statement

Not applicable.

Data Availability Statement

The raw sequence data reported in this paper have been deposited in the Genome Sequence Archive (Genomics, Proteomics & Bioinformatics 2021) in the National Genomics Data Center (Nucleic Acids Res 2022), China National Center for Bioinformation/Beijing Institute of Genomics, Chinese Academy of Sciences (GSA: CRA015798); they are publicly accessible at https://ngdc.cncb.ac.cn/gsa (accessed on 11 September 2025).

Conflicts of Interest

The authors declare no conflicts of interest.

References

  1. Yates, R.; Katugampola, H.; Cavlan, D.; Cogger, K.; Meimaridou, E.; Hughes, C.; Metherell, L.; Guasti, L.; King, P. Adrenocortical development, maintenance, and disease. Curr. Top. Dev. Biol. 2013, 106, 239–312. [Google Scholar] [CrossRef] [PubMed]
  2. El Ghorayeb, N.; Bourdeau, I.; Lacroix, A. Role of ACTH and Other Hormones in the Regulation of Aldosterone Production in Primary Aldosteronism. Front. Endocrinol. 2016, 7, 72. [Google Scholar] [CrossRef]
  3. Hyatt, P.J.; Bhatt, K.; Tait, J.F. Steroid biosynthesis by zona fasciculata and zona reticularis cells purified from the mammalian adrenal cortex. J. Steroid Biochem. 1983, 19, 953–959. [Google Scholar] [CrossRef] [PubMed]
  4. Mostaghel, E.A.; Zhang, A.; Hernandez, S.; Marck, B.T.; Zhang, X.; Tamae, D.; Biehl, H.E.; Tretiakova, M.; Bartlett, J.; Burns, J.; et al. Contribution of Adrenal Glands to Intratumor Androgens and Growth of Castration-Resistant Prostate Cancer. Clin. Cancer Res. 2019, 25, 426–439. [Google Scholar] [CrossRef]
  5. Quinn, T.A.; Ratnayake, U.; Castillo-Melendez, M.; Moritz, K.M.; Dickinson, H.; Walker, D.W. Adrenal steroidogenesis following prenatal dexamethasone exposure in the spiny mouse. J. Endocrinol. 2014, 221, 347–362. [Google Scholar] [CrossRef][Green Version]
  6. Mitani, F. Functional zonation of the rat adrenal cortex: The development and maintenance. Proc. Jpn. Acad. Ser. B Phys. Biol. Sci. 2014, 90, 163–183. [Google Scholar] [CrossRef]
  7. Missaghian, E.; Kempná, P.; Dick, B.; Hirsch, A.; Alikhani-Koupaei, R.; Jégou, B.; Mullis, P.E.; Frey, B.M.; Flück, C.E. Role of DNA methylation in the tissue-specific expression of the CYP17A1 gene for steroidogenesis in rodents. J. Endocrinol. 2009, 202, 99–109. [Google Scholar] [CrossRef]
  8. Keeney, D.S.; Jenkins, C.M.; Waterman, M.R. Developmentally regulated expression of adrenal 17 alpha-hydroxylase cytochrome P450 in the mouse embryo. Endocrinology 1995, 136, 4872–4879. [Google Scholar] [CrossRef]
  9. Maden, M.; Brant, J.O.; Rubiano, A.; Sandoval, A.G.W.; Simmons, C.; Mitchell, R.; Collin-Hooper, H.; Jacobson, J.; Omairi, S.; Patel, K. Perfect chronic skeletal muscle regeneration in adult spiny mice, Acomys cahirinus. Sci. Rep. 2018, 8, 8920. [Google Scholar] [CrossRef]
  10. Seifert, A.W.; Kiama, S.G.; Seifert, M.G.; Goheen, J.R.; Palmer, T.M.; Maden, M. Skin shedding and tissue regeneration in African spiny mice (Acomys). Nature 2012, 489, 561–565. [Google Scholar] [CrossRef] [PubMed]
  11. Jiang, T.X.; Harn, H.I.; Ou, K.L.; Lei, M.; Chuong, C.M. Comparative regenerative biology of spiny (Acomys cahirinus) and laboratory (Mus musculus) mouse skin. Exp. Dermatol. 2019, 28, 442–449. [Google Scholar] [CrossRef]
  12. Okamura, D.M.; Brewer, C.M.; Wakenight, P.; Bahrami, N.; Bernardi, K.; Tran, A.; Olson, J.; Shi, X.; Yeh, S.Y.; Piliponsky, A.; et al. Spiny mice activate unique transcriptional programs after severe kidney injury regenerating organ function without fibrosis. iScience 2021, 24, 103269. [Google Scholar] [CrossRef]
  13. Qi, Y.; Dasa, O.; Maden, M.; Vohra, R.; Batra, A.; Walter, G.; Yarrow, J.F.; Aranda, J.M.; Raizada, M.K.; Pepine, C.J. Functional heart recovery in an adult mammal, the spiny mouse. Int. J. Cardiol. 2021, 338, 196–203. [Google Scholar] [CrossRef] [PubMed]
  14. Quinn, T.A.; Ratnayake, U.; Dickinson, H.; Nguyen, T.H.; McIntosh, M.; Castillo-Melendez, M.; Conley, A.J.; Walker, D.W. Ontogeny of the adrenal gland in the spiny mouse, with particular reference to production of the steroids cortisol and dehydroepiandrosterone. Endocrinology 2013, 154, 1190–1201. [Google Scholar] [CrossRef]
  15. Kim, D.; Paggi, J.M.; Park, C.; Bennett, C.; Salzberg, S.L. Graph-based genome alignment and genotyping with HISAT2 and HISAT-genotype. Nat. Biotechnol. 2019, 37, 907–915. [Google Scholar] [CrossRef]
  16. Anders, S.; Pyl, P.T.; Huber, W. HTSeq—A Python framework to work with high-throughput sequencing data. Bioinformatics 2015, 31, 166–169. [Google Scholar] [CrossRef]
  17. Takahashi, H.; Kato, S.; Murata, M.; Carninci, P. CAGE (cap analysis of gene expression): A protocol for the detection of promoter and transcriptional networks. Methods Mol. Biol. 2012, 786, 181–200. [Google Scholar] [CrossRef] [PubMed]
  18. Kouno, T.; Moody, J.; Kwon, A.T.; Shibayama, Y.; Kato, S.; Huang, Y.; Böttcher, M.; Motakis, E.; Mendez, M.; Severin, J.; et al. C1 CAGE detects transcription start sites and enhancer activity at single-cell resolution. Nat. Commun. 2019, 10, 360. [Google Scholar] [CrossRef] [PubMed]
  19. Forrest, A.R.; Kawaji, H.; Rehli, M.; Baillie, J.K.; de Hoon, M.J.; Haberle, V.; Lassmann, T.; Kulakovskiy, I.V.; Lizio, M.; Itoh, M.; et al. A promoter-level mammalian expression atlas. Nature 2014, 507, 462–470. [Google Scholar] [CrossRef]
  20. Alam, T.; Agrawal, S.; Severin, J.; Young, R.S.; Andersson, R.; Arner, E.; Hasegawa, A.; Lizio, M.; Ramilowski, J.A.; Abugessaisa, I.; et al. Comparative transcriptomics of primary cells in vertebrates. Genome Res. 2020, 30, 951–961. [Google Scholar] [CrossRef]
  21. Rasmussen, M.K.; Ekstrand, B.; Zamaratskaia, G. Regulation of 3β-hydroxysteroid dehydrogenase/Δ54 isomerase: A review. Int. J. Mol. Sci. 2013, 14, 17926–17942. [Google Scholar] [CrossRef]
  22. Chetyrkin, S.V.; Belyaeva, O.V.; Gough, W.H.; Kedishvili, N.Y. Characterization of a novel type of human microsomal 3alpha-hydroxysteroid dehydrogenase: Unique tissue distribution and catalytic properties. J. Biol. Chem. 2001, 276, 22278–22286. [Google Scholar] [CrossRef]
  23. Burris-Hiday, S.D.; Scott, E.E. Steroidogenic cytochrome P450 17A1 structure and function. Mol. Cell. Endocrinol. 2021, 528, 111261. [Google Scholar] [CrossRef]
  24. Yi, M.; Negishi, M.; Lee, S.J. Estrogen Sulfotransferase (SULT1E1): Its Molecular Regulation, Polymorphisms, and Clinical Perspectives. J. Pers. Med. 2021, 11, 194. [Google Scholar] [CrossRef]
  25. Udhane, S.; Kempna, P.; Hofer, G.; Mullis, P.E.; Flück, C.E. Differential regulation of human 3β-hydroxysteroid dehydrogenase type 2 for steroid hormone biosynthesis by starvation and cyclic AMP stimulation: Studies in the human adrenal NCI-H295R cell model. PLoS ONE 2013, 8, e68691. [Google Scholar] [CrossRef] [PubMed]
  26. Jin, H.J.; Kim, J.; Yu, J. Androgen receptor genomic regulation. Transl. Androl. Urol. 2013, 2, 157–177. [Google Scholar] [CrossRef] [PubMed]
  27. Hu, S.G.; Zou, M.; Yao, G.X.; Ma, W.B.; Zhu, Q.L.; Li, X.Q.; Chen, Z.J.; Sun, Y. Androgenic regulation of beta-defensins in the mouse epididymis. Reprod. Biol. Endocrinol. 2014, 12, 76. [Google Scholar] [CrossRef]
  28. Xie, Q.; Kang, Y.; Zhang, C.; Xie, Y.; Wang, C.; Liu, J.; Yu, C.; Zhao, H.; Huang, D. The Role of Kisspeptin in the Control of the Hypothalamic-Pituitary-Gonadal Axis and Reproduction. Front. Endocrinol. 2022, 13, 925206. [Google Scholar] [CrossRef]
  29. Berthon, A.; Settas, N.; Delaney, A.; Giannakou, A.; Demidowich, A.; Faucz, F.R.; Seminara, S.B.; Chen, M.E.; Stratakis, C.A. Kisspeptin deficiency leads to abnormal adrenal glands and excess steroid hormone secretion. Hum. Mol. Genet. 2020, 29, 3443–3450. [Google Scholar] [CrossRef] [PubMed]
  30. Rotinen, M.; Celay, J.; Alonso, M.M.; Arrazola, A.; Encio, I.; Villar, J. Estradiol induces type 8 17beta-hydroxysteroid dehydrogenase expression: Crosstalk between estrogen receptor alpha and C/EBPbeta. J. Endocrinol. 2009, 200, 85–92. [Google Scholar] [CrossRef]
  31. Fomitcheva, J.; Baker, M.E.; Anderson, E.; Lee, G.Y.; Aziz, N. Characterization of Ke 6, a new 17beta-hydroxysteroid dehydrogenase, and its expression in gonadal tissues. J. Biol. Chem. 1998, 273, 22664–22671. [Google Scholar] [CrossRef] [PubMed]
  32. Bellofiore, N.; McKenna, J.; Ellery, S.; Temple-Smith, P. The Spiny Mouse-A Menstruating Rodent to Build a Bridge From Bench to Bedside. Front. Reprod. Health 2021, 3, 784578. [Google Scholar] [CrossRef] [PubMed]
Figure 1. Mallory’s trichrome staining of the structure of the adrenal gland of Acomys cahirinus and Balb/c: 1—medulla; 2—zona reticularis; 3—zona fasciculata; 4—zona glomerulosa. The dashed lines denote the boundary between the zones of the adrenal gland.
Cells 14 01431 g001
Figure 2. Immunohistochemistry staining of the structure of the adrenal gland of Acomys cahirinus and Balb/c. StAR—steroidogenic acute regulatory protein; Th—tyrosine hydroxylase; Hsd3b2-3β—hydroxysteroid dehydrogenase. The black arrow indicates the zona reticularis. The white arrow indicates the layer of cells that separates the medulla from the cortex. Labels: 1—medulla; 2—zona reticularis; 3—zona fasciculata; 4—zona glomerulosa.
Cells 14 01431 g002
Figure 3. Immunofluorescence staining with CYP17A1 (Cytochrome P450 17A1) of Balb/c and Acomys cahirinus adrenal gland: 1—medulla; 2—zona fasciculata; 3—zona glomerulosa; 4—zona reticularis. CYP17A1 (P450) is shown in yellow, and nuclei are counterstained with DAPI (blue).
Cells 14 01431 g003
Figure 4. Expression of Cyp17a1, Sult1e1, Hsd3b2, Defb18, Nupl1, Kiss1, H2-Ke6, and Cyb5a genes in adrenal glands of Acomys cahirinus and Balb/c mice. The results are presented as mean ± SD. Statistical processing method: Unpaired t-test. **** p < 0.0001; *** p < 0.001. n = 3.
Cells 14 01431 g004
Figure 5. KEGG pathway enrichment analysis of differentially expressed genes in adrenal glands of Acomys cahirinus. (A) Cnet plot highlighting enriched pathways, including steroidogenesis. (B) Bar plot of enrichment scores (−log10 FDR) for the top biological pathways and processes, including the KEGG term ovarian steroidogenesis (which features the STAR gene).
Cells 14 01431 g005
Figure 6. BioPlanet 2019 enrichment analysis of Acomys cahirinus adrenal gland DEGs.
Cells 14 01431 g006
Figure 7. GTEx tissue enrichment analysis for upregulated genes in Acomys cahirinus adrenal glands. The dot plot shows samples from the GTEx Tissue Expression Up library ranked by combined enrichment score. Each point represents a GTEx sample annotated by tissue, sex, and age group. The dot size corresponds to the proportion of input DEGs found in the sample’s signature gene set (% Genes in set), and the color intensity reflects the statistical significance as −log10(FDR).
Cells 14 01431 g007
Figure 8. GTEx tissue enrichment analysis for upregulated genes in Mus musculus (Balb/c) adrenal glands. The dot plot shows samples from the GTEx Tissue Expression Up library ranked by combined enrichment score. Each point represents a GTEx sample annotated by tissue, sex, and age group. The dot size corresponds to the proportion of input DEGs found in the sample’s signature gene set (% Genes in set), and the color intensity reflects the statistical significance as −log10(FDR).
Cells 14 01431 g008
Figure 9. Quantitative real-time PCR validation of differential gene expression in adrenal glands of Acomys cahirinus and Balb/c mice. Relative expression levels of Cyp17a1, Kiss1, and Cyb5a genes. n = 5.
Cells 14 01431 g009
Table 1. CAGE sequencing analysis of adrenal gland transcriptional activity in Acomys cahirinus and Balb/c mice.
GeneBalb/cAcomys cahirinusDE
Cyp17a1Not expressedActive -
Sult1e1Not expressedActive -
Hsd3b2Not expressedActive -
Defb18Not expressedActive -
Nupl1ActiveActiven/s (p-value > 0,08)
Kiss1Not expressedActive -
H2-Ke6ActiveActiveAcomys > Balb/c 1.8 times;
p = 2.6 × 10⁻¹⁰
Cyb5aActiveActiveAcomys < Balb/c 2.7 times; \
p = 7.7 × 10⁻⁹
Disclaimer/Publisher’s Note: The statements, opinions and data contained in all publications are solely those of the individual author(s) and contributor(s) and not of MDPI and/or the editor(s). MDPI and/or the editor(s) disclaim responsibility for any injury to people or property resulting from any ideas, methods, instructions or products referred to in the content.