Article

Gene Expression Analysis of HPRT-Deficient Cells Maintained with Physiological Levels of Folic Acid

by
Rosa J. Torres
1,2,*,
Gerard Valentines-Casas
3,4,
Claudia Cano-Estrada
3,4,
Neus Ontiveros
3,4 and
José M. López
3,4
1
Department of Biochemistry, Hospital La Paz Institute for Health Research (IdiPaz), 28046 Madrid, Spain
2
Center for Biomedical Network Research on Rare Diseases (CIBERER), ISCIII, 28006 Madrid, Spain
3
Institut de Neurociències, Universitat Autònoma de Barcelona, 08193 Cerdanyola del Vallès, Barcelona, Spain
4
Unitat de Bioquímica, Departament de Bioquímica i Biologia Molecular, Facultat de Medicina, Universitat Autònoma de Barcelona, 08193 Cerdanyola del Vallès, Barcelona, Spain
*
Author to whom correspondence should be addressed.
Cells 2025, 14(14), 1105; https://doi.org/10.3390/cells14141105
Submission received: 3 June 2025 / Revised: 15 July 2025 / Accepted: 15 July 2025 / Published: 18 July 2025

Abstract

Lesch–Nyhan disease (LND) is associated with a complete deficiency of hypoxanthine-guanine phosphoribosyltransferase (HPRT) activity due to mutations in the HPRT1 gene. Although the physiopathology of LND-related neurological manifestations remains unknown, a defective neuronal developmental process is the most widely accepted hypothesis. We generated an HPRT-deficient line from the pluripotent human embryonic cell line NT2/D1 by CRISPR-Cas9 and induced its differentiation along neuroectodermal lineages by retinoic acid treatment. As levels of folic acid in the culture media may affect results in LND models, we employed physiological levels of folate. The effect of HPRT deficiency on neural development-related gene expression was evaluated using two methodological approaches: a directed qPCR array of genes related to neuronal differentiation, and global gene expression by RNAseq. HPRT-deficient pluripotent cells presented altered expression of genes related to pluripotency in human embryonic stem cells, such as DPPA3 and CFAP95, along with genes of the homeobox gene family. HPRT-deficient pluripotent cells were able to differentiate along neuro-ectodermal lineages but presented consistent dysregulation of several genes from the homeobox gene family, including EN1 and LMX1A. GO enrichment analysis of up- and downregulated genes in HPRT-deficient cells showed that the most significant biological processes affected are related to development and nervous system development.

1. Introduction

Lesch–Nyhan syndrome (OMIM 300322) or Lesch–Nyhan disease (LND) is an inborn error of purine metabolism characterized by hyperuricemia and hyperuricosuria, severe action dystonia, choreoathetosis, ballismus, macrocytosis, cognitive and attention deficit, and aggressive and self-injurious behavior [1,2]. The disease is associated with a complete deficiency of hypoxanthine-guanine phosphoribosyltransferase (HPRT) activity due to mutations in the HPRT1 gene [3]. This gene is located in the long arm of the X chromosome, and HPRT deficiency is inherited as a recessive X-linked trait, thus meaning that males are affected and women are generally asymptomatic carriers [4]. Less-severe clinical presentations are suspected to be due to partial enzyme deficiency [5]. It is considered that a continuous spectrum of neurological involvement is present in HPRT-deficient patients, and the term Lesch–Nyhan attenuated variants (LNV) has been introduced to include patients with HPRT-related gout and variable degrees of neurological involvement but without the complete LND phenotype [6].
HPRT catalyzes the salvage synthesis of inosine monophosphate (IMP) and guanosine monophosphate (GMP) from the purine bases hypoxanthine and guanine, respectively, using 5′-phosphoribosyl-1-pyrophosphate (PRPP) as a co-substrate. HPRT deficiency results in the accumulation of its substrates, hypoxanthine, guanine, and PRPP. Hypoxanthine is converted into uric acid by means of xanthine oxidase, and the de novo purine synthesis is increased due to a greater availability of PRPP for PRPP amidotransferase, the rate-limiting enzyme in the pathway, as well as the decrease in IMP and GMP, which are PRPP amidotransferase feedback inhibitors. This dual mechanism results in hugely increased uric acid production [7]. Uric acid overproduction is present in all HPRT-deficient patients, and its severity is not related to the grade of enzymatic deficit. Without treatment, it is manifested as renal lithiasis and gout. Acute renal failure, due to obstructive lithiasis, may be the first sign of the disease. Arthritis due to urate monosodium deposition and tophi may develop later, although nowadays they are rare due to early treatment. Prior studies have demonstrated the transfer of purines through the hematoencephalic barrier, and, as a consequence of HPRT deficiency, there are increased levels of both hypoxanthine and 5-aminoimidazole-4-carboxamide riboside (AICAr) in the cerebrospinal fluid and urine of LND patients [8]. AICAr is a nucleoside derived from AICAR, also known as ZMP, an intermediate of the de novo purine biosynthetic pathway. Toxic effects of these metabolites have been postulated in the pathogenesis of neurological dysfunction [9,10]. However, the connection between aberrant purine metabolism and the neurological, hematological, and behavioral characteristics of the disease remains unknown. Studies with positron-emission tomography and ligands that bind to dopamine-related proteins suggest an alteration of the dopaminergic system in LND patients [11,12]. Furthermore, dopamine deficiency in the striatum has also been confirmed in knockdown mouse models of HPRT deficiency, although these models do not reproduce the manifestations of human disease [13]. Recently, it has been described that HPRT1 knockout mice have neurodevelopmental alterations during embryogenesis, affecting the proliferation and migration of midbrain dopaminergic neurons [14]. Although conventional imaging studies and post-mortem examination of brains from LND patients have not revealed any characteristic morphological abnormality, a reduction of about 20% in intracranial and brain volumes has been found in LND patients by voxel-based morphometry [15]. Moreover, although clinical data suggest a basal ganglia alteration, brain volume abnormalities in grey and white matter in LND are not restricted to the basal ganglia, showing that the effects of HPRT deficiency are probably not limited to the nigrostriatal dopamine pathways [15,16]. The most widely accepted hypothesis at this time is that a defective neuronal developmental process is implicated in LND-related neurological manifestations, rather than having a degenerative cause. As animal models have failed to reproduce human disease, several culture models, using human or mouse cells, have been employed to study neuronal development in HPRT deficiency. These models include induced pluripotent stem cells (iPSCs) derived from fibroblasts from LND patients, neural stem cells (NSCs) prepared from iPSC cells, and NSCs obtained from LND fetuses, among other cellular models [17,18,19,20,21]. A pioneering study [22] indicated that HPRT could regulate the early developmental program of dopamine neurons, and, subsequently, other studies confirmed that HPRT-deficient cells presented some alterations in transcription factors related to neural development [23,24,25]. However, although a decrease in average neurite length has been detected in human [20,23] and mouse [26,27] cell models, other studies showed no obvious differences in morphological appearances [17,18,19,28] or overall growth rates in NSCs HPRT-deficient cells. In summary, although some abnormalities have been detected in the early neural development stage, certain discrepancies have been observed that could be due to the different cellular models and culture media used.
We have previously found that purine alterations in LND fibroblasts depend significantly on the level of folic acid in the culture medium [8,29]. In humans, the de novo purine synthesis requires N10-formyltetrahydrofolate as a cofactor. In HPRT deficiency, there is a significant acceleration of the de novo purine biosynthetic pathway, and under these circumstances, physiological folate levels may become limiting, inducing the accumulation of ZMP in LND fibroblasts [8,29].
In light of the above, the aim of this study was to evaluate the effect of HPRT deficiency on the expression of genes related to neural development using a proper cell model cultured at physiological levels of folic acid. NT2/D1 is a pluripotent human testicular embryonal carcinoma cell line that differentiates along neuro-ectodermal lineages after exposure to retinoic acid (RA) [30,31] and is a widely accepted model for the study of neuronal differentiation. To evaluate the effect of HPRT deficiency on the expression of genes related to neural development, we employed two methodologies: Real-time quantitative PCR of selected genes related to neuronal differentiation and differential global gene expression by RNAseq analysis.

2. Materials and Methods

2.1. Generation of Pluripotent HPRT-Deficient Cells

We employed the pluripotent human embryonic cell line NTERA-2 cl.D1 (NT2/D1) (American Type Culture Collection [ATCC] ® CRL1973™, Manassas, VA, USA), a pluripotent human testicular embryonal carcinoma cell line. We obtained a pool of NT2/D1 CRISPR-Cas9 HPRT1 gene-edited cells from Synthego (Synthego Corporation, Redwood City, CA, USA) with at least a 50% HPRT1 gene knockout. This pool contains a heterogeneous mix of cells, some unedited and some with different genetic alterations at the HPRT1 targeted locus. In order to produce a cell line with complete HPRT1 knockout, CRISPR-Cas9 edited cells were cultured in regular medium (see composition below) containing 30 µM 6-thioguanine, which is a guanine analogue that is readily converted to thioguanine monophosphate (TGMP) by HPRT. High levels of TGMP and its nucleotide triphosphates TGTP and dTGTP are toxic to cells, and, therefore, HPRT-deficient cells are positively selected against wild-type cells.

2.2. Cell Culture Medium and Differentiation of NT2/D1

Both wild-type and 6-thioguanine-resistant HPRT-deficient NT2/D1 cells were maintained in Dulbecco’s modified Eagle’s medium (DMEM) without folic acid (D2429, Sigma-Aldrich, Saint Louis, MO, USA) supplemented with 9062 nM folic acid (regular medium) or 50 nM folic acid (physiological conditions), sodium bicarbonate 1.5 g/L, D-glucose 4.5 g/L, and L-glutamine 2 mM, and 10% (v/v) fetal bovine serum (FBS) (ATCC, Manassas, VA, USA.),) and incubated at 37 °C in a humid atmosphere of 5% CO2. For gene expression experiments, cells were maintained with physiological levels of folic acid (50 nM) for at least one week and dislodged from the flask by trypsine-EDTA (Sigma-Aldrich, Saint Louis, MO, USA) treatment, aspirated, and centrifuged at 250 g into pellets. The cell pellet was washed in PBS (Gibco), and total RNA isolated using the PureLink RNA kit (Ambion, Austin, TX, USA). For retinoic acid (RA)-induced differentiation, 10 μM RA (R2625, Sigma-Aldrich, Saint Louis, MO, USA) was added to the culture medium containing 50 nM folic acid, and the cells were maintained for 4 weeks, as described by Pleasure et al. [30]. The culture medium was changed three times a week, and at the end of the four-week period, total RNA was isolated as described previously.

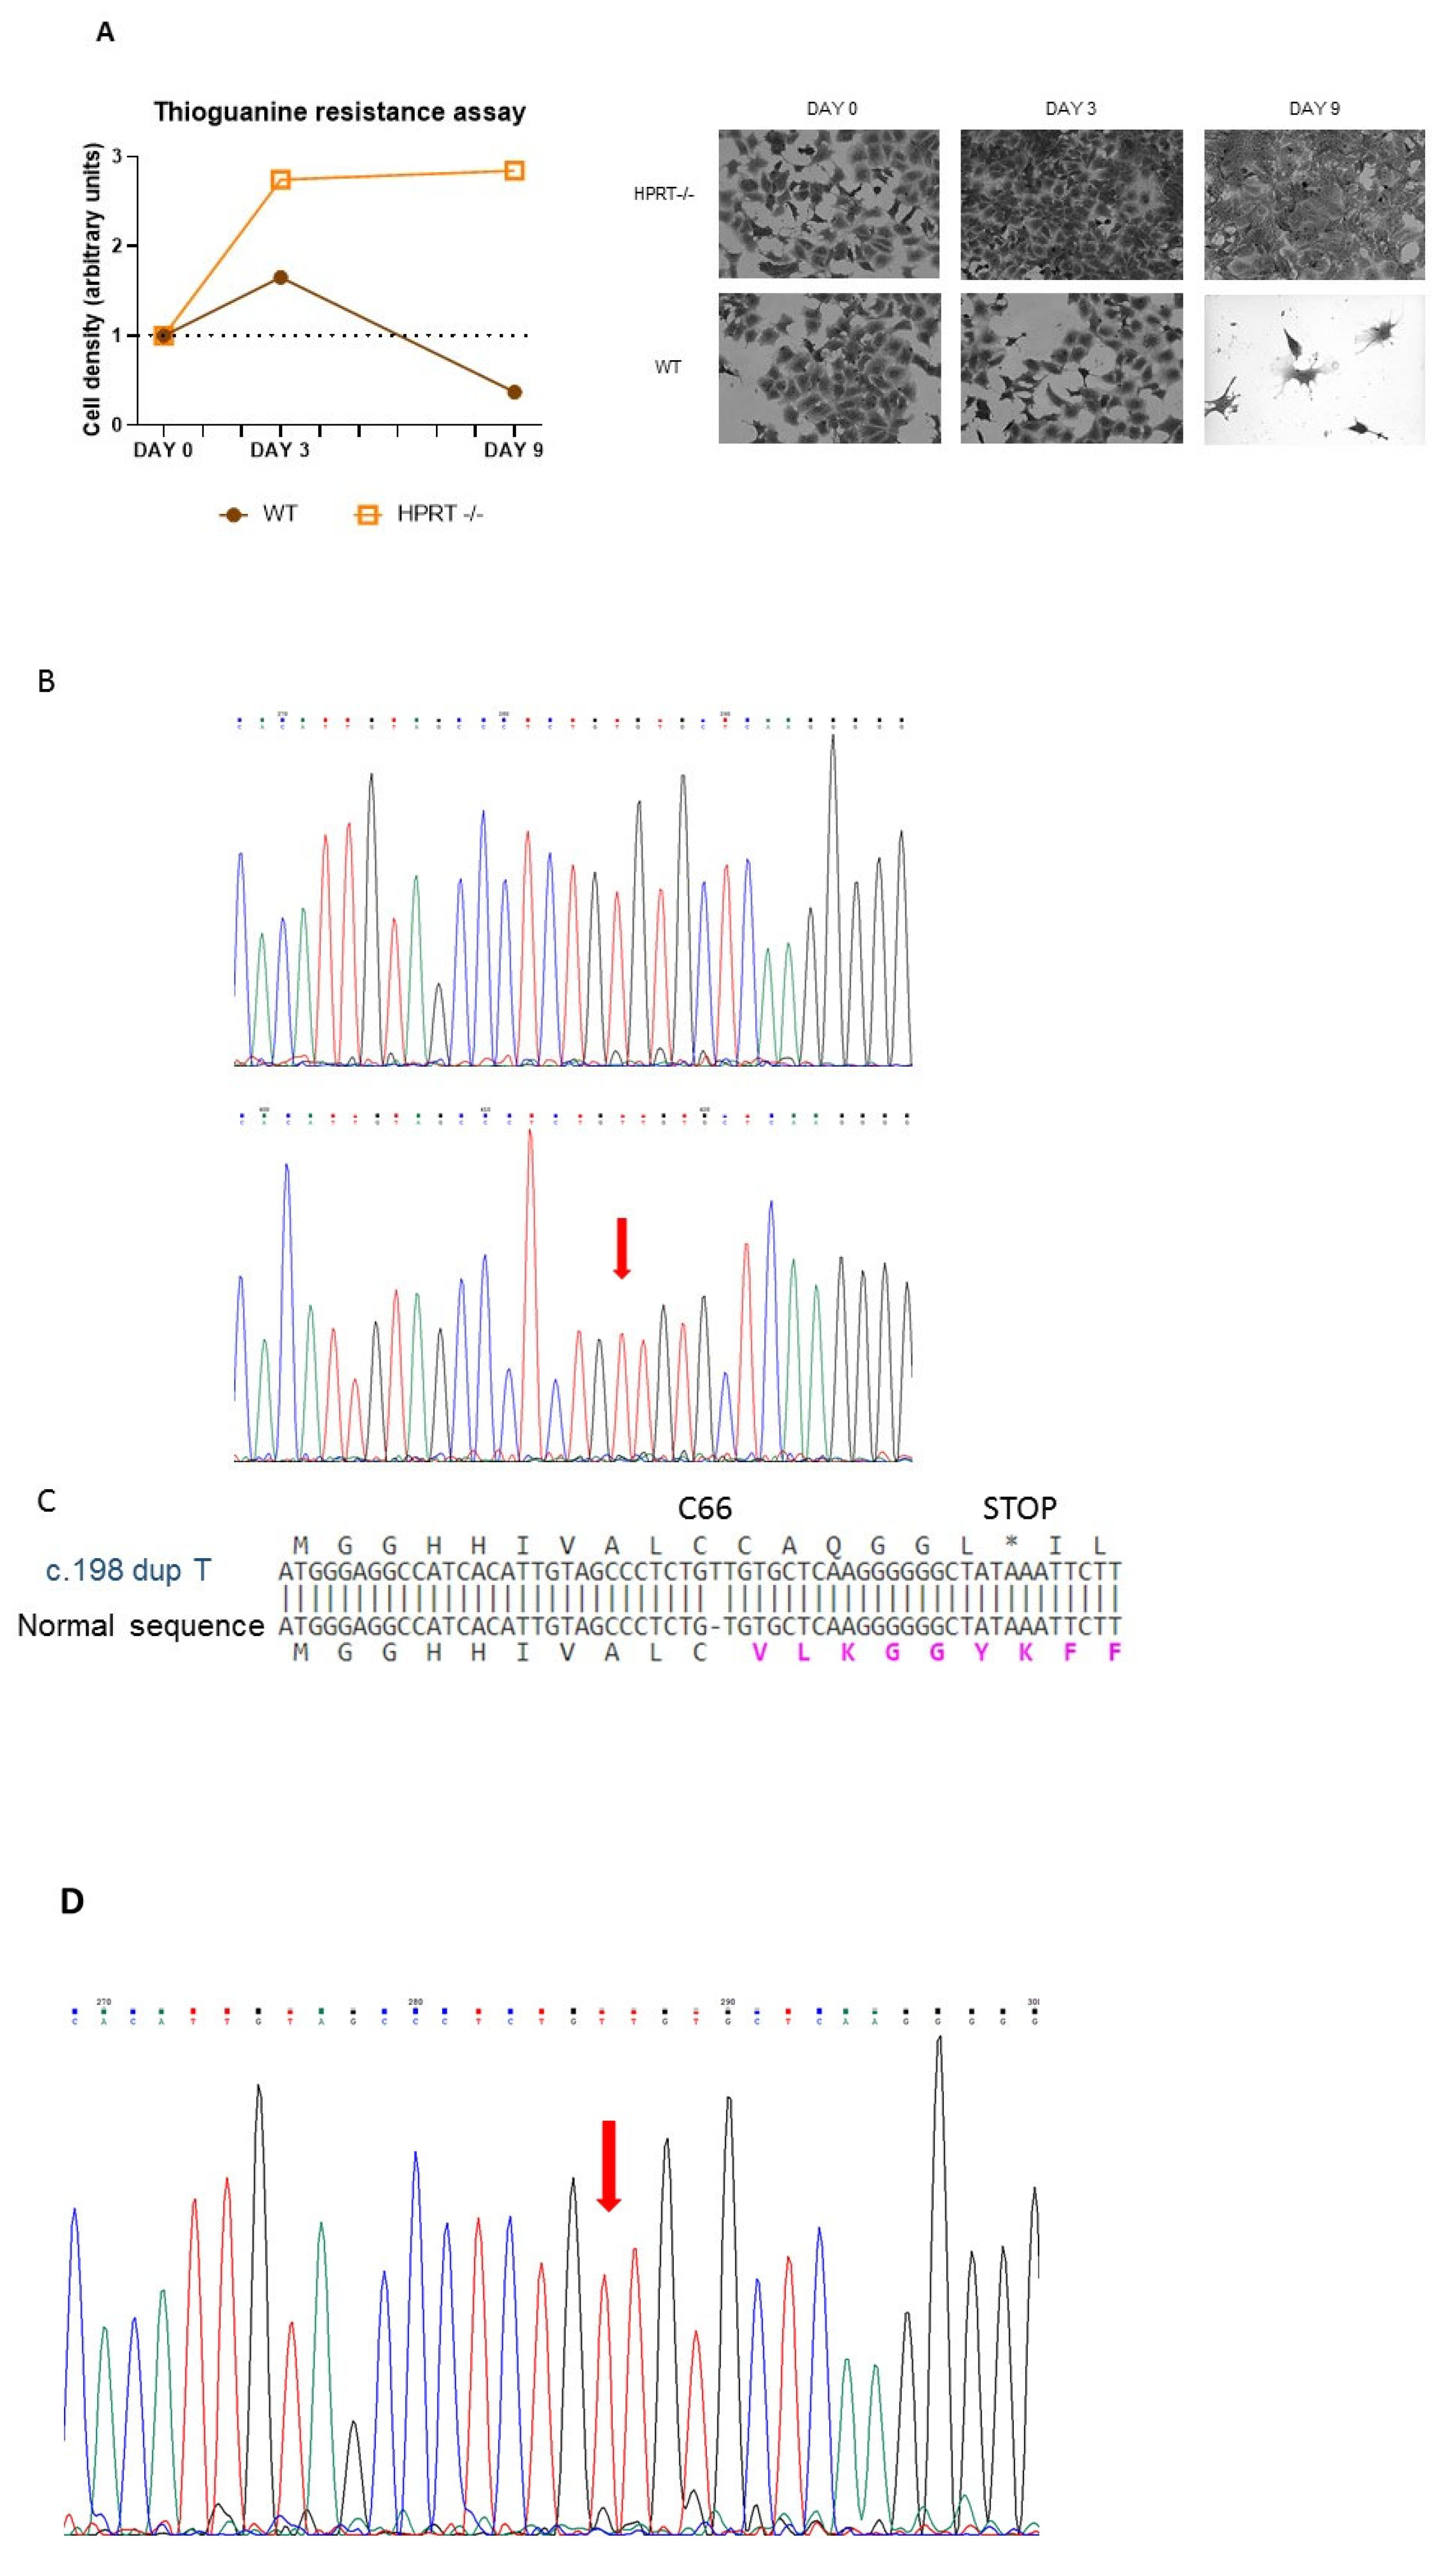
2.3. 6-Thioguanine Toxicity Assay

CRISPR-Cas9 HPRT1 gene-edited cells were cultured in DMEM regular medium (described above) containing 9062 nM folic acid and 30 µM 6-thioguanine for 10 days. On days 0, 3, and 9, cells were fixed with 4% paraformaldehyde and stained with crystal violet. Images were taken from fixed cells at 20× magnification using the EVOS Floid Imaging System (Thermo Fisher, 4471136, Waltham, MA, USA). After washing four times with PBS, cells were dried and dissolved in methanol to measure absorbance at 570 nm.

2.4. DNA Sequencing

DNA and total RNA were obtained from wild-type and 6-thioguanine-resistant cells. HPRT1 gene exons were amplified by PCR and sequenced [32].

2.5. HPRT1 Expression Levels and HPRT Activity

For quantification of HPRT1 mRNA, 1 μg of total RNA was reverse-transcribed into a first-strand cDNA template using ImProm-II™ Reverse Transcriptase (Promega, Madison, WI, USA). HPRT1 mRNA levels were determined by real-time PCR employing the β-Actin (ACTB) housekeeping gene for normalization purposes, as described previously [32]. HPRT activity was determined in cell lysates as described by Rylance et al. [33].

2.6. Hypoxanthine and Xanthine Determination

Medium from confluent cultures was obtained to measure hypoxanthine and xanthine concentration by the HPLC method, as described previously [34]. Total protein concentration in the cell lysate was measured with Coomassie Protein Assay Reagent (Thermo Scientific, Waltham, MA, USA).

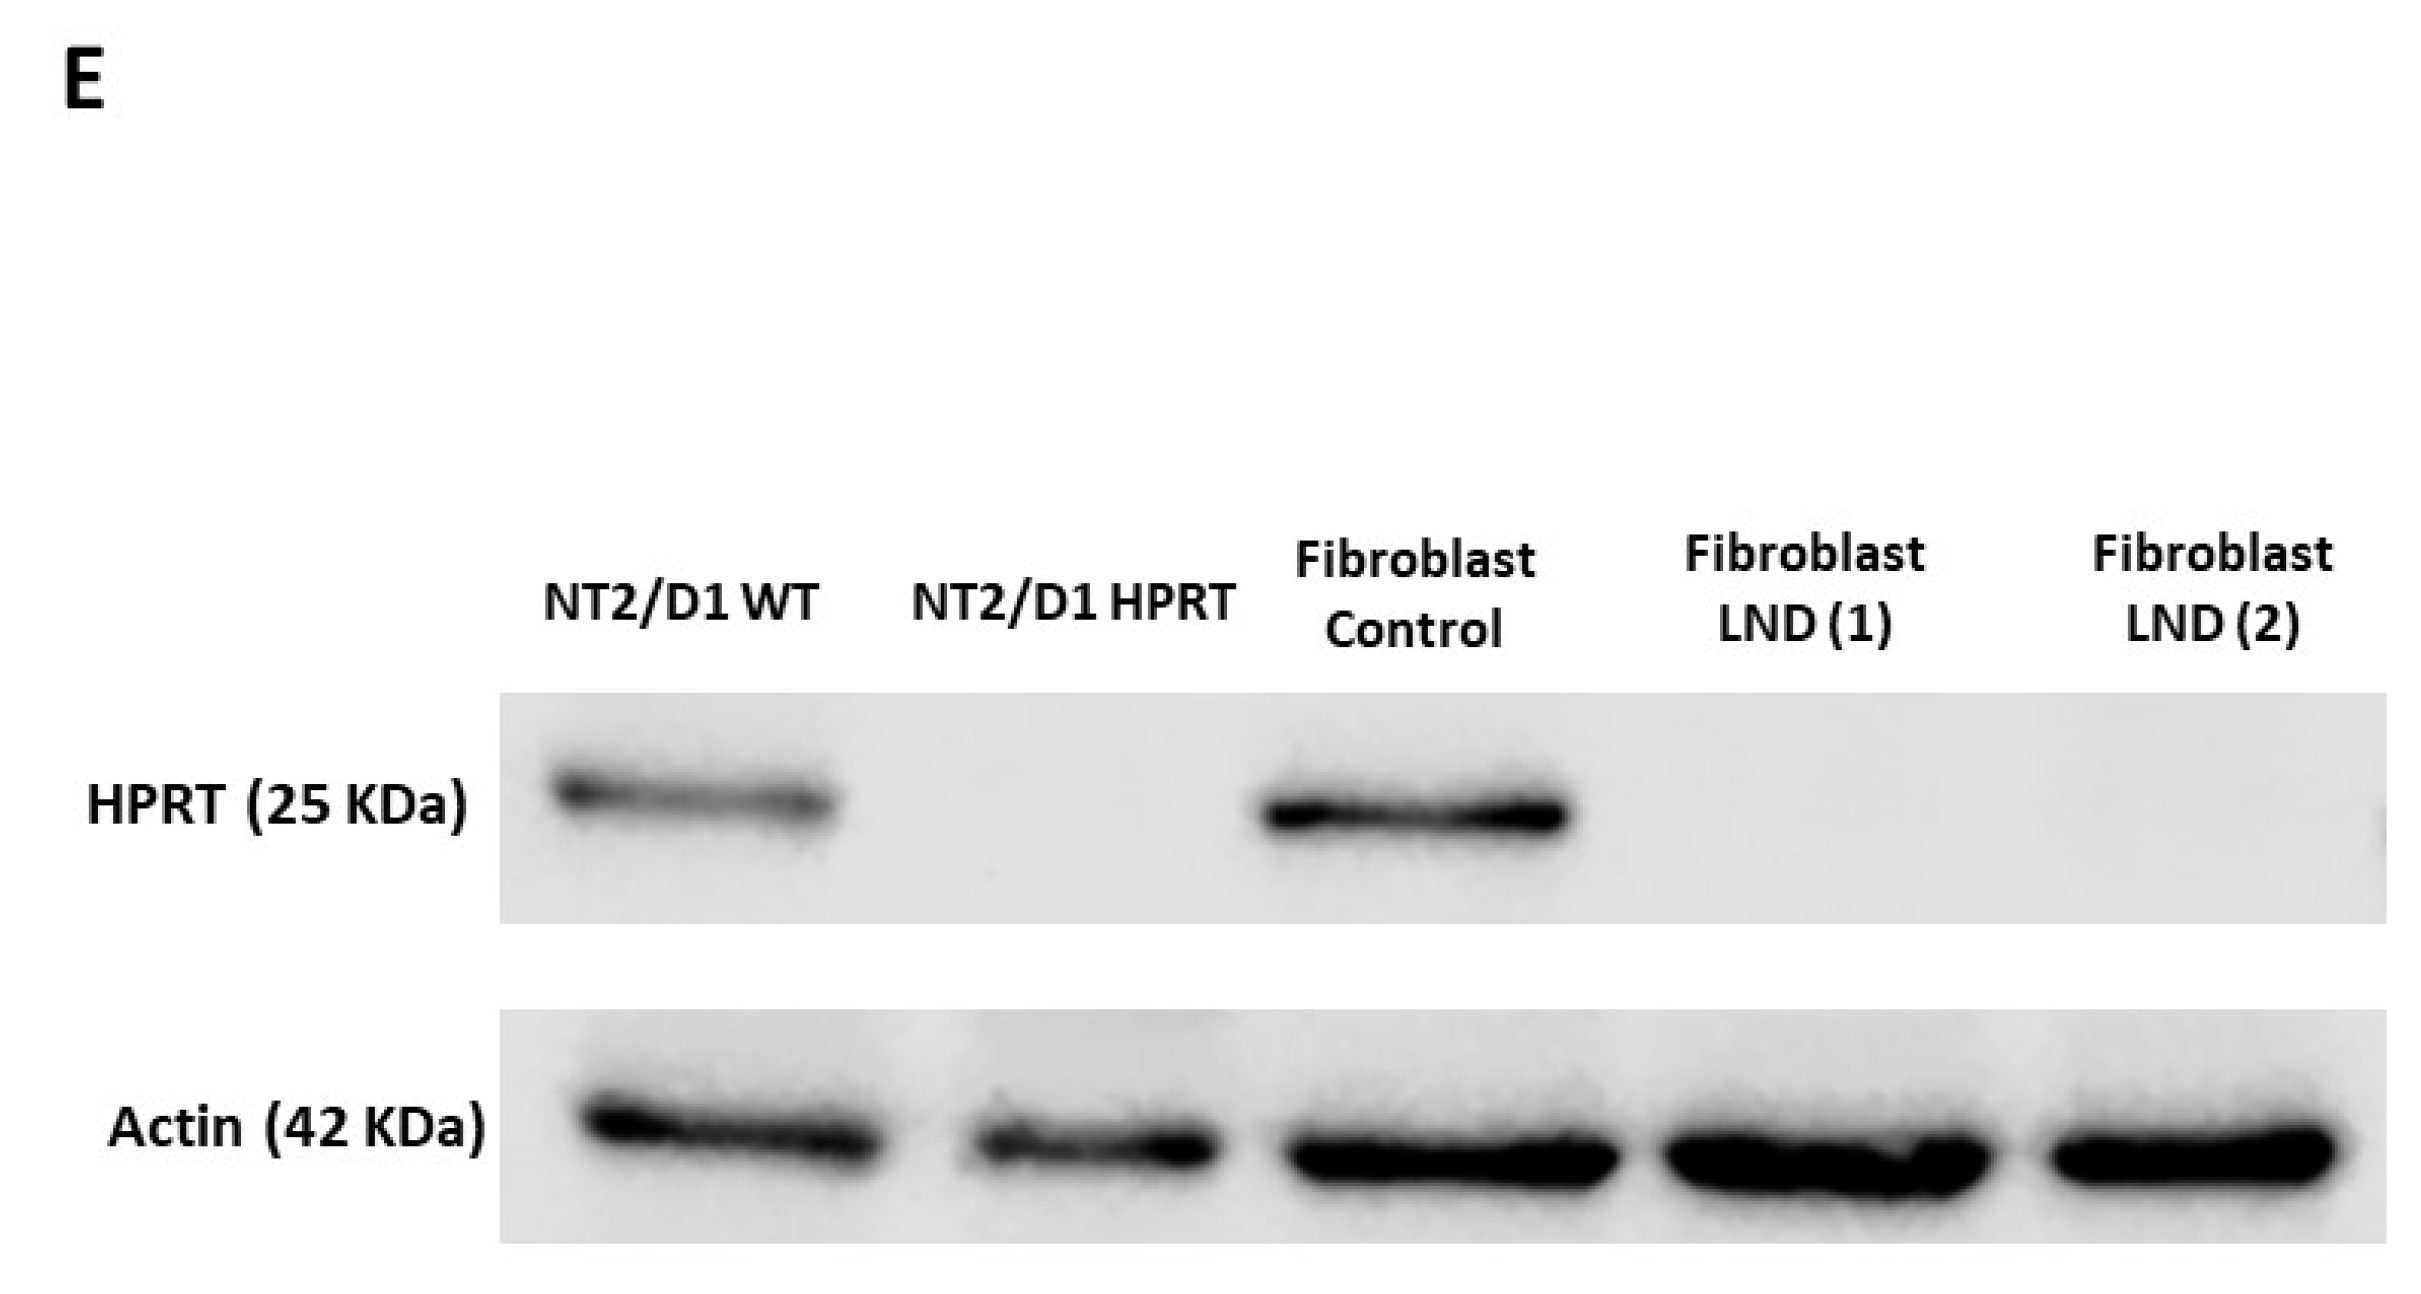
2.7. Western Blotting

Total cell lysate was obtained by the addition of 250 µL lysis buffer A (50 mM Tris, 2% SDS, pH 6.8) to one 100 mm dish of cultured cells and heating at 100 °C for 5 min. The samples collected (50 µg protein) were denatured in Laemmli sample buffer at 100 °C for 5 min. Electrophoretic separation was performed on a 10% polyacrylamide gel, and proteins were transferred to a PVDF membrane in transfer buffer (25 mM Tris, 192 mM glycine, 10% methanol) at 90 V for 90 min. After transfer, the membrane was washed with TBST (25 mM Tris, 135 mM NaCl, pH 7.5 and 0.1% Tween20) and blocked for 60 min with 5% dried skimmed milk in TBST, washed several times with TBST, and then incubated overnight at 4 °C with primary antibodies for HPRT (Santa Cruz, Dallas, TX, USA, sc-376938; 1:1000), and β-actin (Sigma-Aldrich, Saint Louis, MO, USA, A1978; 1:500), diluted in TBST containing 5% BSA (Sigma-Aldrich, Saint Louis, MO, USA, A9647). Antibody binding was detected the next morning by washing the membrane with TBST several times and incubating for 1 h at room temperature with horseradish peroxidase-coupled (HRP) secondary antibody (anti-rabbit HRP from Invitrogen, Carlsbad, CA, USA, 31460; or anti-mouse HRP from BD Bioscience, San Jose, CA, USA, 554002) diluted 1:3.000 in TBST containing 5% dried skimmed milk. The membrane was washed several times with TBST, and the signal was detected by chemiluminescence in a Biorad Chemidoc (Bio-rad, Hercules, CA, USA).

2.8. Real-Time Quantitative PCR Array of Selected Genes Related to Neuronal Differentiation in HPRT-Deficient and Wild-Type NTD2/D1 Cells

Through a search of recent literature describing gene expression changes during neuronal differentiation, we selected a total of 42 genes related to neuronal differentiation, including Wnt/β-catenin, transforming growth factor beta (TGFβ), and sonic hedgehog (SHH) pathways, to design a qPCR array. The qPCR panel also includes the HPRT1 gene and four housekeeping genes for normalization purposes (Supplementary Table S1). To quantify gene expression of selected genes, 1 μg of total RNA was reverse-transcribed into a first-strand cDNA template using ImProm-II™ Reverse Transcriptase (Promega, Madison, WI, USA). Real-time PCR was performed employing a designed qPCR array in a Roche LightCycler 480 system using Perfect Probe SYBR Green PCR Master Mix (AnyGene®, Paris, France) with reverse transcription cDNA diluted to 1/12 as a template. An adequate intron-spanning PCR assay was designed for all genes, and lyophilized primers were obtained in a 96-plate format (SignArrays® 96 plates, AnyGene®, Paris, France). Expression was quantified in a Roche LightCycler (Roche Diagnostic GmbH, Mannheim, Germany) using a relative quantification method. The expression variation (EV) analysis, based on the “delta delta Cp” (ΔΔCp) calculation method, allows a comparison between different experimental conditions, after normalizing the gene expression results with the selected reference genes (ACTB, RPLPO, GUSB, and TBP). A Student’s t-test for 2(−ΔΔCp) values was performed comparing the experimental condition and the control sample, and values with a cutoff EV ≥ 2.0 and p < 0.05 were considered significant.

2.9. Differential Global Gene Expression by RNAseq in HPRT-Deficient and Wild-Type NTD2/D1 Cells

RNAseq analyses were performed by Arraystar Inc. Briefly, mRNA was isolated from 1 to 2 µg total RNA using oligo-(dT) magnetic beads (NEBNext® Poly(A) mRNA Magnetic Isolation Module), followed by RNA-seq library preparation using KAPA Stranded RNA-Seq Library Prep Kit (Roche Diagnostic GmbH, Mannheim, Germany). The completed libraries were qualified using an Agilent 2100 Bioanalyzer and quantified by the absolute quantification qPCR method. For sequencing, the barcoded libraries were mixed, denatured to single-stranded DNA in NaOH, captured on an Illumina flow cell, amplified in situ, and subsequently sequenced for 150 cycles for both ends on the Illumina NovaSeq 6000 instrument. Image analysis and base calling were performed using the Solexa pipeline v1.8 (Off-Line Base Caller software, v1.8). Sequence quality was examined using the FastQC v1.0.0 software [35]. The trimmed reads [36] were aligned to the reference genome using Hisat2 v2.0.4 software [37]. The transcript abundances for each sample were estimated using String Tie [38,39]. The fragments per kilo base of transcript per million mapped reads (FPKM) values for gene and transcript level were calculated using the R package Ballgown v2.6.0 [40]. Differentially expressed gene analyses were performed with the R package Ballgown v2.6.0. Log2 of the fold-change (Log2FC) was calculated by HPRT-deficient FPKM—wild-type FPKM. Fold-Change is calculated as 2^(log2FC). A Fisher’s exact test was used to estimate the statistical significance between the two groups (HPRT-deficient and wild-type). The differentially expressed genes were filtered using a fold-change cutoff ≥ 1.5 or ≤0.66, and p value ≤ 0.05.

2.10. Gene Ontology Analysis

Gene Ontology (GO) describes genes, gene products, and their attributes using a unified and controlled vocabulary (GO terms) across all species [41,42]. The GO annotations included defined terms that describe the pathways and larger processes to which that gene product’s activity contributes, known as the Biological Process (BP). We use the PANTHER Bioinformatics tool for the GO enrichment analysis to investigate whether specific BP GO terms are more likely to be associated with the differentially expressed genes in undifferentiated or differentiated HPRT-deficient cells compared with wild-type cells [43]. For each BP GO term, we analyzed the number of differentially expressed genes associated with the term (count) and the number of background population genes associated with the term (size). The total number of differentially expressed genes (Num Int) and the total number of background population genes (Num Total) were also obtained. The fold enrichment value of the term equals (Count/Size)/(num Int/num Total). The Mann–Whitney test was used to estimate the statistical significance of enrichment of terms between the two groups. The p-value denotes the significance of BP GO term enrichment in the differentially expressed gene list, and we selected a p value ≤ 0.05.

3. Results

3.1. Generation of Pluripotent HPRT-Deficient Cells

We generated an HPRT-deficient line from the pluripotent human embryonic cell line NT2/D1 by knocking out the HPRT1 gene using gene editing by CRISPR-Cas9 with AGCCCCCCUUGAGCACACAG as a guide sequence and AGG as the PAM. This guide sequence matches nucleotides c.195–214 of the HPRT1 coding sequence (NM_000194.2). The modified cells were selected by culture with 6-thioguanine 30 μM for several weeks. Figure 1A shows how wild-type and 6-thioguanine-resistant cells grow for 10 days in regular DMEM containing 30 µM 6-thioguanine. Wild-type cells died due to their inability to survive in this medium, while most of the edited cells survived and proliferated. In sequenced DNA obtained from 6-thioguanine-resistant HPRT-deficient edited cells, a duplication of thymine in exon 3 of the HPRT1 gene after position c.198 (NM_000194.2) (c.198dupT; p.Val67CysfsTer7) was observed (Figure 1B). This duplication alters the reading frame after C66 and results in a stop codon at position 73 in the HPRT1 transcript (Figure 1C). In the cell lysate obtained from 6-thioguanine-resistant HPRT-deficient edited cells, HPRT activity was undetectable (<0.01 nmol/h/mg protein; n = 6), whereas in wild-type cells it was 217 ± 58 nmol/h/mg protein (n = 6). Adenine phosphoribosyltransferase (APRT) activity, simultaneously assayed, was significantly higher in HPRT-deficient cells as described in other HPRT deficient cell types (609 ± 163 nmol/h/mg protein in HPRT-deficient cells vs. 369 ± 117 nmol/h/mg protein in wild-type cells; p = 0.0149, n = 6) Moreover, in the culture medium we found a significantly higher excretion of hypoxanthine in HPRT-deficient cells (252.3 ± 18.6 nmol/mg protein) compared to wild-type cells (21.7 ± 18.6 nmol/mg protein; p = 0.0019, n = 6) and xanthine (164.3 ± 89.4 nmol/mg protein vs 59.6 ± 26.2 nmol/mg protein; p = 0.0203, n = 6). RNA was obtained from wild-type and 6-thioguanine-resistant HPRT-deficient edited cells and reverse transcribed. HPRT1 cDNA was amplified by PCR and sequenced, and the c.198dupT duplication was found in the cDNA sequence of 6-thioguanine-resistant HPRT-deficient edited cells (Figure 1D). HPRT1 mRNA expression, measured as HPRT1/ACTB ratio, was significantly decreased in 6-thioguanine-resistant HPRT-deficient edited cells compared with wild-type cells (0.025 ± 0.002 vs 0.233 ± 0.036; p < 0.001, n = 6). As shown in Figure 1E, HPRT-deficient edited cells do not express HPRT protein, similarly to human fibroblasts obtained from LND patients. Taken together, these results support the suitability of the model for studying LND.

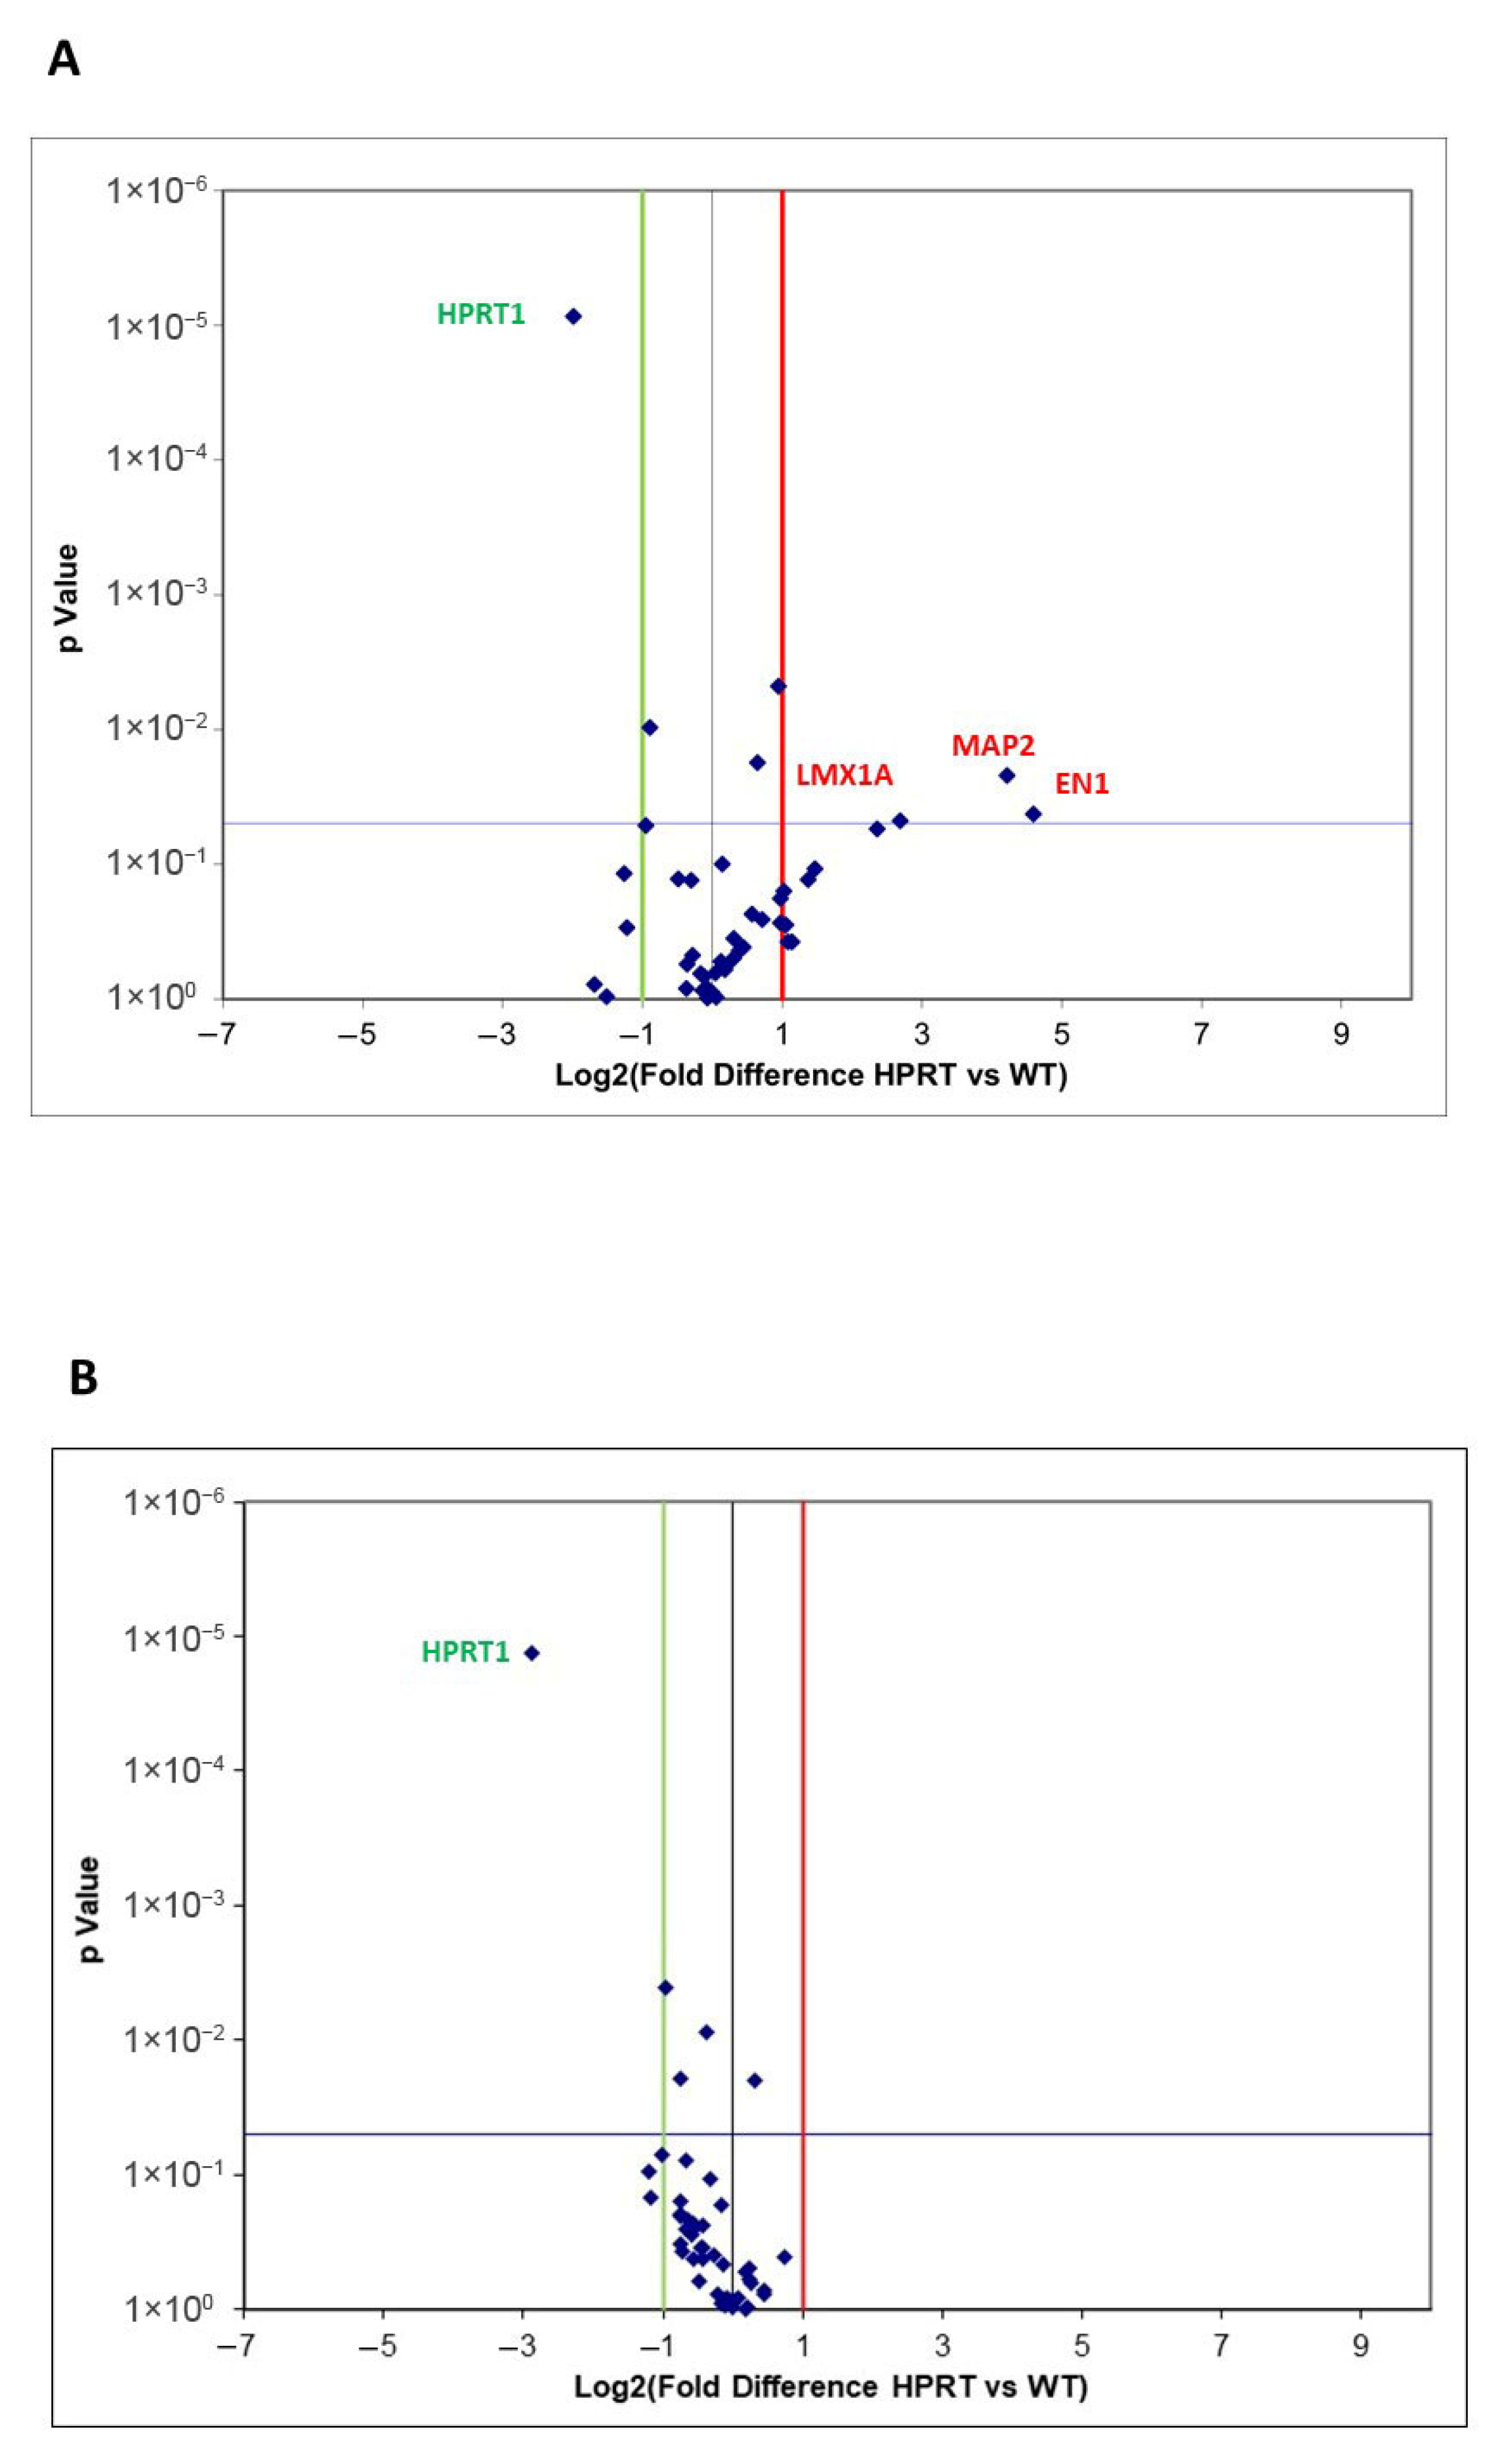
3.2. Real-Time Quantitative PCR Array of Selected Genes Related to Neuronal Differentiation

We analyzed by qPCR the expression of 42 genes: 37 genes related to neural differentiation selected from the literature published on the subject, the HPRT1 gene, and 4 housekeeping genes for normalization (Supplementary Table S1). Total RNA was isolated from three wild-type and three HPRT-deficient cell cultures and analyzed by qPCR, as described in the Materials and Methods Section.

3.2.1. Wild-Type Versus HPRT-Deficient Cells

Differentially expressed genes in HPRT-deficient versus wild-type cells are presented as a Volcano Plot in Figure 2A. EV values ≤ −2.0 are represented by a green line (decreased expression) and EV values ≥ 2.0 by a red line (increased expression), and a p value < 0.05 (considered significant) is represented as a blue line. Individual values of EV and p values for each analyzed gene are presented in Supplementary Table S2. As expected, we found a significantly decreased expression of HPRT1 in HPRT-deficient cells compared with wild-type cells (EV −3.96, p = 0.0001). A significantly higher expression of engrailed homeobox 1 (EN1; EV 24.21, p 0.042), microtubule-associated protein 2 (MAP2; EV 18.5, p 0.022), and LIM homeobox transcription factor 1 alpha (LMX1A; EV 6.43, p 0.048) was observed in HPRT-deficient cells compared to wild-type cells.

3.2.2. Differentiated Wild-Type Versus Differentiated HPRT-Deficient Cells

Gene expression results are presented as a Volcano Plot of differentially expressed genes in RA-differentiated HPRT-deficient versus wild-type cells (Figure 2B). EV values ≤ −2.0 are represented by a green line (decreased expression) and EV values ≥ 2.0 by a red line (increased expression), and a p value < 0.05 (considered significant) as a blue line. Only a significantly decreased expression of HPRT1 was found in HPRT-deficient cells compared to wild-type cells (EV −7.36, p < 0.0001). Individual EV and p values for each analyzed gene are presented in Supplementary Table S2.

3.3. Differential Global Gene Expression by RNAseq

3.3.1. Wild-Type Versus HPRT-Deficient Cells

RNAseq analysis was performed in three samples from HPRT-deficient cells and three samples from wild-type cells. A Volcano Plot of differentially expressed genes showed 353 upregulated genes, 12,502 non-differentially expressed genes, and 373 downregulated genes in HPRT-deficient cells compared with wild-type cells (Figure 3A). EV values ≥ 1.5 (LogFC ≥ 0.585) and ≤−1.5 (Log FC ≤ −0.585) (vertical dotted lines in the Volcano Plot) with a p < 0.05 (horizontal dotted line in the Volcano Plot) were considered significant. The most significant differentially expressed genes are shown in Table 1 and Table 2. Table 1 shows differentially downregulated genes in HPRT-deficient cells with a fold-change cutoff of 0.33. DPPA3 (developmental pluripotency-associated 3), also known as STELLA, was the most downregulated gene (fold change 0.021; p = 0.0004). The genes CCN2 (also known as CTGF) and CCN1 (also known as CYRG61) that codify for growth factors that regulate cell adhesion were clearly downregulated (fold change 0.105 and 0.118, respectively, p < 0.0003). As expected, HPRT1 was one of the most downregulated genes (fold-change 0.144; p < 0.0001). CFAP95 (cilia and flagella-associated protein 95), also known as C9orf135, is another pluripotent gene downregulated (fold change 0.302; p = 0.0026). NNMT (nicotinamide N-methyltransferase) was also downregulated in HPRT-deficient cells (fold-change 0.253; p 0.013). Table 2 shows differentially upregulated genes in HPRT-deficient cells with a fold-change cutoff of 3.0. Collagen type III alpha 1 (COL3A1, fold-change 19.0, p < 0.0004), collagen type II alpha 1 (COL2A1, fold-change 6.2, p = 0.03), and TMEM189-UBE2V1 (fold-change 10.6, p < 0.03) were the most upregulated genes. The increased expression of EN1, MAP2, and LMX1A found by qPCR array in HPRT-deficient cells compared to wild-type cells was not significant by RNAseq (EN1; 1.13-fold, p 0.407; MAP2; 1.45-fold, p 0.161; LMX1A; 2.56-fold, p 0.158).

3.3.2. Differentiated Wild-Type Versus Differentiated HPRT-Deficient Cells

RNAseq analysis was performed in three samples from HPRT-deficient cells and three samples from wild-type cells. A Volcano Plot of differentially expressed genes showed 894 upregulated genes, 11,114 non-differentially expressed genes, and 1405 downregulated genes in HPRT-deficient cells compared to wild-type cells (Figure 3B). EV values ≥ 1.5 (LogFC ≥ 0.585) and ≤−1.5 (Log FC ≤ −0.585) (vertical dotted lines in the Volcano Plot) with a p < 0.05 (horizontal dotted line in the Volcano Plot) were considered significant. In both wild-type and HPRT-deficient cells, differentiation is accompanied by the total or almost total disappearance of the expression of stem cell factor genes as NANOG and POU5F1 (OCT4). In addition, there is an increase in the expression of the differentiation markers DCX (Doublecortin) and SNAP25 (Synaptosome-associated protein) (Supplementary Figure S1). Table 3 and Table 4 show the 20 most differentially regulated genes in HPRT-deficient cells and the values for the HPRT1 gene. We found a significant decrease in HPRT1 expression in HPRT-edited cells compared with wild-type cells (fold-change 0.243; p < 0.0001). Most downregulated genes in differentiated HPRT-deficient cells are related to interferon-induced or interferon-related genes (IFI6, IFI44L, IFIT1, ISG15, OAS2, MX1, IFI44, OAS3, IFIT3, OAS1, FPKMCXCL10, IFITM1, USP18) (Table 3). Similarly to what occurs in undifferentiated cells, a decrease in the expression of the NNMT gene was observed (fold-change 0.065; p < 0.0001).
Table 4 shows the 20 most differentially upregulated genes in differentiated HPRT-deficient cells, with a fold-change cutoff of 3.7. The gene with the highest upregulation was SAMD11 (fold change 9.9, p = 0.0001), a transcriptional repressor of RNA polymerase II. The HSPA6 gene, which encodes the chaperone HSP70B, was second (fold change 8.5, p = 0.004), followed by the GATA2 gene (fold change 6.9, p < 0.002), a transcription factor that regulates embryonic development. Several of the most upregulated genes in differentiated HPRT-deficient cells are related to the homeobox gene family of transcription factors implicated in development. There was a significant decrease in EN1 expression (fold-change 0.400; p 0.0252), and an increased expression of LMX1A in differentiated HPRT-deficient cells compared to differentiated wild-type cells (fold-change 2.980; p 0.0013). Table 5 shows all homeobox genes differentially up- or downregulated both in differentiated HPRT-deficient cells versus differentiated wild-type cells and in undifferentiated HPRT-deficient cells versus undifferentiated wild-type cells.
We also analyzed the differential expression of genes related to purine metabolism in HPRT-deficient cells versus wild-type cells. With a fold-change cutoff of 1.5, only HPRT1 was differentially expressed in undifferentiated HPRT-deficient cells. In differentiated cells, we also found a significantly higher expression of IMPDH2 (fold-change 2.73; p < 0.0005) and a decreased expression of ADA (fold-change 0.37; p < 0.005) in HPRT-deficient cells.

3.4. Gene Ontology Enrichment Analysis

3.4.1. Wild-Type Versus HPRT-Deficient Cells

Table 6 and Supplementary Figure S2 show the most significant BP GO terms associated with upregulated and downregulated genes in undifferentiated HPRT-deficient cells compared to wild-type cells. Upregulated genes (Supplementary Figure S2A) are most significantly associated with the BP GO terms Multicellular organism development, System development, Anatomical structure development, Anatomical structure morphogenesis, Developmental process, Animal organ development, Embryo development, Response to stimulus, and Tissue development. Downregulated genes (Supplementary Figure S2B) are most significantly associated with the BP GO terms Response to stimulus, Developmental process, Anatomical structure development, Regulation of signaling, Response to organic substance, Regulation of response to stimulus, Regulation of cell communication, Cell communication, and signaling.

3.4.2. Differentiated Wild-Type Versus Differentiated HPRT-Deficient Cells

The most significant BP GO terms associated with up- and downregulated genes in differentiated HPRT-deficient cells compared to wild-type cells are presented in Table 7 and Supplementary Figure S3. Upregulated genes (Supplementary Figure S3A) are most significantly associated with the BP GO terms Cytoplasmic translation, Regulation of nitrogen compound metabolic process, Developmental process, Multicellular organism development, Anatomical structure development, Regulation of RNA metabolic process, System development, Regulation of DNA-template transcription, and Regulation of nucleic acid-template transcription. Meanwhile, downregulated genes (Supplementary Figure S3B) are most significantly associated with Response to stimulus, Response to organic substance, Regulation of response to stimulus, Developmental process, Immune system process, Defense response, Biological process involved in interspecies interaction between organisms, Anatomical structure development, and Cell communication.
Table 8 and Supplementary Figure S4A,B show the significant BP GO terms related to the nervous system associated with up- and downregulated genes in differentiated HPRT-deficient cells compared with wild-type cells. In both up- and downregulated genes, the most represented terms are Neurogenesis, Neuron differentiation, and Neuron development.

4. Discussion

We have generated an HPRT-deficient line from the pluripotent human embryonic cell line NT2/D1 by knocking out the HPRT1 gene using CRISPR-Cas9 gene editing. These HPRT-deficient cells present a T duplication in HPRT1 exon 3 (c.198dupT; p.Val67CysfsTer7), which causes a frame shift and a premature stop codon in the HPRT protein. These cells present a severe decrease in HPRT activity, are resistant to 6-thioguanine toxicity, and excrete a large quantity of xanthine and hypoxanthine into the medium. They also present a decreased expression of HPRT1 mRNA, and HPRT protein was not detected by Western blot. As such, we can conclude the suitability of the model to study HPRT deficiency and LND.
The human NT2/D1 cell line is a well-established model of neurogenesis. This cell line shows characteristics of pluripotent cells, as expression of OCT4 and NANOG [44]. These cells differentiate along neuro-ectodermal lineages after exposure to RA, developing neuron-like properties [30,31]. Differentiated cells can establish functional synapses and present neuronal electrophysiological properties [30,31,44]. In our laboratory, we have previously employed this model to examine the effect of hypoxanthine and AICAr excess on neural RA-induced differentiation by the changes in the expression of various transcription factor genes [9,45]. As purine alterations in LND fibroblasts depend significantly on the level of folic acid in the culture medium [8], we evaluated the effect of HPRT deficiency on neural development in cells maintained with DMEM containing physiological levels of folic acid. Recently, we have described a new cell culture medium (Plasmax-PV) that contains physiological levels of all nutrients, including vitamins [29]. Future experiments will determine whether NT2/D1 cells can grow and differentiate properly in this new culture medium. To study potential neurodevelopmental alterations in HPRT-deficient NT2/D1 cells, we followed two methodological approaches: a directed qPCR array of genes related to neuronal differentiation, and a global gene expression analysis by RNAseq in both undifferentiated and RA-induced differentiated cells. Both qPCR array and RNAseq (Supplementary Table S2 and Table 1 and Table 3) confirmed the significantly decreased expression of HPRT1 in HPRT-deficient cells compared to wild-type cells in both undifferentiated and differentiated NT2/D1 cells, thus highlighting the validity of the model and the methodology.
A global gene-expression analysis by RNAseq in undifferentiated cells showed 353 upregulated genes and 373 downregulated genes in HPRT-deficient cells compared to wild-type cells (Figure 3A). Of these, the most downregulated gene in HPRT-deficient cells was DPPA3, also known as STELLA (Table 1). DPPA3 is a developmentally regulated gene that is highly expressed in embryonic stem cells, and studies carried out to date indicate that DPPA3 plays a significant role in early mouse embryonic development and affects the differentiation of human embryonic stem cells [46]. Recently, it has been reported that DPPA3 protects UHRF1 and NANOG from degradation in embryonic stem cells [47]. Importantly, UHRF1 is involved in maintaining DNA methylation homeostasis [48]. Another gene downregulated in undifferentiated HPRT-deficient cells is CFAP95 (Table 1), also known as C9orf135, which encodes a membrane protein related to pluripotency in human embryonic stem cells [49]. Analysis of fold-changes between human embryonic stem cells and differentiated cells, by expression profiling of seven microarray data, found that CFAP95 expression was sharply downregulated during differentiation in all seven studies, along with other known pluripotency genes [49]. Interestingly, CFAP95 expression is regulated synergistically by POU5F1 (OCT4) and SOX2 transcription factors [49], and we have found that both genes are downregulated in HPRT-deficient NT2/D1 cells (Table 5). Other homeobox genes were also differentially expressed in undifferentiated HPRT-deficient cells (Table 5).
It is noteworthy that two of the three genes more differentially downregulated in HPRT-deficient undifferentiated cells (CNN1 and CNN2) codify for growth factors that regulate cell adhesion, and two of the three genes more differentially upregulated codify for collagen proteins (COL3A1 and COL2A1). We have found recently that fibroblasts from LND patients have reduced cell migration compared to controls [29], and it has been reported that LND fibroblasts have higher adhesion than controls [50]. It would be interesting to analyze if there are changes in the composition of the extracellular matrix in HPRT-deficient cells that affect their adhesion and migration properties. This could be relevant, since it has been reported that HPRT knock-out mice have an alteration in the proliferation and migration of developing midbrain dopamine (mDA) neurons [14].
The gene NNMT is also downregulated in undifferentiated HPRT-deficient cells (Table 1). This gene encodes the protein nicotinamide N-methyltransferase, an enzyme that catalyzes the methylation of nicotinamide using S-adenosyl methionine as a methyl donor. Importantly, S-adenosyl methionine has been employed as a treatment for self-injurious behavior in LND in an attempt to restore the purine pool by serving as an adenosine donor [51,52].
RA-induced differentiation of wild-type and HPRT-deficient NT2/D1 cells induced similar morphological changes with no obvious differences, although neurite length was not measured. In the differentiated HPRT-deficient NT2/D1 cells, RNAseq showed 894 upregulated genes and 1405 downregulated genes, including HPRT1, compared to differentiated wild-type cells (Figure 3B). Several of these dysregulated genes belong to the homeobox gene family of transcription factors implicated in development (26 homeobox genes upregulated and 7 downregulated) (Table 5). These include a significant decrease in Engrailed homeobox 1 (EN1), together with an increased expression of LIM homeobox transcription factor 1 alpha (LMX1A). Changes in the expression of EN1 and LMX1A genes in HPRT-deficient cells have previously been described in both mouse and human cultures, but to our knowledge, dysregulation of other genes of the homeobox gene family has not been hitherto reported in LND models. Reported changes in the expression of EN1 and LMX1A genes in HPRT-deficient cells have shown conflicting results. Our results in undifferentiated cells obtained by qPCR array are in agreement with those of Ceballos-Picot et al. [22], who applied microarray methods and quantitative PCR to 10 different HPRT-deficient sublines derived from the mouse MN9D cell line. These authors found significant variability between the different mutant sublines, but they reported consistent increases in the mRNAs for EN1 and EN2 and increases in EN proteins overall. They also found overexpression of EN in fibroblasts from patients with LND. However, we were not able to confirm these results with RNAseq. In contrast, Kang et al. [24] reported that LMX1A and EN1 genes were both downregulated in HPRT knockdown SH-SY5Y cells in both the undifferentiated basal state and after differentiation. The reasons for these discrepancies are unknown. Sutcliffe et al. [18] described 6 iPSC lines from LND patients that presented significant heterogeneity among them in RNAseq gene expression studies, with no obvious influence of within-subject or between-subject relationships. So, variability between cell lines, probably including epigenetic changes and different culture conditions, may explain these disparities. In agreement with our results, increased LMX1A expression has been reported in differentiated NT2/D1 cells 18 days after retinoic acid treatment [23]. As we mentioned before, we did not measure neurite length, but Guibinga et al. reported a deficit in neurite outgrowth during differentiation in HPRT-deficient NT2/D1 cells [23].
Homeobox genes were identified in Drosophila melanogaster thanks to mutations that resulted in homeotic transformations of one body segment to another. These genes are characterized by a consensus DNA sequence of 183 base pairs, known as the homeobox sequence, that encodes the homeodomain. Homeobox genes are crucial for the developmental and post-developmental regulation of morphogenesis, patterning, and differentiation [53], and HOX genes comprise the main subset of the homeobox family. At least 17 HOX genes were upregulated in differentiated HPRT-deficient cells, with HOXB13, HOXB8, HOXB9, and HOXB5 being the most upregulated (Table 5). Most HOX genes are expressed in the developing vertebrate central nervous system, where they play a role in determining cell fate in hindbrain and spinal cord segments [53]. They also contribute to the establishment of functional neuronal networks. In humans, at least 15 genetic disorders associated with germline mutations in 10 HOX genes have been reported [54]. As mentioned, although to a lesser extent, some homeobox gene family genes are dysregulated in undifferentiated HPRT-deficient cells (Table 5). This fact, along with the dysregulation of DPPA3 and CFAP95, suggests that HPRT-deficient pluripotent cells present abnormalities before they are differentiated that may contribute to alterations of normal development.
Upregulation of other transcription factors was also observed in differentiated HPRT-deficient cells related to wild-type cells (Table 4). SAMD11 is a transcription repressor of RNA polymerase II and GATA2, a zinc-finger transcription factor that seems to be critical in hematopoietic and neurologic development [55]. The gene HSPA6 (heat shock protein 70 member 6) codifies for a molecular chaperone (HSP70B) involved in a wide variety of cellular processes. Interestingly, HSP70 is involved in the assembly of the purinosome [56], which is clearly increased in fibroblasts from LND patients [57,58].
Regarding genes related to metabolism, we found a decreased expression of the gene NNMT in undifferentiated HPRT-deficient cells (fold-change 0.253; p < 0.05), which was even more marked in differentiated cells (fold-change 0.065; p < 0.0001) (Table 3). We can speculate that preservation of S-adenosyl methionine (an adenosyl donor) may be a cellular adaptation to avoid purine depletion in HPRT-deficient cells. More experiments are necessary to prove this hypothesis. With respect to differential expression of genes related to purine metabolism, besides decreased HPRT1 expression, only a significantly higher expression of IMPDH2 and a decreased expression of ADA were detected in HPRT-deficient differentiated cells. Although HPRT-deficient cells have an increased de novo purine synthesis [7], we did not detect any significant change in the expression levels of the genes involved (Supplementary Table S3). This is not surprising, since under normal physiological conditions, the expression levels of the enzymes of the de novo pathway usually remain unaltered [59]. Higher activity of the novo purine synthesis in HPRT-deficient cells could be mediated by increased purine synthesis efficiency due to improved purinosome formation. Enzymes involved in the de novo pathway are compartmentalized into a complex known as purinosome that localizes close to the mitochondria, and it has been described that purinosome formation is increased in fibroblasts obtained from LND patients [57,58]. The increased expression of IMPDH2 in HPRT-deficient differentiated cells is noteworthy. IMPDH2 is the rate-limiting enzyme in the de novo guanine nucleotide biosynthesis and catalyzes the synthesis of XMP from IMP, which will be converted into GMP. Several point mutations in the IMPDH2 gene have been described in patients with dystonia and other neurodevelopmental disorders. According to O’Neill et al. [60], these mutations make the IMPDH2 enzyme insensitive to allosteric inhibition by GTP, thus resulting in increased enzyme activity. Interestingly, IMPDH has been reported to have a non-enzymatic moonlighting role. Mortimer et al. reported that both IMPDH type 1 and IMPDH type 2 are associated with polyribosomes, suggesting that these housekeeping proteins have an unanticipated role in translation regulation [61]. IMPDH also functions as a transcription factor that regulates histone gene expression. Specifically, IMPDH can bind to DNA, particularly CT-rich regions, and repress the transcription of histone genes and other genes like E2f, which is crucial for cell proliferation [62]. Indeed, phosphoribosyl pyrophosphate synthetase, an enzyme involved in the first and rate-limiting step of purine synthesis, has also been identified as a moonlighting protein [63,64]. We also found a decreased expression of the ADA gene. It is known that ADA-deficient patients present with typical early-onset severe combined immunodeficiency (ADA-SCID), which may be accompanied by neurologic or behavioral abnormalities [65]. Most downregulated genes in differentiated HPRT-deficient cells are related to interferon-induced or interferon-related genes (Table 3). Interferons are secreted cytokines needed to fight viral infections. They activate a signal transduction cascade that leads to the induction of hundreds of interferon-stimulated genes. Many of the proteins encoded by these genes are related to antiviral defense and stimulation of adaptive immunity [66]. Downregulation of both interferon-induced genes and the ADA gene in differentiated HPRT-deficient cells points towards an altered immune response in these cells. In LND patients, a minor impairment of B lymphocyte function was first reported both in vivo and in vitro [67]. However, these abnormalities could not be confirmed by other authors [68].
When we analyzed the biological processes (BPs) associated with differentially expressed genes in HPRT-deficient and wild-type cells by GO enrichment analysis (Table 6 and Table 7), we found that the term “Anatomical structure development” is significantly associated with up- and downregulated genes in both undifferentiated and differentiated cells. This term is defined as “the biological process whose specific outcome is the progression of an anatomical structure from an initial condition to its mature state”. Other biological processes related to development, such as “Developmental process”, “Multicellular organism development”, and “System development”, are also significantly associated with dysregulated genes in both undifferentiated and differentiated HPRT-deficient cells.
If we focus on significant BP GO terms associated with the nervous system, terms related to neurogenesis and neural differentiation are among those that discriminate differentiated HPRT-deficient cells from differentiated wild-type cells (Table 8). A more detailed study of neuronal differentiation in NT2/D1 cells, including quantification and length of their neurites, would be necessary to verify whether the observed differences in gene expression also occur at the morphological level.

5. Conclusions

In summary, we have generated an HPRT-deficient pluripotent human embryonic cell line (NT2/D1) and have studied the transcriptome alterations when the cells were cultured at physiological levels of folic acid. Using this model, we found that HPRT-deficient cells present altered expression of genes related to pluripotency in human embryonic stem cells, along with genes from the homeobox gene family. GO enrichment analysis suggests that these alterations are associated with abnormal nervous system development.
A limitation of our study is that the results are restricted to the pluripotent model we have employed, a model that is otherwise widely used and recognized. Neurological symptoms are not reproduced in genetic animal models of LND [13], indicating that rodent brain cells develop alternative metabolic strategies not present in human cells, or some purine-dependent processes are not present during rodent brain development. To delineate potential neurodevelopmental alterations in LND, many investigators have used HPRT-deficient cells. These in vitro studies were performed with cells incubated with nonphysiologically high levels of folic acid, which are present in almost all standard tissue culture media. As we have shown recently, these culture media mask some abnormalities present in fibroblasts obtained from LND patients [8,29]. We believe that the use of physiological levels of folic acid in the culture media represents an improvement in understanding the pathophysiology of LND. However, further studies, employing different cellular models with different neuronal neurotransmitter phenotypes such as dopaminergic, glutamatergic, and cholinergic neurons, will advance the connection between aberrant purine metabolism and the neurological manifestation of LND. These studies should clarify if the effects of HPRT deficiency are limited to the nigrostriatal dopamine pathways or if it is rather a developmental failure that causes dysfunction of widely distributed neural circuits. Interestingly, Bell et al. have shown that HPRT deficiency produces specific alterations in midbrain dopaminergic neuronal progenitor cells but not in cortical neuronal progenitor cells or iPSCs [69]. On the other hand, to our knowledge, the molecular mechanism by which HPRT deficiency causes defective neuronal development is unknown. One possible explanation is the metabolic consequences of HPRT deficiency, such as the toxic effects of hypoxanthine and AICAR in neuronal development or an energy failure due to ATP depletion, which will compromise neuronal growth. Another possibility is that the HPRT protein would have a non-enzymatic moonlighting role. Other metabolic enzymes involved in purine nucleotide synthesis have additional roles in controlling gene expression [61,62,63,64]. Although, to our knowledge, no additional functions of HPRT in the cell or its presence in the nucleus have been described, we cannot rule out a role for the HPRT protein in the control of gene expression.

Supplementary Materials

The following supporting information can be downloaded at: https://www.mdpi.com/article/10.3390/cells14141105/s1, Table S1: Genes included in the quantitative polymerase chain reaction array designed; Table S2: Individual values of EV (expression variation) and p values for each analyzed gene in qPCR array; Table S3: Differentially expression of purine metabolism genes in HPRT deficient cells versus wild type cells. Figure S1. Effect of RA-induced differentiation in wild-type and HPRT-deficient NT2 cells on expression of stem cell factors genes NANOG and POU5F1 (OCT4) and differentiation marker genes DCX (Doublecortin), and SNAP25 (Synaptosome-associated protein). Figure S2. Most significant BP GO terms associated with (A) upregulated and (B) downregulated genes in undifferentiated HPRT-deficient cells versus wild-type cells. Figure S3. Most significant BP GO terms associated with (A) upregulated and (B) downregulated genes in differentiated HPRT-deficient cells versus wild-type cells. Figure S4. Enrichment Score for significant nervous system-related BP GO terms associated with dysregulated genes in differentiated HPRT-deficient cells versus wild-type cells.

Author Contributions

R.J.T.: Conceptualization, Methodology, Writing—review and edit, Investigation, Formal analysis, Data acquisition, Funding acquisition, Supervision. G.V.-C., C.C.-E., and N.O.: Data acquisition. J.M.L.: Conceptualization, Methodology, Writing—review and edit, Funding acquisition, Supervision. All authors have read and agreed to the published version of the manuscript.

Funding

This work was supported by grant 776/C/2020 from La Marató de TV3 Foundation, grants PID2020-113124RB-C21 and PID2020-113124RB-C22 funded by MCIN/AEI/10.13039/501100011033 (Spanish Ministry of Science and Innovation), and by the Centre for Biomedical Network Research on Rare Diseases (CIBERER), ISCIII, Spain.

Institutional Review Board Statement

Not applicable.

Informed Consent Statement

Not applicable.

Data Availability Statement

The data that support the findings of this study are available from the corresponding author upon reasonable request.

Conflicts of Interest

The authors declare no conflicts of interest. The funders had no role in the design of the study; in the collection, analyses, or interpretation of data; in the writing of the manuscript; or in the decision to publish the results.

References

  1. Lesch Lesch, M.; Nyhan, W.L. A familial disorder of uric acid metabolism and central nervous system function. Am. J. Med. 1964, 36, 561–570. [Google Scholar] [CrossRef] [PubMed]
  2. Jinnah, H.A.; Visser, J.E.; Harris, J.C.; Verdu, A.; Larovere, L.; Ceballos-Picot, I.; Gonzalez-Alegre, P.; Neychev, V.; Torres, R.J.; Dulac, O.; et al. Lesch-Nyhan Disease International Study Group. Delineation of the motor disorder of Lesch-Nyhan disease. Brain 2006, 129, 1201–1217. [Google Scholar] [CrossRef] [PubMed]
  3. Seegmiller, J.E.; Rosenbloom, F.M.; Kelley, W.N. Enzyme defect associated with a sex-linked human neurological disorder and excessive purine synthesis. Science 1967, 31, 1682–1684. [Google Scholar] [CrossRef]
  4. Edwards, A.; Voss, H.; Rice, P.; Civitello, A.; Stegemann, J.; Schwager, C.; Zimmermann, J.; Erfle, H.; Caskey, C.T.; Ansorge, W. Automated DNA sequencing of the human HPRT locus. Genomics 1990, 6, 593–608. [Google Scholar] [CrossRef]
  5. Kelley, W.N.; Rosenbloom, F.M.; Henderson, J.F.; Seegmiller, J.E. A specific enzyme defect in gout associated with overproduction of uric acid. Proc. Natl. Acad. Sci. USA 1967, 57, 1735–1739. [Google Scholar] [CrossRef]
  6. Jinnah, H.A.; Ceballos-Picot, I.; Torres, R.J.; Visser, J.E.; Schretlen, D.J.; Verdu, A.; Laróvere, L.E.; Chen, C.J.; Cossu, A.; Wu, C.H.; et al. Lesch-Nyhan Disease International Study Group. Attenuated variants of Lesch-Nyhan disease. Brain 2010, 133, 671–689. [Google Scholar] [CrossRef]
  7. Rosenbloom, F.M.; Henderson, J.F.; Caldwell, I.C.; Kelley, W.N.; Seegmiller, J.E. Biochemical bases of accelerated purine biosynthesis de novo in human fibroblasts lacking hypoxanthine-guanine phosphoribosyltransferase. J. Biol. Chem. 1968, 243, 1166–1173. [Google Scholar] [CrossRef] [PubMed]
  8. López, J.M.; Outtrim, E.L.; Fu, R.; Sutcliffe, D.J.; Torres, R.J.; Jinnah, H.A. Physiological levels of folic acid reveal purine alterations in Lesch-Nyhan disease. Proc. Natl. Acad. Sci. USA 2020, 117, 12071–12079. [Google Scholar] [CrossRef]
  9. Torres, R.J.; Puig, J.G. Hypoxanthine deregulates genes involved in early neuronal development. Implications in Lesch-Nyhan disease pathogenesis. J. Inherit. Metab. Dis. 2015, 38, 1109–1118. [Google Scholar] [CrossRef]
  10. López, J.M. Is ZMP the toxic metabolite in Lesch-Nyhan disease? Med. Hypotheses 2008, 71, 657–663. [Google Scholar] [CrossRef] [PubMed]
  11. Ernst, M.; Zametkin, A.J.; Matochik, J.A.; Pascualvaca, D.; Jons, P.H.; Hardy, K.; Hankerson, J.G.; Doudet, D.J.; Cohen, R.M. Presynaptic dopaminergic deficits in Lesch-Nyhan disease. N. Engl. J. Med. 1996, 334, 1568–1572. [Google Scholar] [CrossRef] [PubMed]
  12. Wong, D.F.; Harris, J.C.; Naidu, S.; Yokoi, F.; Marenco, S.; Dannals, R.F.; Ravert, H.T.; Yaster, M.; Evans, A.; Rousset, O.; et al. Dopamine transporters are markedly reduced in Lesch-Nyhan disease in vivo. Proc. Natl. Acad. Sci. USA 1996, 93, 5539–5543. [Google Scholar] [CrossRef] [PubMed]
  13. Jinnah, H.A.; Wojcik, B.E.; Hunt, M.; Narang, N.; Lee, K.Y.; Goldstein, M.; Wamsley, J.K.; Langlais, P.J.; Friedmann, T. Dopamine deficiency in a genetic mouse model of Lesch-Nyhan disease. J. Neurosci. 1994, 14, 1164–1175. [Google Scholar] [CrossRef]
  14. Witteveen, J.S.; Loopstok, S.R.; Ballesteros, L.L.; Boonstra, A.; van Bakel, N.H.M.; van Boekel, W.H.P.; Martens, G.J.M.; Visser, J.E.; Kolk, S.M. HGprt deficiency disrupts dopaminergic circuit development in a genetic mouse model of Lesch-Nyhan disease. Cell Mol. Life Sci. 2022, 79, 341. [Google Scholar] [CrossRef]
  15. Schretlen, D.J.; Varvaris, M.; Ho, T.E.; Vannorsdall, T.D.; Gordon, B.; Harris, J.C.; Jinnah, H.A. Regional brain volume abnormalities in Lesch-Nyhan disease and its variants: A cross-sectional study. Lancet Neurol. 2013, 12, 1151–1158. [Google Scholar] [CrossRef]
  16. Schretlen, D.J.; Varvaris, M.; Vannorsdall, T.D.; Gordon, B.; Harris, J.C.; Jinnah, H.A. Brain white matter volume abnormalities in Lesch-Nyhan disease and its variants. Neurology 2015, 84, 190–196. [Google Scholar] [CrossRef]
  17. Dinasarapu, A.R.; Sutcliffe, D.J.; Seifar, F.; Visser, J.E.; Jinnah, H.A. Abnormalities of neural stem cells in Lesch-Nyhan disease. J. Neurogenet. 2022, 36, 81–87. [Google Scholar] [CrossRef]
  18. Sutcliffe, D.J.; Dinasarapu, A.R.; Visser, J.E.; Hoed, J.D.; Seifar, F.; Joshi, P.; Ceballos-Picot, I.; Sardar, T.; Hess, E.J.; Sun, Y.V.; et al. Induced pluripotent stem cells from subjects with Lesch-Nyhan disease. Sci. Rep. 2021, 11, 8523. [Google Scholar] [CrossRef]
  19. Ruillier, V.; Tournois, J.; Boissart, C.; Lasbareilles, M.; Mahé, G.; Chatrousse, L.; Cailleret, M.; Peschanski, M.; Benchoua, A. Rescuing compounds for Lesch-Nyhan disease identified using stem cell-based phenotypic screening. JCI Insight 2020, 5, e132094. [Google Scholar] [CrossRef]
  20. Mekhoubad, S.; Bock, C.; de Boer, A.S.; Kiskinis, E.; Meissner, A.; Eggan, K. Erosion of dosage compensation impacts human iPSC disease modeling. Cell Stem Cell 2012, 10, 595–609. [Google Scholar] [CrossRef]
  21. Cristini, S.; Navone, S.; Canzi, L.; Acerbi, F.; Ciusani, E.; Hladnik, U.; de Gemmis, P.; Alessandri, G.; Colombo, A.; Parati, E.; et al. Human neural stem cells: A model system for the study of Lesch-Nyhan disease neurological aspects. Hum. Mol. Genet. 2010, 19, 1939–1950. [Google Scholar] [CrossRef]
  22. Ceballos-Picot, I.; Mockel, L.; Potier, M.C.; Dauphinot, L.; Shirley, T.L.; Torero-Ibad, R.; Fuchs, J.; Jinnah, H.A. Hypoxanthine-guanine phosphoribosyl transferase regulates early developmental programming of dopamine neurons: Implications for Lesch-Nyhan disease pathogenesis. Hum. Mol. Genet. 2009, 18, 2317–2327. [Google Scholar] [CrossRef] [PubMed]
  23. Guibinga, G.H.; Hsu, S.; Friedmann, T. Deficiency of the housekeeping gene hypoxanthine-guanine phosphoribosyltransferase (HPRT) dysregulates neurogenesis. Mol. Ther. 2010, 18, 54–62. [Google Scholar] [CrossRef] [PubMed]
  24. Kang, T.H.; Guibinga, G.H.; Jinnah, H.A.; Friedmann, T. HPRT deficiency coordinately dysregulates canonical Wnt and presenilin-1 signaling: A neuro-developmental regulatory role for a housekeeping gene? PLoS ONE 2011, 6, e16572. [Google Scholar] [CrossRef]
  25. Guibinga, G.H.; Murray, F.; Barron, N. HPRT-deficiency dysregulates cAMP-PKA signaling and phosphodiesterase 10A expression: Mechanistic insight and potential target for Lesch-Nyhan Disease? PLoS ONE 2013, 8, e63333. [Google Scholar] [CrossRef]
  26. Connolly, G.P. Hypoxanthine-guanine phosphoribosyltransferase-deficiency produces aberrant neurite outgrowth of rodent neuroblastoma used to model the neurological disorder Lesch Nyhan syndrome. Neurosci. Lett. 2001, 314, 61–64. [Google Scholar] [CrossRef]
  27. Boer, P.; Brosh, S.; Wasserman, L.; Hammel, I.; Zoref-Shani, E.; Sperling, O. Decelerated rate of dendrite outgrowth from dopaminergic neurons in primary cultures from brains of hypoxanthine phosphoribosyltransferase-deficient knockout mice. Neurosci. Lett. 2001, 303, 45–48. [Google Scholar] [CrossRef]
  28. Lewers, J.C.; Ceballos-Picot, I.; Shirley, T.L.; Mockel, L.; Egami, K.; Jinnah, H.A. Consequences of impaired purine recycling in dopaminergic neurons. Neuroscience 2008, 152, 761–772. [Google Scholar] [CrossRef]
  29. Escudero-Ferruz, P.; Ontiveros, N.; Cano-Estrada, C.; Sutcliffe, D.J.; Jinnah, H.A.; Torres, R.J.; López, J.M. A new physiological medium uncovers biochemical and cellular alterations in Lesch-Nyhan disease fibroblasts. Mol. Med. 2024, 30, 3. [Google Scholar] [CrossRef]
  30. Pleasure, S.J.; Page, C.; Lee, V.M. Pure, postmitotic, polarized human neurons derived from NTera 2 cells provide a system for expressing exogenous proteins in terminally differentiated neurons. J. Neurosci. 1992, 12, 1802–1815. [Google Scholar] [CrossRef]
  31. Andrews, P.W. Retinoic acid induces neuronal differentiation of a cloned human embryonal carcinoma cell line in vitro. Dev. Biol. 1984, 103, 285–293. [Google Scholar] [CrossRef] [PubMed]
  32. García, M.G.; Torres, R.J.; Prior, C.; Puig, J.G. Normal HPRT coding region in complete and partial HPRT deficiency. Mol. Genet. Metab. 2008, 94, 167–172. [Google Scholar] [CrossRef]
  33. Rylance, H.J.; Wallace, R.C.; Nuki, G. Hypoxanthine-guanine phosphoribosyl transferase: Assay using high performance liquid chromatography. Clin. Chim. Acta 1982, 121, 159–165. [Google Scholar] [CrossRef] [PubMed]
  34. Puig, J.G.; Torres, R.J.; Mateos, F.A.; Ramos, T.H.; Arcas, J.M.; Buño, A.S.; O’Neill, P. The spectrum of hypoxanthine-guanine phosphoribosyltransferase (HPRT) deficiency. Clinical experience based on 22 patients from 18 Spanish families. Medicine 2001, 80, 102–112. [Google Scholar] [CrossRef]
  35. Andrews, S. FastQC: A Quality Control Tool for High Throughput Sequence Data. 2010. Available online: https://www.bioinformatics.babraham.ac.uk/projects/fastqc/ (accessed on 2 June 2025).
  36. Martin, M. Cutadapt removes adapter sequences from high-throughput sequencing reads. EMBnet. J. 2011, 17, 10–12. [Google Scholar] [CrossRef]
  37. Kim, D.; Langmead, B.; Salzberg, S.L. HISAT: A fast spliced aligner with low memory requirements. Nat. Methods 2015, 12, 357–360. [Google Scholar] [CrossRef] [PubMed]
  38. Pertea, M.; Pertea, G.M.; Antonescu, C.M.; Chang, T.C.; Mendell, J.T.; Salzberg, S.L. StringTie enables improved reconstruction of a transcriptome from RNA-seq reads. Nat. Biotechnol. 2015, 33, 290–295. [Google Scholar] [CrossRef]
  39. Mortazavi, A.; Williams, B.A.; McCue, K.; Schaeffer, L.; Wold, B. Mapping and quantifying mammalian transcriptomes by RNA-Seq. Nat. Methods 2008, 5, 621–628. [Google Scholar] [CrossRef]
  40. Frazee, A.C.; Pertea, G.; Jaffe, A.E.; Langmead, B.; Salzberg, S.L.; Leek, J.T. Ballgown bridges the gap between transcriptome assembly and expression analysis. Nat. Biotechnol. 2015, 33, 243–246. [Google Scholar] [CrossRef]
  41. The Gene Ontology Consortium. The Gene Ontology knowledgebase in 2023. Genetics 2023, 224, iyad031. [Google Scholar] [CrossRef]
  42. Ashburner, M.; Ball, C.A.; Blake, J.A.; Botstein, D.; Butler, H.; Cherry, J.M.; Davis, A.P.; Dolinski, K.; Dwight, S.S.; Eppig, J.T.; et al. Gene ontology: Tool for the unification of biology. The Gene Ontology Consortium. Nat. Genet. 2000, 25, 25–29. [Google Scholar] [CrossRef] [PubMed]
  43. Thomas, P.D.; Ebert, D.; Muruganujan, A.; Mushayahama, T.; Albou, L.P.; Mi, H. PANTHER: Making genome-scale phylogenetics accessible to all. Protein Sci. 2022, 31, 8–22. [Google Scholar] [CrossRef] [PubMed]
  44. Öz, S.; Maercker, C.; Breiling, A. Embryonic carcinoma cells show specific dielectric resistance profiles during induced differentiation. PLoS ONE 2013, 8, e59895. [Google Scholar] [CrossRef] [PubMed]
  45. Torres, R.J.; Puig, J.G. Aicar effect in early neuronal development. Nucleosides Nucleotides Nucleic Acids 2018, 37, 261–272. [Google Scholar] [CrossRef]
  46. Wongtrakoongate, P.; Jones, M.; Gokhale, P.J.; Andrews, P.W. STELLA facilitates differentiation of germ cell and endodermal lineages of human embryonic stem cells. PLoS ONE 2013, 8, e56893. [Google Scholar] [CrossRef]
  47. Zhao, S.; Zhang, C.; Xu, J.; Liu, S.; Yu, L.; Chen, S.; Wen, H.; Li, Z.; Liu, N. Dppa3 facilitates self-renewal of embryonic stem cells by stabilization of pluripotent factors. Stem Cell Res. Ther. 2022, 13, 169. [Google Scholar] [CrossRef]
  48. Yamaguchi, K.; Chen, X.; Rodgers, B.; Miura, F.; Bashtrykov, P.; Bonhomme, F.; Salinas-Luypaert, C.; Haxholli, D.; Gutekunst, N.; Aygenli, B.Ö.; et al. Non-canonical functions of UHRF1 maintain DNA methylation homeostasis in cancer cells. Nat. Commun. 2024, 15, 2960. [Google Scholar] [CrossRef]
  49. Zhou, S.; Liu, Y.; Ma, Y.; Zhang, X.; Li, Y.; Wen, J. C9ORF135 encodes a membrane protein whose expression is related to pluripotency in human embryonic stem cells. Sci. Rep. 2017, 7, 45311. [Google Scholar] [CrossRef]
  50. Stacey, N.C.; Ma, M.H.; Duley, J.A.; Connolly, G.P. Abnormalities in cellular adhesion of neuroblastoma and fibroblast models of Lesch Nyhan syndrome. Neuroscience 2000, 98, 397–401. [Google Scholar] [CrossRef]
  51. Bottiglieri, T. S-Adenosyl-L-methionine (SAMe): From the bench to the bedside--molecular basis of a pleiotrophic molecule. Am. J. Clin. Nutr. 2002, 76, 1151S–1157S. [Google Scholar] [CrossRef]
  52. Dolcetta, D.; Parmigiani, P.; Salmaso, L.; Bernardelle, R.; Cesari, U.; Andrighetto, G.; Baschirotto, G.; Nyhan, W.L.; Hladnik, U. Quantitative evaluation of the clinical effects of S-adenosylmethionine on mood and behavior in Lesch-Nyhan patients. Nucleosides Nucleotides Nucleic Acids 2013, 32, 174–188. [Google Scholar] [CrossRef]
  53. Gonçalves, C.S.; Le Boiteux, E.; Arnaud, P.; Costa, B.M. HOX gene cluster (de)regulation in brain: From neurodevelopment to malignant glial tumours. Cell Mol. Life Sci. 2020, 77, 3797–3821. [Google Scholar] [CrossRef] [PubMed]
  54. Quinonez, S.C.; Innis, J.W. Human HOX gene disorders. Mol. Genet. Metab. 2014, 111, 4–15. [Google Scholar] [CrossRef] [PubMed]
  55. Kala, K.; Haugas, M.; Lilleväli, K.; Guimera, J.; Wurst, W.; Salminen, M.; Partanen, J. Gata2 is a tissue-specific post-mitotic selector gene for midbrain GABAergic neurons. Development 2009, 136, 253–262. [Google Scholar] [CrossRef] [PubMed]
  56. French, J.B.; Zhao, H.; An, S.; Niessen, S.; Deng, Y.; Cravatt, B.F.; Benkovic, S.J. Hsp70/Hsp90 chaperone machinery is involved in the assembly of the purinosome. Proc. Natl. Acad. Sci. USA 2013, 110, 2528–2533. [Google Scholar] [CrossRef]
  57. Fu, R.; Sutcliffe, D.; Zhao, H.; Huang, X.; Schretlen, D.J.; Benkovic, S.; Jinnah, H.A. Clinical severity in Lesch-Nyhan disease: The role of residual enzyme and compensatory pathways. Mol. Genet. Metab. 2015, 114, 55–61. [Google Scholar] [CrossRef]
  58. Chan, C.Y.; Pedley, A.M.; Kim, D.; Xia, C.; Zhuang, X.; Benkovic, S.J. Microtubule-directed transport of purine metabolons drives their cytosolic transit to mitochondria. Proc. Natl. Acad. Sci. USA 2018, 115, 13009–13014. [Google Scholar] [CrossRef]
  59. Zhao, H.; Chiaro, C.R.; Zhang, L.; Smith, P.B.; Chan, C.Y.; Pedley, A.M.; Pugh, R.J.; French, J.B.; Patterson, A.D.; Benkovic, S.J. Quantitative analysis of purine nucleotides indicates that purinosomes increase de novo purine biosynthesis. J. Biol. Chem. 2015, 290, 6705–6713. [Google Scholar] [CrossRef]
  60. O’Neill, A.G.; Burrell, A.L.; Zech, M.; Elpeleg, O.; Harel, T.; Edvardson, S.; Mor-Shaked, H.; Rippert, A.L.; Nomakuchi, T.; Izumi, K.; et al. Neurodevelopmental disorder mutations in the purine biosynthetic enzyme IMPDH2 disrupt its allosteric regulation. J. Biol. Chem. 2023, 299, 105012. [Google Scholar] [CrossRef]
  61. Mortimer, S.E.; Xu, D.; McGrew, D.; Hamaguchi, N.; Lim, H.C.; Bowne, S.J.; Daiger, S.P.; Hedstrom, L. IMP dehydrogenase type 1 associates with polyribosomes translating rhodopsin mRNA. J. Biol. Chem. 2008, 283, 36354–36360. [Google Scholar] [CrossRef]
  62. Kozhevnikova, E.N.; van der Knaap, J.A.; Pindyurin, A.V.; Ozgur, Z.; van Ijcken, W.F.; Moshkin, Y.M.; Verrijzer, C.P. Metabolic enzyme IMPDH is also a transcription factor regulated by cellular state. Mol. Cell. 2012, 47, 133–139. [Google Scholar] [CrossRef]
  63. Zhang, L.; Zhao, X.; Hu, J.; Li, T.; Chen, H.Z.; Zhang, A.; Wang, H.; Yu, J.; Zhang, L. PRPS2 enhances RNA m6A methylation by stimulating SAM synthesis through enzyme-dependent and independent mechanisms. Nat. Commun. 2025, 16, 3966. [Google Scholar] [CrossRef]
  64. Srivastava, S.; Samaniego-Castruita, D.; Khurana, S.; Shukla, V.; Ben-Sahra, I.; Foltz, D.R. Rate Limiting Enzymes in Nucleotide Metabolism Synchronize Nucleotide Biosynthesis and Chromatin Formation. bioRxiv 2025. [Google Scholar] [CrossRef] [PubMed]
  65. Hershfield, M.; Tarrant, T. Adenosine Deaminase Deficiency. 2006 Oct 3 [Updated 2024 Mar 7]. In GeneReviews® [Internet]; Adam, M.P., Feldman, J., Mirzaa, G.M., Pagon, R.A., Wallace, S.E., Amemiya, A., Eds.; University of Washington: Seattle, WA, USA, 2024. Available online: https://www.ncbi.nlm.nih.gov/books/NBK1483/ (accessed on 2 June 2025).
  66. Schoggins, J.W. Interferon-Stimulated Genes: What Do They All Do? Annu. Rev. Virol. 2019, 6, 567–584. [Google Scholar] [CrossRef]
  67. Allison, A.C.; Hovi, T.; Watts, R.W.; Webster, A.D. Immunological observations on patients with Lesch-Nyhan syndrome, and on the role of de-novo purine synthesis in lymphocyte transformation. Lancet 1975, 2, 1179–1183. [Google Scholar] [CrossRef] [PubMed]
  68. Gelfand, E.W.; Fox, I.H.; Stuckey, M.; Dosch, H.M. Normal B-lymphocyte function in patients with Lesch-Nyhan syndrome and HGPRT deficiency. Clin. Exp. Immunol. 1978, 31, 205–208. [Google Scholar] [PubMed]
  69. Bell, S.; McCarty, V.; Peng, H.; Jefri, M.; Hettige, N.; Antonyan, L.; Crapper, L.; O’Leary, L.A.; Zhang, X.; Zhang, Y.; et al. Lesch-Nyhan disease causes impaired energy metabolism and reduced developmental potential in midbrain dopaminergic cells. Stem Cell Rep. 2021, 16, 1749–1762. [Google Scholar] [CrossRef]
Figure 1. Characterization of HPRT-deficient pluripotent human embryonic cell line NT2/D1 generated by CRISPR-Cas9. (A) Selection of HPRT-deficient edited cells in medium with 6-thioguanine 30 μM for 10 days. (B) Chromatogram of sequenced DNA obtained from wild-type and 6-thioguanine-resistant HPRT-deficient edited cells showing a duplication of thymine in exon 3 of the HPRT1 gene after position c.198 (NM_000194.2) (c.198dupT; p.Val67CysfsTer7) in HPRT-deficient cells. (C) Effect of c.198dupT duplication in HPRT protein. This duplication, caused by a CRISPR-Cas9 T insertion, alters the reading frame after C66 and results in a stop codon at position 73 in the HPRT transcript. * stop codon. (D) Chromatogram of sequenced HPRT1 cDNA obtained from reverse transcribed and amplified RNA from 6-thioguanine-resistant HPRT-deficient edited cells, showing the c.198dupT duplication. (E) Western blot of cell lysate from HPRT-deficient edited cells and LND fibroblasts.
Cells 14 01105 g001aCells 14 01105 g001b
Figure 2. Volcano Plot of differentially expressed genes by real-time quantitative PCR array of selected genes related to neuronal differentiation in HPRT-deficient and wild-type NTD2/D1 cells. (A) Volcano Plot of differentially expressed genes in undifferentiated HPRT-deficient cells (HPRT) versus wild-type (WT) cells. (B) Volcano Plot of differentially expressed genes in differentiated HPRT-deficient cells (HPRT) versus wild-type (WT) cells. EV values ≤ −2.0 are represented by a green line (decreased expression) and EV values ≥ 2.0 by a red line (increased expression), and a p value < 0.05 (considered significant) as a blue line.
Cells 14 01105 g002
Figure 3. Volcano Plot of differentially expressed genes by RNAseq in HPRT-deficient and wild-type NTD2/D1 cells. (A) Volcano Plot of differentially expressed genes in undifferentiated HPRT-deficient cells versus undifferentiated wild-type cells. (B) Volcano Plot of differentially expressed genes in differentiated HPRT-deficient cells versus differentiated wild-type cells. EV values ≥ 1.5 (LogFC ≥ 0.585) and ≤−1.5 (Log FC ≤ −0.585) (vertical dotted lines in the Volcano Plot) with a p < 0.05 (horizontal dotted line in the Volcano Plot) were considered significant. Red dots: upregulated genes. Black dots: non-differentially expressed genes. Green dots: downregulated genes.
Cells 14 01105 g003
Table 1. Downregulated genes in undifferentiated HPRT-deficient cells compared to wild-type cells. Differentially expressed gene analyses were performed with the R package Ballgown. Fold-change, p-value (0.05), and FPKM (0.5 mean in one group) were used to filter differentially expressed genes. Track id: The database name at the gene level. Gene name: The name of the gene. log2FC: if the comparison is test vs control, log2 of the fold-change will be calculated by test FPKM—control FPKM. Fold-Change: 2^(log2FC). p value: The p-value of the F-statistic for the gene. The p-value was set to 1 if any group in the comparison had no replicates. q value: The FDR-adjusted p-value. The q value was set to 1 if any group in the comparison had no replicates.
Track idGene Namelog2FCFold Changep Valueq Value
ENSG00000187569.2_2DPPA3 −5.5600934470.021195570.0004198020.040596923
ENSG00000118523.5_2CCN2 −3.2449037040.1054840150.0002781630.036303633
ENSG00000142871.16_3CCN1 −3.0792431330.1183192620.0002603770.03573791
ENSG00000165704.14_2HPRT1−2.7869820450.1448887972.73957 × 10−60.012297513
ENSG00000148677.6_2ANKRD1−2.3131229670.2012243820.000932750.050325601
ENSG00000120937.8_2NPPB−2.2127408720.215724080.0011045950.052000195
ENSG00000197614.10_2MFAP5−2.1493005260.2254218820.0020061820.061695869
ENSG00000135046.13_3ANXA1−1.9871816610.2522311460.0005213780.043820278
ENSG00000166741.7_3NNMT−1.9788247090.253696460.0135965520.12292049
ENSG00000106366.8_2SERPINE1−1.94139660.2603642730.0115726790.116032592
ENSG00000156265.15_2MAP3K7CL−1.9380529150.260968410.010347480.111481945
ENSG00000106823.12_3ECM2−1.9325539680.261965010.0018521160.060764564
ENSG00000188015.9_3S100A3−1.9009941170.2677587980.0035466790.072840089
ENSG00000101460.12_2MAP1LC3A−1.8991224520.2681063970.0004092140.040303113
ENSG00000163347.5_2CLDN1−1.8570918760.2760321330.0004941540.042868547
ENSG00000100345.20_2MYH9−1.761314620.294979250.0002561780.03573791
ENSG00000204711.8_2CFAP95−1.7274682580.301981430.0026329840.065817254
ENSG00000135932.10_2CAB39−1.7176501440.3040435430.0012350670.053730422
ENSG00000198380.12_2GFPT1−1.6310763190.3228472580.0376020120.180752644
ENSG00000105971.14_2CAV2−1.6006042710.3297388380.0246749010.150097079
ENSG00000134531.9_3EMP1−1.5896969220.3322412430.0036454330.073941233
Table 2. Upregulated genes in undifferentiated HPRT-deficient cells versus wild-type cells. Differentially expressed gene analyses were performed using the R package ballgown. Fold-change, p value (0.05), and FPKM (0.5 mean in one group) were used to filter differentially expressed genes. Track id: The database name at the gene level. Gene name: The name of the gene. log2FC: log2 of the fold-change calculated as HPRT-deficient FPKM—wild-type FPKM. Fold-Change: 2^(log2FC). p value: The p-value of the F-statistic for the gene. The p-value was set to 1 if any group in the comparison had no replicates. q value: The FDR-adjusted p-value. The q value was set to 1 if any group in the comparison had no replicates.
Track idGene Namelog2FCFold Changep Valueq Value
ENSG00000168542.14_3COL3A14.24795639419.000380350.0003794740.039430012
ENSG00000124208.16_3TMEM189-UBE2V13.40842806810.617911140.0287915070.161419507
ENSG00000139219.17_3COL2A12.6402484936.2343903690.033642780.172691892
ENSG00000125872.7_2LRRN42.2930457874.9008968670.0009238610.050325601
ENSG00000185664.14_4PMEL2.1015980924.2918453510.0417620310.189378261
ENSG00000138080.13_2EMILIN12.0863811934.2468147940.000213680.033201528
ENSG00000185551.14_3NR2F22.0494194364.1393936020.0158081240.128550994
ENSG00000122691.12_3TWIST11.937677153.8308834930.0011354380.052593016
ENSG00000116132.11_3PRRX11.870777893.6572972550.0012965920.0538418
ENSG00000178252.17_3WDR61.8405420953.5814457650.0344852010.17438591
ENSG00000106333.12_2PCOLCE1.8006908993.4838702620.0012201950.053665168
ENSG00000163349.21_3HIPK11.797322133.4757447310.0021556820.063582685
ENSG00000158270.11_3COLEC121.7830328553.4414888960.0485157440.201942638
ENSG00000171161.12_2ZNF6721.7536293733.3720580520.0341884180.173644775
ENSG00000022556.15_3NLRP21.7111610753.274242270.0011559760.052593016
ENSG00000255690.2_2TRIL1.632879633.1013140590.0070519680.096262957
ENSG00000136383.6_2ALPK31.5900570323.0106125080.0004668860.041915559
ENSG00000135903.18_2PAX31.5779886512.985533280.0366413620.178731018
ENSG00000136110.12_2CNMD1.4496045092.7313316616.13992 × 10−50.022921908
ENSG00000117114.19_3ADGRL21.4390412072.7114060980.0310704390.165870885
ENSG00000113196.2_2HAND11.4180998842.6723331670.0082409860.102888602
Table 3. The twenty most differentially downregulated genes in differentiated HPRT-deficient cells versus differentiated wild-type cells, and the values for the HPRT1 gene. Differentially expressed gene analyses were performed using the R package Ballgown. Fold-change, p-value (0.05), and FPKM (0.5 mean in one group) were used to filter differentially expressed genes. Track id: The database name at the gene level. Gene name: The name of the gene. log2FC: if the comparison is test vs control. log2 of the fold-change will be calculated by test FPKM—control FPKM. Fold-Change: 2^(log2FC). p value: The p-value of the F-statistic for the gene. The p-value was set to 1 if any group in the comparison had no replicates. q value: The FDR-adjusted p-value. The q value was set to 1 if any group in the comparison had no replicates.
Track idGene Namelog2FCFold Changep Valueq Value
ENSG00000126709.14_2IFI6−5.8788455460.0169938250.0002337230.014261355
ENSG00000137959.15_3IFI44L−5.6080666480.0205023543.82253 × 10−70.002122525
ENSG00000185745.9_2IFIT1−5.2544604520.0261968936.57308 × 10−50.00935849
ENSG00000187608.8_4ISG15−5.0979472830.0291987970.0001332710.011568582
ENSG00000111335.12_2OAS2−4.9807230770.0316703576.11792 × 10−70.002547809
ENSG00000157601.13_3MX1−4.7961448190.0359928762.11695 × 10−60.00320583
ENSG00000137965.10_2IFI44−4.7956531960.0360051430.000880560.02125452
ENSG00000111331.12_2OAS3−4.6726702640.0392090293.48892 × 10−60.00339028
ENSG00000119917.13_2IFIT3−4.5760663620.0419243916.18918 × 10−50.009288229
ENSG00000169429.10_2CXCL8−4.4959506750.0443183919.12997 × 10−60.005849499
ENSG00000089127.12_3OAS1−4.4427997710.0459815928.61343 × 10−50.01017607
ENSG00000205413.7_3SAMD9−4.4393548280.0460915211.7325 × 10−50.007195438
ENSG00000197632.8_3SERPINB2−4.2157356210.0538191863.44386 × 10−60.00339028
ENSG00000169245.5_2CXCL10−4.0914541180.0586610177.72479 × 10−50.009748454
ENSG00000173391.8_3OLR1−4.0856381090.0588979770.0024765220.034021507
ENSG00000185885.15_3IFITM1−4.0454971590.0605597410.0067313310.05470077
ENSG00000166741.7_3NNMT−3.9346042980.0653982448.57421 × 10−50.01017607
ENSG00000163739.4_2CXCL1−3.932876560.065476610.0003841920.016613744
ENSG00000184979.9_2USP18−3.8491554560.06938873.94644 × 10−50.008176704
ENSG00000125730.16_3C3−3.7330390940.0752044010.001970690.030365633
ENSG00000165704.14_2HPRT1−2.0395462270.2432402328.9983 × 10−50.010363433
Table 4. The twenty most differentially upregulated genes in differentiated HPRT-deficient cells versus differentiated wild-type cells. Differentially expressed gene analyses were performed using the R package Ballgown. Fold-change, p-value (0.05), and FPKM (0.5 mean in one group) were used to filter differentially expressed genes. Track id: The database name at the gene level. Gene name: The name of the gene. log2FC: if the comparison is test vs control. log2 of the fold change will be calculated by test FPKM—control FPKM. Fold-Change: 2^(log2FC). p value: The p-value of the F-statistic for the gene. The p-value was set to 1 if any group in the comparison had no replicates. q value: The FDR-adjusted p-value. The q value was set to 1 if any group in the comparison had no replicates.
Track idGene Namelog2FCFold Changep Valueq Value
ENSG00000187634.11_4SAMD113.3171517559.9669476760.0001046190.010578182
ENSG00000173110.7_3HSPA63.0898839738.5142766790.0041207170.042794832
ENSG00000179348.11_3GATA22.7939360116.9351928980.0017966190.028994304
ENSG00000159184.7_2HOXB132.632307076.2001669780.0448194330.145877709
ENSG00000118432.12_3CNR12.3895826265.240057440.017821430.088564849
ENSG00000170689.9_3HOXB92.3432477525.0744369470.0209764370.09589378
ENSG00000158164.6_2TMSB15A2.3070406284.9486692730.0154676620.082319589
ENSG00000159182.4_2PRAC12.1970803434.5855041010.0072243220.056393045
ENSG00000111341.9_2MGP2.1823725134.5389937850.0075872340.057716822
ENSG00000196361.9_3ELAVL32.1623215484.476345980.0027076770.035265434
ENSG00000124194.16_3GDAP1L12.1329515794.3861391410.0287912420.114518746
ENSG00000120068.6_3HOXB82.1073157514.3088884530.0044643320.044718486
ENSG00000120075.5_3HOXB52.0870217594.2487008240.0076899730.058020496
ENSG00000162188.5_2GNG32.0459374.1294138150.0472469790.150407077
ENSG00000185559.13_2DLK11.9980437633.9945798360.0113084260.069531367
ENSG00000015592.16_2STMN41.9862801743.9621408690.0341555450.125871793
ENSG00000244242.1_3IFITM101.9756068393.9329363540.0247560460.1053043
ENSG00000142694.6_2EVA1B1.9524015253.8701823020.0043111370.043861073
ENSG00000108511.9_3HOXB61.9337002123.8203378090.0065407610.053992073
ENSG00000102924.11_2CBLN11.9038985433.7422308120.0189883790.091299955
Table 5. Homeobox genes differentially regulated in differentiated HPRT-deficient cells versus differentiated wild-type cells and in undifferentiated HPRT-deficient cells versus undifferentiated wild-type cells. Differentially expressed gene analyses were performed using the R package Ballgown. Fold-change, p-value (0.05), and FPKM (0.5 mean in one group) were used to filter differentially expressed genes. Track id: The database name at the gene level. Gene name: The name of the gene. log2FC: if the comparison is test vs control. Log2 of the fold change will be calculated by test FPKM—control FPKM. Fold change: 2^(log2FC). p value: The p-value of the F-statistic for the gene. The p-value was set to 1 if any group in the comparison had no replicates. q value: The FDR-adjusted p-value. The q value was set to 1 if any group in the comparison had no replicates.
Differentiated Cells
Track idGene Namelog2FCFold Changep Valueq Value
ENSG00000159184.7_2HOXB132.632307076.2001669780.0448194330.145877709
ENSG00000170689.9_3HOXB92.3432477525.0744369470.0209764370.09589378
ENSG00000120068.6_3HOXB82.1073157514.3088884530.0044643320.044718486
ENSG00000120075.5_3HOXB52.0870217594.2487008240.0076899730.058020496
ENSG00000108511.9_3HOXB61.9337002123.8203378090.0065407610.053992073
ENSG00000128645.14_3HOXD11.6961984553.2404596160.000859440.021008689
ENSG00000162761.14_2LMX1A1.5754012972.9801837740.0013919740.025863001
ENSG00000128709.12_3HOXD91.2858880582.4383209870.0023956870.03350744
ENSG00000164853.8_2UNCX1.2685507072.4091942270.0206227650.094951359
ENSG00000185668.7_3POU3F11.2627086212.3994581020.0001883440.013335661
ENSG00000173917.10_2HOXB21.2405533582.3628914560.010810350.068082724
ENSG00000198353.7_3HOXC41.1897946162.2812026540.0011799110.024068111
ENSG00000111249.13_2CUX21.189684072.2810278630.0123920410.072717219
ENSG00000120093.11_3HOXB31.152469452.222940680.0025911340.034893382
ENSG00000128710.5_3HOXD101.0884799982.1264987370.0006405470.019493284
ENSG00000105996.6_2HOXA21.0477014012.0672335670.0025039530.034301685
ENSG00000182742.5_3HOXB40.9655680291.9528322540.0018360830.029163542
ENSG00000197576.13_3HOXA40.9311643811.9068143410.0052486270.048384965
ENSG00000170166.5_3HOXD40.9114110451.880884220.0452325380.14662067
ENSG00000215612.7_4HMX10.8875498121.8500314690.0342304170.126013322
ENSG00000121297.6_2TSHZ30.8489840551.8012320520.0160442230.083608498
ENSG00000177045.7_2SIX50.8148541231.7591202710.0311452060.119736175
ENSG00000128714.5_2HOXD130.7701950031.7055002930.0255293810.107248486
ENSG00000128652.11_3HOXD30.7483955721.6799235410.0053743640.048887126
ENSG00000138136.6_2LBX10.6790708091.6011082030.0095897150.064232198
ENSG00000007372.21_4PAX60.5978653491.5134755290.0136983940.077090491
ENSG00000174306.21_3ZHX3−0.7223056050.6061280.0173580370.08736421
ENSG00000016082.14_2ISL1−0.7284381660.603556960.001464140.026395725
ENSG00000163064.6_2EN1−0.865153220.5489880990.001615150.027390246
ENSG00000168779.19_3SOX2−0.9586721560.5145302650.0005719570.01890408
ENSG00000167034.9_2NKX3-1−1.1647399850.4460446430.003214280.03831649
ENSG00000167157.10_2PRRX2−1.1849945190.4398262090.0141100560.078479236
ENSG00000204531.17_3POU5F1−1.6010007720.3296482270.0111989780.069170405
Undifferentiated cells
Track idGene Namelog2FCFold ChangepValueq Value
ENSG00000116132.11_3PRRX11.870777893.6572972550.0012965920.0538418
ENSG00000135903.18_2PAX31.5779886512.985533280.0366413620.178731018
ENSG00000173917.10_2HOXB21.1444474612.21061450.0117036420.116641064
ENSG00000105996.6_2HOXA20.8425979531.7932765030.0307729370.165161471
ENSG00000170577.7_2SIX20.8201437931.7655819590.0033296350.071309576
ENSG00000016082.14_2ISL10.8161061381.7606475520.0089831860.106504497
ENSG00000128645.14_3HOXD10.771422071.7069515030.0019414550.061046111
ENSG00000128714.5_2HOXD130.6938896591.6176389710.001495670.057054801
ENSG00000185668.7_3POU3F10.6863901531.6092518780.0345484160.17438591
ENSG00000179981.9_3TSHZ10.6802046561.6023670460.0335640510.172691892
ENSG00000128709.12_3HOXD90.6406616931.5590440520.0034975450.072360604
ENSG00000229544.8_2NKX1-20.6279386561.5453553890.0144948610.125234663
ENSG00000215612.7_4HMX10.5913681161.5066748580.0005472140.044818464
ENSG00000125816.4_2NKX2-4−0.6877314070.6208293170.0020698110.061914637
Table 6. The most significant BP GO terms associated with up- and downregulated genes in undifferentiated HPRT-deficient cells versus wild-type cells. Fisher’s exact test was used to estimate the statistical significance of enrichment of terms between the two groups. The p-value denotes the significance of GO term enrichment in the differentially expressed gene list. ID: GO ID. Term: Name of the GO term. Count: Number of genes associated with the ID. Size: Number of background population genes associated with the term. Num Int: Total number of DE genes. Num Total: Total number of background population genes. p value: Fisher’s exact test. Enrichment Score: Enrichment Score value of the term, which equals (−log10(Pvalue)). Fold_Enrichment: Fold Enrichment value of the term, which equals (Count/Size)/(numInt/numTotal). GeneRatio: Gene Ratio value for genes associated with the term, which equals (Count/numInt).
BP GO Terms Associated with Upregulated Genes
IDTermCountSizeNumIntNumTotalp ValueEnrichment ScoreFold EnrichmentGene Ratio
GO:0007275Multicellular organism development134401232834,8632.41257 × 10−4241.617519273.5500525860.408536585
GO:0048731System development124358432834,8633.35951 × 10−4039.473723643.6774315390.37804878
GO:0048856Anatomical structure development147528432834,8637.75032 × 10−3837.110680152.956959920.448170732
GO:0009653Anatomical structure morphogenesis96224132834,8631.48542 × 10−3736.828149494.553237340.292682927
GO:0032502Developmental process152589632834,8631.67503 × 10−3534.775978462.7401669590.463414634
GO:0048513Animal organ development105290232834,8636.25251 × 10−3534.203945753.8457655360.320121951
GO:0009790Embryo development58104832834,8638.56326 × 10−2827.067360945.8824415840.176829268
GO:0050896Response to stimulus169843332834,8637.98053 × 10−2726.097968362.1300780470.515243902
GO:0009888Tissue development72177032834,8632.49522 × 10−2625.602891464.3236461350.219512195
BP GO Terms Associated with Downregulated Genes
IDTermCountSizeNumIntNumTotalpvalueEnrichment ScoreFold EnrichmentGene Ratio
GO:0050896Response to stimulus196843332534,8635.9275 × 10−4443.227128392.4931899410.603076923
GO:0032502Developmental process146589632534,8632.6317 × 10−3231.579763882.6562978810.449230769
GO:0048856Anatomical structure development131528432534,8632.72826 × 10−2827.564113772.6594380710.403076923
GO:0023051Regulation of signaling100363332534,8634.72001 × 10−2423.326057392.952677380.307692308
GO:0010033Response to organic substance83257832534,8635.51134 × 10−2423.258742793.4536360920.255384615
GO:0048583Regulation of response to stimulus109425032534,8635.59901 × 10−2423.251888832.7511797290.335384615
GO:0010646Regulation of cell communication99363932534,8632.08179 × 10−2322.681562282.9183309020.304615385
GO:0007154Cell communication123535732534,8633.06338 × 10−2322.513798512.4630025420.378461538
GO:0023052Signaling119520032534,8633.14735 × 10−2221.502055142.4548502960.366153846
Table 7. The most significant BP GO terms associated with up- and downregulated genes in differentiated HPRT-deficient cells versus differentiated wild-type cells. Fisher’s exact test was used to estimate the statistical significance of enrichment of terms between the two groups. The p-value denotes the significance of GO term enrichment in the differentially expressed gene list. ID: GO ID. Term: Name of GO term. Count: Number of genes associated with the ID. Size: Number of background population genes associated with the term. Num Int: Total number of DE genes. Num Total: Total number of background population genes. p value: Fisher’s exact test. Enrichment Score: Enrichment Score value of the term, which equals (−log10(Pvalue)). Fold_Enrichment: Fold Enrichment value of the term, which equals (Count/Size)/(numInt/numTotal). GeneRatio: Gene Ratio value genes associated with the term, which equals (Count/numInt).
BP GO Terms Associated with Upregulated Genes
IDTermCountSizeNumIntNumTotalp ValueEnrichment ScoreFold EnrichmentGene Ratio
GO:0002181Cytoplasmic translation8212476337,5822.0816 × 10−108107.681597432.572231850.107470511
GO:0051171Regulation of nitrogen compound metabolic process307604676337,5821.2740 × 10−5857,894825112.5010684790.402359109
GO:0032502Developmental process284585176337,5823.48369 × 10−4948.457960122.3908018990.372214941
GO:0007275Multicellular organism development227398476337,5824.84291 × 10−4948.314893592.8064795220.29750983
GO:0048856Anatomical structure development260520176337,5821.55391 × 10−4645.808573712.4623049860.340760157
GO:0051252Regulation of RNA metabolic process213376176337,5823.35767 × 10−4544.47396152.789533750.279161206
GO:0048731System development204355676337,5826.62305 × 10−4443.178941712.8256851250.267365662
GO:0006355Regulation of DNA-templated transcription197339976337,5827.00027 × 10−4342.154885362.8547653170.25819135
GO:1903506Regulation of nucleic acid template transcription197340176337,5827.63059 × 10−4342,117441522.8530865370.25819134
BP GO Terms Associated with Downregulated Genes
IDTermCountSizeNumIntNumTotalpvalueEnrichment ScoreFold EnrichmentGene Ratio
GO:0050896Response to stimulus7328346126537,5826.4624 × 10−172171.1896042.6056859030.578656126
GO:0010033Response to organic substance3422712126537,5827.5572 × 10−108107.12164173.7465004020.270355731
GO:0048583Regulation of response to stimulus4224191126537,5821.3389 × 10−102101.87326722.9914665630.333596838
GO:0032502Developmental process4995851126537,5822.55294 × 10−9796.592959442.5337269460.394466403
GO:0002376Immune system process2932206126537,5821.58977 × 10−9695.798666733.9459490650.231620553
GO:0006952Defense response2341406126537,5823.95178 × 10−9695.403207434.9444717440.184980237
GO:0044419Biological process involved in

Interspecies interaction between

organisms
2431567126537,5823.00479 × 10−9392.522186064.6070894010.192094862
GO:0048856Anatomical structure development4585201126537,5823.04307 × 10−9291.516688552.6161822030.362055336
GO:0007154Cell communication4605246126537,5824.31433 × 10−9291.365086152.6050670640.363636364
Table 8. Significant nervous system-associated BP GO terms related to up- and downregulated genes in differentiated HPRT-deficient cells versus differentiated wild-type cells. Fisher’s exact test was used to estimate the statistical significance of enrichment of terms between the two groups. The p-value denotes the significance of GO term enrichment in the differentially expressed gene list. ID: GO ID. Term: Name of GO term. Count: Number of genes associated with the ID. Size: Number of background population genes associated with the term. Num Int: Total number of DE genes. Num Total: Total number of background population genes. p value: Fisher’s exact test. Enrichment Score: Enrichment Score value of the term, which equals (−log10(Pvalue)). Fold_Enrichment: Fold Enrichment value of the term, which equals (Count/Size)/(numInt/numTotal). GeneRatio: Gene Ratio value genes associated with the term, which equals (Count/numInt).
BP GO Terms Associated with Upregulated Genes
IDTermCountSizeNumIntNumTotalp ValueEnrichment ScoreFold EnrichmentGene Ratio
GO:0007399Nervous system development136221976337,5822.91618 × 10−3130.535185643.0188181780.178243775
GO:0022008Neurogenesis88125976337,5825.7406 × 10−2423.241042423.4428039480.115334207
GO:0048699Generation of neurons79109776337,5822.28169 × 10−2221.641744173.5471194520.103538663
GO:0030182Neuron differentiation76102776337,5823.00494 × 10−2221.522164293.645008110.099606815
GO:0007417Central nervous system development75109176337,5824.18264 × 10−2019.378549173.3860382760.098296199
GO:0007420Brain development6083276337,5823.11326 × 10−1716.506784523.5520843840.078636959
GO:0048666Neuron development5881376337,5821.74529 × 10−1615.758132153.5139275110.076015727
GO:0061564Axón development3738876337,5829.47529 × 10−1514.02340764.697051790.048492792
GO:0031175Neuron projection development4864876337,5821.87305 × 10−1413.727451423.6485607490.062909567
BP GO Terms Associated with Downregulated Genes
IDTermCountSizeNumIntNumTotalpvalueEnrichment ScoreFold EnrichmentGene Ratio
GO:0007399Nervous system development1732219126537,5822.83609 × 10−2524.547279572.3162112340.136758893
GO:0022008Neurogenesis1171259126537,5823.29975 × 10−2322.481519332.7608924830.092490119
GO:0030182Neuron differentiation901027126537,5821.80993 × 10−1615.742337312.6035230590.071146245
GO:0048699Generation of neurons931097126537,5824.41822 × 10−1615.354752992.5186376070.073517787
GO:0048666Neuron development75813126537,5824.53421 × 10−1514.343497972.7406910430.059288538
GO:1901214Regulation of neuron death42330126537,5821.76991 × 10−1312.752049033.7811570250.033201581
GO:0007610Behavior60611126537,5821.8082 × 10−1312.742753852.9174230030.04743083
GO:0031175Neuron projection development57648126537,5825.9181 × 10−1110.227817492.6132996630.045059289
GO:0051960Regulation of nervous system development45461126537,5822.32408 × 10−109.6337481222.900019720.035573123
Disclaimer/Publisher’s Note: The statements, opinions and data contained in all publications are solely those of the individual author(s) and contributor(s) and not of MDPI and/or the editor(s). MDPI and/or the editor(s) disclaim responsibility for any injury to people or property resulting from any ideas, methods, instructions or products referred to in the content.

